Article

Synergy Analysis of Knowledge Transfer for the Energy Sector within the Framework of Sustainable Development of the European Countries

by
Adriana Grigorescu
1,*,
Amalia-Elena Ion
1,
Cristina Lincaru
2 and
Speranta Pirciog
2
1
Department of Management, National University of Political Studies and Public Administration, 012104 Bucharest, Romania
2
National Scientific Research Institute for Labor and Social Protection, 010643 Bucharest, Romania
*
Author to whom correspondence should be addressed.
Energies 2022, 15(1), 276; https://doi.org/10.3390/en15010276
Submission received: 26 October 2021 / Revised: 4 December 2021 / Accepted: 22 December 2021 / Published: 31 December 2021

Abstract

:
The target for 2030 of reaching a 32% share of renewable energy in the gross final energy consumption can be achieved by speeding up the transformation pending the implementation of knowledge transfer (KT) policies that foster regional cooperation for the cost-effective development of renewables. The research purpose is the analysis of important factors in the development of the renewable energy sector through knowledge sharing and collaboration across the Member States in a comparable manner. The hypotheses are as follows: Hypothesis 1 (H1) there are synergies between knowledge transfer and economic impact through income and jobs for the renewable energy sector and Hypothesis 2 (H2) the EU countries have different profiles of synergy. The research proposition was established through the employment of a quantitative synergy and trade-offs analysis based on the knowledge transfer indicators and the sustainable development framework. The research method, namely the advanced sustainability analysis (ASA), uses the quantitative assessment tool for the understanding of synergies between two or three dimensions of sustainable development, presuming that the combined effect of the factors is greater than the sum of their individual effects. The current research comprises an evaluation of the renewable energy sector knowledge transfer policy models at the national level for 24 EU countries and four other European states, focusing on the capabilities to create synergies. The results of the study represent a valuable input for the policy makers, allowing for a coherent and sustainable planning and programming of the new electricity market, adopted through the Clean Energy Package, and following a highly dynamic and radically disruptive background, exploiting the ‘successful’ profiles.

1. Introduction

The new strategic framework radically changes the energy sector, including the renewable energy subsector. DG Energy [1] has announced the new business model of the energy sector where the renewable energy is completely integrated and where all the energetic systems are harmonized toward the production of affordable energy.
The Clean Energy Package represents the cost-effective way in which the EU ensures the supply of affordable and secure electricity to its citizens by transforming the market in the direction of generating high shares of renewable electricity production.
The new European strategy for the energy sector is radically changing through the digital transformation and the green transformation. The latter refers to the Paris Agenda from 2015, which comprises a new system of economic and social transformation based on science, technology development, and knowledge transfer. As a result, the European objective is that of a climate-neutral economy by 2050.
The digital transformation refers to the knowledge management of the 2020–2024 strategic plans for the energy sector, which comprises sustainable principles and digital technology adherence. The ultimate scope of the plan is that of continuous scientific research and innovation, integration of renewable, energy-efficient systems, flexibility of data exchange, and governance.
Considering the tremendous amount of information produced on the market today, it is rather strategically appropriate to formulate responses from the industry that accompany the perspective of development and evolution within the context of complex and dynamic movements from the Information and Communication Technologies (ICT) sector. The information and knowledge barriers on the market are determined by the lack of connectivity and broad understanding of mechanisms and functions within the economic and policy decision-making processes. The strategic direction of setting up a system for knowledge exchange and transfer would propose the development of innovation clusters specific to regions and industries. Those clusters have the scope of bridging the network between human resources, information, and knowledge resources [2]. Moreover, this collaborative cluster, as a basic means for shared innovation results, is meant to coordinate the relationships established between partners, providing a driving force for further growth and an efficient response to knowledge flow, application, and perception.
Furthermore, the human activity on planet Earth has been pivotal in the transformation of ecosystems and climate dynamics, pinpointing necessary alterations in environmental responses and energy usage strategies. From a political standpoint, it is fundamental to acknowledge the immense perseverance of decision-makers toward establishing a framework for energy consumption and population growth, hence the climate mitigations that took central stage in the discussions held during the last decade [3]. The establishment of synergies between the innovation and technology and the renewable energy systems represent the catalyst for performance, as their combined force outvalues the individually accounted influences but only at the confluence with knowledge exchange and knowledge transfer (KT) processes.
In view of the European sustainable development goals (SDGs), the member states must abide by the coercive constructs imposed by policy while focusing on the achievement of targets within certain timeframes as proposed by the decision-makers [3]. Therefore, the synergy of the knowledge transfer and renewable energy consumption is observed and analyzed through the lenses of four SDGs, namely SDG 9, SDG 7, SDG 4, and SDG 8, which are prioritized on importance within the study.
Based on the comprehensive analysis of the research in the field, it was established that the study on synergies of knowledge transfer and renewable energy are limited in scope and formulation. Therefore, the current study is meant to evaluate the renewable energy sector KT policy models at the national level for 24 EU countries and four other European countries in terms of capabilities to create synergies based on income and job-related indicators. The latter are part of the EU sustainability planning framework. The EU has set a target for 2030, which states that the level of share of renewable energy in the gross final energy consumption has to indicate 32 percentage points, which is a goal that is hard to realize unless the KT speed is maintained by at least two-thirds of the EU Member States. As a result, the KT policies have to fill in the gap between knowledge sharing in view to foster regional cooperation for the cost-effective development of renewable energy sources. The research compares the KT policy models based on inputs, impact, and selected best practices. Moreover, the current research is meant to project on the connections supported by formal and informal training, education attainment and employment within the energy industry, environmental impact in terms of policy development (air emissions), and economic growth (wealth—GDP/person) while contributing to the understanding of country effects across the European area. The research proposition was established through the employment of a quantitative synergy and trade-offs analysis based on the knowledge transfer indicators and the sustainable development framework. The research method, namely the advanced sustainability analysis (ASA), uses the quantitative assessment tool for the understanding of synergies between two or three dimensions of sustainable development, presuming that the combined effect of the factors is greater than the sum of their individual effects. The results of the study represent a valuable input for the policy makers engaged in coherent sustainable planning and programming for the new energy market, in light of the Clean Energy Package, and the highly dynamic and volatile energy sector background.
The identified problem here resides in the lack of regional cooperation for the cost-effective development of renewable energy sources, as most Member States have registered low performance regarding the achievement of the 2030 goal. For instance, only seven Member States have managed to achieve the target, namely Sweden, Denmark, Finland, Latvia, Estonia, Portugal, and Austria, at an average level of 19%. Sweden is the uncontested leader, with a 56% accomplishment level, while the Netherlands presents the worst result at 7.9%. Considering the hypothesis that the growth trends will continue to develop based on the same pattern identified above, the seven Member States will be joined by other countries such as Lithuania, Croatia, and Bulgaria at an average completion rate of 27%. The three challengers will be Romania, Greece, and Italy, having the best chances of arriving at forecasted levels of up to 30%, while all the other unmentioned Member States are attributed to the group of non-performers with the lowest results and an unaccomplished target. Moreover, it is important to mention the Netherlands and Luxembourg, as those two countries will have the perspective of significantly increasing their share of renewable energy consumption in the final consumption.
According to Guimon [4], the major challenge for KT policies is the impact on the economy: mainly incomes and jobs. The international markets and co-creation look to be more attractive than the patterns generating. This leads us to the idea that at the national level, there are different profiles.
The research question is: What are the performances of the KT policy systems at the national level of European countries for the renewable energy sector in terms of synergies with income and jobs in a sustainability planning framework?
The hypotheses are as follows:
Hypothesis 1 (H1).
There are synergies between knowledge transfer (KT) and economic impact through income and jobs for the renewable energy sector.
Hypothesis 2 (H2).
The EU countries have different profiles of synergy.The different profiles determine specific market behaviors and offer alternatives of sustainable development of the sector players.
The research hypothesis in this case is based on the performance capacity of KT policy systems at the national level across the European countries in relation to the renewable energy sector. The performance is calculated in relation to the potential synergies with income and job creation within the sustainability planning framework.
The scope of the research is that of underlining the successful EU countries that create KTs with the capacity to generate income and jobs in comparison with spin-offs and patents on a competitive renewable energy sector driven by innovation. The central direction is given by the Renewable Energy Directive, having the potential to generate reference models for the transition to such systems across all European countries.
The research purpose is the analysis of important factors in the development of the renewable energy sector through knowledge sharing and collaboration across the Member States in a comparable manner.
The originality of this paper is given by the valuable insight created for policy makers in relation to synergies that pertain to the renewable energy sector, in the context of the Clean Energy Package, the Renewable Energy Directive, and the Sustainable Development Goals.
The paper structure includes a literature review of the knowledge and KT approaches, with references to the energy sector, the methodology framework, results with the bi and tri-dimensional synergies, discussion about the countries’ profiles and the multicriterial KT typologies, and the conclusion highlighting the findings and achievements of the study.

2. Literature Review

The following section will cover the perspectives so far disclosed by various researches. Knowledge, as defined by Davenport and Prusak [5], refers to the combined framework comprising of information, expertise, experience, and values used for the evaluation and incorporation of new experiences and information. At an organizational level, knowledge can take the form of documentation but also of processes, mechanisms, routines, practices, and norms, as knowledge is classified as explicit, implicit, and tacit. Consequently, knowledge has been viewed as distinct from data and information and more complete when interpreted as a competence and capacity to act [6]. Basically, knowledge forms only when an entity attributes meaning to a concept, belief, statement, process, application, etc. Subsequently, the knowledge transfer can only take place when an entity starts to experience the effects of the knowledge gathered and interpreted by other entities [7].
Knowledge transfer (KT) has become recently a topic of high interest in academic research and has quickly spread in terms of relevance as an incentive to the boosted organizational and business performance, and as a competitive advantage for enterprises, especially at the confluence with the knowledge economy. Since KT majorly influences the innovation processes, the unhindered organizational communication flow between enterprises, sectors, and industries represents the derived form of target knowledge sharing, which, in turn, is the determinant of long-term success, value creation, and performance. Historically, the advancements within the business sector have intrinsically been related to the adoption of knowledge and to the identification of the role of knowledge, translating the new information in frameworks for modern enterprises, consisting of conditions, factors, and contexts for the reoccurrence of knowledge transfer. The latter has been fundamentally linked to a wide range of constructs, including patenting on academic performance, cultural intelligence in KT, dimensions of knowledge-intensive business services, innovation, knowledge dissemination, relational capital, as well as network rents and the entrepreneurial role for KT processes in start-up enterprises.
In 2019, De Luca and Cano Rubio [8] have created the theoretical model for KT process evaluation based on the knowledge transfer curve, focusing on the speed for knowledge transfer and not necessarily on the proposed knowledge context. They have found out that the capacity of an enterprise for long-term competitiveness is somewhat linked to the attributed role of KT in that given enterprise. Moreover, the authors pointed out that the efficiency of KT is maximized through the dimensions of knowledge, such as complexity, as well as the quality and quantity of information available for transfer. Furthermore, Milagres and Bucharth [9] assessed the factors influencing knowledge transfer, identifying the following: policy, inter-organizational synergy, intangible resources, behaviors, motivations, and capabilities, among others. One interesting aspect mentioned by the authors has been somewhere along the lines of environmental development based on the learning patterns of enterprise partnerships. From the perspective of cultural intelligence, Vlajcic et al. [10] showed that the geographical distancing of enterprises is consistent with the influence on the KT process performance. Other authors have also demonstrated that KT flows differently in relation to various stakeholders and is intrinsically related to the degree of innovation creation and adoption [11], that policy makers would benefit from the understanding the KT dynamics [12], that relational capital supports the knowledge transfer process [13], and that the role of entrepreneurship is interconnected to the performance of the KT process in SMEs [14].
In essence, the future of KT is directed toward organizational performance, innovation, promotion of knowledge-intensive business processes, at the precipice of the Internet of Things—especially considering the vision of communication, energy, and logistics internet [15], Artificial Intelligence, Big Data, Industry 4.0, as well as environmental simulations and digital integrations [16,17,18].
Consistently, the global knowledge economy sustains an innovation process that demands learning and skill development, which underlines the need for a new conceptual framework of restructuring the value chains in a standardized and fragmented process to suit the needs of corporations. This is only possible through the input from human knowledge, and it is based on innovations, routinized work, and upskilling. Different authors [19] assessed the impact of the ICT sector on the skills and knowledge available in the sector, underlining the fact that those technologies managed to create movement between tacit and codified knowledge.
Blohm [20] proposed a framework for the transition to a sustainable and carbon-neutral economy considering among the others knowledge as one of the 11 categories to be used for the urgent transformation and to overcome the barriers. At the same time, Zhou, Pan, and Urban [21] developed a cluster model to identify the presence of the knowledge, explicit and tacit, about the wind and solar photovoltaic industries in China at the international level. The connection with the international knowledge flow is considered as a significant indicator of the sustainable development pathway under the clean and renewable energy. The importance of knowledge is pointed out by Apostolopoulos et al. [22] through the expert knowledge broker role in decision making in regard to renewable energy.
The contribution of this study is that of performing an analysis on the KT policies under the new conceptual framework of the global knowledge economy, forwarding tacit versus explicit knowledge mechanisms. The terminology used for the study is given by Chini [23] as follows: explicit knowledge as objective, rational, sequential, digital; and tacit knowledge as subjective, experimental, simultaneous, and analogue. The dichotomist model is useful in the sense that it highlights the explicit knowledge dependent on the new technology while using it in an individualized, creative manner. In the case portraited by this study, the EU renewable energy policy development supports the early adoption of new technology, at a large scale, while considering and tackling the learning curve and process and closing the circle through the KT and tacit knowledge usage. Based on this logic, the authors utilize for the synergy and trade-off models the proportion of renewable energy and that of the KT components—explicit (Researchers: X1, X2, X3; Patents: X4, X5, X6, X7, X8, X9, X10, X11) and tacit knowledge (X12, X13) together with the economic, social, and environmental impact of KT policies (X14, X15, X16, X17), as presented in Table 1. There are a large number of variables to cover as many of the components of KT as possible that are contributing to synergies calculated by permutations.
Most models that aim to highlight the synergies and trade-offs between the factors influencing ecosystems are qualitative due to the difficulty of quantifying and evaluating them, being mainly analyzed through their existence and possibly their relative strength.
Sustainable development (SD) has been analyzed, from this perspective, to highlight synergies between its components or between them and other components of socio-economic ecosystems [24,25,26]. Luukkanen et al. [27] perform a quantitative analysis showing whether or not there is synergy between the various components of SD and whether this link is positive or negative. Starting from this framework, Mainali et al. [28], in turn, develop a model on certain components of sustainable development: energy, clean water, sanitation, food security, sustainable agriculture, and poverty. Banerjeeet al. [29] address the synergies between the same components using an Integrated Economic–Environmental Modeling, trying to show how they can be evaluated and recorded using the System of Environmental–Economic Accounting. Issues related to synergies between energy and climate change were studied by Halsnæs and Garg [30].
However, when the components of SD are studied, the difficulty of their quantification and the lack of data allow only a conceptual, qualitative, and sporadically quantitative approach. Thus, Zhao et al. [31] proposed an empirical framework for evaluating SDG synergies and trade-offs. To provide a quantitative dimension, quantitative tools such as correlation coefficients [32] or structured focus groups and questionnaires [33] were also used. To assess the synergies between agriculture and forestry and to restructure ecosystem service supply and conserve biodiversity, Kearney et al. [34] created composite indices. Data mining [35], ANOVA (Environmental Systems Research Institute, Inc. (ESRI), New York, USA) [36], or GIS (SPSS Inc., Chicago, USA) [37] methods could be applied when the analyzed synergies targeted components that can be measured and for which there are data available. SD was studied in relation with knowledge and intellectual capital using the knowledge city index and sustainable city index [38,39].
A simple but consistent approach to what we are looking at in this study is in line with the study by Pace et al. [40], which analyzed whether two policy interventions carried out together have a greater effect than if they are carried out separately. Using the multi-valence of agricultural production to provide food and other products, on the one hand, and the contribution to reduce emissions and carbon dioxide, on the other hand, McCarthy et al. [41] evaluate the synergy between the two components to determine the actions that can contribute to their development, having a predominantly qualitative approach.
The renewable energy sector has a strategic and high priority position, and it is linked to the importance of the tacit knowledge connections. The Renewable Energy Directive is meant to transform the energy sector, through science and innovation, based on the KT policies (tacit and explicit knowledge). The paper’s model proposes an explicit knowledge flux characterized by the variables X1, X2, X3, X4, X5, X6, X7, X8, X9, X10, and X11. The components of the tacit knowledge become part of the KT policies, although they are not clearly associated under this context. The renewable energy directive discusses the need to foster and support the development of regional measures for KT in the energy sector through technical assistance and training programs, and it establishes a common framework for the promotion of energy from renewable sources and for the regional cooperation between Member States on administrative procedures and information and training. Moreover, the certification schemes and any equivalent qualification scheme represent some of the means that lay out the framework and establish the foundation for the development of suitable information in the sector, awareness, and guidance for citizens. In rapport with the latter, the Clean Energy Package is boosting the consumer empowerment and aiding the program for transition to renewable energy sources, accelerating the development of energy communities through KT and regional cooperation. Ultimately, the European Commission envisions a cost-effective solution based on cross-border projects in the field of renewable energy sources, including also regular communications through various channels, such as newsletters. Moreover, the plan includes also a human resources (HR) corporate strategy for the active energy companies with the ultimate scope of talent management, learning and developing, diversity and inclusion, as well as synergies and high-efficiency systems. The renewable energy sector is relevant for the cohesion policy through its social potential of job creation and spatial disparity reduction.

3. Methodology Framework

3.1. General Context

The research has been created around the general scope of renewable energy and knowledge transfer synergies across the European countries, considering the UN sustainable development goals as the main framework for analysis. In Science Industry Knowledge Transfer (SIKT), the innovation exploitation occurs in a traceable, explicit state or a tacit, qualitative manner. The first situation is experienced when knowledge is easy to understand and the transfer of knowledge is realized in a quantitative way through formal channels, and it can take the form of collaborative research, intellectual property, research mobility, and labor mobility. The second scenario is that which transfers knowledge through the intuition, values, and experience of individuals, and it takes the form of research publications, conferences, training, networking, etc. Therefore, explicit knowledge is objective—knowledge of rationality, sequential knowledge, and digital knowledge, and tacit knowledge is subjective—knowledge of experience, simultaneous knowledge, and analogue knowledge. Moreover, there is an established link between different types of knowledge, which portrays the dynamics that occur from collaboration to combination, namely through the individual knowledge, collective knowledge, and organizational knowledge.
The main interest of the paper is the evaluation of the renewable energy sector’s KT policy models at a national level, and it comprises the capabilities of knowledge transfers to create synergies in relation to income and job generation based on the renewable energy and sustainability planning framework.
By considering the impact of those synergies, the research reflects on the enhancement of the socio-economic perspective of science on intellectual property, jobs, and income generation, as well as on the development of industry innovation due to research and science–industry interactions. In order for technology absorption to occur, cross-sector knowledge transfer is initiated, especially in the renewable energy environment, where market potential is achievable [42]. There are certain elements that become visible when the cooperation for KT fulfills a market need for development, and those are the connectivity between different partners, their established collaborations, and the awareness of creation. The downside here lies with the fact that public policies revolving around knowledge transfer are marginally affecting the projections of technology transfer with substantial impact on socio-economic dimensions. At this point, the only purpose of the policy makers is to focus on the scaling of the projects that seem promising, while discussing the international market development.
The purpose of this study resides in the identification and analysis of important factors in the development of the renewable energy sector through knowledge sharing and collaboration across the Member States in a comparable manner. The base of the concept is the KT effectiveness proposed by Chini [23] for corporations (see Figure 1). Moreover, aspects referring to the cross-sector knowledge transfer such as diversification initiatives are included in the methodological framework of the study.
The measurement framework utilized in the study is based on the SDG objectives and targets. “According to the literature review a comprehensive model of cross-cultural knowledge transfer within multinational corporations (MNCs) that can serve as a basis for a more systematic empirical work seems to be missing. To respond to this need, a conceptual model of the knowledge transfer process across geographically dispersed units of MNCs is developed. As strategy, organizational structure and functions differ across MNCs, it is suggested that no single best way of transferring knowledge exists. On the contrary, the model proposes that the transfer of knowledge has to correspond to the strategic network position of the organizational unit as well as to the unit’s internal capabilities to manage knowledge.“ (p. 58) [23].
Moreover, considering the model of knowledge transfer at the multinational corporation level (Figure 2), the focus is on exploiting and implementing the headquarter’s knowledge in local contexts [7]. The country profiles will be classified based on the mentioned categories using the KT inflows and out flows.

3.2. Data

Considering that the data included in the study have been paralleled to the United Nation sustainable development goals, the following section is meant to give more insight into that information. The knowledge transfer process has been profiled based on the measure of progress in the framework of sustainable development based on indicators specific to formal and informal knowledge transfer characteristics and channels.
The variables included in the study are listed in Table 2 below.
The model used Eurostat statistical data [43] included in the Monitoring Report on Progress towards the SDGs in an EU Context: 2021 (SDG_04_60, SDG_07_40, SDG_08_30, SDG_08_10, SDG_09_70) to assure the compatibility with the renewable energy sector and the sustainability framework.
The first indicator, namely ‘share of renewable energy in gross final energy consumption by sector’, has an annual frequency and represents the share of energy sources in electricity. It measures the share of renewable energy consumption in the gross final energy consumption based on the Renewable Energy Directive. Eurostat defines the gross final energy consumption as the energy that is utilized by the end-consumer alongside any grid losses and self-consumption of power plants. This indicator is linked to the knowledge transfer outcome in Green Energy, with the industrial sector as the receiver of the KT. This indicator is also used as the basis for the KT results and for the synergies established within the research by testing it in parallel to the following indicator categories: R&D and innovation, Patent applications and grants to the European Patent Office, Adult learning/Adult participation in learning, Employment rate, Sustainable economic growth, and Sustainable industry. Each category contained at least one indicator, as explained below.
The R&D and innovation group comprises internal researchers personnel (energy)—referring to all full-time research personnel employed in electricity, gas, steam, and air conditioning supply, water collection, treatment, and supply sectors; R&D personnel in business—referring to all full-time employees in business enterprise research and development; R&D personnel in electric industry—referring to full-time employees in electricity, gas, steam, and air conditioning supply, water collection, treatment, and supply sectors. The category is linked to the formal knowledge transfer channel as part of SDG 9.
The Patent applications and grants to the European Patents Office (EPO) category comprises eight indicators, referring to both grants and applications overall, as well as specifically for the energy industry, which is based on a formal KT channel and linked to SDG 9. These indicators account for the total number, country reference, and technology.
The Adult learning category comprises two indicators—total training and adults trained for the electrical industry. The former refers to the share of people aged 25 to 64 who acknowledged their formal or non-formal education and training, covering both vocational and general learning activities. This indicator is based on an informal, tacit KT channel. The second indicator—share of adults with at least basic digital skills—includes the share of people formally trained for performing activities within the energy sector, as the KT transfer occurs via a formal, explicit channel, and it is linked to SDG 8.
The Employment rate category comprises the general employment rate and the employment rate in the energy sector, dividing the population into persons employed in active enterprises in industry, construction, and services except for the insurance activities of holding companies and persons employed in active enterprises in electricity, gas, steam, and air conditioning supply. The impact of these indicators is measured in terms of the KT policy effect on the job availability (SDG 8).
The Sustainable economic growth category comprises the Real GDP per capita indicator, which is calculated as the ratio of the real GDP to the average population of a specific year, by measuring the total final output of goods and services produced by an economy as a proxy for the development of a country’s material living standards. It pertains to this study through its connectivity to the KT economic policies that impact the population of a country in terms of increasing income (SDG 8).
The Sustainable industry category comprises the air emissions intensity of industry, which measures the impact KT environment policies have in terms of greening the economy (SDG 9). This indicator measures the intensity of emissions of fine particulate matter (PM2.5) from the manufacturing sector by including the air pollutants and greenhouse gases.
Each indicator and indicator category has been linked to an SDG objective, as mentioned in Table 2. The knowledge transfer synergies in energy are analyzed in connection with the SDGs, accounting for the latter’s importance to the study. The selected SDGs for this research are listed in Table 3.

3.3. Research Method

Generally, sustainability planning has a multi-dimensional approach that integrates different organizations in order to formulate a coherent scope with the usage of various thematic fields and potential synergies while avoiding any trade-offs. This means that especially for policy makers, having reliable knowledge regarding trend synergies represents the starting point of the planning and programming. As a result, a new methodology has been developed in the field of quantitative synergy measurement for the better approach to the planning of policy. Moreover, this tool is used to compare countries based on their specific policies while assessing the results based on potential synergies and trade-offs across different trends. Therefore, the analysis can only point to the status of a trend and cannot fully support a causal explanation of the latter. The results of this research are highly case specific, every case must be analyzed separately, and the comparative analysis between countries is possible based on the policy evaluation tool. The latter can simultaneously analyze various sustainability development dimensions and underline whether the policies have determined synergies. The measurement of synergies is rather straightforward: the closer the synergy factor is to 1, the stronger the effect between the variables can potentially grow, and the closer the ratio is to 1, the stronger the potential for a trade-off. If the synergy factor is close to 0, there is a declining between trends. This analysis cannot interpret the results and categorize them as good or bad.
Synergy occurs whenever two participants are combining their efforts by working together while being aware of the main objective and modus operandi of each other during the operational stage of an activity. The activity or the task itself is performed by considering the effort of each party involved. The magnitude of the task will determine the measurement of each individual element’s contribution to the creation of a synergy. Therefore, for a task of magnitude 10 units, considering sector A of the economy in synergy with sector B of the economy, the following situations can occur: when sector A can move over three units, sector B is pushed seven units, and vice versa. Moreover, if sector A can move over nine units, sector B will cover the remaining one unit. In effect, the introduction of an error to the system on behalf of one element of the system will be corrected by the other elements of the system (error compensation), so that the system arrives again at an equilibrium. Among the characteristics of synergies are the following elements: the existence of a system performing based on individual elements’ task force, the existence of a general scope or purpose of the system that drives the individual elements to perform an action, the coordinated actions of the system’s elements, and the effect of each elements’ action at each moment in time (what element 1 does at a particular moment in time, what the other elements do at the same time, and the status of the general objective). It is clear to assess that the world economy does not prove to be a perfect synergy from a wide range of perspectives. Nevertheless, this study is meant to isolate certain elements of the economy based on a common ground—knowledge transfer—in order to understand the capacity of each EU country to achieve a synergy between the knowledge transfer and the renewable energy sector.
Consequently, the synergy must be built, from a mathematical perspective, on three pillars, namely sharing, error compensation, and task-dependence. Those three pillars are, to some extent, achievable through the introduction of the Sustainable Development Goals framework, with the latter being the task-dependence, where we can observe the sharing and error compensation phenomena. Moreover, the method employed to quantify the synergies and trade-offs between the knowledge transfer indicators for the energy sector based on the SDGs is the so-called Advanced Sustainability Analysis (ASA). Different researchers [27,28,46] have worked on the development of the framework for synergy and trade-off between two or three dimensions of sustainable development. Luukkanen et al. [27] define synergy as the situation in which the combined effect of two factors is greater or smaller than the sum of their separate effect.
The relationships established between the two variables are explained by the equations below.
z = ax + by + cxy + d
where
z—the output, the effect of the action of x, y, and the combined effect;
x, y—input/factors/variables;
a—the effect of x factor acting alone on z;
b—the effect of y factor acting alone on z;
c—the synergy of the inputs x and y, determined by the component cxy, the coefficient of both inputs.
d—the effect of either single input on the output.
The synergy can be positive, negative, or zero.
Δz = aΔx + bΔy + cΔxΔy
v′i = vi/vb∗100
v′i—the normalized value of vi, from 1 to 100; where v is any of the input variable x, y at different time initial (0), or final (1) normalized at the value at the base year b.
The measurement of the synergy as a ratio of the area ABEF to the maximum area ABCD, exposing the scenario in which Δx > Δy, and Δymax = Δx.
S = A A B E F A A B C D = Δ x Δ y Δ x Δ y max = Δ x Δ y Δ x Δ x = Δ y Δ x | Δ x > Δ y
where A is the area:
Δ x = x 1 x 0
Δ y = y 1 y 0 .
The potential synergy (s) can be measured as the ratio of the area of the real change (ΔxΔy) to the area of the maximum change (ΔxΔy1), where Δx = Δy1. Therefore, the potential synergy is expressed as the slope of the line AB, i.e., as the ratio of Δy/Δx [28].
s xy = Δ x Δ y | Δ y > Δ x
s yx = Δ y Δ x | Δ x > Δ y
where s ∈[−1: +1].
The synergy ranges from the minimum −1 to the maximum 1 if Δx = Δy, with the sign accordingly. As mentioned before, the negative sign indicates that the synergy is negative. This type of synergy is also called trade-off. The calculation of the trade-off does not imply a causal relationship between the involved variables, but it is only indicative of a possible or potential causality between the variables.
The current research has also proposed a measurement of the synergy between three variables, as explained by Figure 3 below. Here, the measurement of the synergy is calculated as the ratio of the area of the cube A′B′C′D′E′F′G′ to the maximum cube area ABCDEFG. This is valid for the scenario in which Δx is maximum from (Δx Δy Δz), and Δymax = Δx & Δzmax = Δx, where the changes in x, y, and z would be equal.
S yzx = V A B C D E F G V ABCDEFG = Δ x Δ y Δ z Δ x Δ y max Δ z max = Δ x Δ y Δ z Δ x Δ x Δ x = Δ y Δ z Δ x Δ x = s yx s zx
In this three-dimensional scenario, the sign of the synergy indicator is correlated to the signs of the pairwise comparisons. Therefore, if all the pairwise synergies have the same sign, either positive or negative, the three-dimensional synergy is positive. In case of different sign pairwise synergies, the three-dimensional synergy will become negative.

4. Results

The data used for this study were obtained from Eurostat, and the tested period for all indicators has been 2010–2017. The research included the following countries: Austria (AT), Belgium (BE), Czech Republic (CZ), Denmark (DK), Estonia (EE), Finland (FI), France (FR), Germany (DE), Greece (EL), Hungary (HU), Iceland (IS), Ireland (IE), Italy (IT), Latvia (LV), Lithuania (LT), Luxembourg (LU), Netherlands (NL), Norway (NO), Poland (PL), Portugal (PT), Romania (RO), Slovakia (SK), Slovenia (SI), Spain (ES), Sweden (SE), Switzerland (CH), Turkey (TR), and the United Kingdom (UK). The normalized indicators’ change during 2010–2017 is visible in Table 4 and Table 5, below.

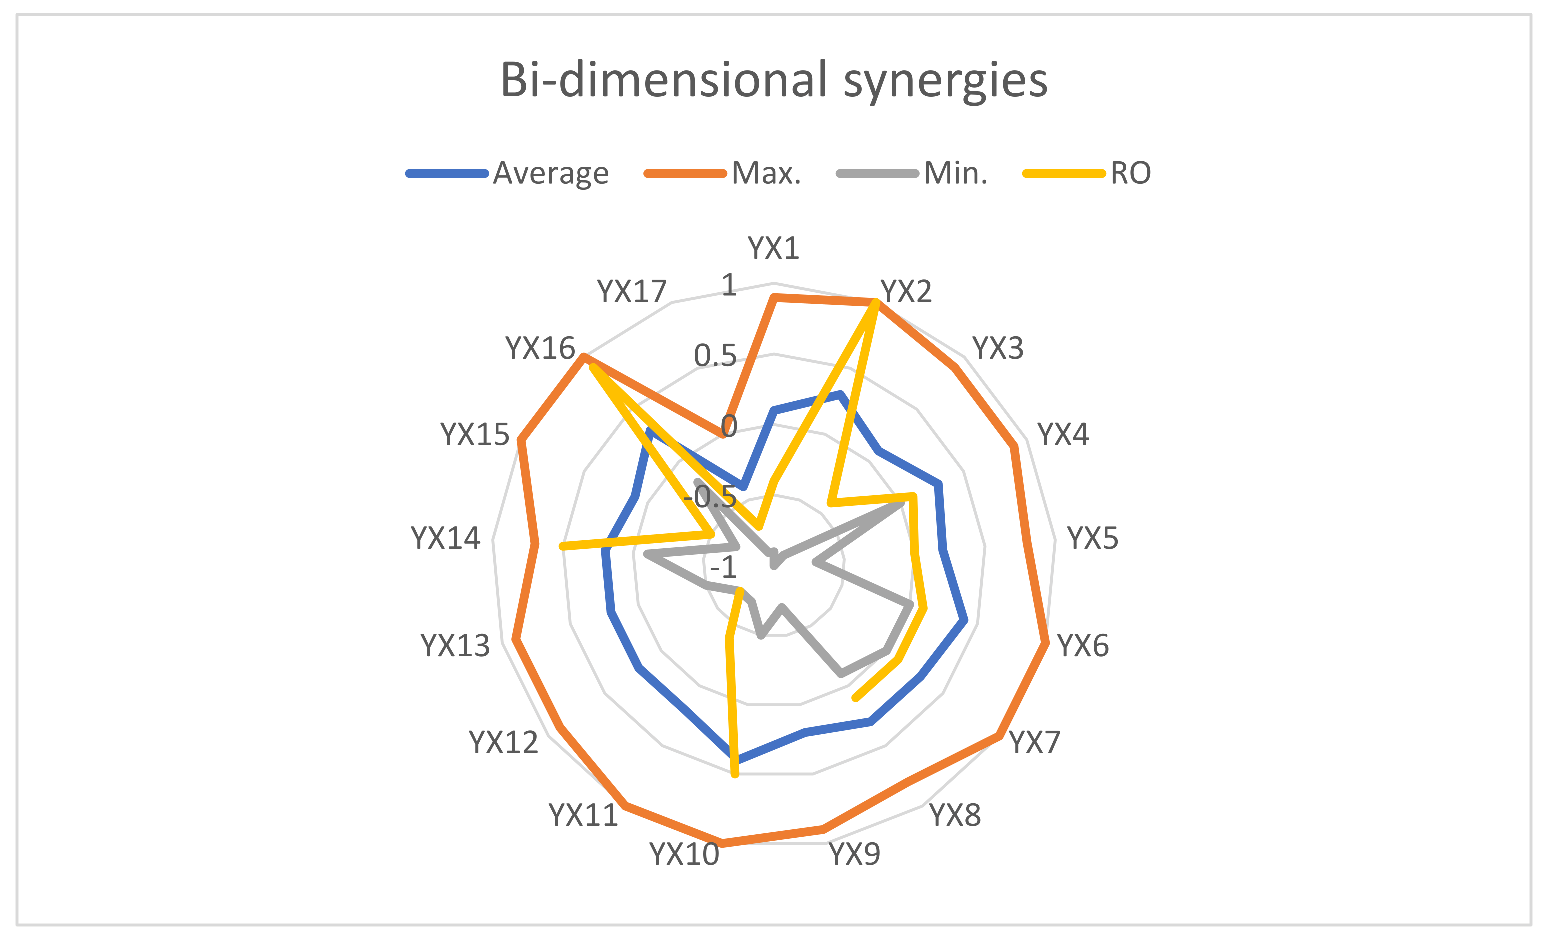
4.1. Bi-Dimensional Synergies

The first stage of the analysis has been created around the testing for bi-dimensional synergies between renewable energy share in the final consumption (Y) and all the other variables in the study. The results of the testing are listed in Table 5 and Figure 4.
The calculations for the bi-dimensional synergies have ranged from −1 to 1, showcasing perfect synergies between the share of renewable energy in gross final energy consumption by sector and indicators from the following categories: R&D and innovation, Patents grants and applications, Employment rate, and Sustainable economic growth, indicating that there is a significant progress in the realization of SDG 8 and SDG 9 across certain countries included in the study. The cases of trade-offs have been observed in the following indicators’ categories: R&D and innovation, Patents grants and applications, Adult participation in learning, Employment rate, and Sustainable industry, supporting the observation that only moderate progress or movement away from the target has been registered in case of SDGs 4, 8, and 9 for certain countries included in the study.
The average calculations for bi-dimensional synergies showed the following results (Table 6).
Based on the above listed results, it can be interpreted that the European model is partially successful in a unilateral dimension. Although the growth of the share of renewable energy consumption simultaneously creates a synergy with the environment and a trade-off with the air emissions, it does not have the same impact on the employment. The latter is completely independent from the share of renewable energy consumption. This appears to happen due to the KT in the sector, as the knowledge creation in this sector is quite low. Moreover, the growth of the share of renewable energy consumption is independent from the R&D and CD personnel in the electric industry. The main knowledge transfer source is trans-sectorial, as the knowledge creation in the energy sector is low and it is not adopted, utilized, and exploited through tacit knowledge mechanisms.
In Romania’s case, it is observed that a perfect synergy appears between the share of renewable energy in the final consumption and the R&D active personnel in the business sector. An almost perfect synergy is visible between the renewable energy and income. A positive aspect has been registered with the trade-off effect of −0.7 on the drop of air emissions. An unwanted effect was that of employment release through the introduction of new technologies. The growth of the share of renewable energy consumption does not determine, in the case of Romania, a synergy with the employment, as the registered result was −0.5. The Romanian KT model is not functional, and the country can be included in the local innovator category (Figure 2), where both knowledge flows are low. Moreover, the model has visible trade-offs between the renewable energy consumption and the other variables as follows: Total training at −0.7, Energy employment at −0.5, Patent granted by applicant’s country for the electricity USEPO at −0.4, R&D personnel in electric industry at −0.4, and Researchers in the electric sector at −0.4.
The analysis indicates that there is a stringent need for the reformulation of KT policy in Romania that must connect with the new strategic reality. The performance with the synergy and growth of renewable energy consumption is visible in the multinationals’ scoring. However, in the Romanian energy sector, there is a huge need for harmonization with the R&D system.

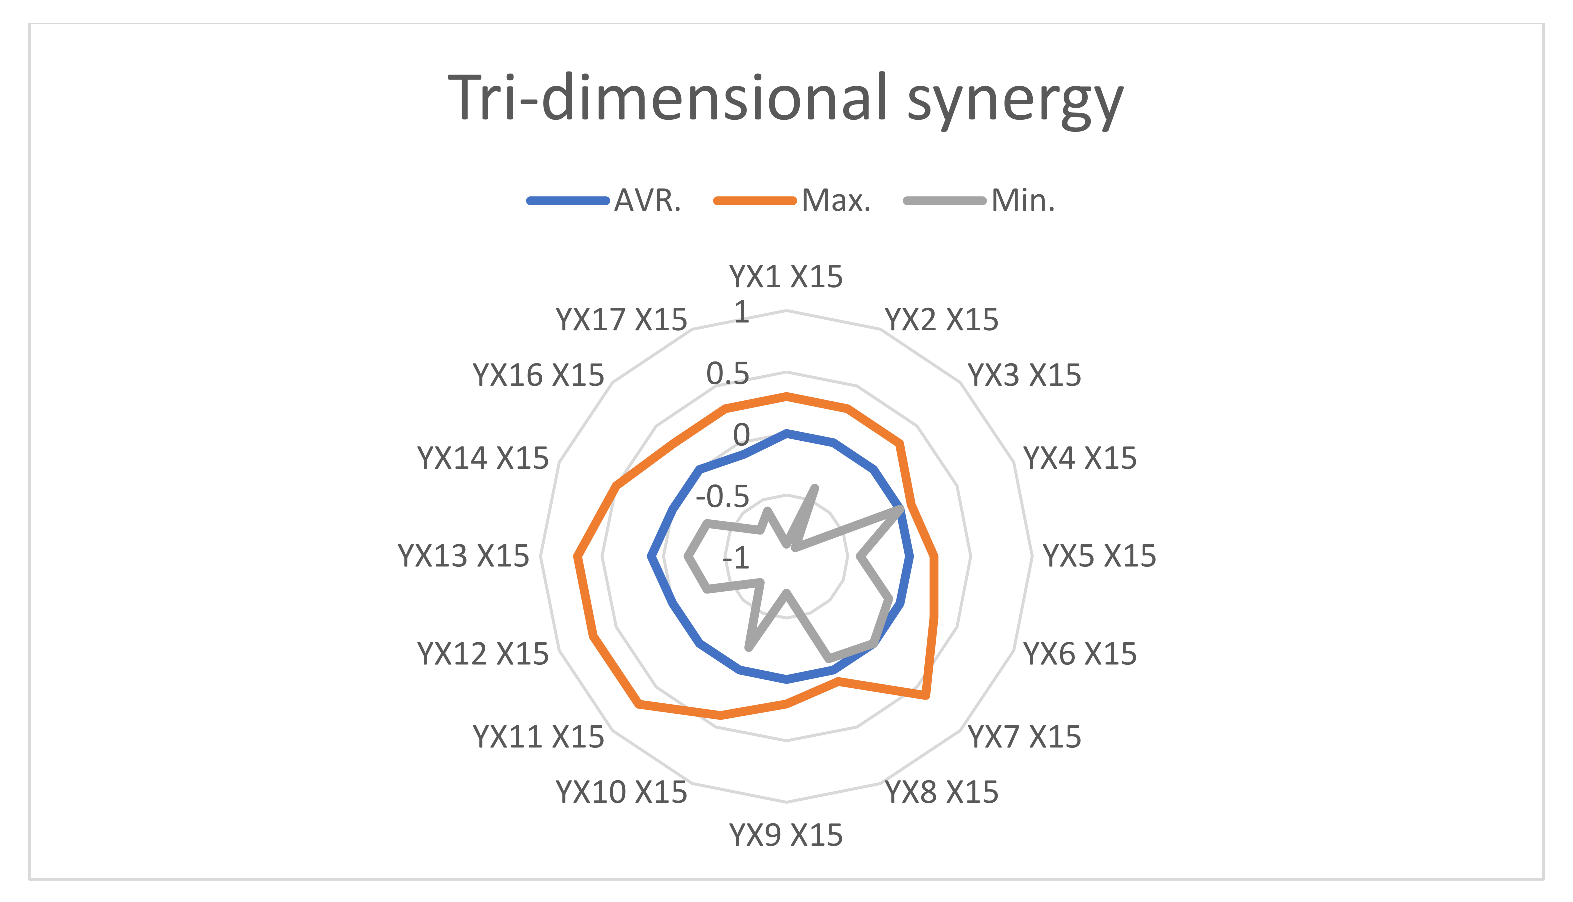
4.2. Tri-Dimensional Synergies

At this point, the research manages to analyze the three different dimensions of sustainable development simultaneously and understand whether the applied policies have determined synergetic development.
The second stage of the analysis has been created around the testing for tri-dimensional synergies between renewable energy shares in the final consumption (Y), one of the following indicators: X12/X13/X3/X15/X17/X16, and all the other variables in the study. The results of the testing are listed in Table 7, Table 8, Table 9, Table 10, Table 11 and Table 12, respectively.

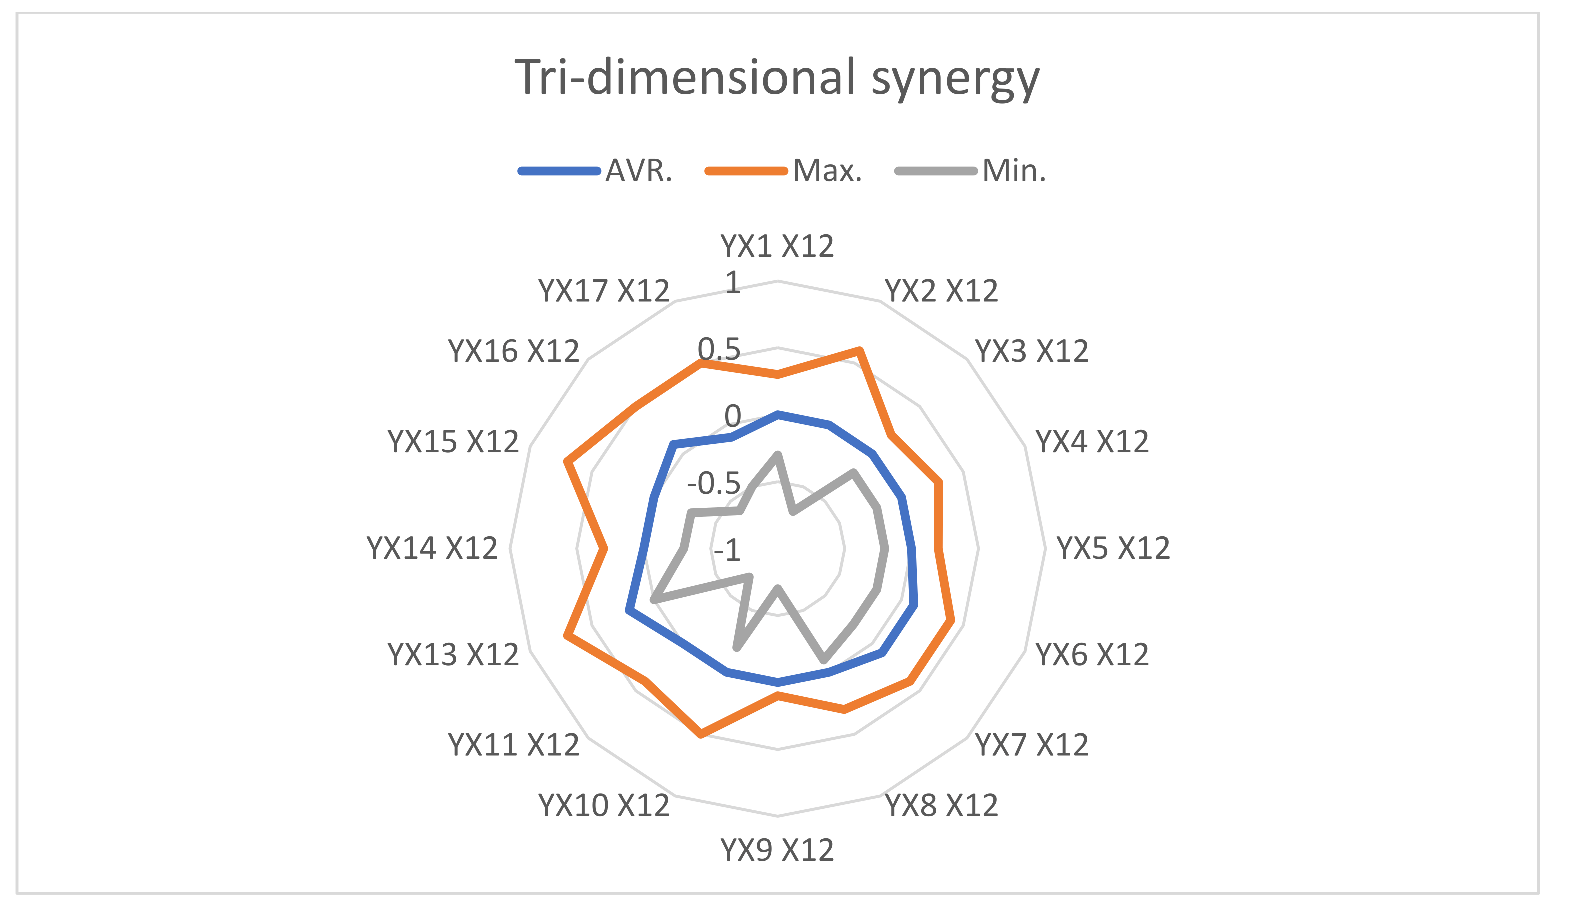
4.2.1. Total Training (X12)

The results for the tri-dimensional synergy between the share of renewable energy from the gross final consumption (Y), the total training (X12), and all the other indicators has returned the following information:
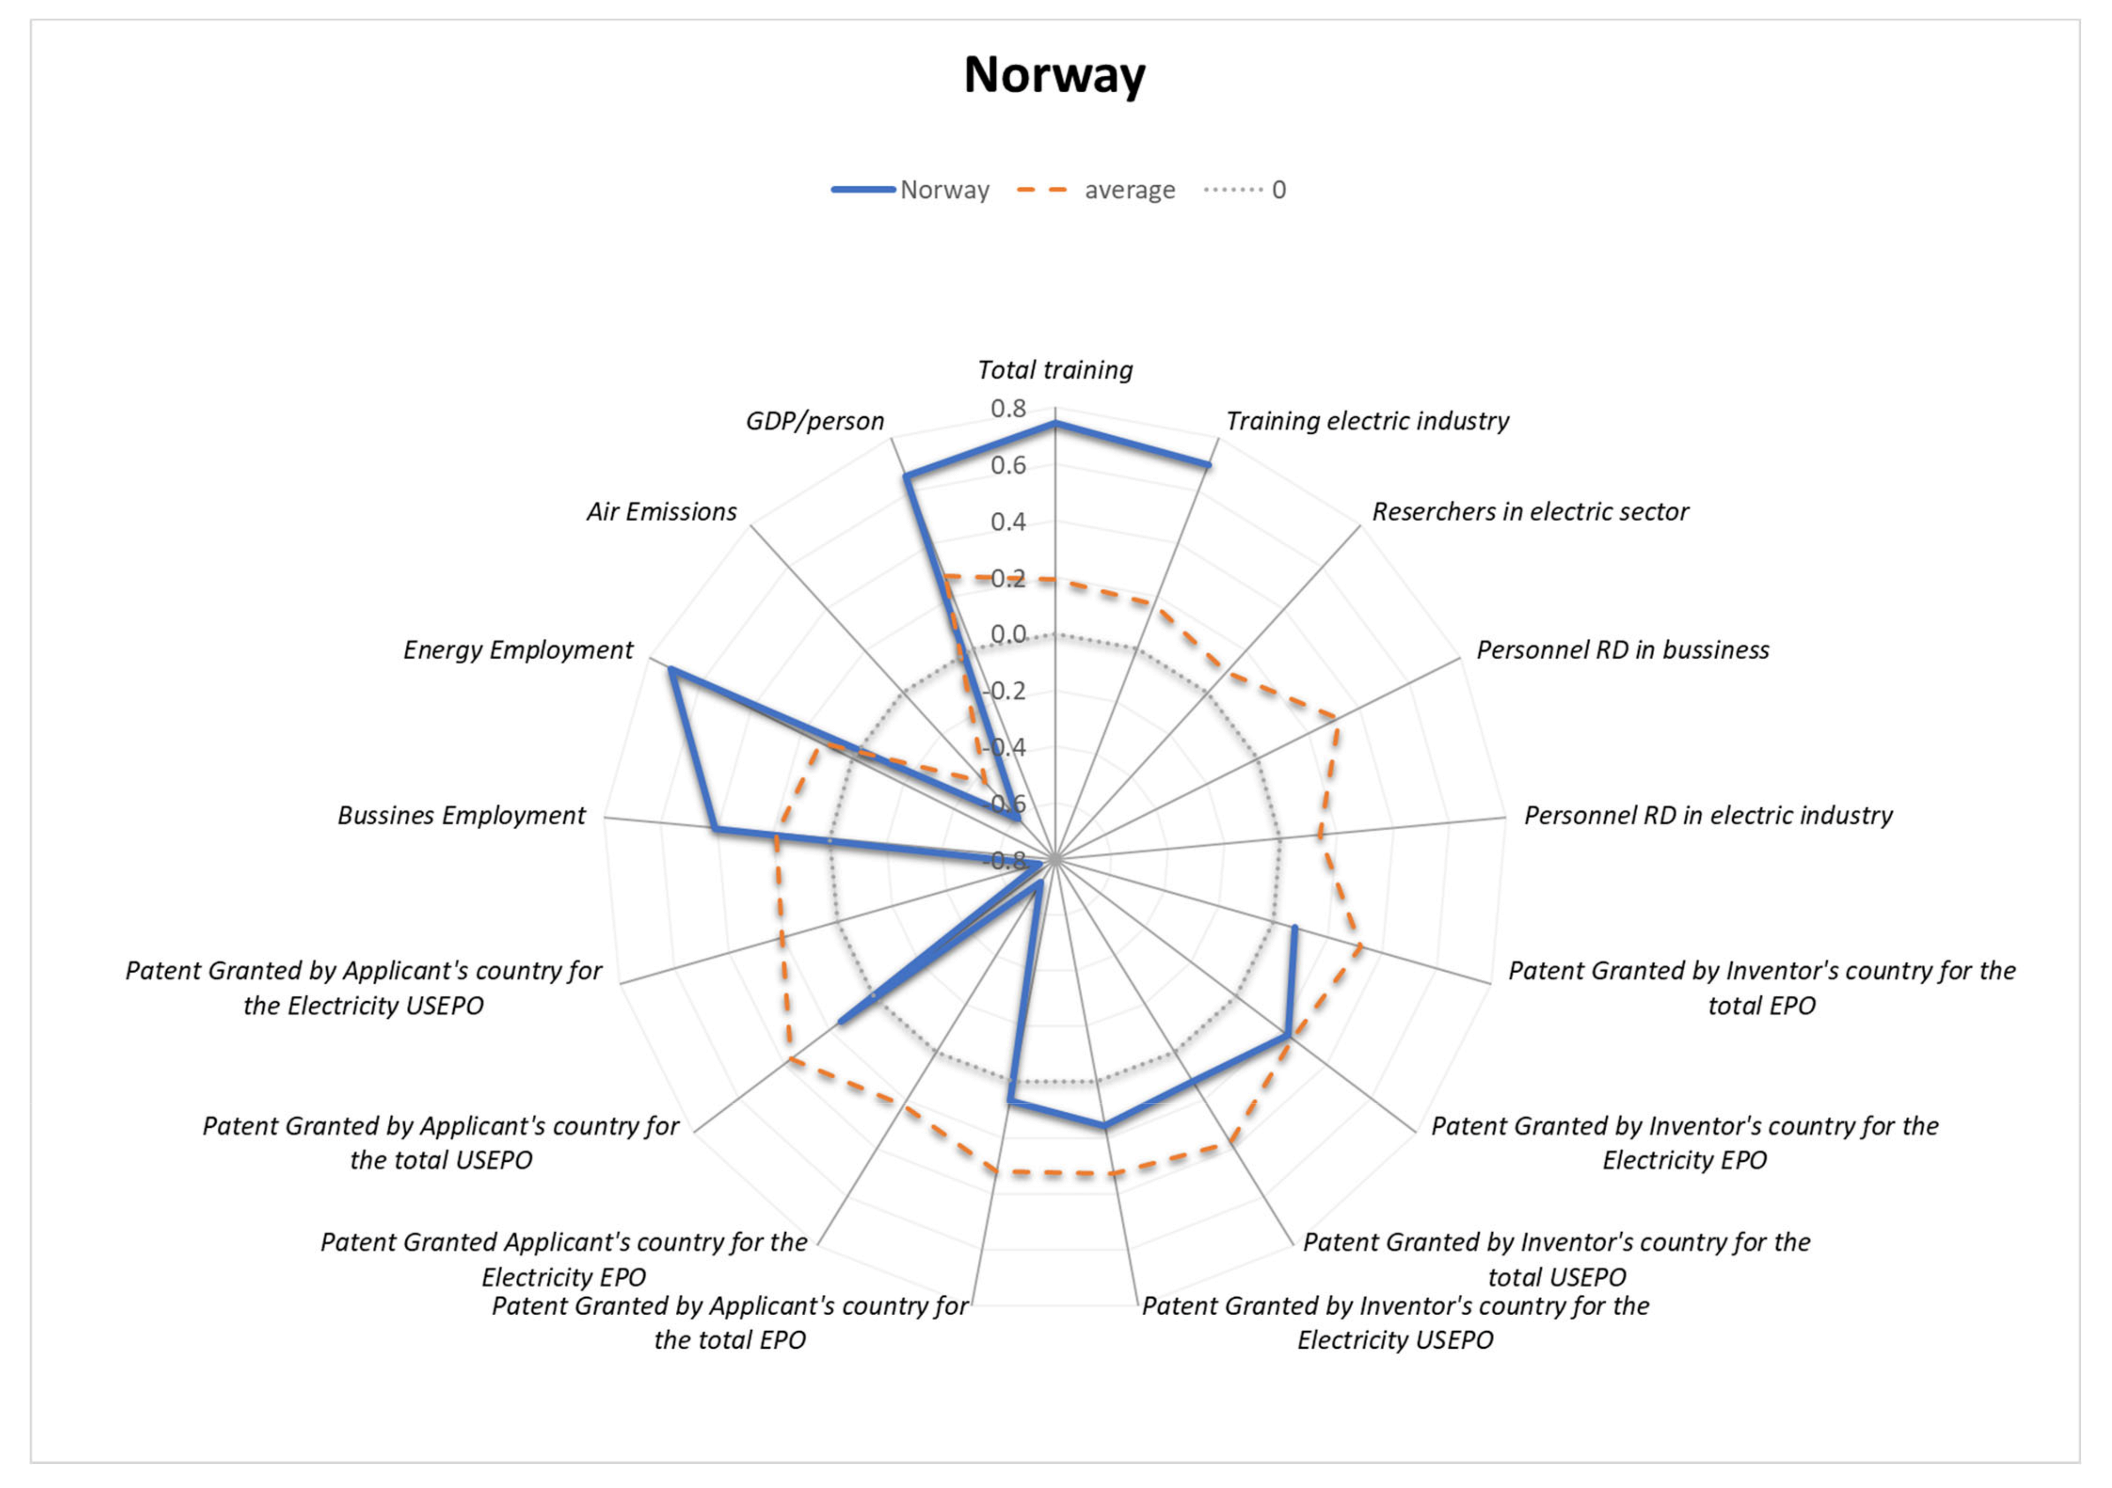
  • The best strategy for renewable energy sector development and continuous learning (X12) is realized when the training occurs (X13). On average, the tacit knowledge flows appear to be important in the creation of a high synergy level, which is at 0.2 with the renewable energy consumption share increase. Particularly in Sweden and Norway, there are two almost perfect synergies (at 0.7) forming with indicator categories Adult participation in learning (Training electric industry) and Employment rate (Employment in energy sector)—solidifying the observation that knowledge transfer under the scope of formal and informal education is significantly connected with the employment rate within the renewable energy sector, and those forces work together in order to realize the targeted sustainability goals in terms of access to equitable education and jobs as well as access to modern energy services, energy-efficient systems, and renewable energy (SDG 4, SDG 7);
  • Although the tri-dimensional synergies are experiencing low levels (0.2), this is an indication of the potential for growth of the former. Therefore, the trainings and continuous learning have a multiplier effect, especially when realized intra and inter-sectoral. This observation can represent an important input for the development of training policies;
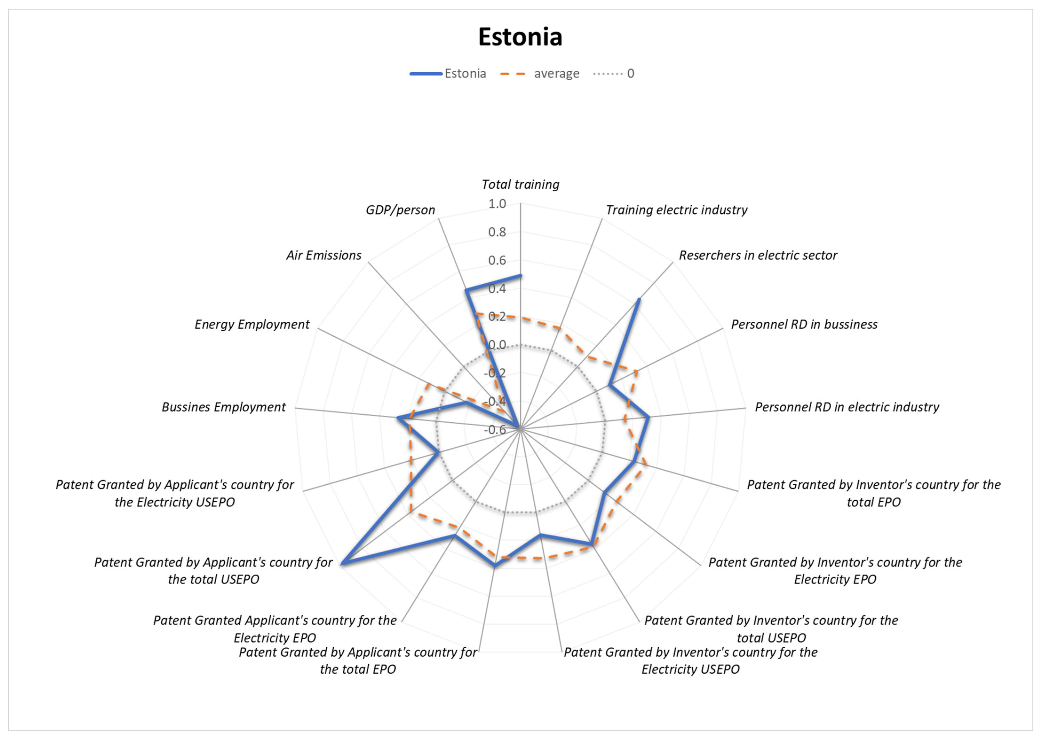
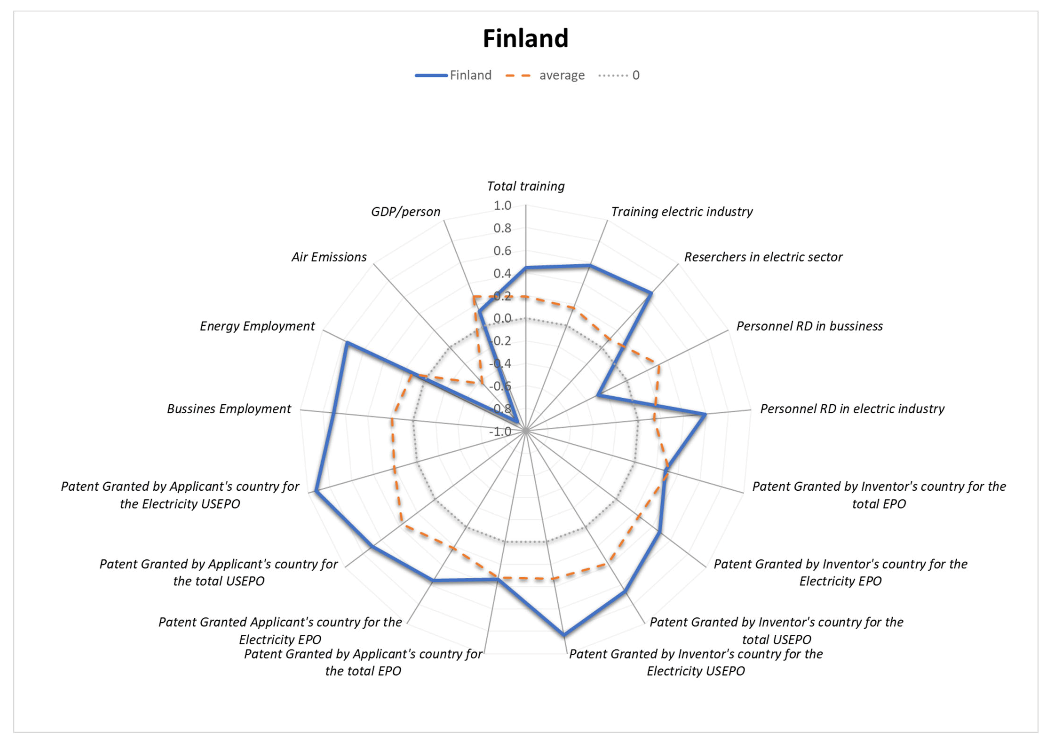
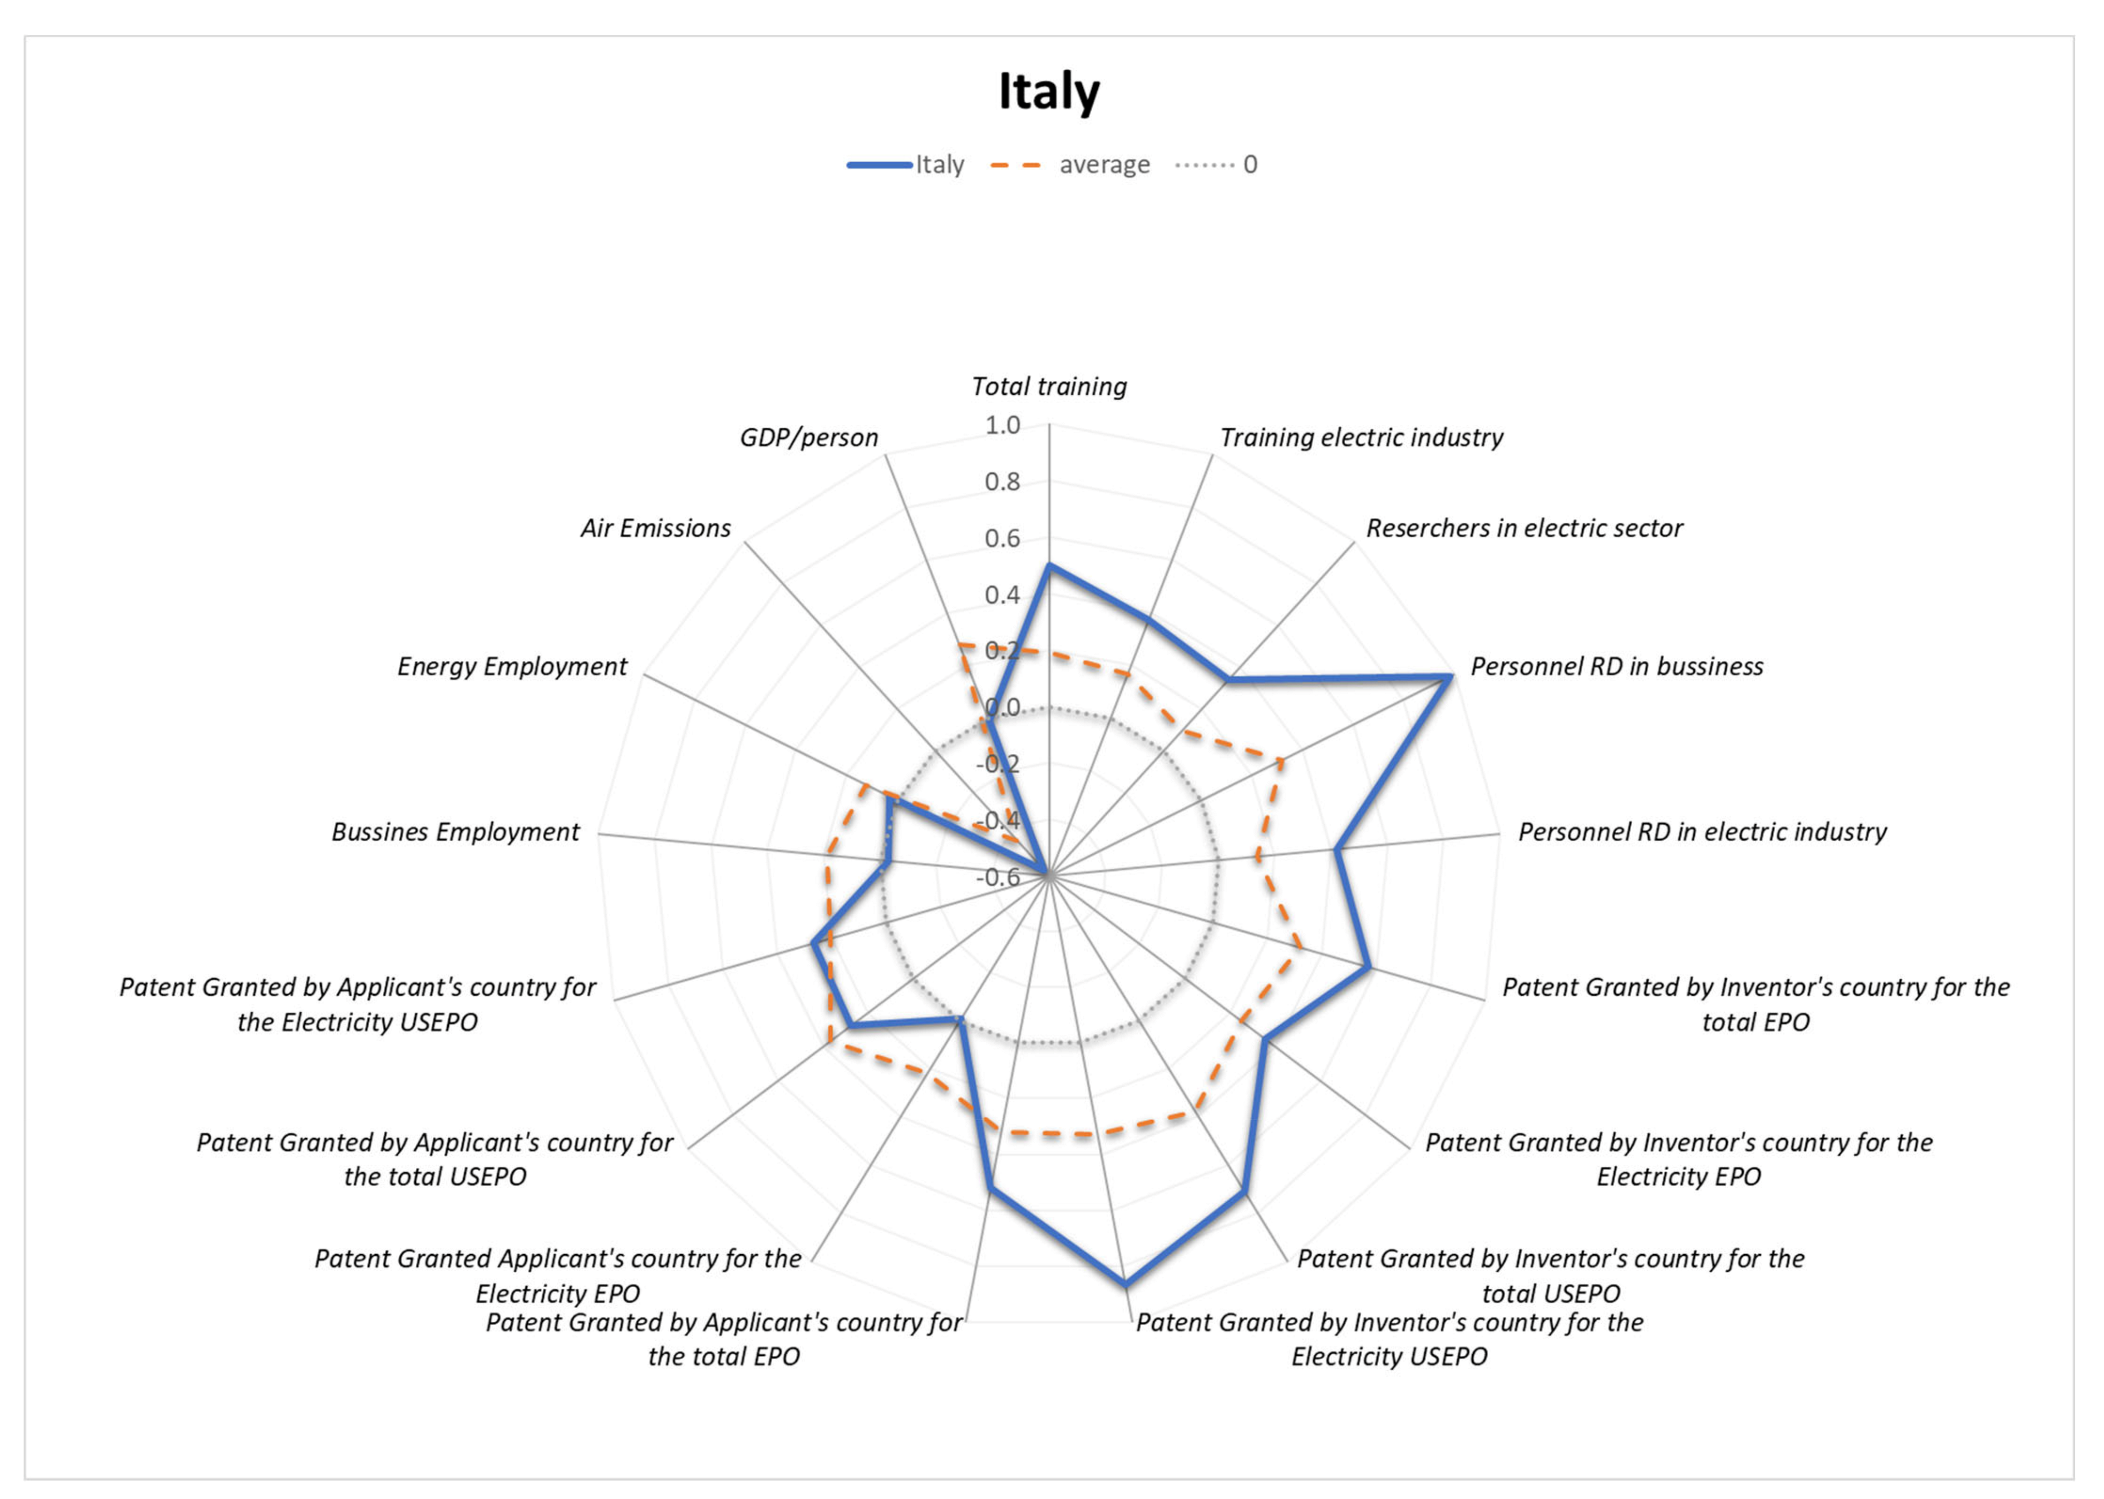
  • The results also indicate a synergy at a medium level based on the combination of tacit and explicit knowledge, which is visible through the following variables: The presence of explicit knowledge flows represented by the Patent granted by the inventor’s country for the total USEPO (X6) or Patent granted by inventor’s country for the electricity USEPO (X7). This result confirms the importance of the harmonization of explicit knowledge flows (dedicated to the energy sector) with the tacit knowledge flows (dedicated to training) for the development of the renewable energy sector. Such practices are observable in Italy, Greece, and Finland. Those countries have developed their energy sector through various synergies especially related to human capital trainings. In Estonia, there are important synergies visible (at 0.5) between the renewable energy sector and the continuous training and patents (X10);
  • Sweden and Italy showcase the highest synergies (0.6; 0.5) between the two dimensions and the R&D personnel in business (X2);
  • There is also a synergy with the real GPD per capita (X16) at 0.1;
  • Generally, there is visible a trade-off between the share of renewable energy consumption from the final consumption, the total training, and the air emissions (X17);
  • Conclusively, the development of the renewable energy sector is supported by KT through the harmonization of knowledge flows (explicit: patents, R&D researchers in business) with the total trainings.
They are presented in Table 7 and Figure 5.
Table 7. Tri-dimensional synergy—YXiX12.
YX1X12YX2X12YX3X12YX4X12YX5X12YX6X12YX7X12YX8X12YX9X12YX10X12YX11X12YX13X12YX14X12YX15X12YX16X12YX17X12
AT0.20.10.20.00.00.00.00.00.00.00.00.20.00.10.3−0.1
BE0.00.00.10.00.10.00.00.10.10.00.00.00.00.00.00.0
CZ0.30.20.10.10.10.00.00.00.00.20.20.10.00.00.1−0.2
DK0.1 0.1−0.2−0.1−0.2−0.2−0.1−0.1−0.2−0.20.00.00.00.00.1
EE0.20.00.00.00.00.10.00.10.00.50.0 0.1−0.10.2−0.3
FI0.2−0.10.20.00.10.20.40.10.10.20.40.30.30.30.1−0.4
FR0.00.00.00.00.10.00.00.10.10.00.00.20.00.00.00.0
DE0.00.00.00.00.00.00.00.00.00.00.00.00.00.00.00.0
EL0.00.40.00.30.00.30.40.3 0.30.0 0.00.0−0.10.0
HU0.00.00.00.00.00.00.00.00.00.00.0 0.00.00.00.0
IS0.00.00.00.00.00.00.00.0 0.00.0 −0.10.00.0
IE−0.10.1−0.10.10.10.10.10.10.00.10.1 0.00.00.1−0.1
IT0.10.50.10.30.20.40.40.30.00.10.10.20.00.00.0−0.3
LV−0.2−0.70.00.1 0.2 0.1 0.2 0.30.00.5−0.1
LT0.00.10.00.00.00.10.00.00.10.10.0 0.00.00.1−0.1
LU 0.0 0.00.00.20.00.10.00.00.0 0.00.10.0−0.1
NL0.10.10.20.00.10.10.10.10.10.00.00.00.00.10.0−0.2
NO 0.1 0.00.10.00.00.0−0.70.0−0.70.70.20.70.4−0.5
PL−0.30.0−0.10.00.00.00.00.00.0−0.1−0.10.2 0.1−0.10.0
PT−0.20.3−0.20.2−0.20.00.00.1 0.10.2 0.00.20.0−0.1
RO0.1−0.60.10.00.00.00.00.0 −0.20.3 −0.30.3−0.60.5
SK 0.0 0.00.00.10.00.1−0.2−0.1−0.4 0.2−0.30.5−0.1
SI0.00.00.00.00.00.00.00.00.00.00.00.00.00.00.00.0
ES0.0−0.1−0.10.00.00.00.00.00.0−0.10.00.1−0.1−0.3−0.10.3
SE 0.6 0.00.00.00.00.00.00.00.00.7 0.30.4−0.2
CH0.00.00.00.00.00.00.00.00.00.00.00.00.00.00.00.0
TR0.00.00.00.00.00.00.00.00.00.00.00.00.00.00.00.0
UK0.00.00.00.00.00.10.10.00.00.00.00.20.00.00.1−0.1
AVR.0.00.00.00.00.00.10.10.00.00.00.00.20.00.00.1−0.1
Max.0.30.60.20.30.20.40.40.30.10.50.40.70.30.70.50.5
Min.−0.3−0.7−0.2−0.2−0.2−0.2−0.2−0.1−0.7−0.2−0.70.0−0.3−0.3−0.6−0.5
Source: Authors’ results synthesis, 2021.

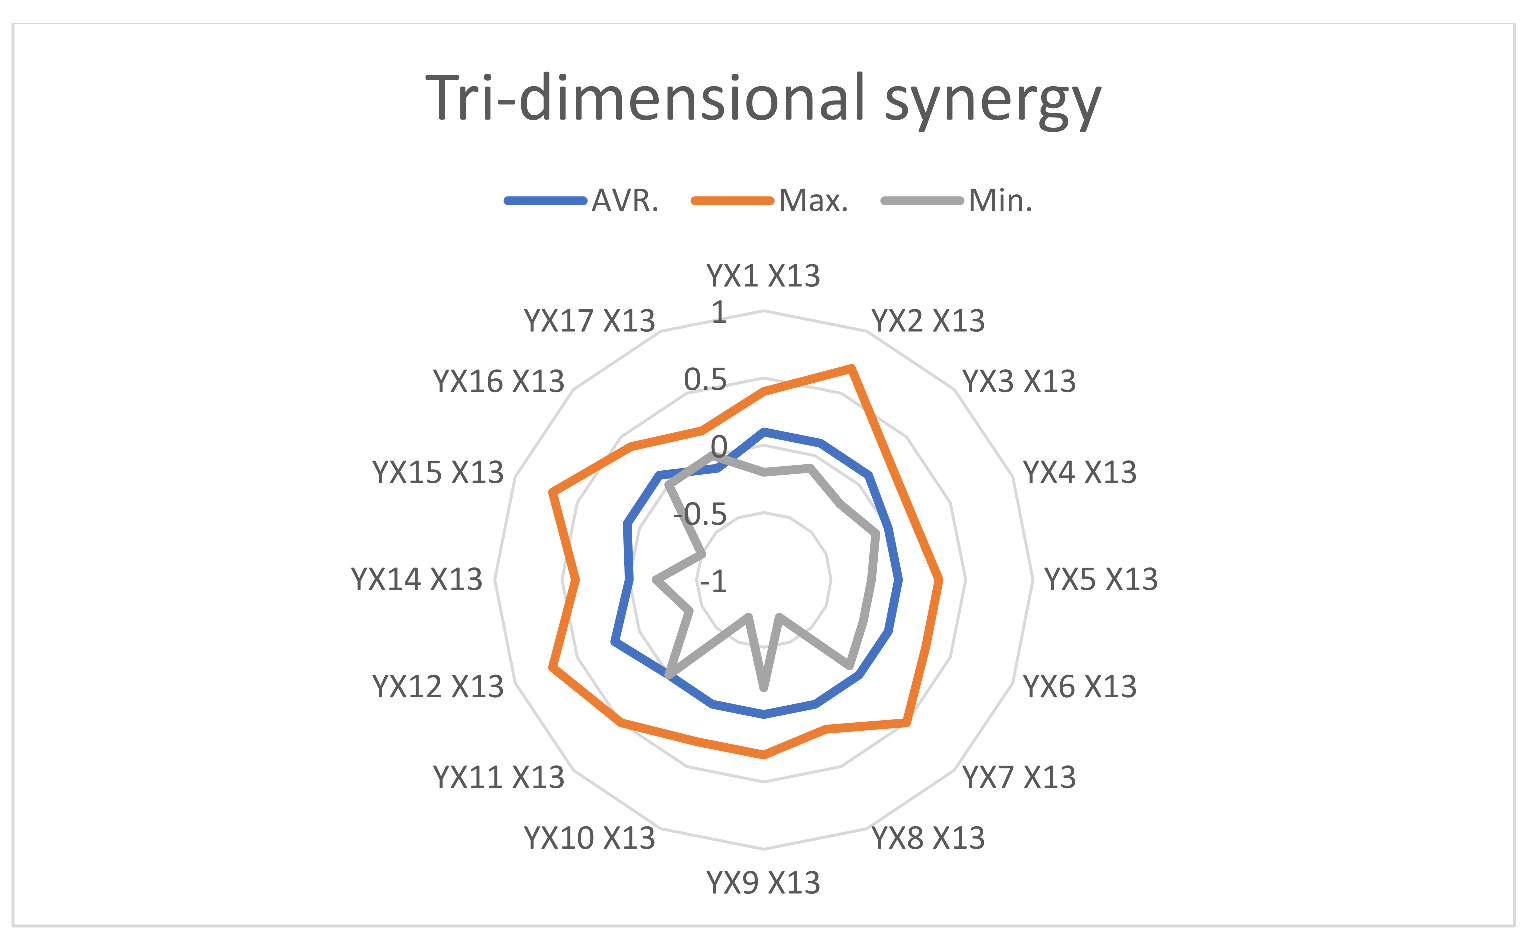
4.2.2. Training Electric Industry (X13)

The results for the tri-dimensional synergy between the shares of renewable energy from the gross final consumption, the training in the electric industry indicator and all the other indicators has returned the following new information (Table 8, Figure 6):
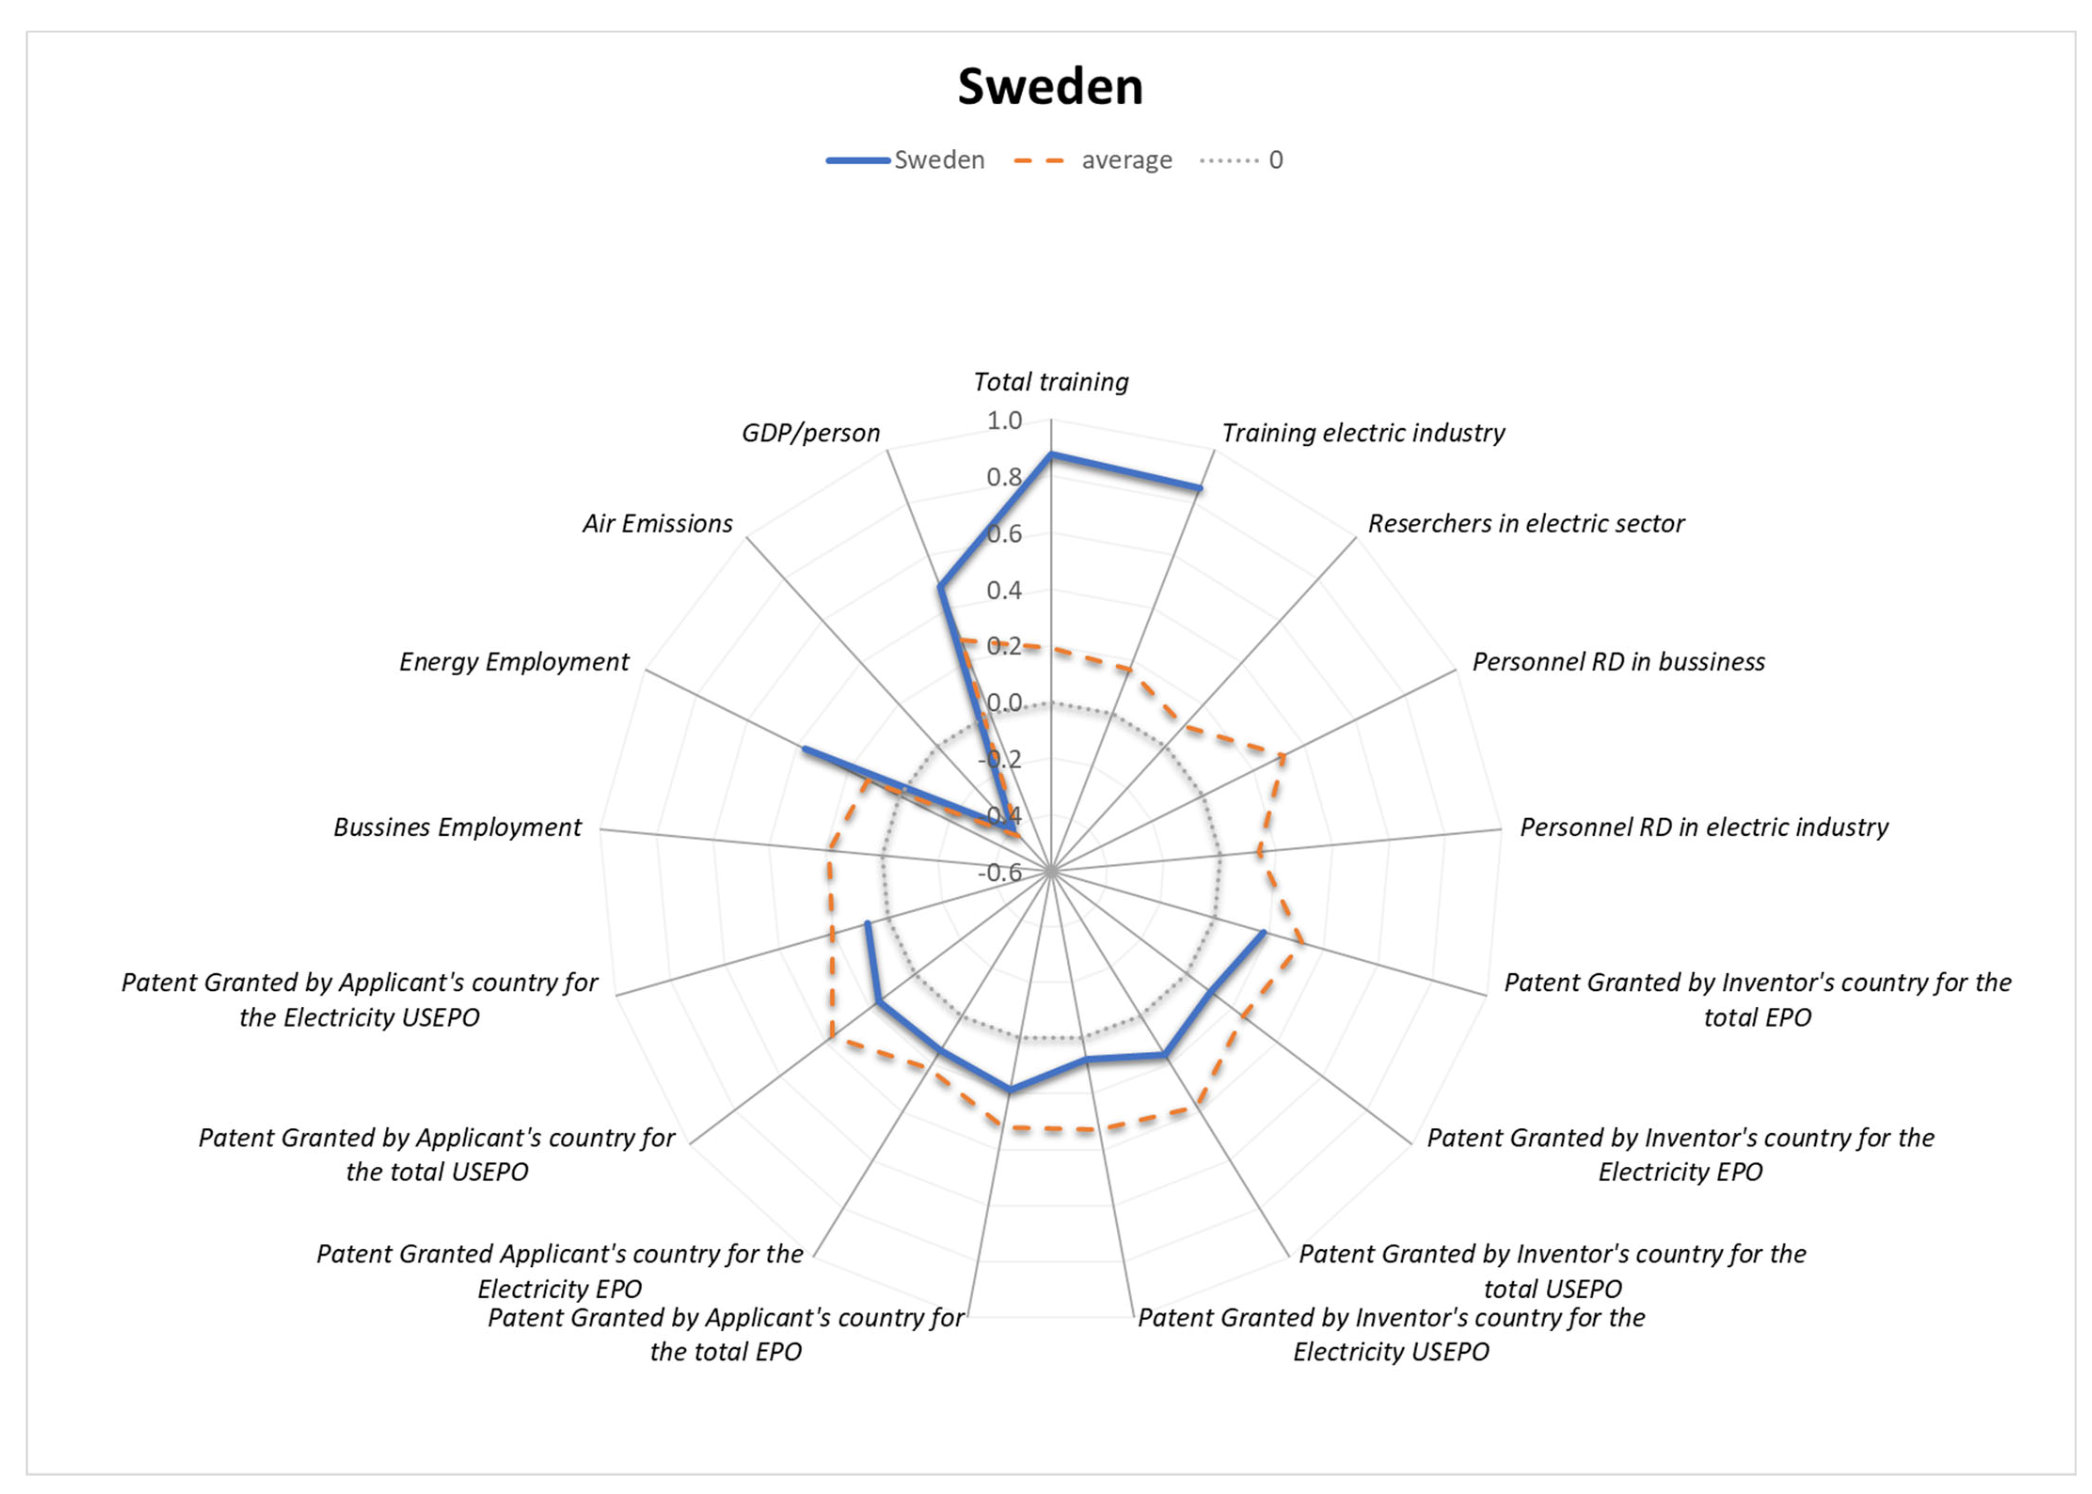
  • The tri-dimensional synergies of 0.7 for the mentioned indicators are with R&D personnel in business, and it is visible in Table 8 for Sweden—showcasing the occurrence of knowledge transfer through formal and informal channels based on the synergy between education, employment, and the energy sector (SDG 8, SDG 4, SDG 7);
  • The tri-dimensional synergies of 0.7 for the mentioned indicators are with Patent granted by applicant’s country for total EPO, in the case of Finland;
  • The tri-dimensional synergies analysis among renewable energy sector and Training electric industry with all other indicators confirms the importance of KT in both flows explicit and tacit, showing that the focused training in the electrical domain increases the level of synergies with about 0.1, as it is the case for Sweden (Integrated Player).
Table 8. Tri-dimensional synergy—YXiX13.
YX1X13YX2X13YX3X13YX4X13YX5X13YX6X13YX7X13YX8X13YX9X13YX10X13YX11X13YX12X13YX14X13YX15X13YX16X13YX17X13
AT0.30.20.30.00.00.00.00.00.00.00.00.20.00.00.1−0.1
BE−0.10.10.20.20.30.10.10.20.30.10.00.00.00.00.0−0.1
CZ0.40.30.20.10.10.10.00.10.00.30.40.10.00.10.1−0.4
DK0.2 0.2−0.2−0.1−0.2−0.2−0.1−0.1−0.2−0.20.00.00.00.00.2
EE
FI0.2−0.20.20.00.10.30.50.10.20.30.50.30.40.40.1−0.4
FR0.00.00.00.10.10.10.10.10.10.00.00.20.00.00.00.0
DE0.00.00.0−0.1−0.10.0−0.1−0.1−0.10.00.00.00.00.00.00.0
EL
HU
IS
IE
IT0.00.40.10.20.10.30.30.20.00.10.10.20.00.00.0−0.2
LV
LT
LU
NL0.00.00.10.00.00.00.00.00.00.00.00.00.00.00.0−0.1
NO 0.1 0.00.10.00.00.0−0.70.0−0.70.70.20.70.3−0.5
PL−0.4−0.1−0.10.00.00.00.00.00.0−0.1−0.10.2 0.1 0.0
PT
RO
SK
SI0.00.00.00.00.00.00.00.00.00.00.00.00.00.00.00.0
ES0.00.00.00.00.00.00.00.00.00.00.00.10.0−0.2 0.2
SE 0.7 0.00.00.00.00.00.00.00.00.7 0.30.4−0.1
CH0.00.00.00.00.00.00.00.00.00.00.00.00.00.00.00.0
TR0.00.0−0.10.00.00.00.00.00.00.00.00.00.00.00.00.0
UK0.10.10.10.00.00.00.00.00.00.00.00.20.00.10.1−0.1
AVR.0.10.10.10.00.00.00.00.00.00.00.00.20.00.10.1−0.1
Max.0.40.70.30.20.30.30.50.20.30.30.50.70.40.70.40.2
Min.−0.2−0.1−0.2−0.1−0.2−0.2−0.1−0.7−0.2−0.70.0−0.4−0.2−0.50.00.0
Source: Authors’ results synthesis, 2021.
Figure 6. Tri-dimensional synergies in rapport with Training electric industry (X13). Source: Authors’ representation.
Energies 15 00276 g006

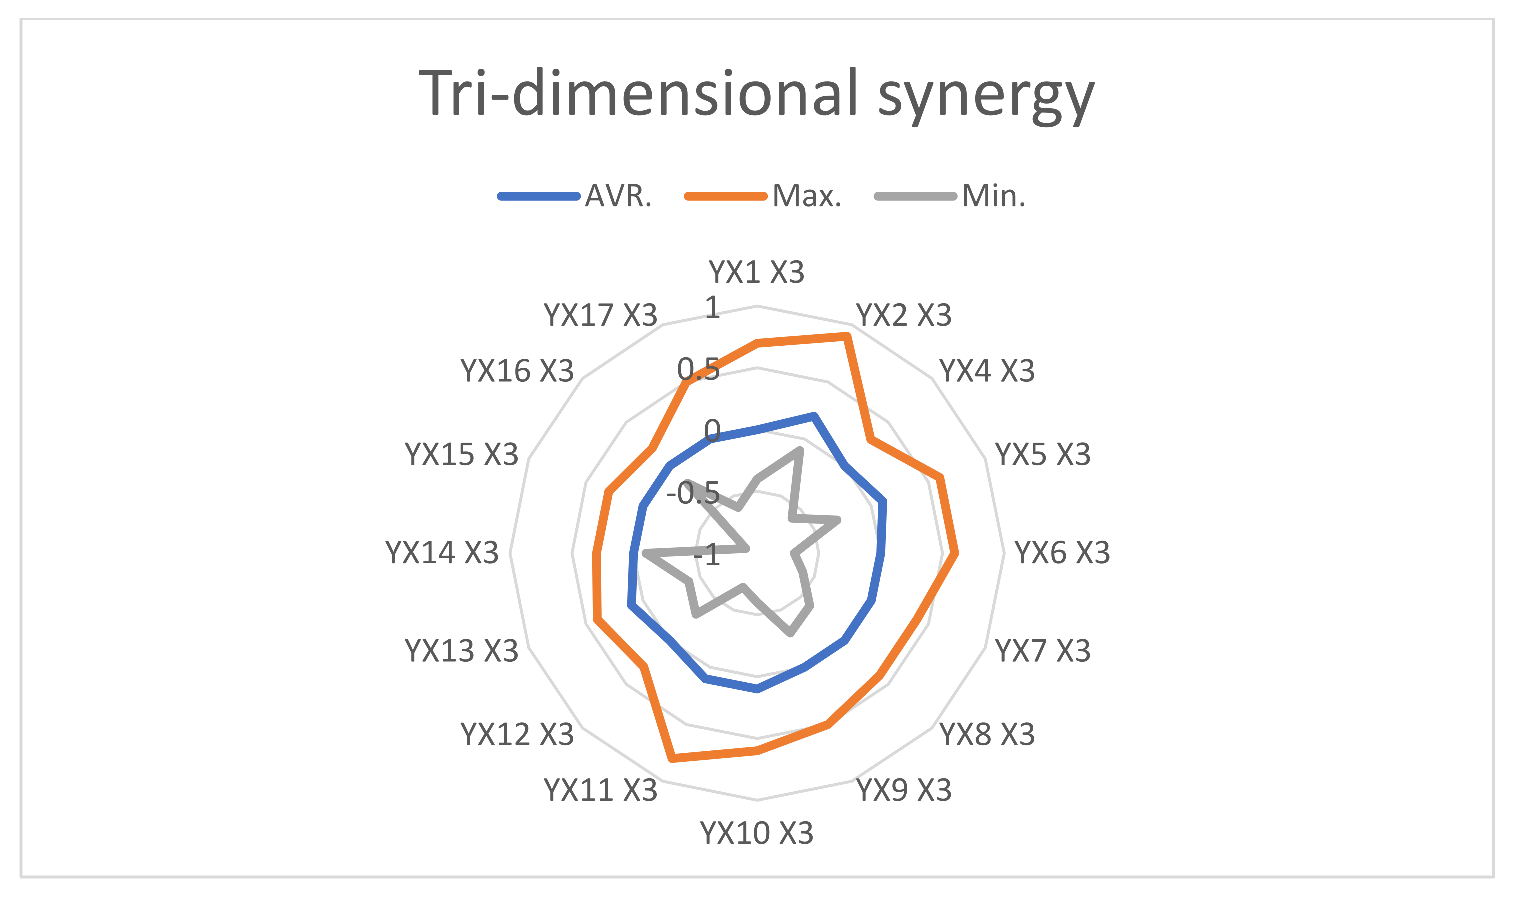
4.2.3. R&D Personnel in Electric Industry (X3)

The results for the tri-dimensional synergy between the share of renewable energy from the gross final consumption, the R&D personnel in electric industry, and all the other indicators has returned the following information (Table 9, Figure 7), which is pertinent for the third dimension:
  • R&D personnel in business (X2). This is the first model, and for all three dimensions, the average synergy level is 0.2. The highest level of synergy is 0.9 for Portugal, 0.5 for Denmark and Finland, while for the Netherlands and Romania, the highest levels are 0.4 and 0.5;
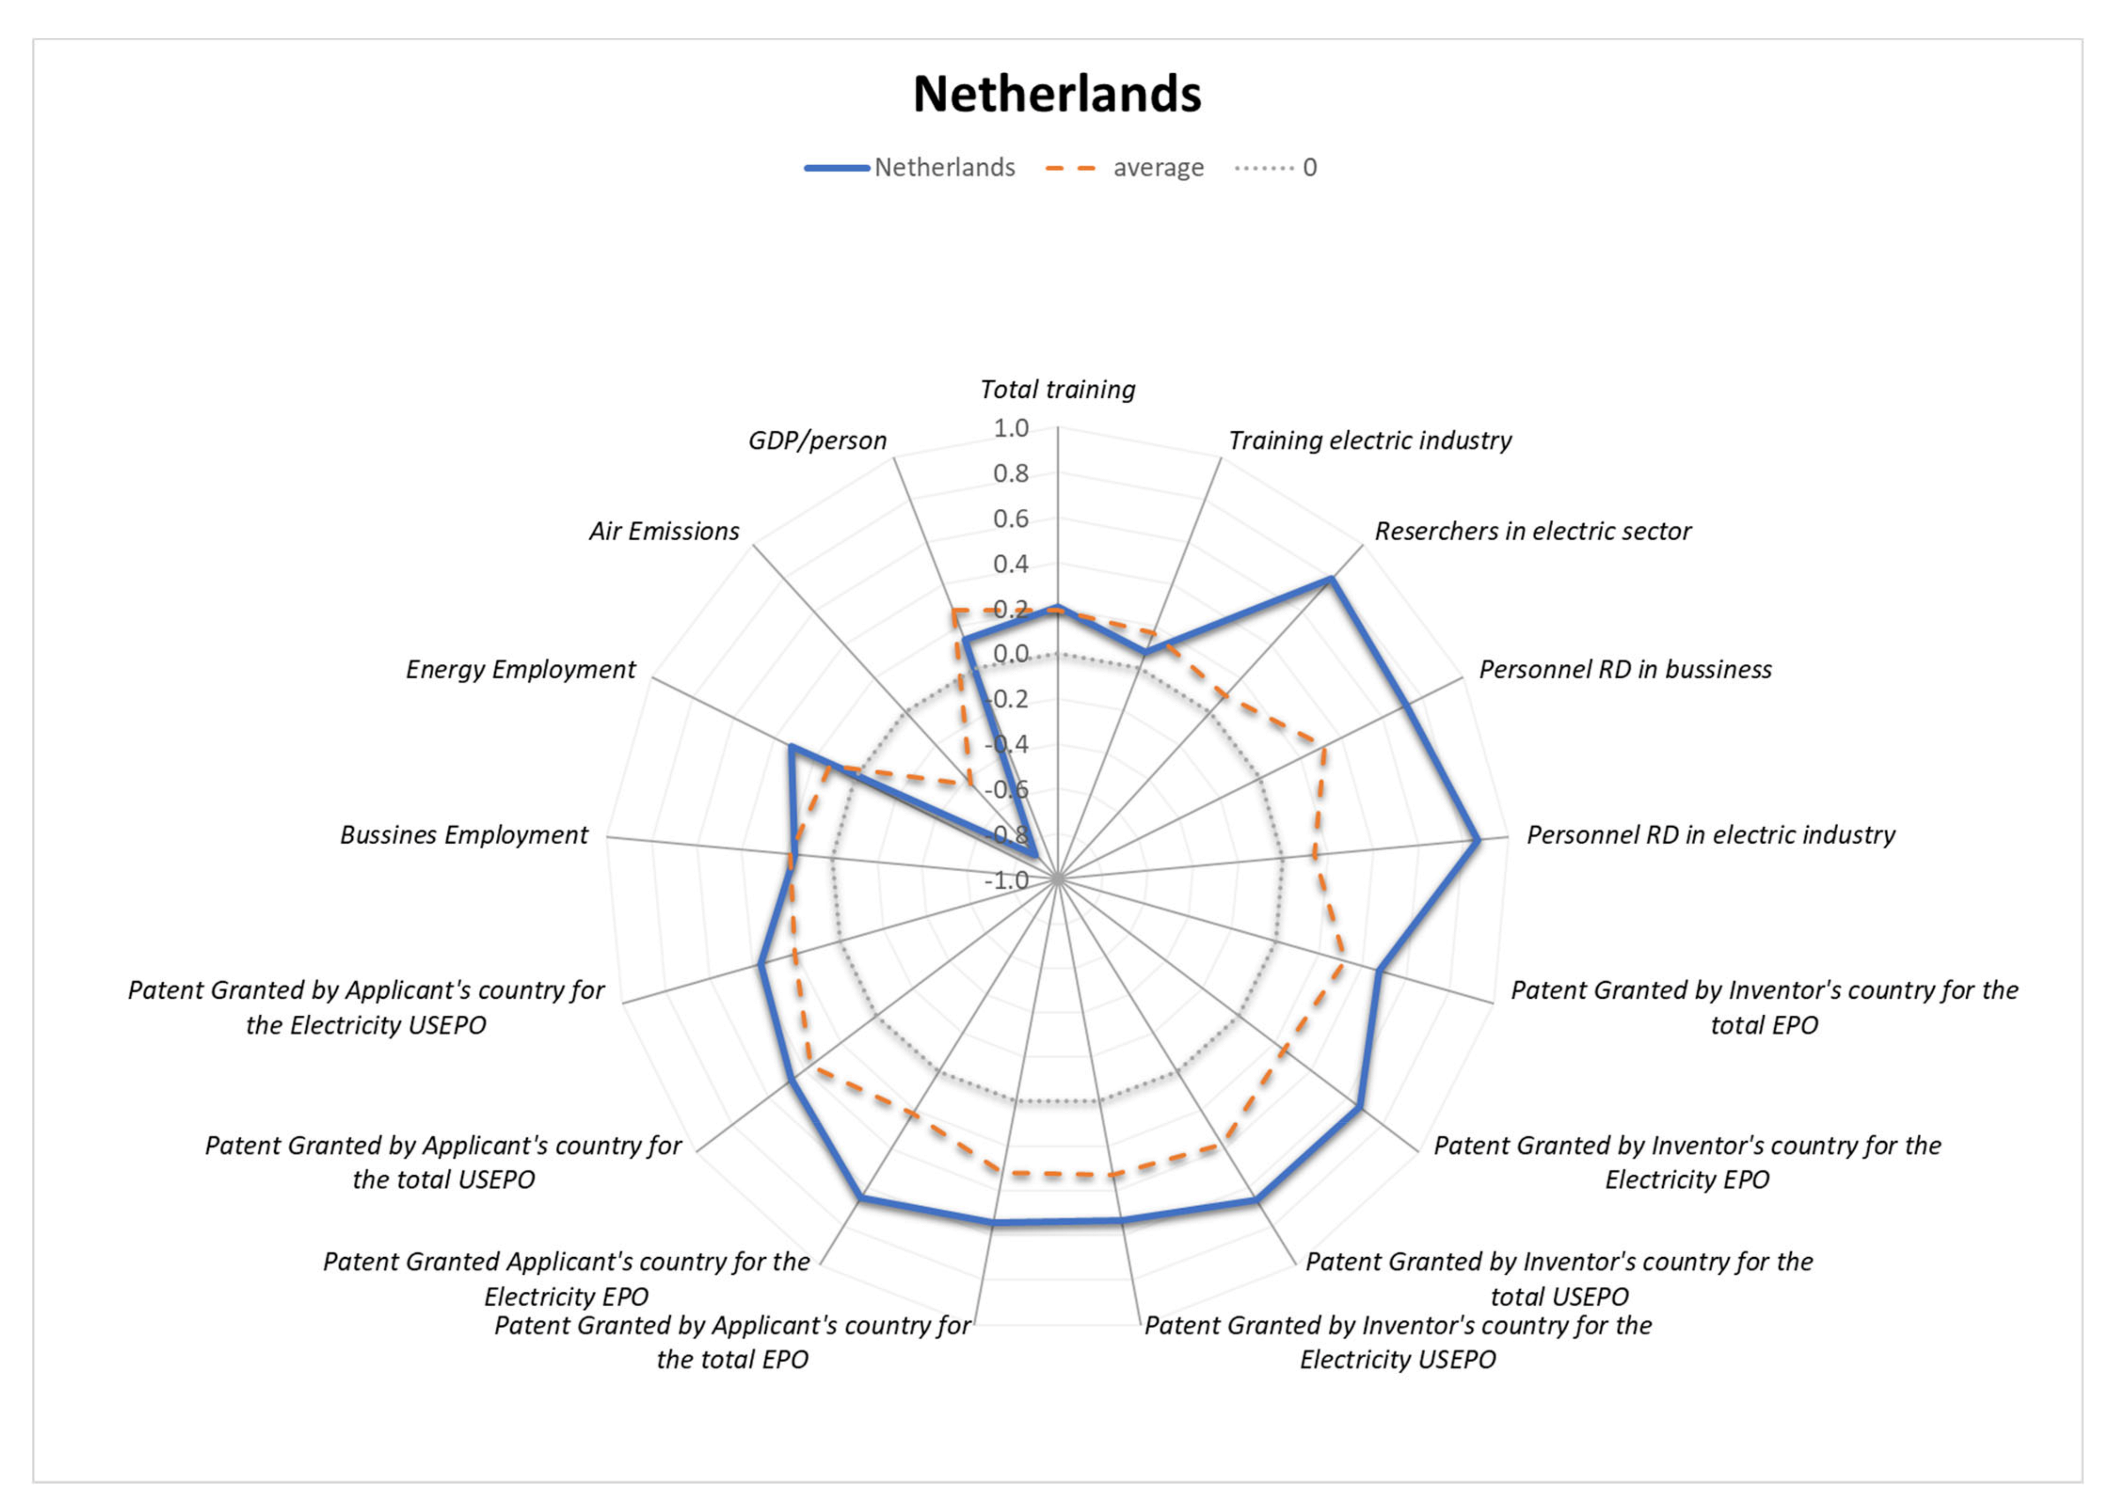
  • Patent granted by inventor’s country for the total USEPO (X6) for Finland and Netherlands with 0.6—model based on explicit knowledge production (the Netherlands is a country with the KT model Global Innovator);
  • Patent granted by the applicant’s country for the total USEPO (X10) for Finland with 0.6;
  • The previous conclusion of the binarity of KT in both flows of explicit and tacit knowledge, with emphasis on the importance of the linking between Research and Business, has been achieved.
Table 9. Tri-dimensional synergy—YXiX3.
YX1X3YX2X3YX4X3YX5X3YX6X3YX7X3YX8X3YX9X3YX10X3YX11X3YX12X3YX13X3YX14X3YX15X3YX16X3YX17X3
AT0.20.30.00.00.00.00.00.00.00.00.20.30.00.00.1−0.1
BE−0.1−0.1−0.1−0.2−0.1−0.1−0.1−0.2−0.10.00.0−0.10.00.00.00.0
CZ0.50.30.20.20.10.10.10.10.60.80.30.4−0.10.10.2−0.6
DK 0.5−0.6−0.3−0.7−0.6−0.4−0.3−0.6−0.70.10.20.00.0−0.10.5
EE0.00.10.10.00.20.00.20.10.40.00.2 0.1−0.10.2−0.2
FI−0.10.50.10.40.60.40.20.50.60.40.20.20.30.30.1−0.5
FR0.20.10.20.10.20.20.20.10.30.30.00.00.00.00.1−0.4
DE0.00.00.0−0.10.00.00.0−0.10.00.00.00.00.00.00.00.0
EL0.00.10.00.10.00.00.0 0.00.00.0 0.00.00.00.0
HU−0.10.2−0.10.00.00.00.0−0.1−0.1−0.10.0 −0.10.0−0.10.0
IS0.00.00.00.00.00.00.0 0.00.00.0 0.00.00.0
IE−0.30.2−0.3−0.1−0.3−0.2−0.10.0−0.2−0.2−0.1 −0.10.0−0.20.3
IT0.10.30.10.00.10.10.10.00.00.00.10.00.00.00.0−0.1
LV0.30.00.0 −0.1 0.0 −0.1 −0.2 −0.10.0−0.20.1
LT−0.10.00.00.0−0.20.00.0−0.1−0.2−0.10.0 0.00.0−0.10.1
LU
NL0.70.50.30.60.60.40.40.50.30.20.10.00.10.20.1−0.5
NO
PL0.10.20.10.00.10.00.10.00.30.3−0.3−0.4 −0.20.2−0.1
PT−0.40.9−0.10.50.00.0−0.1 0.0−0.1−0.2 0.0−0.9−0.10.4
RO−0.20.40.00.00.0−0.10.0 −0.30.10.1 −0.10.1−0.10.1
SK
SI0.00.00.00.00.00.00.00.00.00.00.00.00.00.00.00.0
ES0.00.30.10.00.10.10.10.00.30.20.00.00.00.10.0−0.1
SE
TR0.00.00.00.00.00.00.00.00.00.00.00.00.00.00.00.0
UK0.00.00.00.00.00.00.00.00.00.00.00.00.00.00.00.0
AVR.0.00.20.00.10.00.00.00.00.10.10.00.10.00.00.00.0
Max.0.70.90.30.60.60.40.40.50.60.80.30.40.30.30.20.5
Min.−0.4−0.1−0.6−0.3−0.7−0.6−0.4−0.3−0.6−0.7−0.3−0.4−0.1−0.9−0.2−0.6
Source: Authors’ results synthesis, 2021.
Figure 7. Tri-dimensional synergies in rapport with R&D personnel in electric industry (X3). Source: Authors’ representation.
Energies 15 00276 g007

4.2.4. Employment in Energy Sector (X15)

The results for the tri-dimensional synergy between the shares of renewable energy from the gross final consumption, Employment in the energy sector and all the other indicators has returned the following information with the third dimension (Table 10, Figure 8):
  • Training electric industry (X13) is on average 0.1. Some countries present important levels of synergies: Norway at 0.7, Finland at 0.4, and Sweden at 0.3;
  • Finland is a remarkable case of positive synergies with all the analyzed indicators with the exception of R&D personnel in business (X2) and the trade-off with air emissions;
Table 10. Tri-dimensional synergy—YXiX15.
YX1X15YX2X15YX3X15YX4X15YX5X15YX6X15YX7X15YX8X15YX9X15YX10X15YX11X15YX12X15YX13X15YX14X15YX16X15YX17X15
AT0.00.00.00.00.00.00.00.00.00.00.00.10.00.00.10.0
BE0.00.00.00.00.00.00.00.00.00.00.00.00.00.00.00.0
CZ0.10.10.00.00.00.00.00.00.00.10.10.00.10.00.0−0.1
DK0.0 0.00.00.00.00.00.00.00.00.00.00.00.00.00.0
EE−0.10.00.00.00.00.00.00.00.0−0.20.0−0.1 0.0−0.10.1
FI0.3−0.20.30.10.20.30.60.10.20.40.70.30.40.50.1−0.6
FR0.00.00.00.00.00.00.00.00.00.10.10.00.00.00.0−0.1
DE0.00.10.00.10.10.10.10.10.10.10.10.00.00.10.0−0.1
EL0.00.00.00.00.00.00.00.0 0.00.00.0 0.00.00.0
HU0.00.00.00.00.00.00.00.10.00.00.00.0 −0.1−0.10.0
IS0.00.00.00.00.00.00.00.0 0.00.0−0.1 0.00.0
IE0.00.00.00.00.00.00.00.00.00.00.00.0 0.00.00.0
IT0.00.00.00.00.00.00.00.00.00.00.00.00.00.00.00.0
LV0.00.00.00.0 0.0 0.0 0.0 0.0 0.00.00.0
LT0.0−0.10.00.00.0−0.10.00.0−0.1−0.10.00.0 0.00.00.1
LU 0.0 0.00.00.20.00.10.00.00.00.1 0.10.0−0.2
NL0.20.20.30.10.10.10.10.10.10.10.00.10.00.10.0−0.3
NO 0.1 0.00.10.00.00.0−0.70.0−0.70.70.70.20.3−0.5
PL−0.20.00.00.00.00.00.00.00.0−0.1−0.10.10.1 −0.10.0
PT−0.90.3−0.90.1−0.40.00.00.1 0.00.10.2 0.00.1−0.5
RO0.1−0.40.10.00.00.00.00.0 −0.10.20.3 −0.2−0.40.3
SK 0.0 0.00.0−0.10.0−0.10.20.10.5−0.3 −0.3−0.70.2
SI0.00.00.00.0−0.10.00.00.00.00.00.00.00.00.00.10.0
ES0.10.10.10.00.00.00.00.00.00.10.0−0.3−0.20.10.2−0.5
SE 0.3 0.00.00.00.00.00.00.00.00.30.3 0.2−0.1
CH0.00.00.00.00.00.00.00.00.00.00.00.00.00.00.00.0
TR0.00.00.00.00.00.00.00.00.00.00.00.00.00.00.00.0
UK0.00.00.00.00.00.00.00.00.00.00.00.00.10.00.0−0.1
AVR.0.00.00.00.00.00.00.00.00.00.00.00.00.10.00.0−0.1
Max.0.30.30.30.10.20.30.60.10.20.40.70.70.70.50.30.3
Min.−0.9−0.4−0.90.0−0.4−0.10.0−0.1−0.7−0.2−0.7−0.3−0.2−0.3−0.7−0.6
Source: Authors’ results synthesis, 2021.
Figure 8. Tri-dimensional synergies in rapport with Employment in the energy sector (X15). Source: Authors’ representation.
Energies 15 00276 g008
Sweden presents a delinking particularity from the explicit knowledge (patents) and it showcases synergies with R&D personnel in business (X2) through explicit knowledge transfer but without the intellectual property, having had low synergies with income at 0.2 and with air emissions at 0.1.

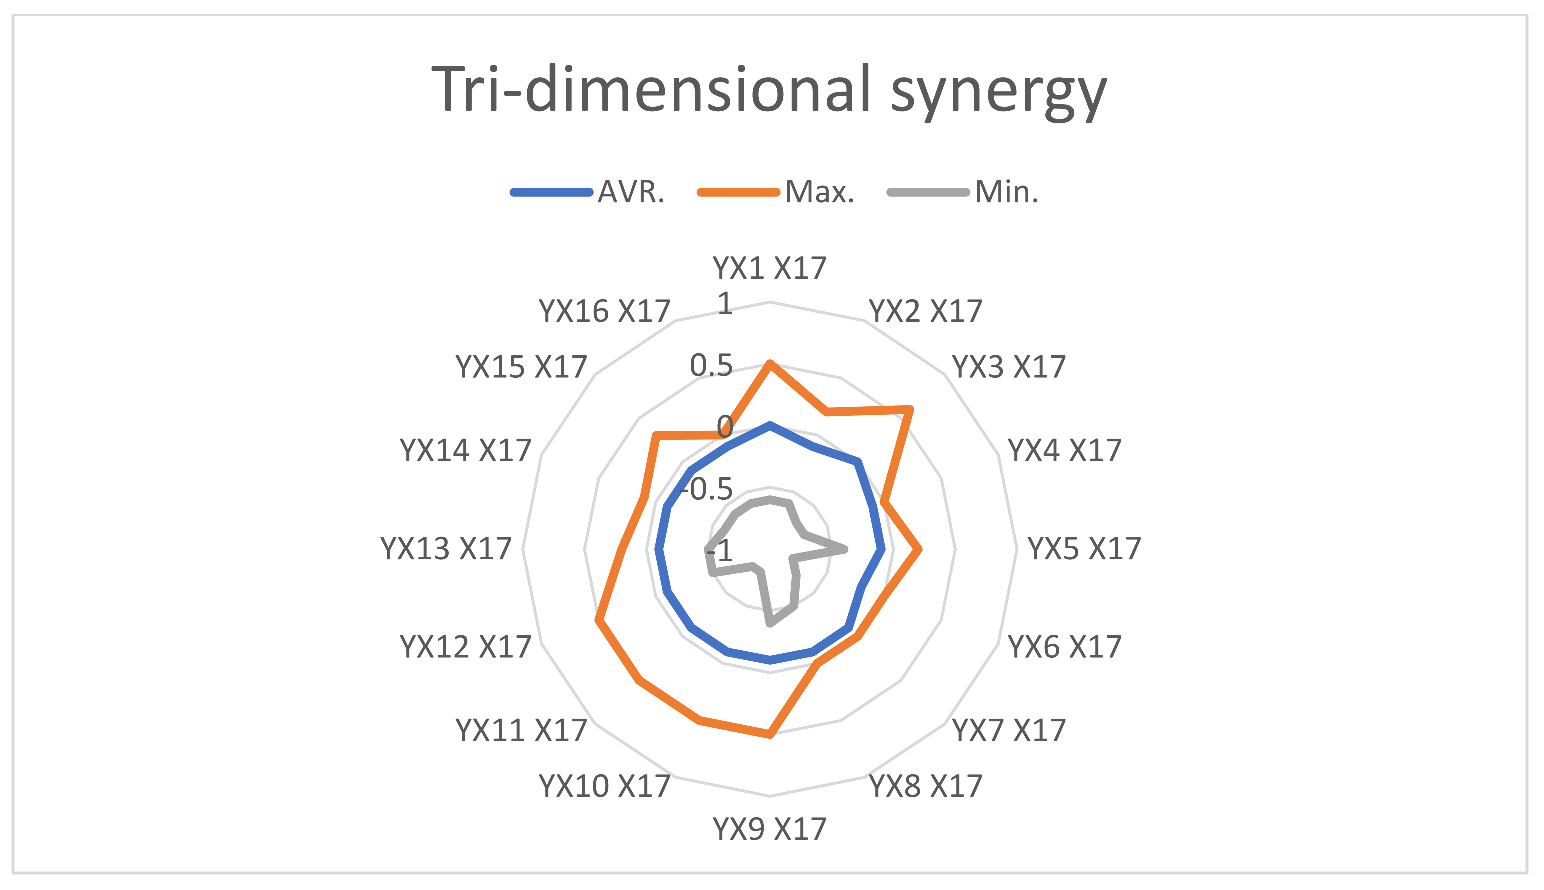
4.2.5. Air Emissions Intensity of Industry (X17)

The results for the tri-dimensional synergy between the share of renewable energy from the gross final consumption, the air emissions intensity of industry, and the third dimension below has returned the following information (Table 11, Figure 9):
  • Patent granted by inventor’s country for the total USEPO (X6) has the highest form of explicit knowledge and realizes a maximum trade-off at 0.2. For this triple synergy, the best performer is Denmark at −0.8, followed by Finland at −0.5, and Ireland, Italy, Lithuania, the Netherlands with values between −0.3 and −0.4;
  • Patent granted by applicant’s country for the total USEPO (X10) and Patent granted by applicant’s country for the electricity USEPO (X11) generate trade-offs at −0.8 for Denmark, Finland, and France;
  • The explicit knowledge is linked to the air emission synergy drop. There are three countries that manage to exploit a various range of patents (X2–X11)—Denmark, Finland, and France.
Table 11. Tri-dimensional synergy—YXiX17.
YX1X17YX2X17YX3X17YX4X17YX5X17YX6X17YX7X17YX8X17YX9X17YX10X17YX11X17YX12X17YX13X17YX14X17YX15X17YX16X17
AT−0.1−0.2−0.10.00.00.00.00.00.00.00.0−0.1−0.10.00.00.0
BE0.0−0.1−0.2−0.1−0.2−0.1−0.1−0.1−0.2−0.10.00.0−0.10.00.00.0
CZ−0.6−0.5−0.3−0.2−0.2−0.10.0−0.1−0.1−0.5−0.6−0.2−0.40.1−0.1−0.1
DK0.5 0.6−0.7−0.3−0.8−0.7−0.5−0.3−0.8−0.80.10.20.00.0−0.1
EE−0.2−0.1−0.10.00.0−0.10.0−0.10.0−0.60.0−0.3 −0.20.1−0.3
FI−0.50.2−0.4−0.1−0.3−0.5−0.7−0.1−0.3−0.5−0.7−0.4−0.4−0.6−0.6−0.1
FR−0.4−0.3−0.1−0.3−0.2−0.3−0.3−0.2−0.2−0.4−0.50.00.00.0−0.1−0.1
DE0.0−0.10.0−0.2−0.2−0.2−0.2−0.2−0.3−0.1−0.10.00.0−0.1−0.10.0
EL0.00.00.00.00.00.00.00.0 0.00.00.0 0.00.00.0
HU0.00.00.00.00.00.00.00.00.00.00.00.0 0.00.00.0
IS0.00.00.00.00.00.00.00.0 0.00.00.0 0.00.0
IE0.3−0.40.3−0.4−0.2−0.4−0.2−0.20.0−0.3−0.3−0.1 −0.10.0−0.3
IT−0.1−0.6−0.1−0.3−0.2−0.4−0.4−0.30.0−0.2−0.2−0.3−0.20.00.00.0
LV0.10.20.00.0 0.0 0.0 −0.1 −0.1 −0.10.0−0.1
LT0.1−0.20.00.0−0.1−0.3−0.10.0−0.2−0.3−0.1−0.1 0.00.1−0.1
LU 0.0 0.00.0−0.20.0−0.10.00.00.0−0.1 −0.1−0.20.0
NL−0.5−0.4−0.7−0.2−0.4−0.4−0.2−0.3−0.4−0.2−0.1−0.2−0.1−0.1−0.3−0.1
NO −0.1 0.0−0.10.00.00.00.50.00.5−0.5−0.5−0.3−0.5−0.2
PL−0.10.00.00.00.00.00.00.00.00.00.00.00.0 0.00.0
PT0.4−0.20.40.00.20.00.00.0 0.00.0−0.1 0.0−0.5−0.1
RO0.1−0.60.10.00.00.00.00.0 −0.20.30.5 −0.30.3−0.6
SK −0.2 −0.1−0.1−0.20.0−0.30.40.50.2−0.1 −0.10.2−0.2
SI0.00.00.00.00.00.00.00.00.00.00.00.00.00.00.00.0
ES−0.1−0.1−0.20.00.00.00.00.00.0−0.2−0.10.30.2−0.1−0.5−0.2
SE −0.1 −0.10.0−0.10.0−0.1−0.1−0.10.0−0.2−0.1 −0.1−0.1
CH0.00.00.00.00.00.00.00.00.00.00.00.00.00.00.00.0
TR0.00.00.00.00.00.00.00.00.00.00.00.00.00.00.00.0
UK0.0−0.10.0−0.1−0.1−0.2−0.1−0.1−0.1−0.1−0.1−0.1−0.1−0.1−0.1−0.1
AVR.0.0−0.10.0−0.1−0.1−0.2−0.1−0.1−0.1−0.1−0.1−0.1−0.1−0.1−0.1−0.1
Max.0.50.20.60.00.20.00.00.00.50.50.50.50.20.10.30.0
Min.−0.6−0.6−0.7−0.7−0.4−0.8−0.7−0.5−0.4−0.8−0.8−0.5−0.5−0.6−0.6−0.6
Source: Authors’ results synthesis, 2021.
Figure 9. Tri-dimensional synergies in rapport with air emissions intensity of industry (X17). Source: Authors’ representation.
Energies 15 00276 g009

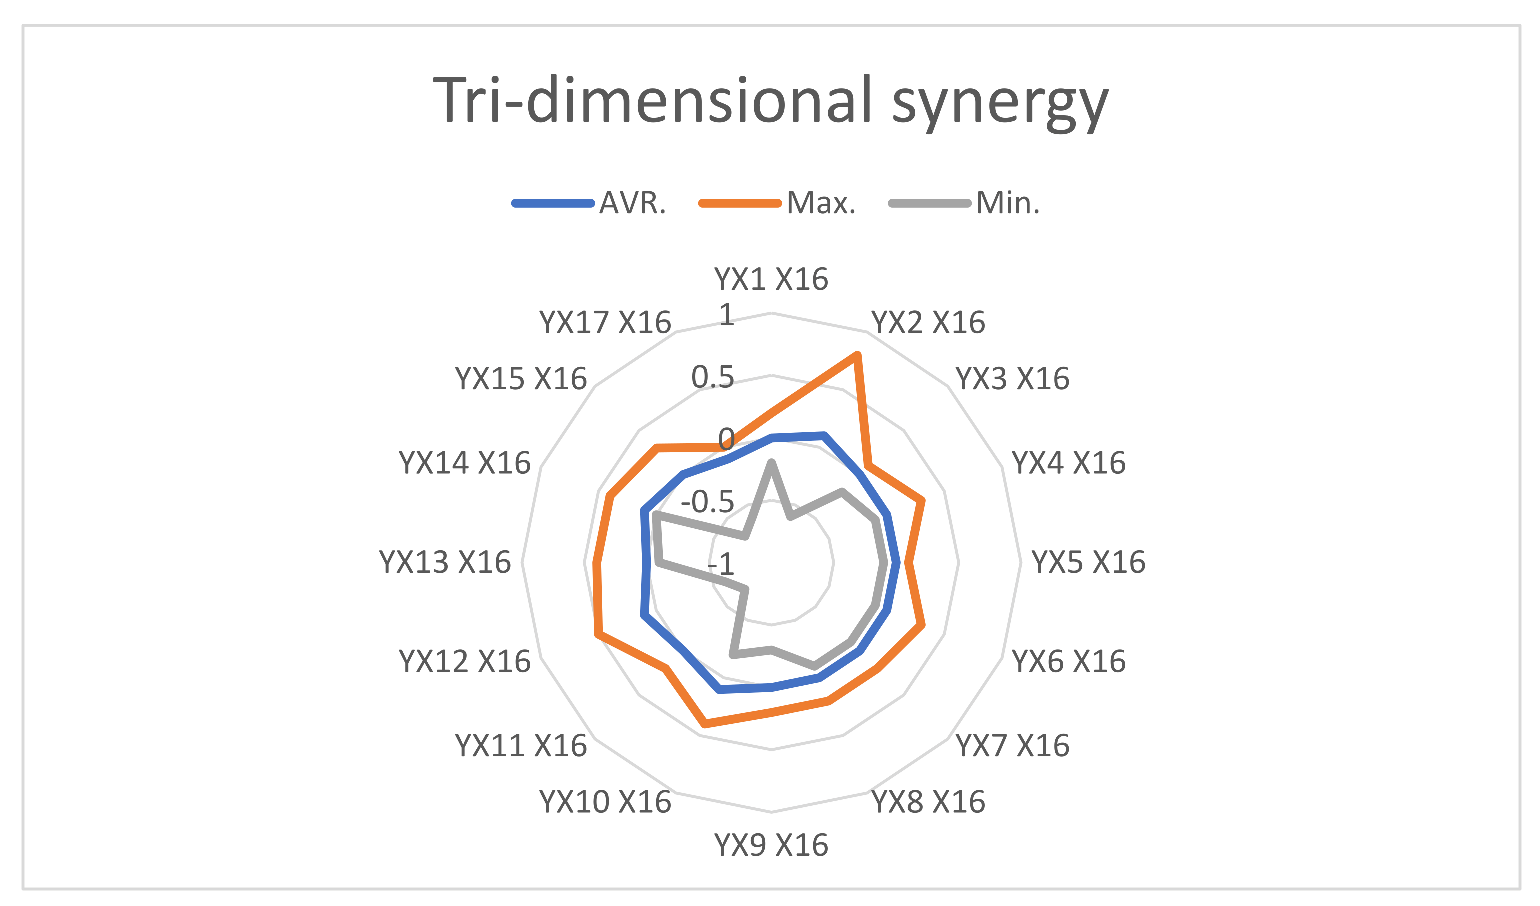
4.2.6. Wealth/Real GDP per Capita (X16)

The results for the tri-dimensional synergy between the share of renewable energy from the gross final consumption, the real GDP per capita, and the third dimension has returned the following information (Table 12, Figure 10):
  • The lowest synergy levels at 0.1 are with X2, X10, X12, and X13, as it is delinked from the other variables;
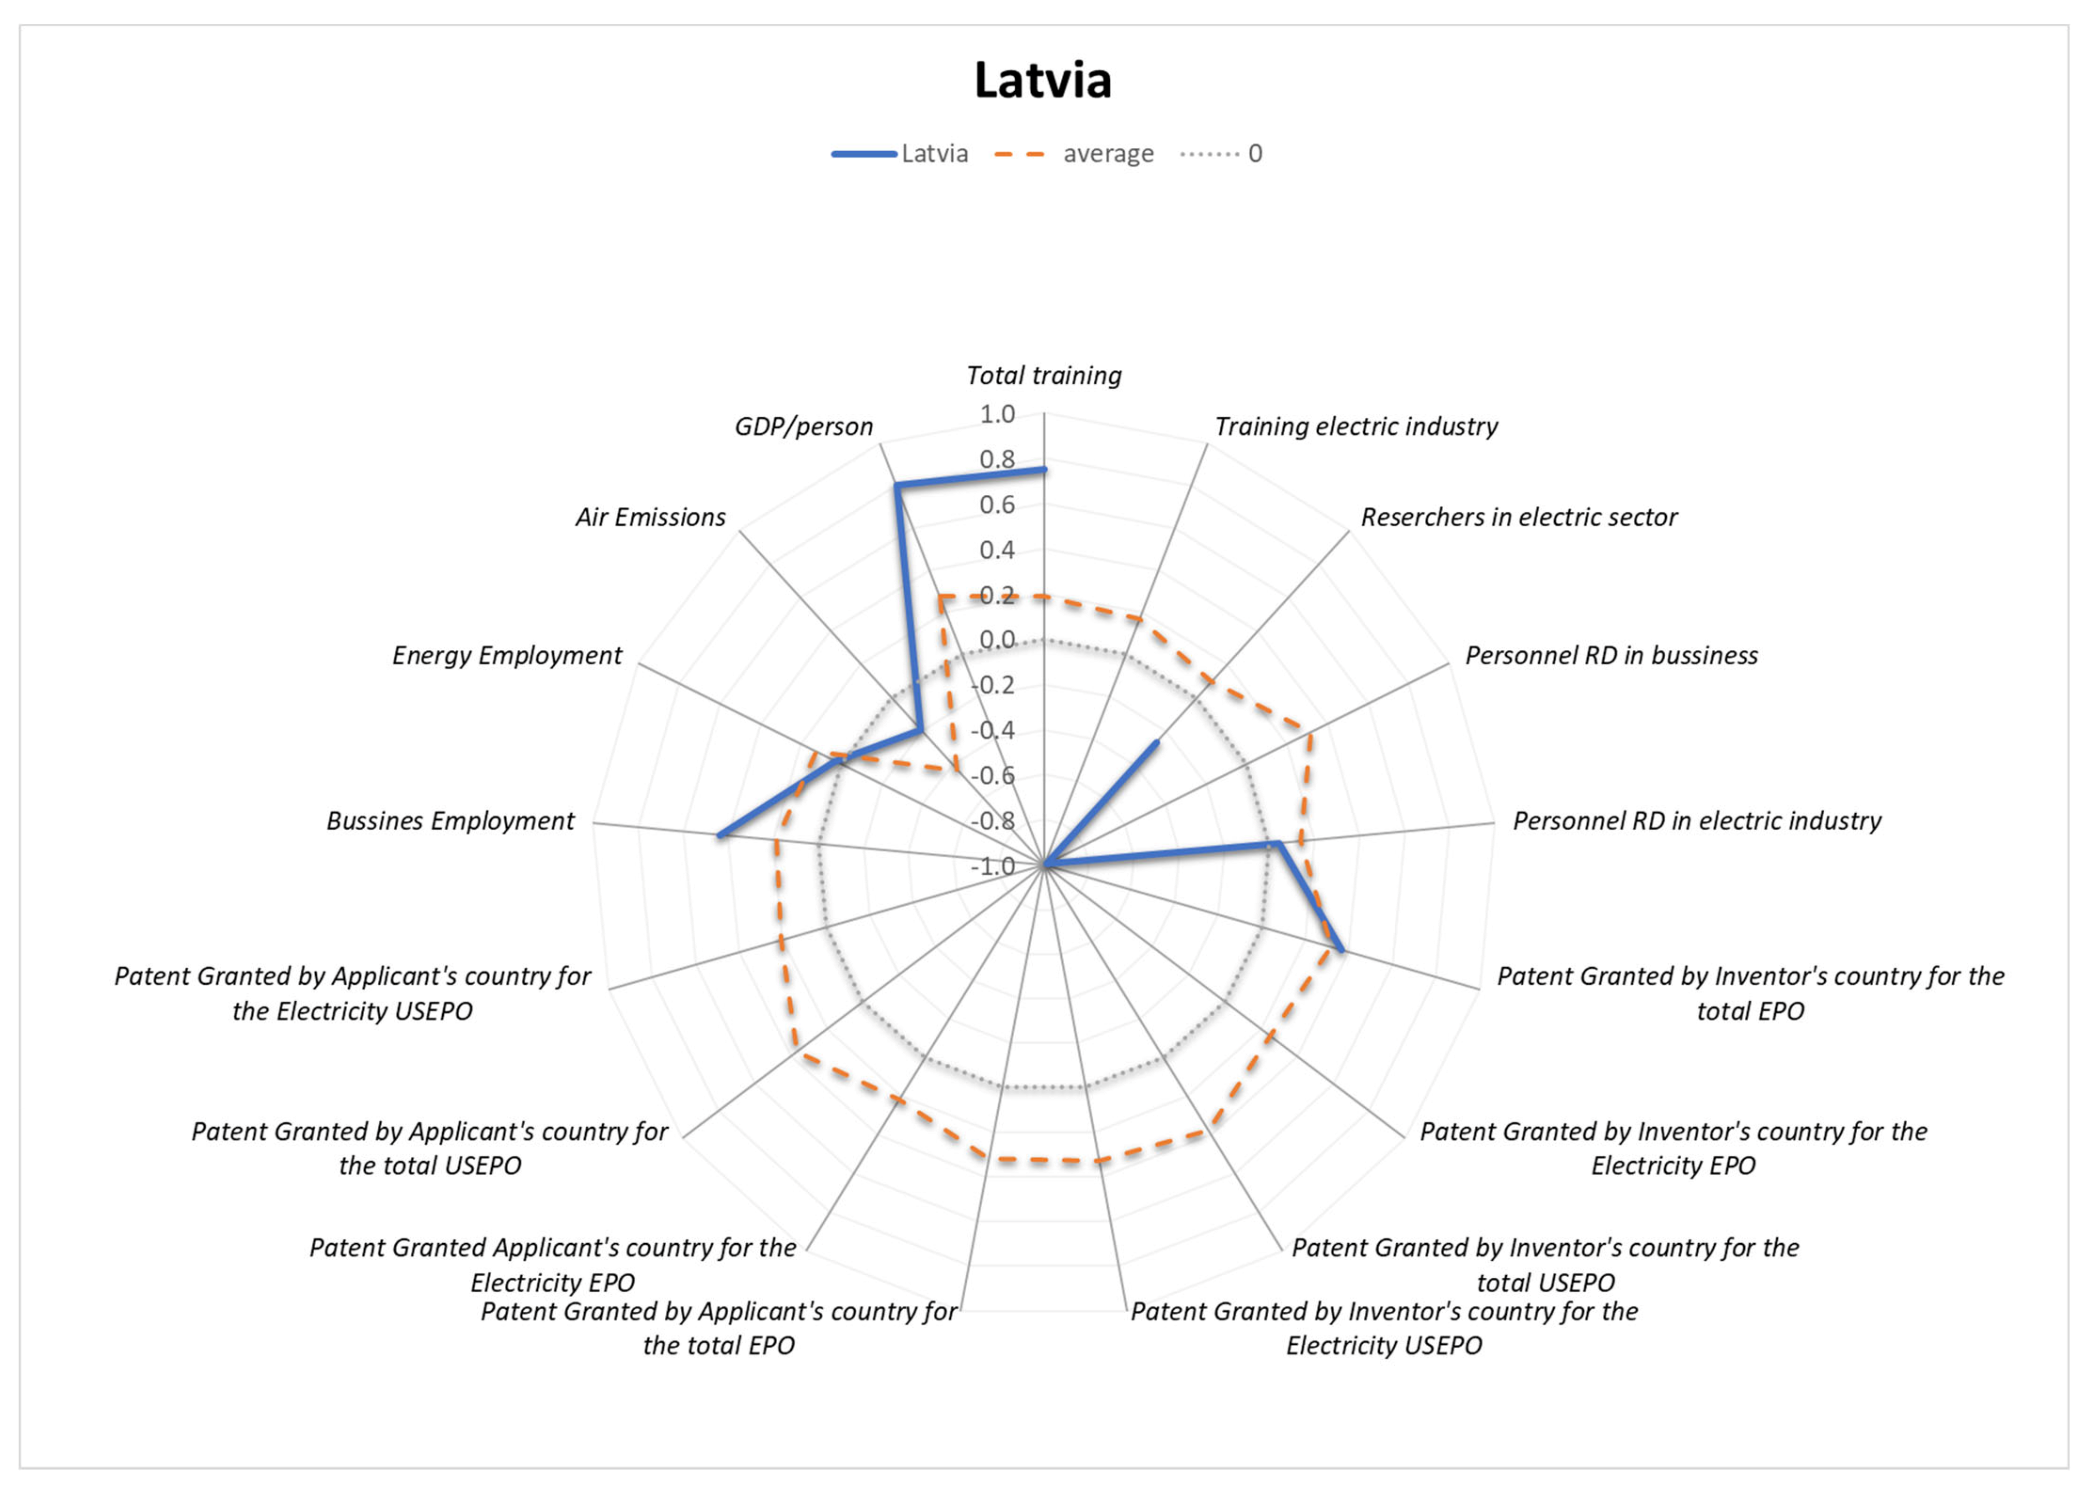
  • Total training (X12) represents the most successful variable for Norway and Sweden with synergies at 0.4 and for Latvia and Slovakia at 0.5;
  • R&D personnel in business (X2) realizes the maximum 3D synergies for Romania at 0.8. This result showcases the technological KT process from the main company to subsidiaries (only in the private sector).
Table 12. Tri-dimensional synergy—YXiX16.
YX1X16YX2X16YX3X16YX4X16YX5X16YX6X16YX7X16YX8X16YX9X16YX10X16YX11X16YX12X16YX13X16YX14X16YX15X16YX17X16
AT0.10.00.10.00.00.00.00.00.00.00.00.30.10.00.10.0
BE0.00.00.00.00.00.00.00.00.00.00.00.00.00.00.00.0
CZ0.20.10.10.10.00.00.00.00.00.10.20.10.10.00.0−0.1
DK−0.1 −0.10.10.00.10.10.10.00.10.10.00.00.00.0−0.1
EE0.20.00.00.00.00.10.00.10.00.40.00.2 0.1−0.1−0.3
FI0.10.00.00.00.00.10.10.00.00.10.10.10.10.10.1−0.1
FR0.10.10.00.10.00.10.10.10.00.10.10.00.00.00.0−0.1
DE0.00.00.00.10.10.00.10.10.10.00.00.00.00.00.00.0
EL0.0−0.10.0−0.10.0−0.1−0.1−0.1 −0.10.0−0.1 0.00.00.0
HU−0.10.0−0.10.10.00.00.00.00.20.20.00.0 0.2−0.10.0
IS0.00.00.00.00.00.00.00.0 0.00.00.0 0.00.0
IE−0.20.3−0.20.30.10.30.20.10.00.20.20.1 0.10.0−0.3
IT0.00.00.00.00.00.00.00.00.00.00.00.00.00.00.00.0
LV−0.2−0.60.00.2 0.3 0.2 0.3 0.5 0.30.0−0.1
LT−0.10.20.00.00.00.20.00.00.10.20.10.1 0.00.0−0.1
LU 0.0 0.00.00.00.00.00.00.00.00.0 0.00.00.0
NL0.10.10.10.00.10.10.00.00.10.00.00.00.00.00.0−0.1
NO 0.0 0.00.00.00.00.0−0.30.0−0.40.40.30.10.3−0.2
PL0.20.00.10.00.00.00.00.00.00.10.1−0.1−0.1 −0.10.0
PT−0.10.0−0.10.00.00.00.00.0 0.00.00.0 0.00.1−0.1
RO−0.10.8−0.10.00.00.00.00.0 0.3−0.4−0.6 0.4−0.4−0.6
SK 0.1 0.10.10.10.00.1−0.3−0.2−0.70.5 0.4−0.7−0.2
SI0.00.00.00.0−0.10.00.00.00.00.00.00.00.00.00.10.0
ES0.00.00.00.00.00.00.00.00.00.00.0−0.1−0.10.00.2−0.2
SE 0.4 0.00.00.00.00.00.00.00.00.40.4 0.2−0.1
CH0.00.00.00.00.00.00.00.00.00.00.00.00.00.00.00.0
TR0.00.00.00.00.00.00.00.00.00.00.00.00.00.00.00.0
UK0.00.10.00.00.00.00.00.00.00.10.00.10.00.10.0−0.1
AVR.0.00.10.00.00.00.00.00.00.00.10.00.10.00.10.0−0.1
Max.0.20.80.10.30.10.30.20.20.20.40.20.50.40.40.30.0
Min.−0.2−0.6−0.2−0.1−0.1−0.1−0.1−0.1−0.3−0.2−0.7−0.6−0.10.0−0.7−0.6
Figure 10. Tri-dimensional synergies in rapport with wealth/real GDP per capita (X16). Source: Authors’ representation.
Energies 15 00276 g010

5. Discussion

The evaluation of the national models for KT policies in the renewable energy sector and their synergic effects in the creation of jobs has been assessed at an EU level based on the bi-dimensional synergies.
The combined framework that determines the formation of knowledge represents the basis for innovation exploitation, knowledge transfer, and synergy. According to the information disclosed by this study, there are particular synergies born out of the combined efforts and work of different elements and mechanisms of the energy sector, and, at the same time, there is no doubt that the occurrence of trade-offs is significant and influences the realization of sustainable development targets across the European area. The next stage of the study is meant to bring insight into the particularities of the tested countries in order to make statements based on regional knowledge transfer occurrence. Each figure below is represented through the country radar line for its status quo, the European area average, and the null state—where there is neither synergy nor a trade-off occurrence.

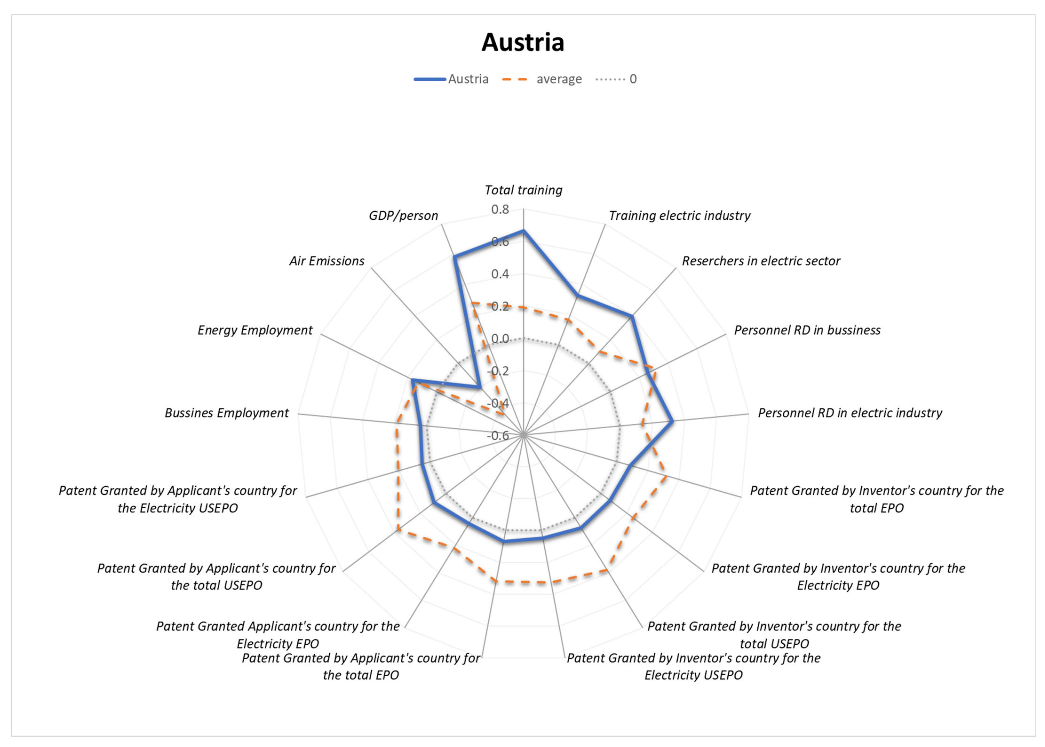
5.1. Austria—Implementer Profile

In the case of Austria, Figure 11 discloses (almost) synergies in rapport with the Total training and Real GDP per capita. Therefore, it can be stated that SDG 9 and SDG 4 are significantly represented in the model, which result from the occurrence of knowledge transfer through formal and informal channels, with the scope of building resilient and sustainable infrastructure and industrialization, as well as of ensuring the access to equitable and qualitative education, particularly for the energy sector. Across the other indicators, pertaining to intellectual property and employment, there are no synergies visible. Regarding the environmental footprint of the energy sector, there appears to be the case of a trade-off occurrence, stating that the lack of knowledge transfer determined a stagnation or drop in the development of the energy system.

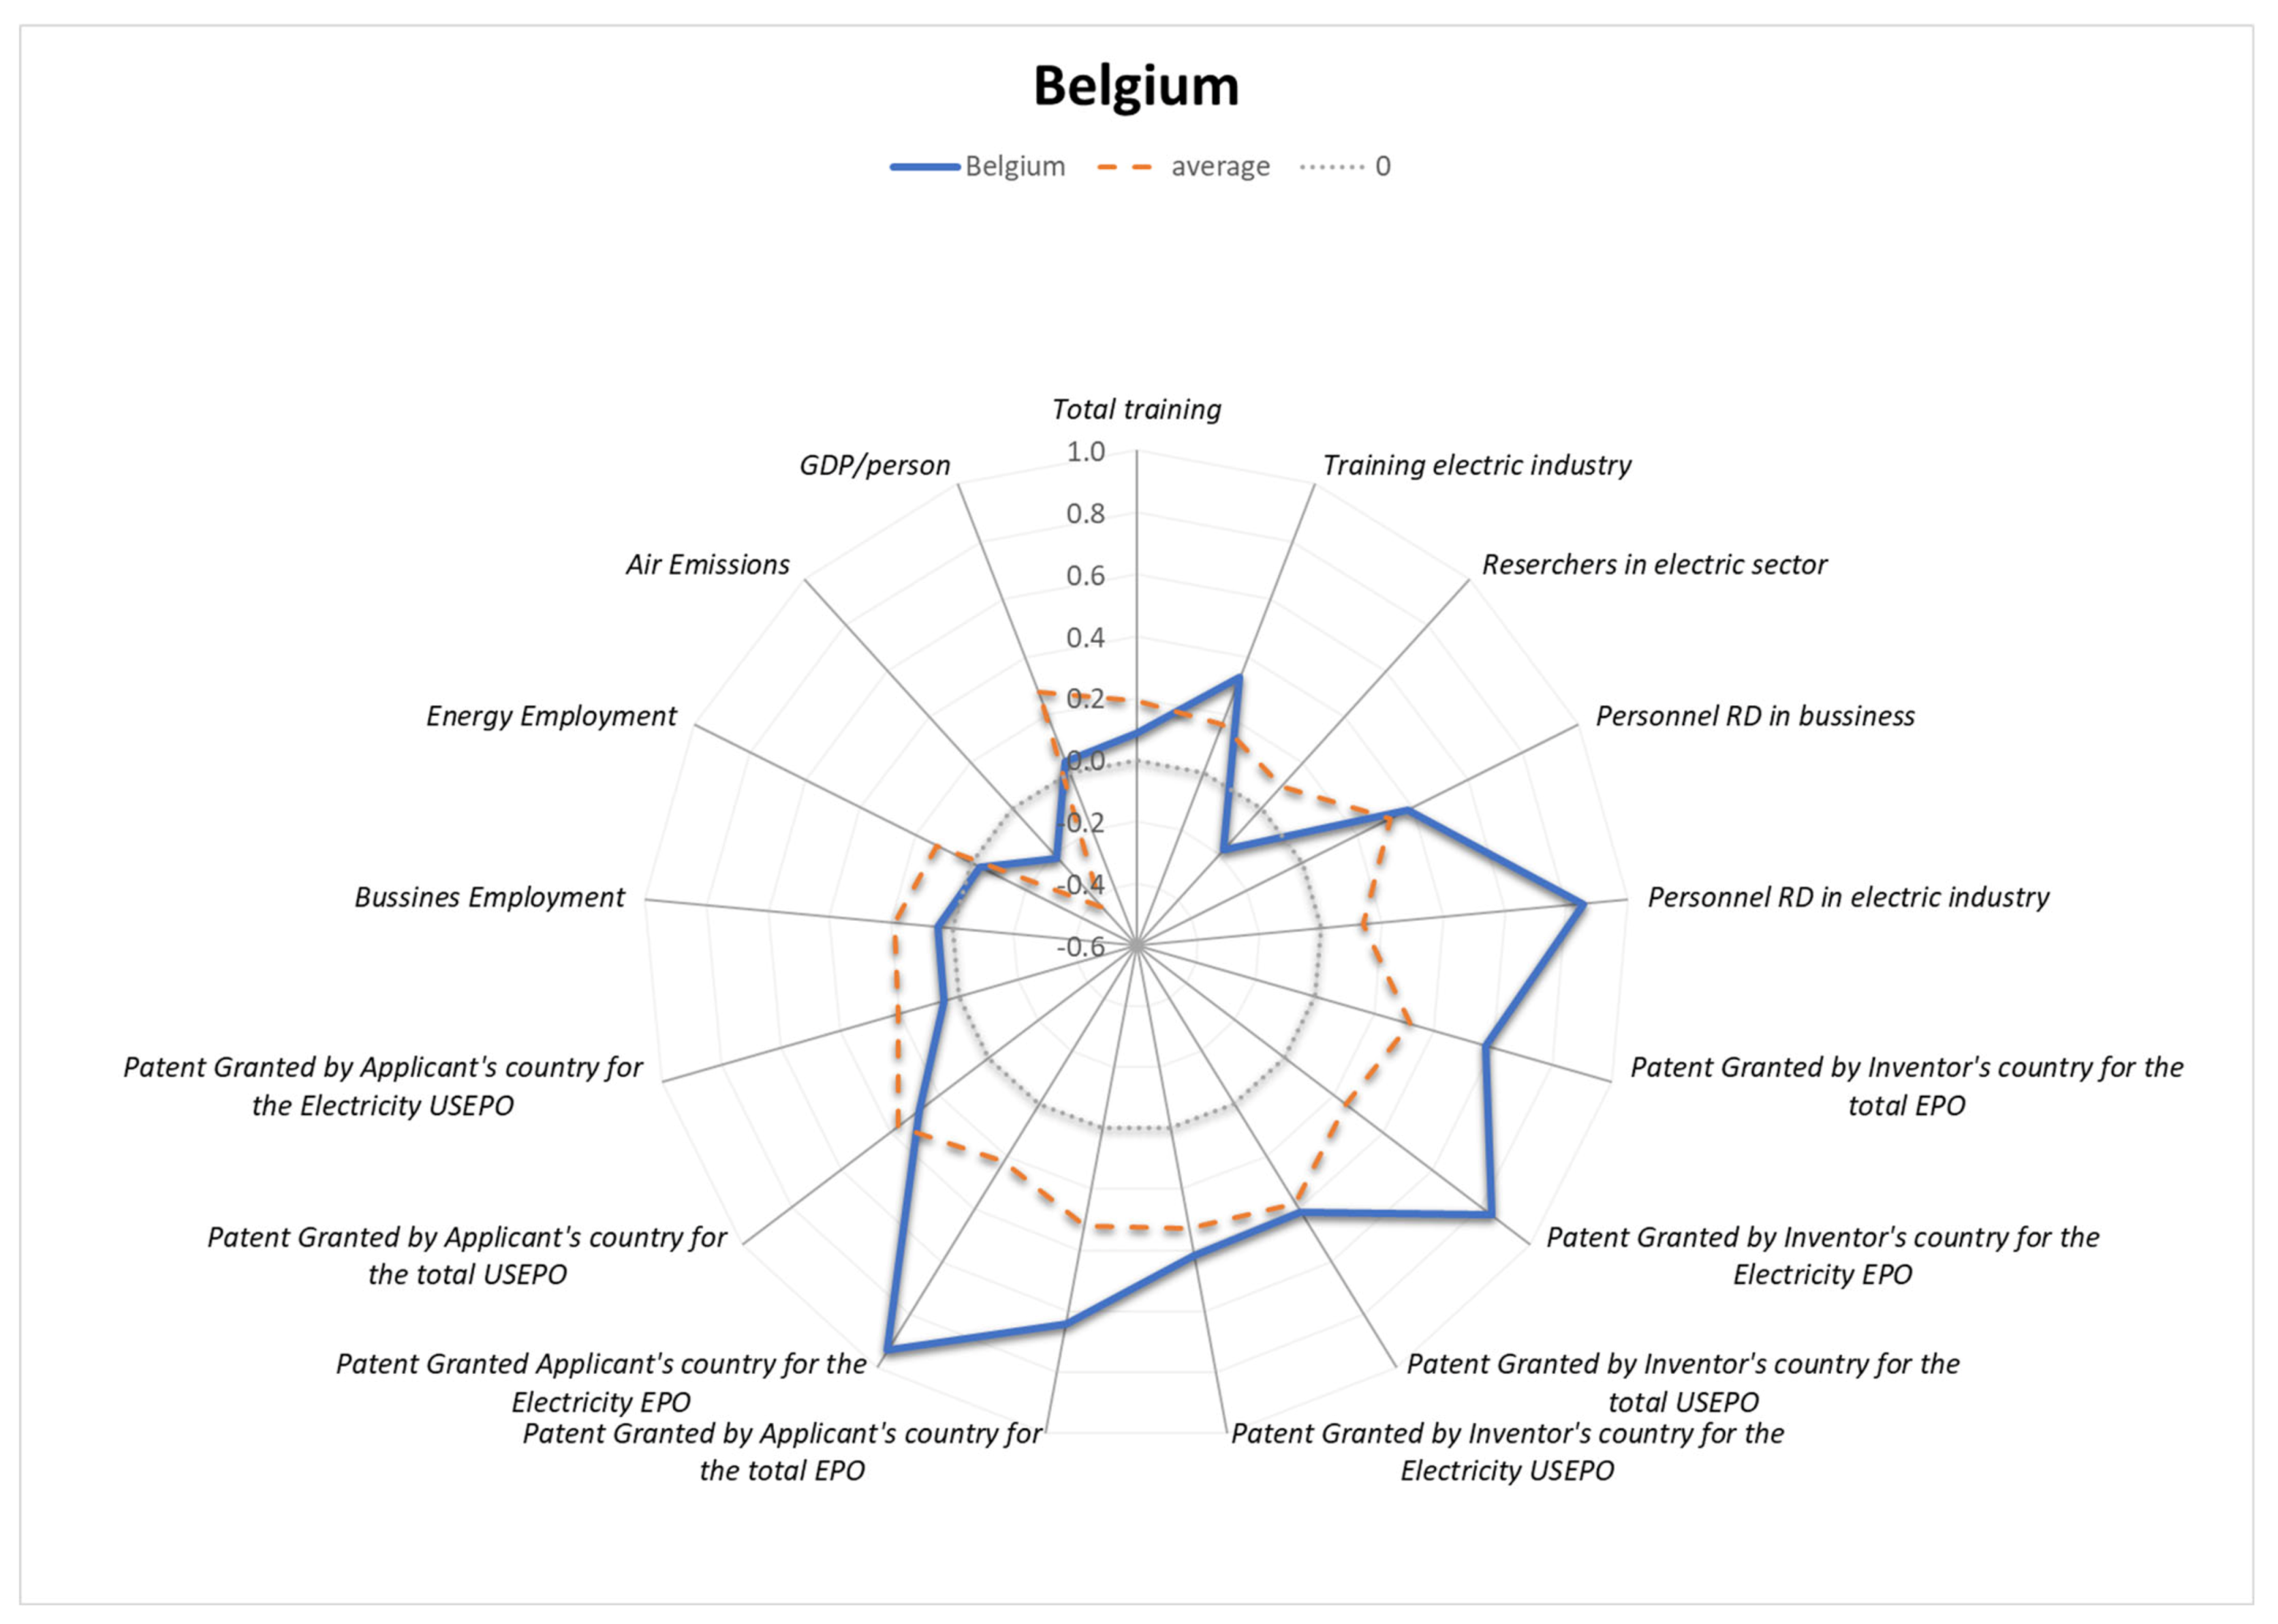
5.2. Belgium—Global Innovator

The situation of Belgium is represented by Figure 12, which discloses a completely different situation than the one observed for Austria. The synergies in this case occurred via R&D personnel in the electric industry, Patent granted by inventor’s country for the electricity EPO, and Patent granted by the applicant’s country for the electricity EPO. Here, it is visible that the intellectual property has the potential to determine synergy formation in the energy sector through the transfer of formal, explicit knowledge. Therefore, the energy sector presumably transforms into a greener one (SDG 7) that is directly influenced by the result of the KT synergies. Nevertheless, Belgium also presents some below European average indicators, showcasing the occurrence of trade-offs, particularly related to the Researchers internal personnel (energy) and the Employment in enterprises. The lack of knowledge transfers in this dimension has a direct and significant impact on the registered progress toward sustainable development targets and objectives, particularly SDG 9 and SDG 8.

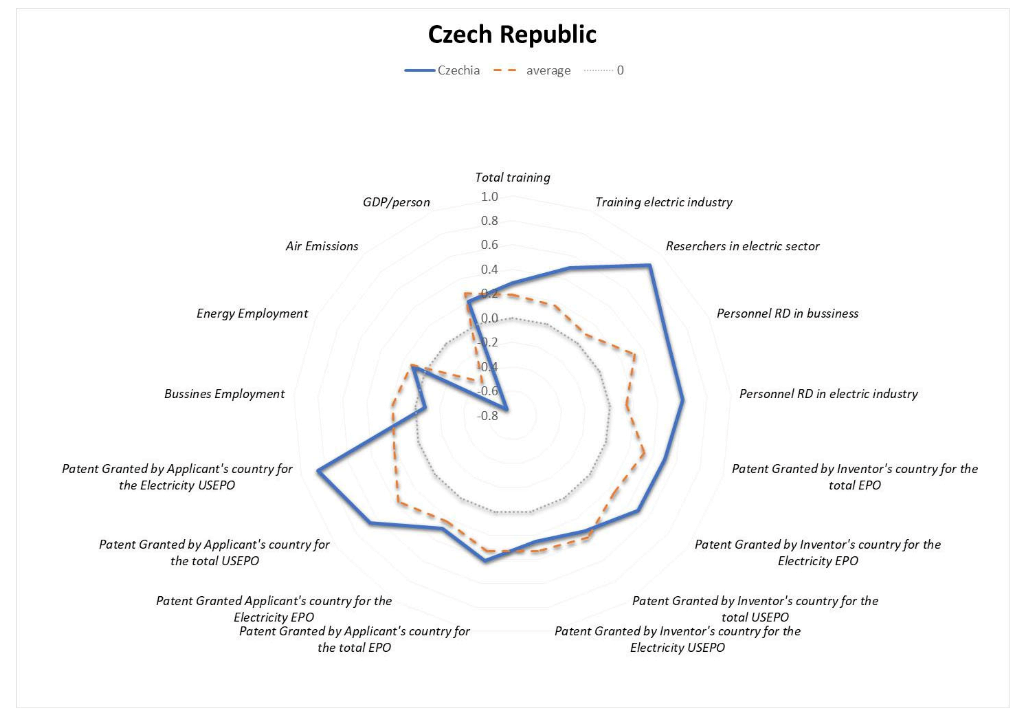
5.3. Czech Republic—Integrator Profile

The Czech Republic (Figure 13) presents a model that is almost entirely above the European average, with (almost) perfect synergies via R&D personnel in the electric industry and the Patent granted by applicant’s country for the electricity EPO. The most significant trade-offs visible in the model are the one related to the Air emissions intensity of industry and the Employment in enterprises indicators. From the information granted by the radar chart, the knowledge transfer (formal and explicit) has managed to create the premises for synergy occurrence from the perspective of enhanced and resilient infrastructure development and sustainable industrialization via innovation and research (SDG 9), while significantly veering away from the sustained economic growth and efficiency in resource consumption and production (SDG 8).

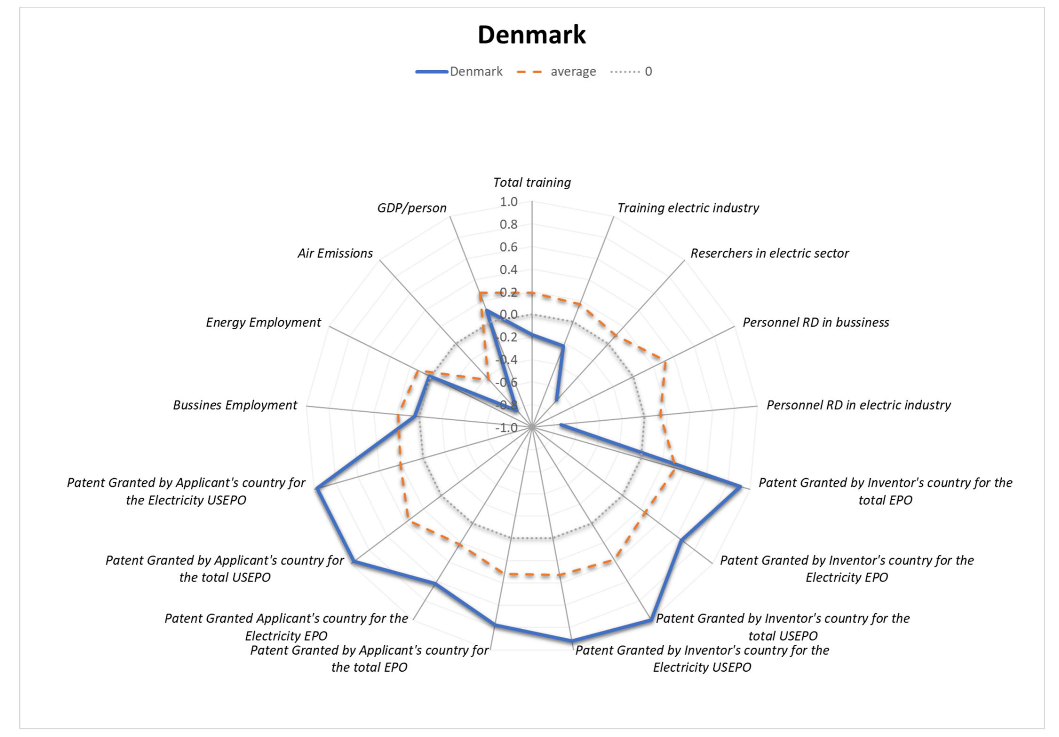
5.4. Denmark—Global Innovator

Denmark (Figure 14) is presenting knowledge transfers through the synergy occurrence in patent applications and grants. All the other indicators are either moderately impacting the knowledge transfer process or are showcasing a trade-off situation. For the Employment rate indicators, Denmark proposes an alignment to the European average in terms of policies and measures related to job creation and development, as well as to policies measured through the perspectives of greening the economy. Moreover, the adult participation in learning does not arrive to the average levels, demonstrating the inability to showcase knowledge transfers within the energy sector. The R&D and innovation category is not represented in the model for Denmark. It can be stated that the targets and objectives of SDG 9 are visibly achieved in this country, although the KT does not seem to fulfill the goal of universal access to modern energy services, increased access to renewable energy, access to quality education, or sustained economic growth.

5.5. Estonia—Local Innovator

Estonia (Figure 15) proposes a perfect synergy in rapport to the Patent granted by applicant’s country for the total USEPO, while almost all the other variables are indicating the lack of synergies or trade-offs. The indicators stand more or less in line with the European average, envisioning progress toward SDG 9 to the detriment of the other SDGs considered for the study.

5.6. Finland—Integrator Profile

In the case of Finland (Figure 16), the synergies occur via knowledge transfer from the perspective of patent grants and applications for the electricity EPO/USEPO, with a visible trade-off in the case of air emissions intensity of industry. The KT process in the energy sector in Finland directs toward significant progress in SDG 9 to the detriment of the other sustainable development goals considered in the study.

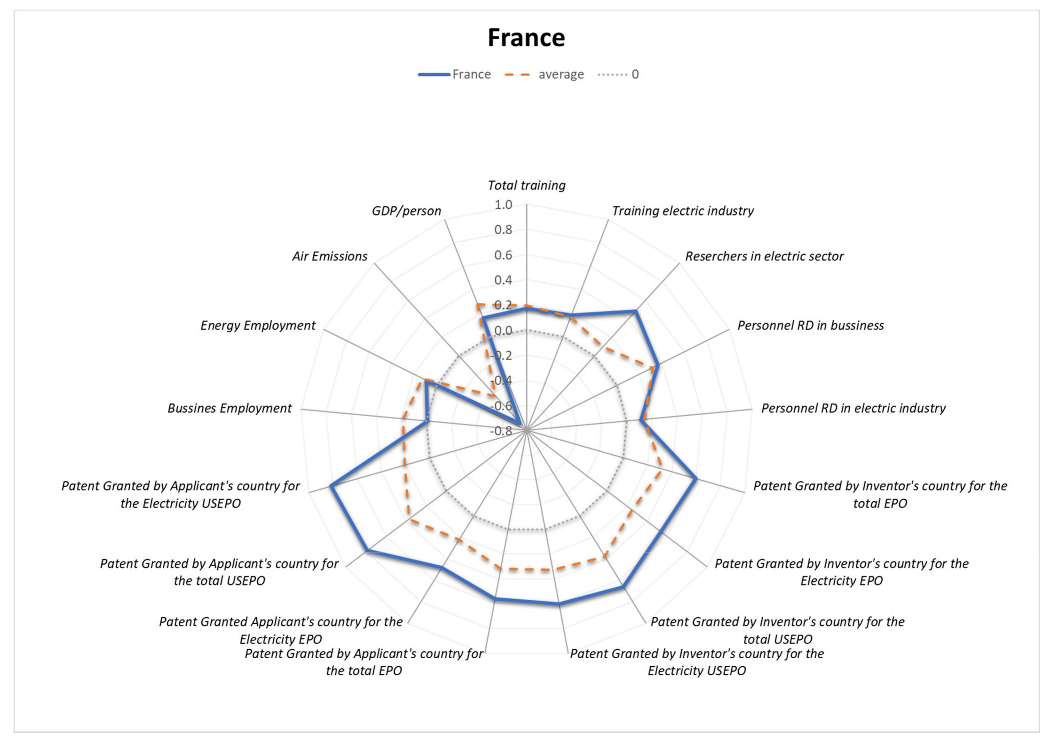
5.7. France—Global Innovator

France (Figure 17) does not showcase outliers, having registered (mostly) close to the average indicators’ value. There is an apparent synergy in rapport with patent applications and grants for electricity USEPO and for total USEPO while representing a trade-off related to the air emissions intensity of industry. Generally, the knowledge transfer occurs in the energy sector of France due to the positive mechanisms established by patent applications and grants through formal and explicit channels related to the sustainable development of infrastructure and industrialization (SDG 9). Nevertheless, the other indicators do not showcase significant progress toward SDGs via KT synergies in the energy sector.

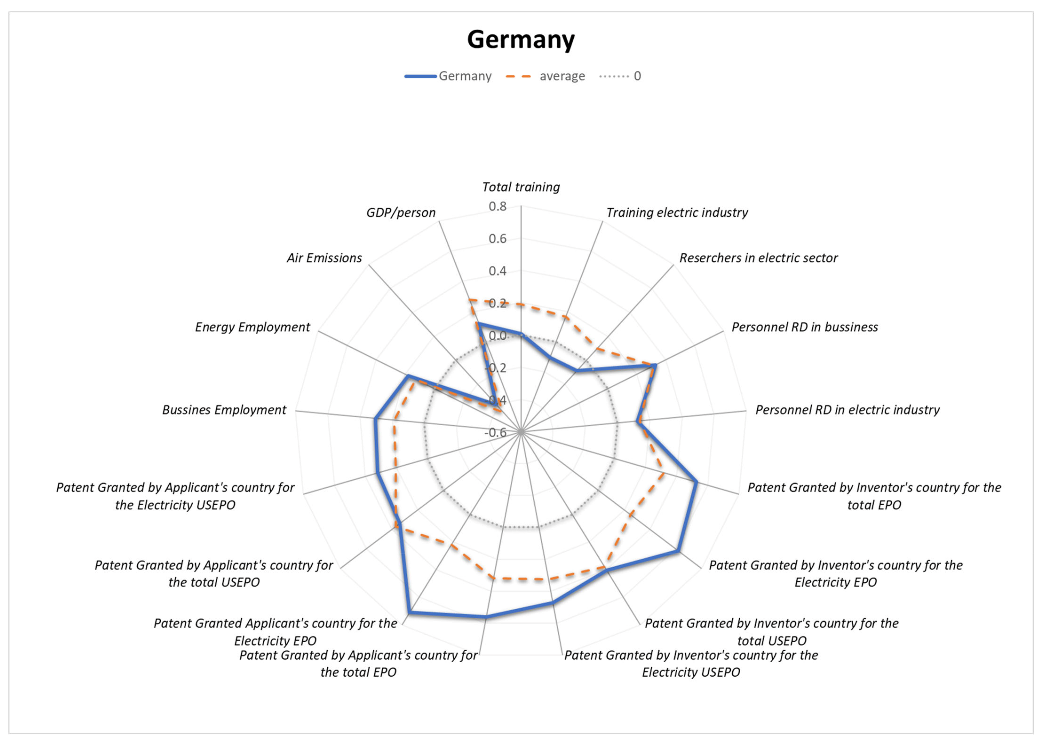
5.8. Germany—Global Innovator

In Figure 18, the model depicts the occurrence of synergies and trade-offs of the share of renewable energy in the gross final consumption in the case of Germany. As in Figure 17 (France), Germany stands more or less in line with the European average, showcasing synergies in rapport with the patent applications and grants (SDG 9). The visible trade-off is related to the perspective of sustainable industry, as there is a lack of knowledge transfer observable through the policies measured in terms of greening the economy.

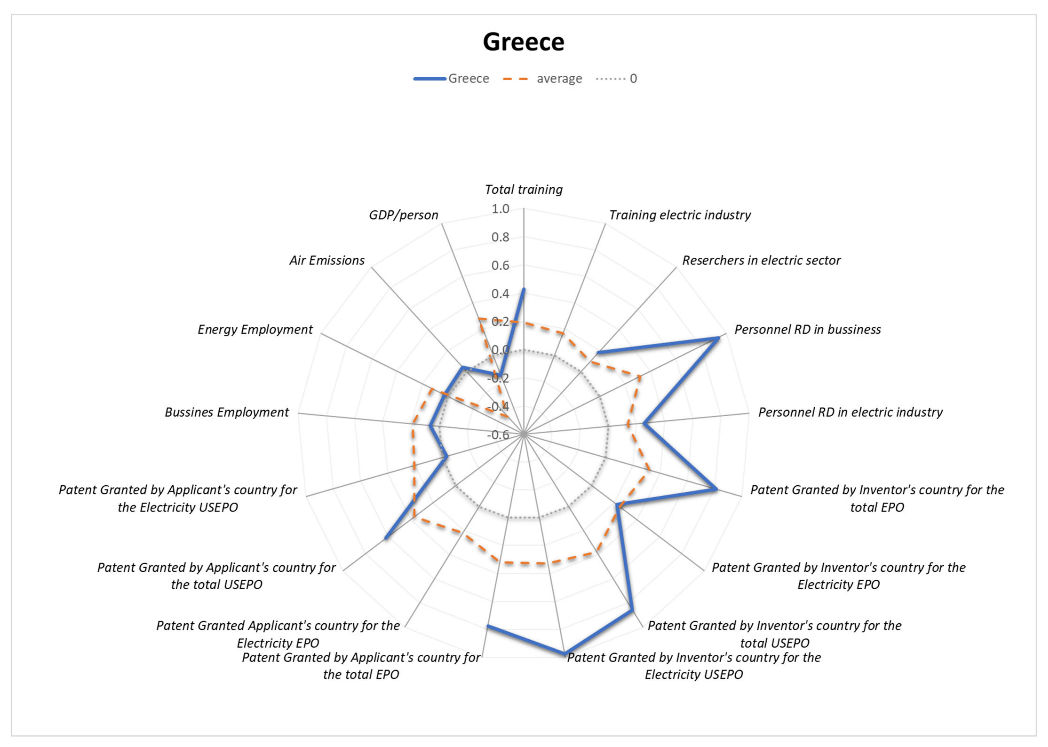
5.9. Greece—Global Innovator

In Figure 19, the model presents the estimations for Greece, which, compared to all the other countries included in the study before (namely Austria, Belgium, Czech Republic, Denmark, Estonia, Finland, France, and Germany), showcases a clear differentiation from the European average. For instance, while the majority of countries presented a trade-off of energy sector and sustainable industry (air emissions intensity of industry), the model for Greece is represented by an above-average indicator of null value. Moreover, there are certain indicators that presented no value in the calculations, while there are a few indicators (R&D personnel in business, Patent granted by inventor’s country for the total EPO, Patent granted by inventor’s country for the total USEPO, Patents granted by the inventor’s country for the electricity USEPO) highlighting the presence of synergies.

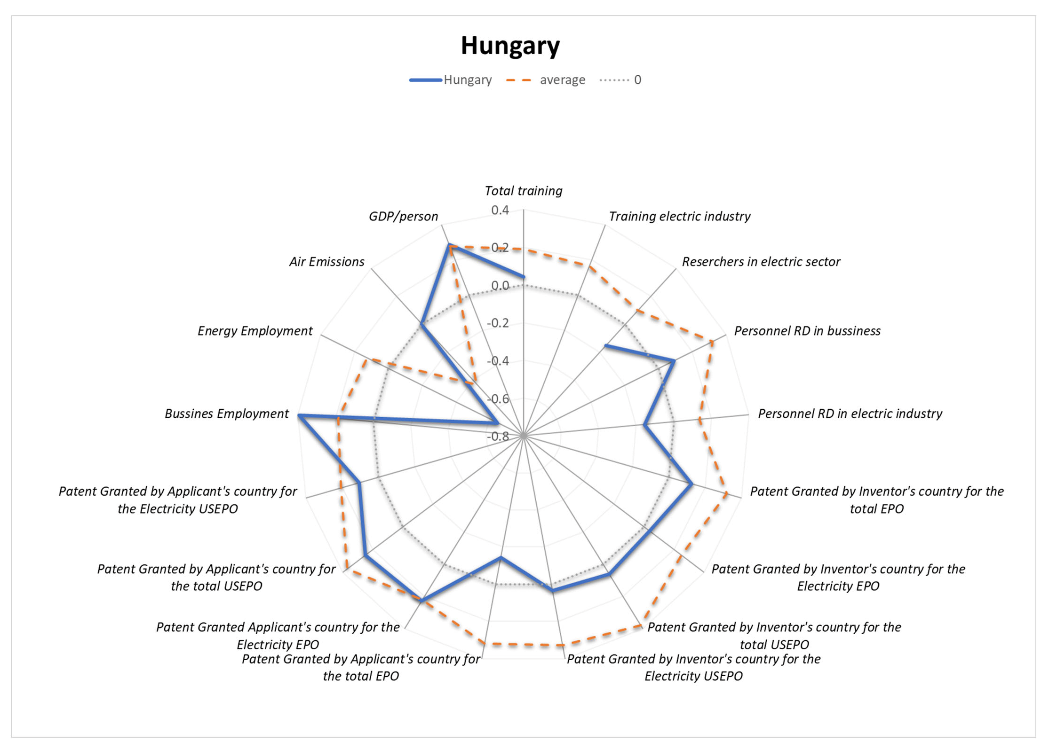
5.10. Hungary—Global Innovator

The model for Hungary (Figure 20) places almost all indicators below the European average, showing a clear lack of synergies of renewable energy share in the gross final consumption and the indicator categories included in the study. There is a trade-off registration of employment in the energy sector. Therefore, it can be disclosed that the KT for the realization of the SDGs is lagging in Hungary compared to the other European countries.

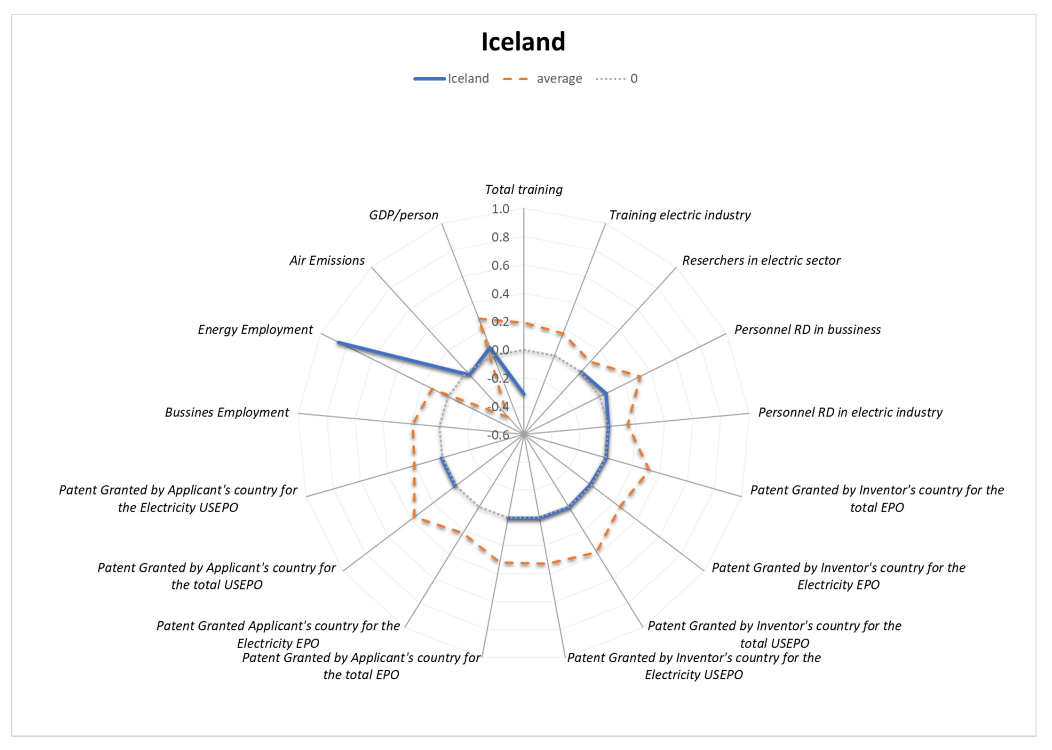
5.11. Iceland—Outlier/No KT

Iceland (Figure 21) is one example of an outlier, as there is a lack of information for all indicators in order to understand the extent of synergy and trade-off occurrence. According to the model above, there is a synergy of the energy sector and the employment rate, underlining that the realization of the objectives and target of SDG 8: sustained economic growth, high levels of economic productivity, efficiency in consumption and production, and well-paid jobs.

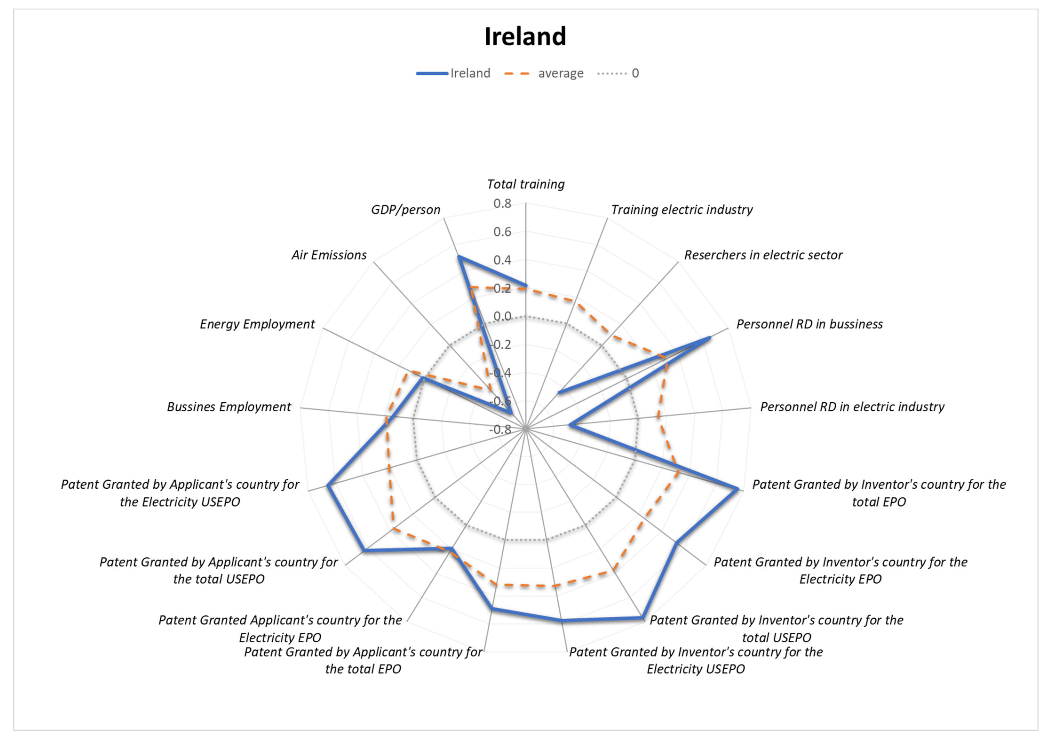
5.12. Ireland—Global Innovator

In Figure 22, the model showcases Ireland’s close to average results. The trade-off appears exactly at the point indicated by the European average in rapport with the air emissions intensity of industry. Another trade-off occurs in relation to the R&D personnel in electric industry and researchers internal personnel (energy). Therefore, the knowledge transfer that should be realized via a formal channel does not occur or is not supported by the current energy sector. The potential synergy signatures identifiable in the model are connected to the R&D and innovation category as well as with the patent applications and grants to the EPO. This means that the explicit, formal knowledge transfer determines the occurrence of synergies in the energy sector.

5.13. Italy—Integrated Player

Italy (Figure 23) follows the same pattern of the West European countries, with representations close to the average. There is a perfect synergy of R&D personnel in business and another synergy of patent grants and the energy sector, highlighting the occurrence of knowledge transfer via formal channels and directing toward the realization of SDG 9.

5.14. Latvia—Implementer

Latvia (Figure 24) had limited information on the synergies and trade-offs of the energy sector in relation to the research indicators. There is a synergy occurrence of renewable energy share of the gross final consumption and the real GDP per capita, demonstrating a formal, explicit knowledge transfer for sustainable economic growth via policies measured in terms of income.

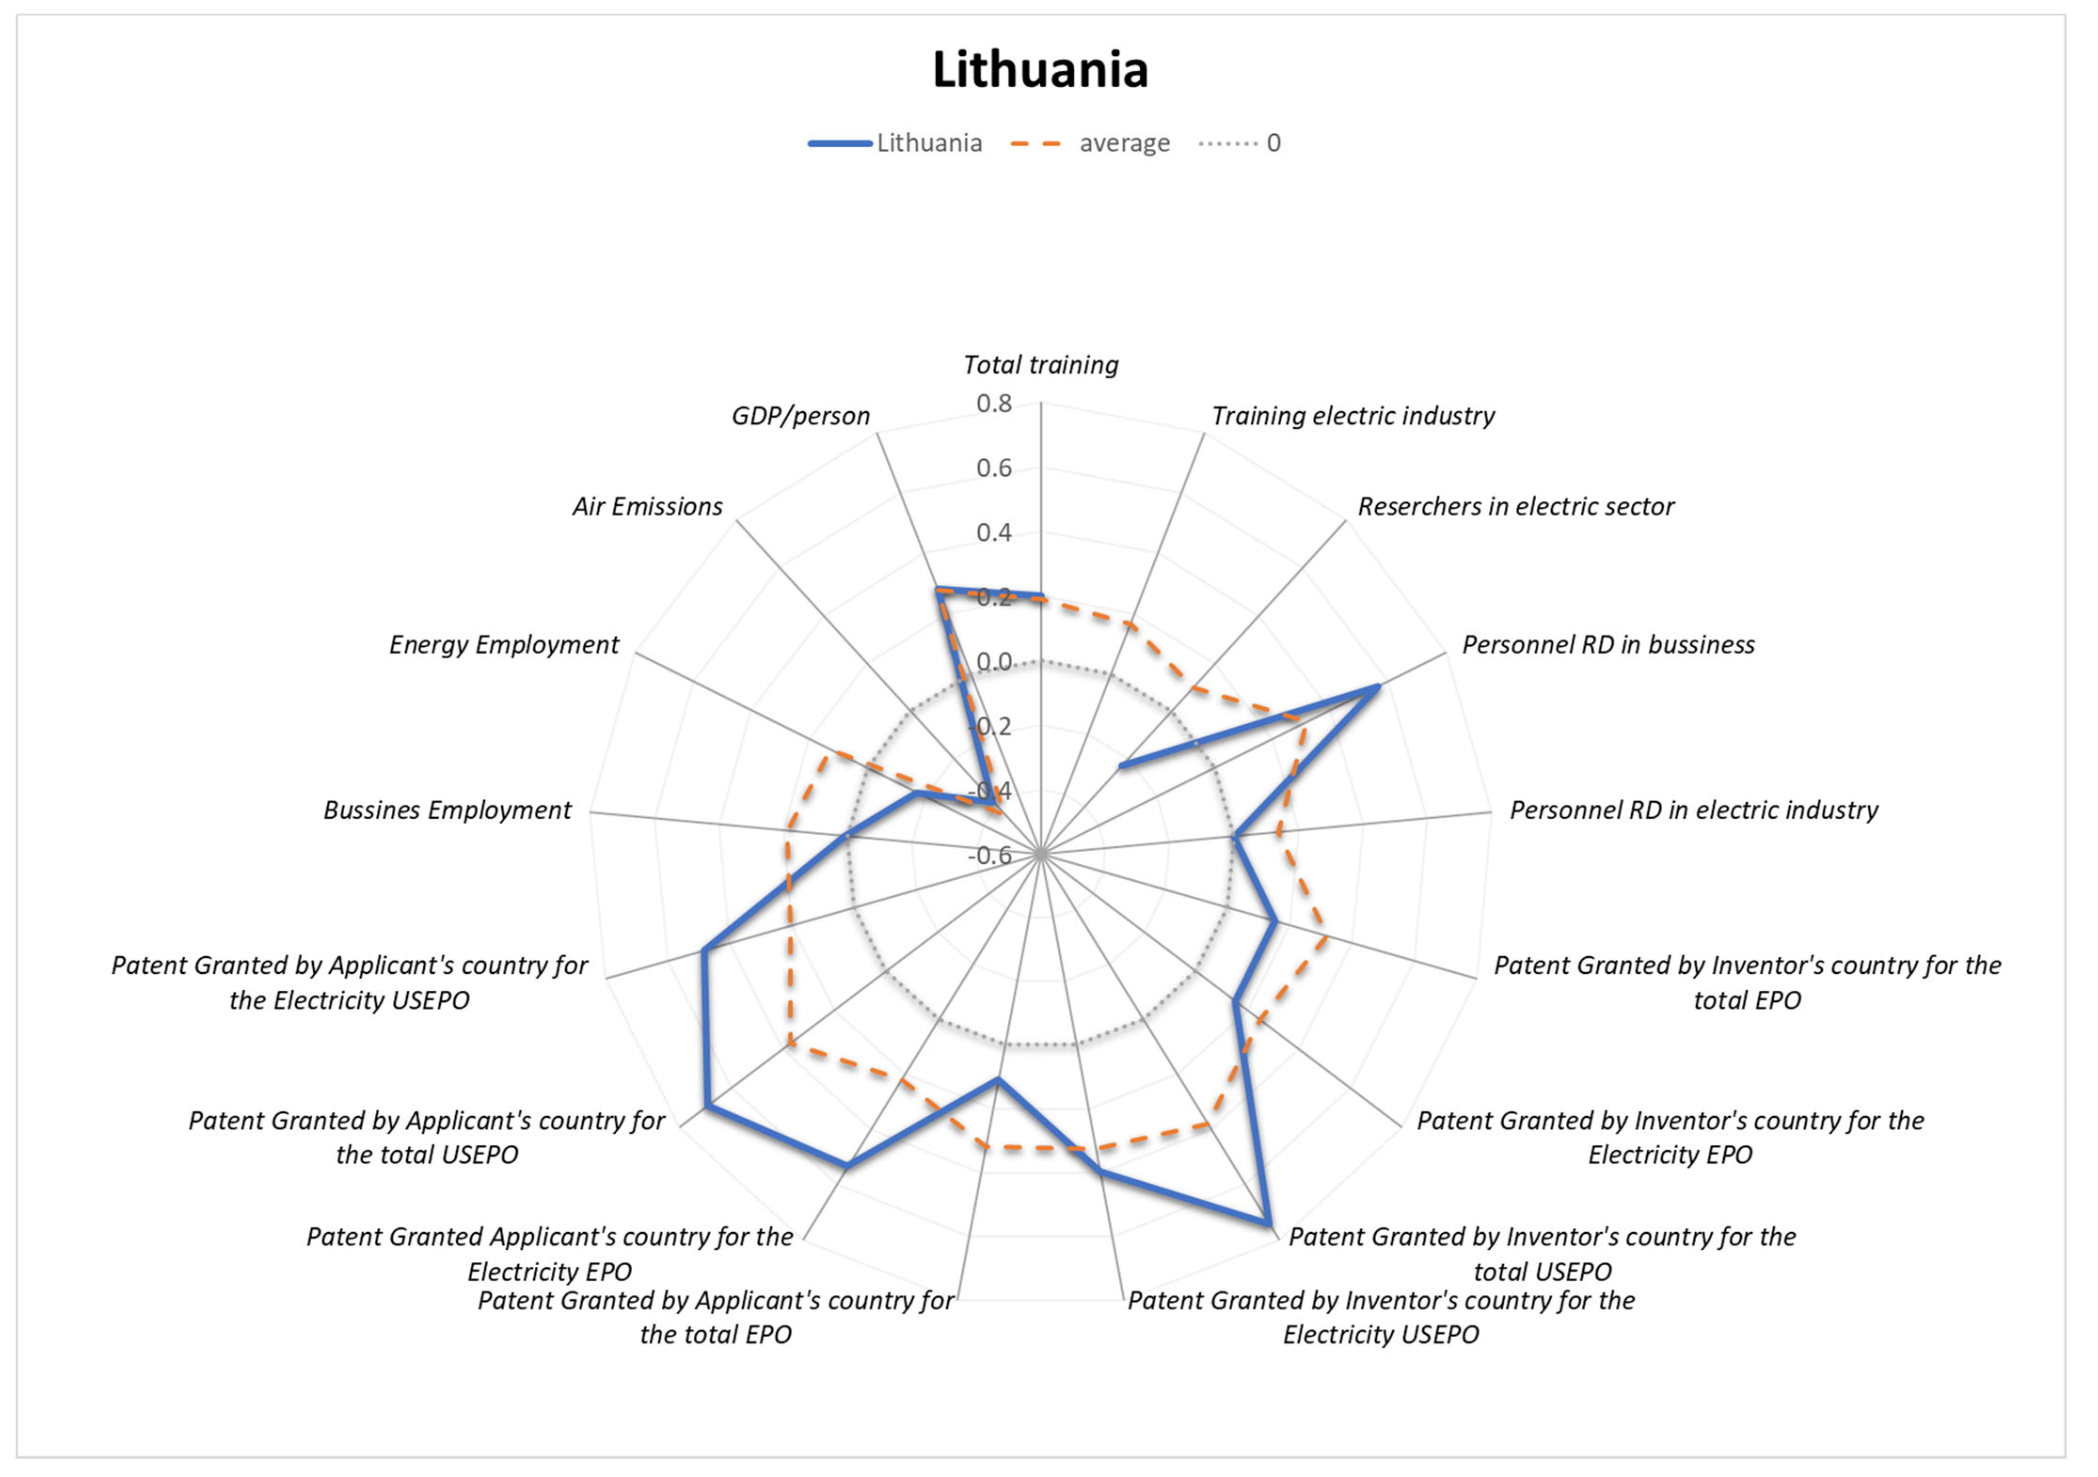
5.15. Lithuania—Global Innovator

In Figure 25, the model’s representation has visible spikes where synergies are occurring. The latter are observed in rapport with the R&D personnel in business, Patent granted by investor’s country for the total USEPO, and Patent granted by applicant’s country for the total USEPO, which are all relevant for SDG 9—indicating the occurrence of knowledge transfer via a formal channel in order to promote the sustainable industrialization and infrastructure development through the provision of socio-economic and environmental solutions.

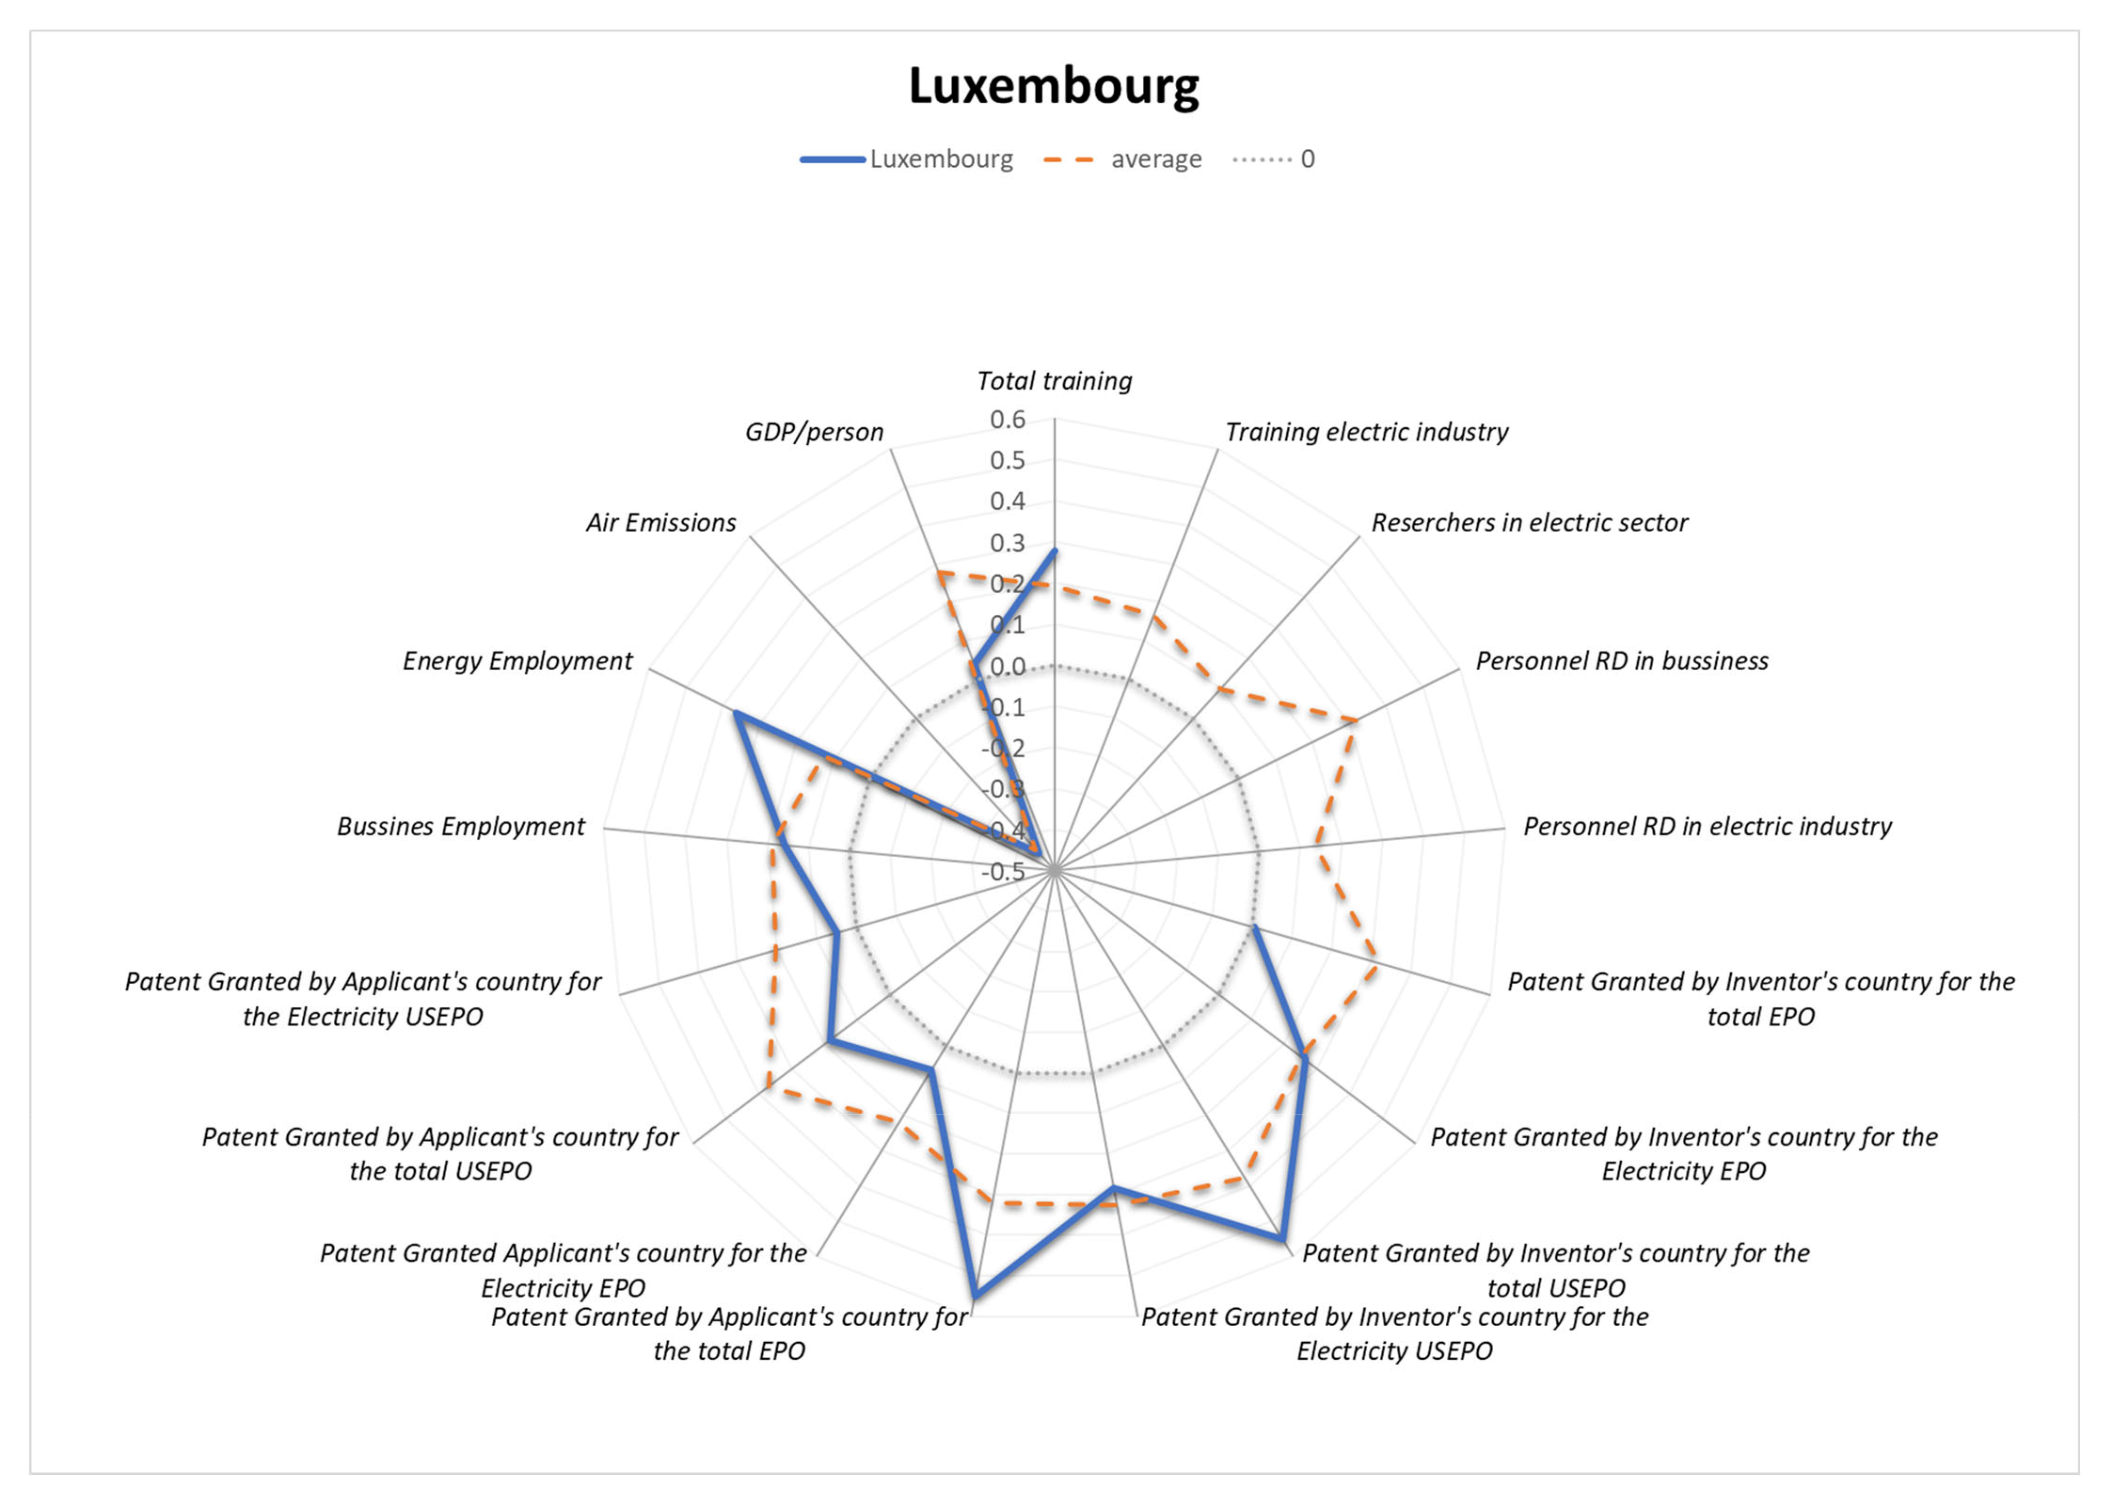
5.16. Luxembourg—(Weak) Global Innovator

Luxembourg (Figure 26) presents knowledge transfers as a determinant of synergies of the energy sector and indicators related to the employment rate and the patent applications and grants. The trade-off occurs exactly as in the case of the European average, in rapport with the sustainable industry (air emissions intensity of industry). Therefore, Luxembourg seems to showcase significant progress toward SDG 9 and SDG 8.

5.17. The Netherlands—Global Innovator

The Netherlands (Figure 27) is aligned with the European average, with the only difference in the spikes experienced by the existence of synergies of the energy sector and R&D and innovation indicators’ category. The knowledge transfer occurs via a formal channel and directly involves the realizations of SDG 9, which determines the building resilience of infrastructure and promotes inclusive and sustainable industrialization.

5.18. Norway—Implementer

The results for Norway (Figure 28) are significantly different from the European average, with energy sector synergies occurring in rapport with adult learning, sustainable economic growth, and employment rate. In this case, the knowledge transfer is performed via formal and informal channels, determining the progress toward target and objective realizations of SDG 4 and SDG 8.
There are trade-offs observable in relation to the patent applications and grants and with the sustainable industry, where the knowledge transfer probably is limited or non-existent.

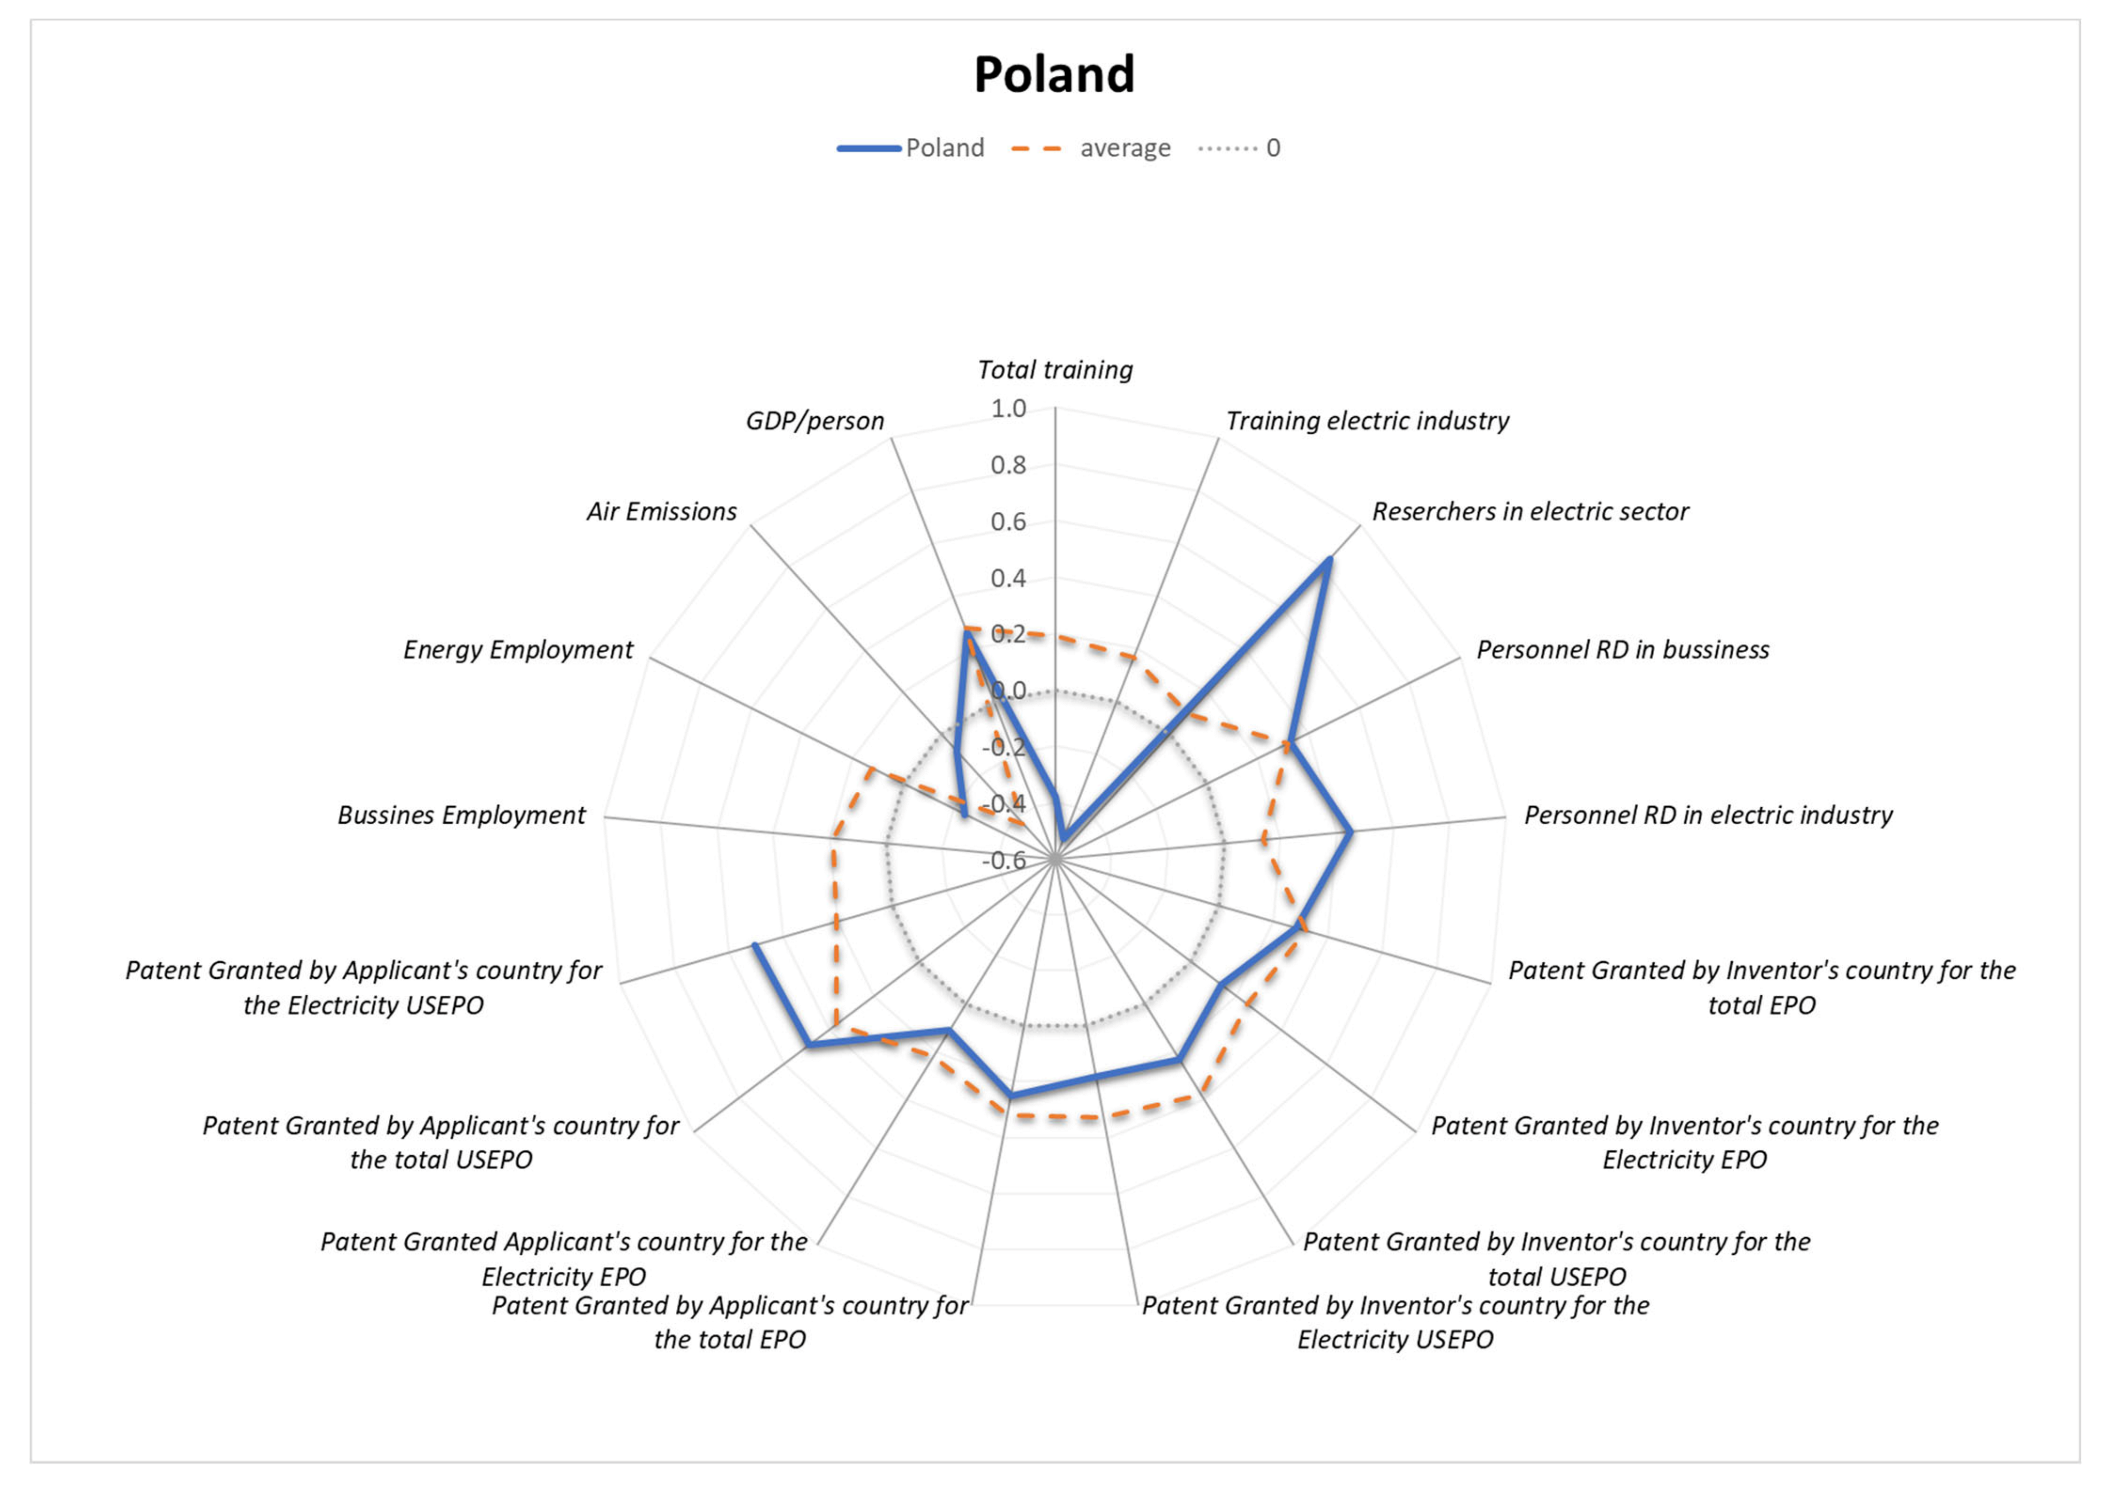
5.19. Poland—Local Innovator

Poland (Figure 29) stands more or less in line with the European average, although the model represents both synergies and trade-offs. The first case relates to the researchers internal personnel (energy), while the latter is observed in relation to the adult learning and sustainable industry indicators. The knowledge transfer is performed via formal channels and is linked to the realization of significant progress in SDG 9.

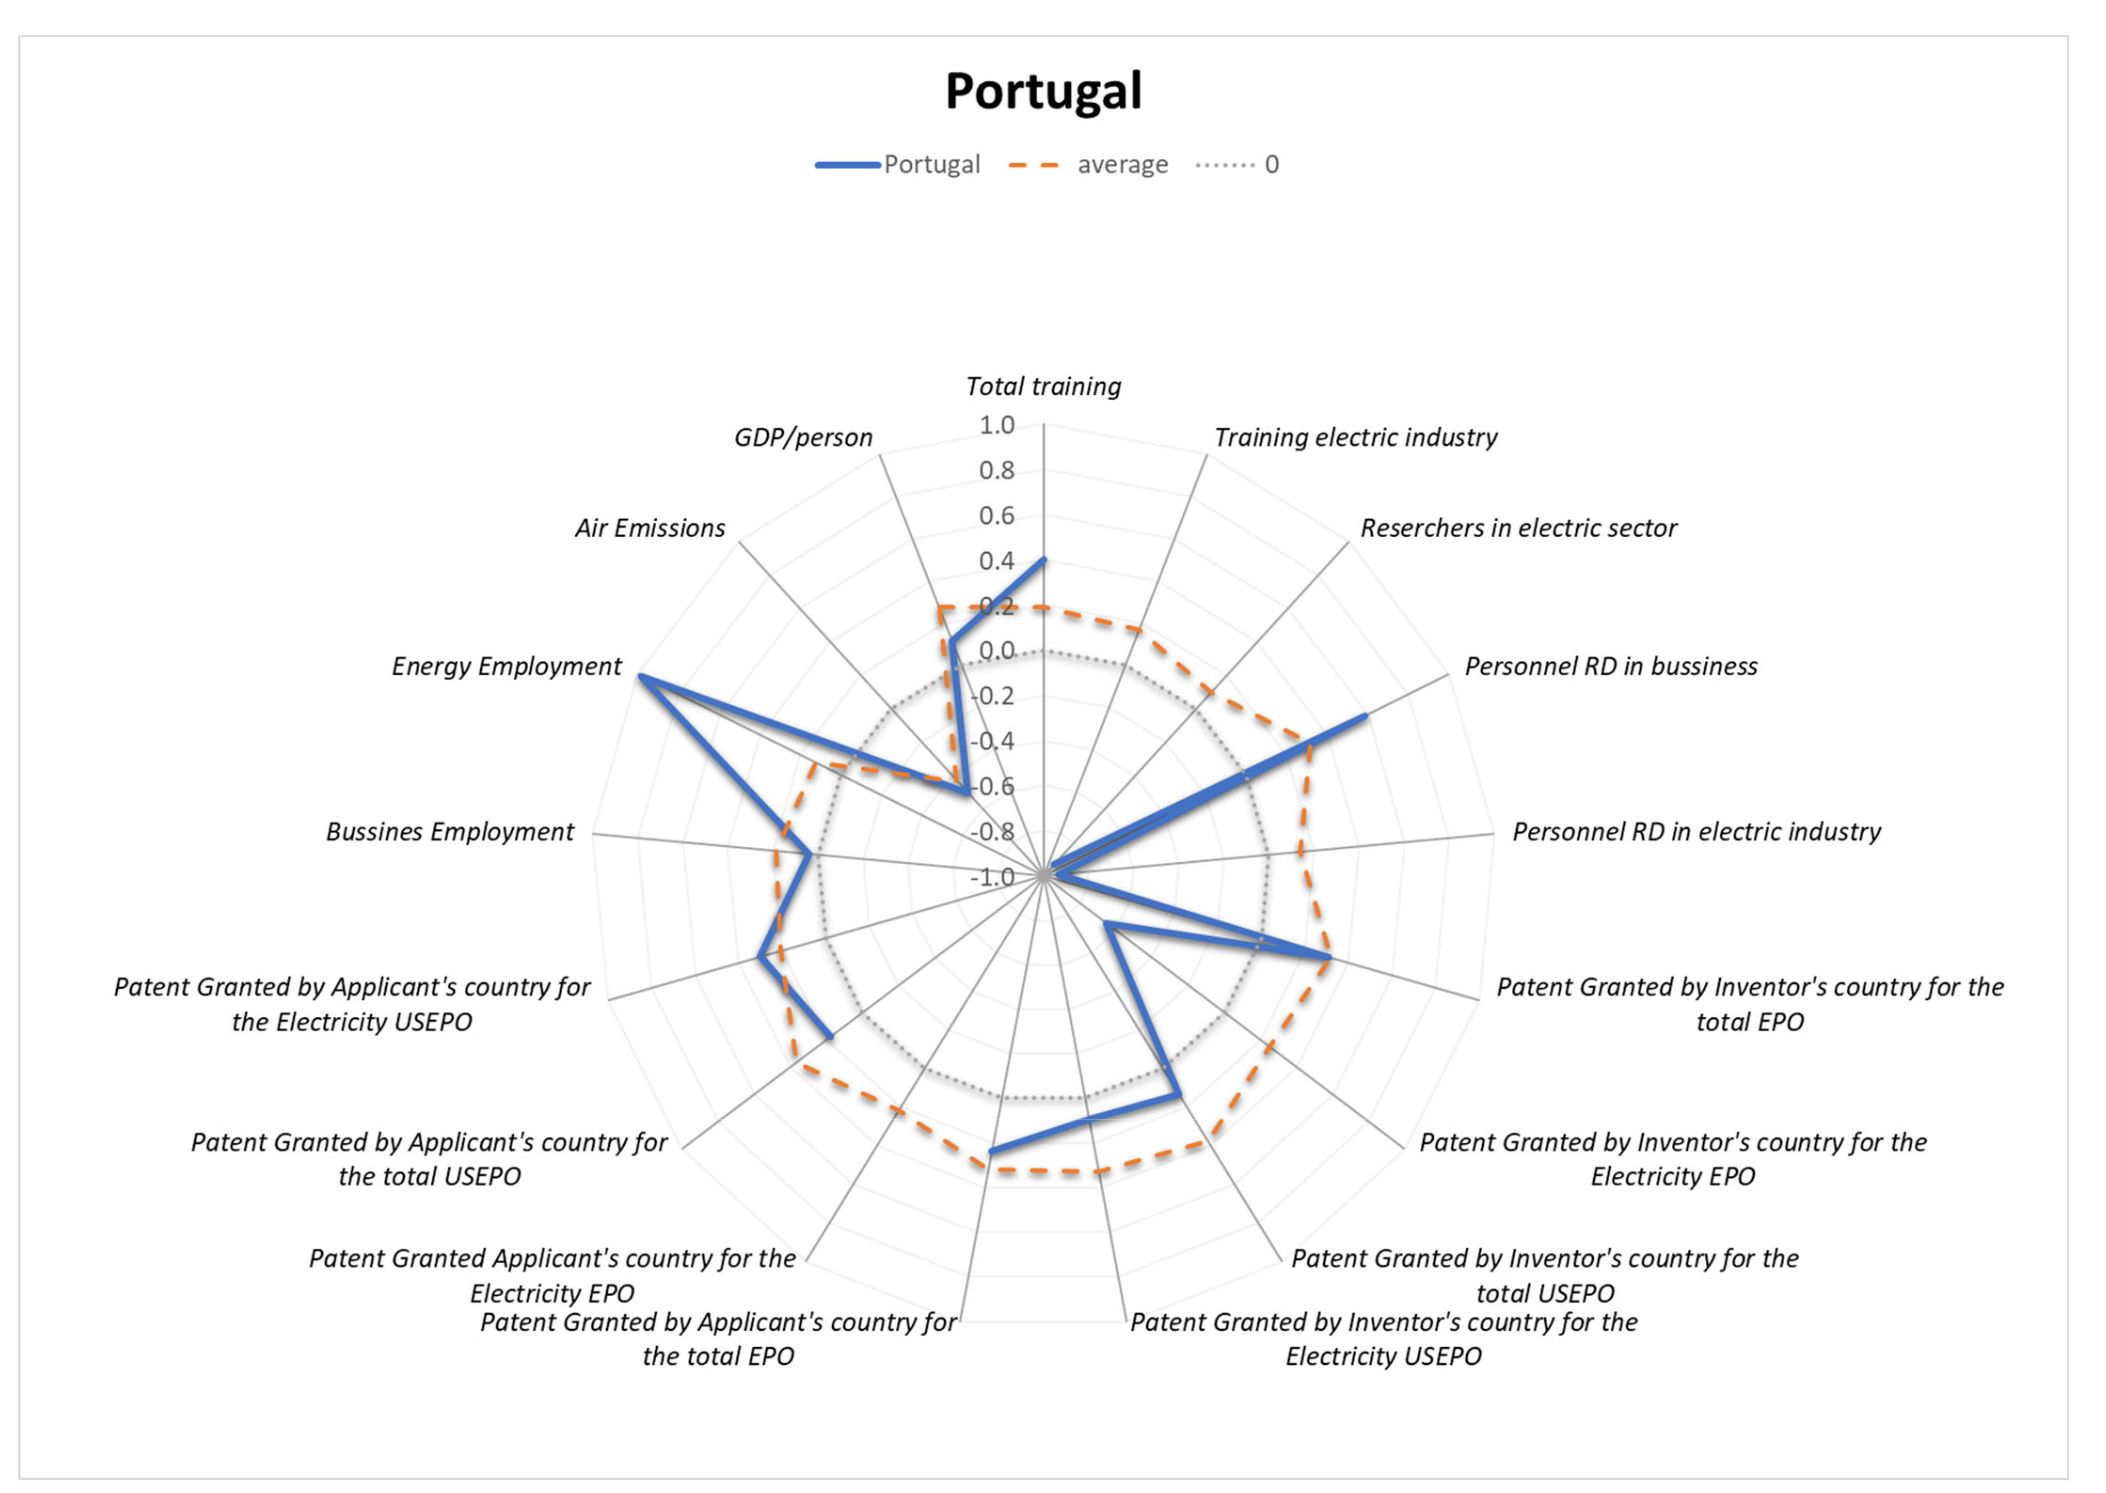
5.20. Portugal—Implementer

For Portugal (Figure 30), the disparities to the European average are considerable, and there are more trade-offs registered compared to synergies. Nevertheless, the knowledge transfer becomes apparent through the synergy of employment rate and R&D and innovation. It can be added that the formal, explicit KT aids the realization of SDG 8 and SDG 9 by recognizing the importance of sustained economic growth and productivity.

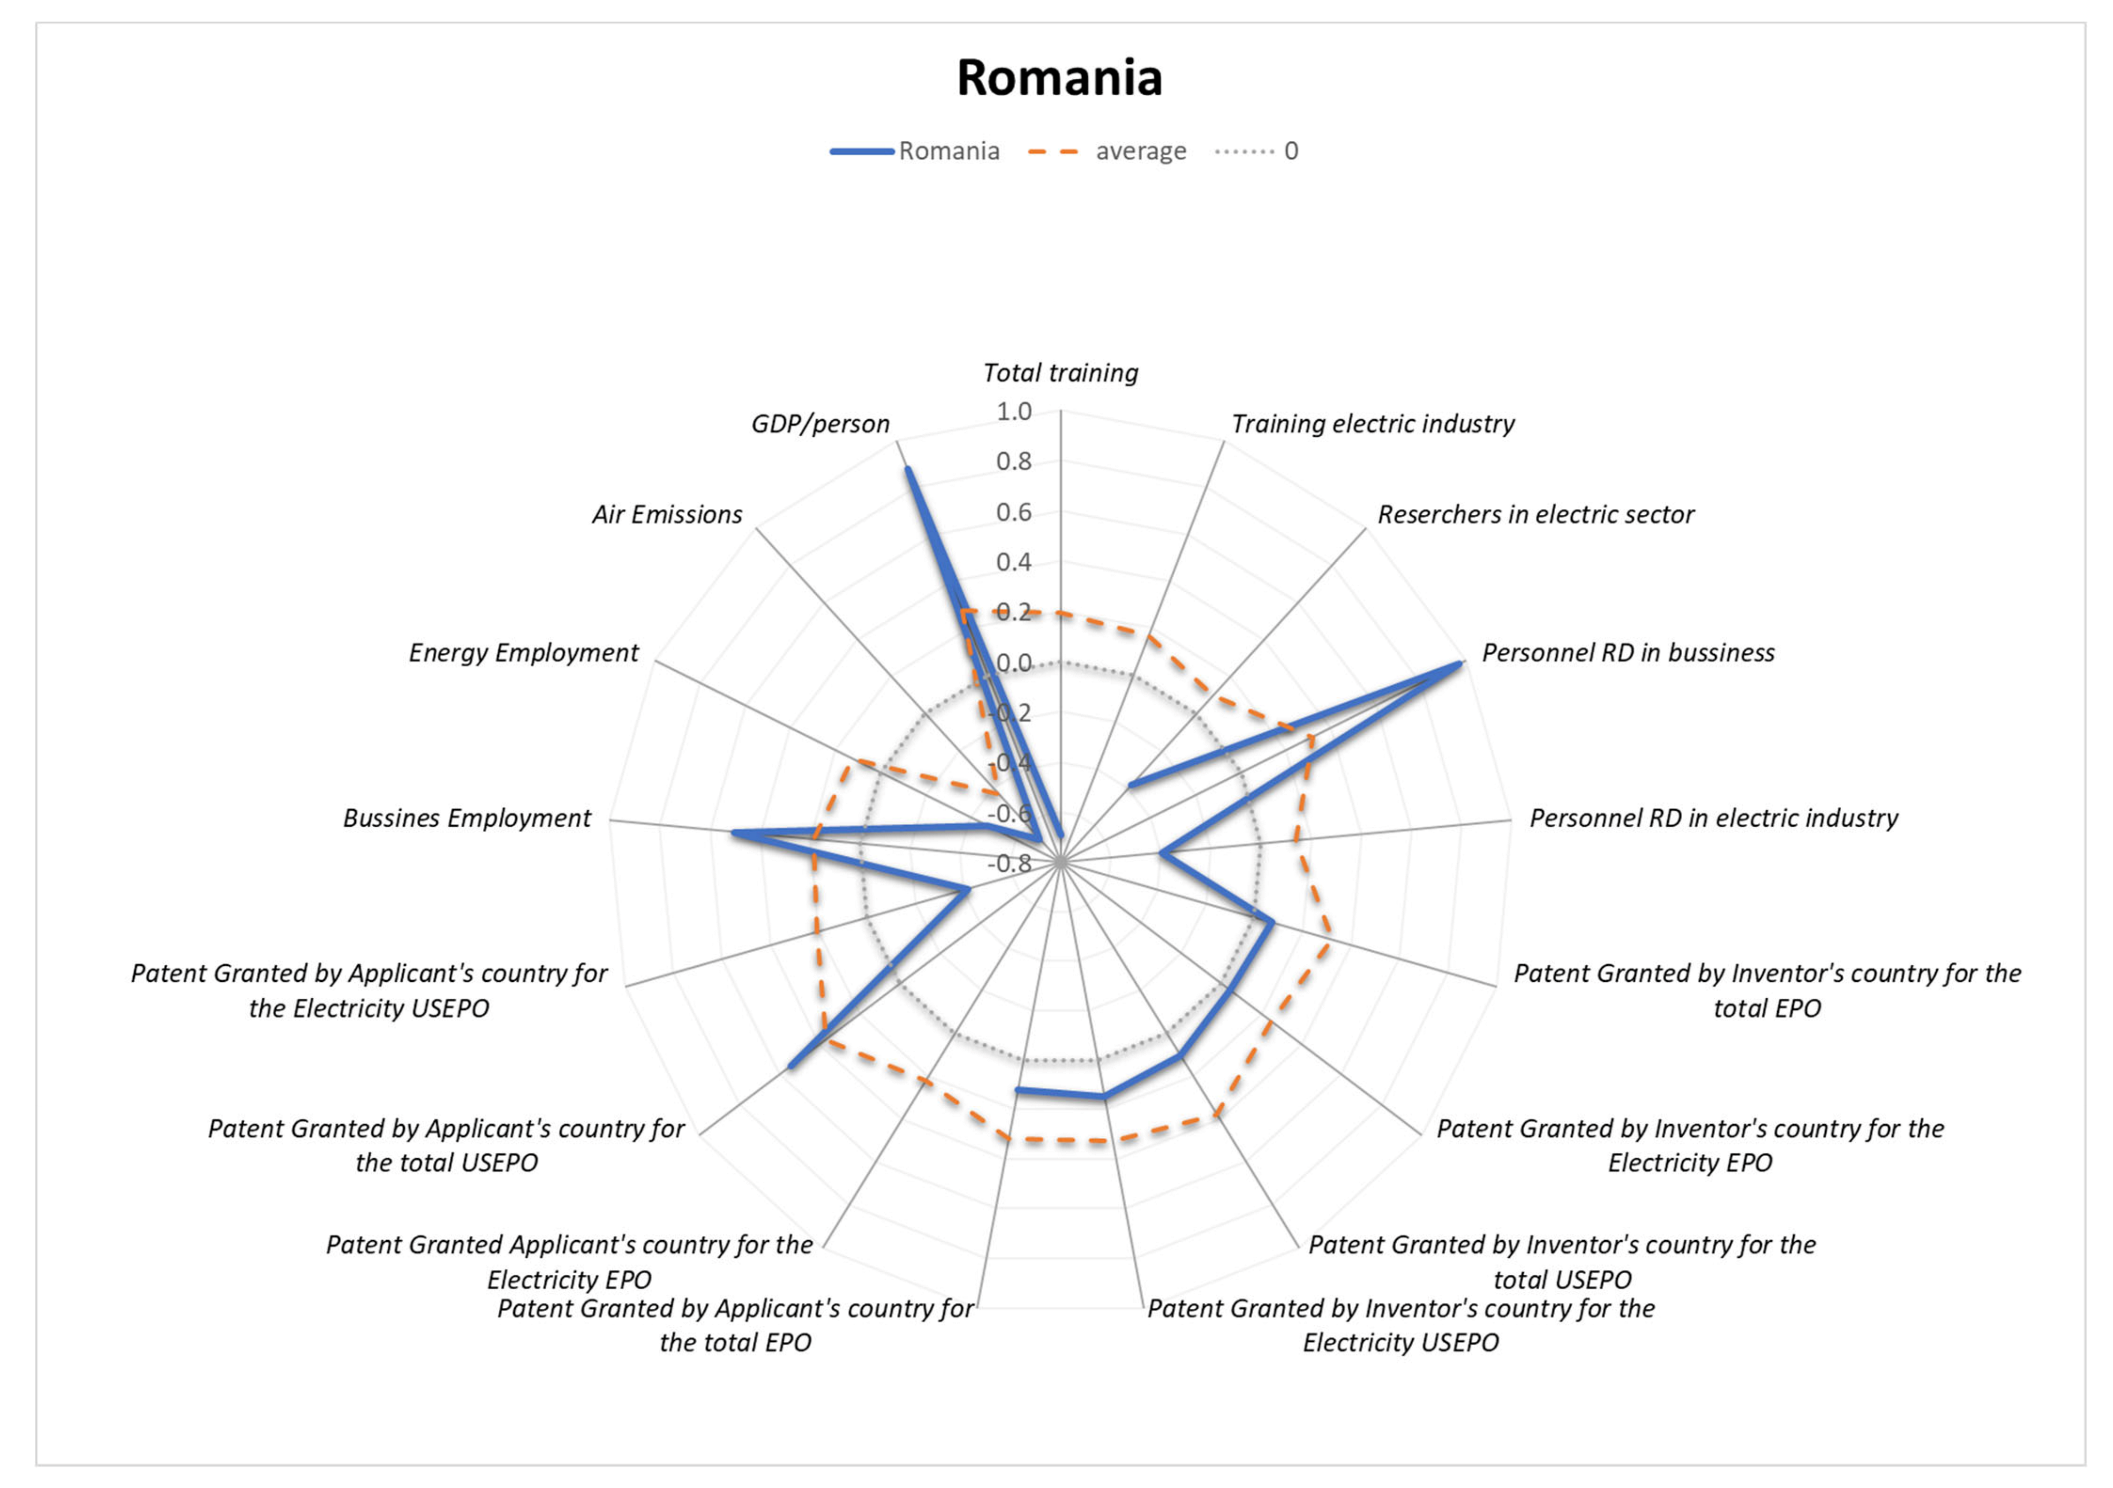
5.21. Romania—Local Innovator

Figure 31 is representative of the Romanian synergy and trade-off results, highlighting, as in the case of Portugal, a differentiation to the European average, and the persistent spike-like character of the indicators. There are synergy occurrences in rapport with the real GDP per capita and the R&D personnel in business, linking the knowledge transfer activity to the realization of SDG 9 and SDG 8. As local innovator Romania acts as KT beneficiary at MNCs level.

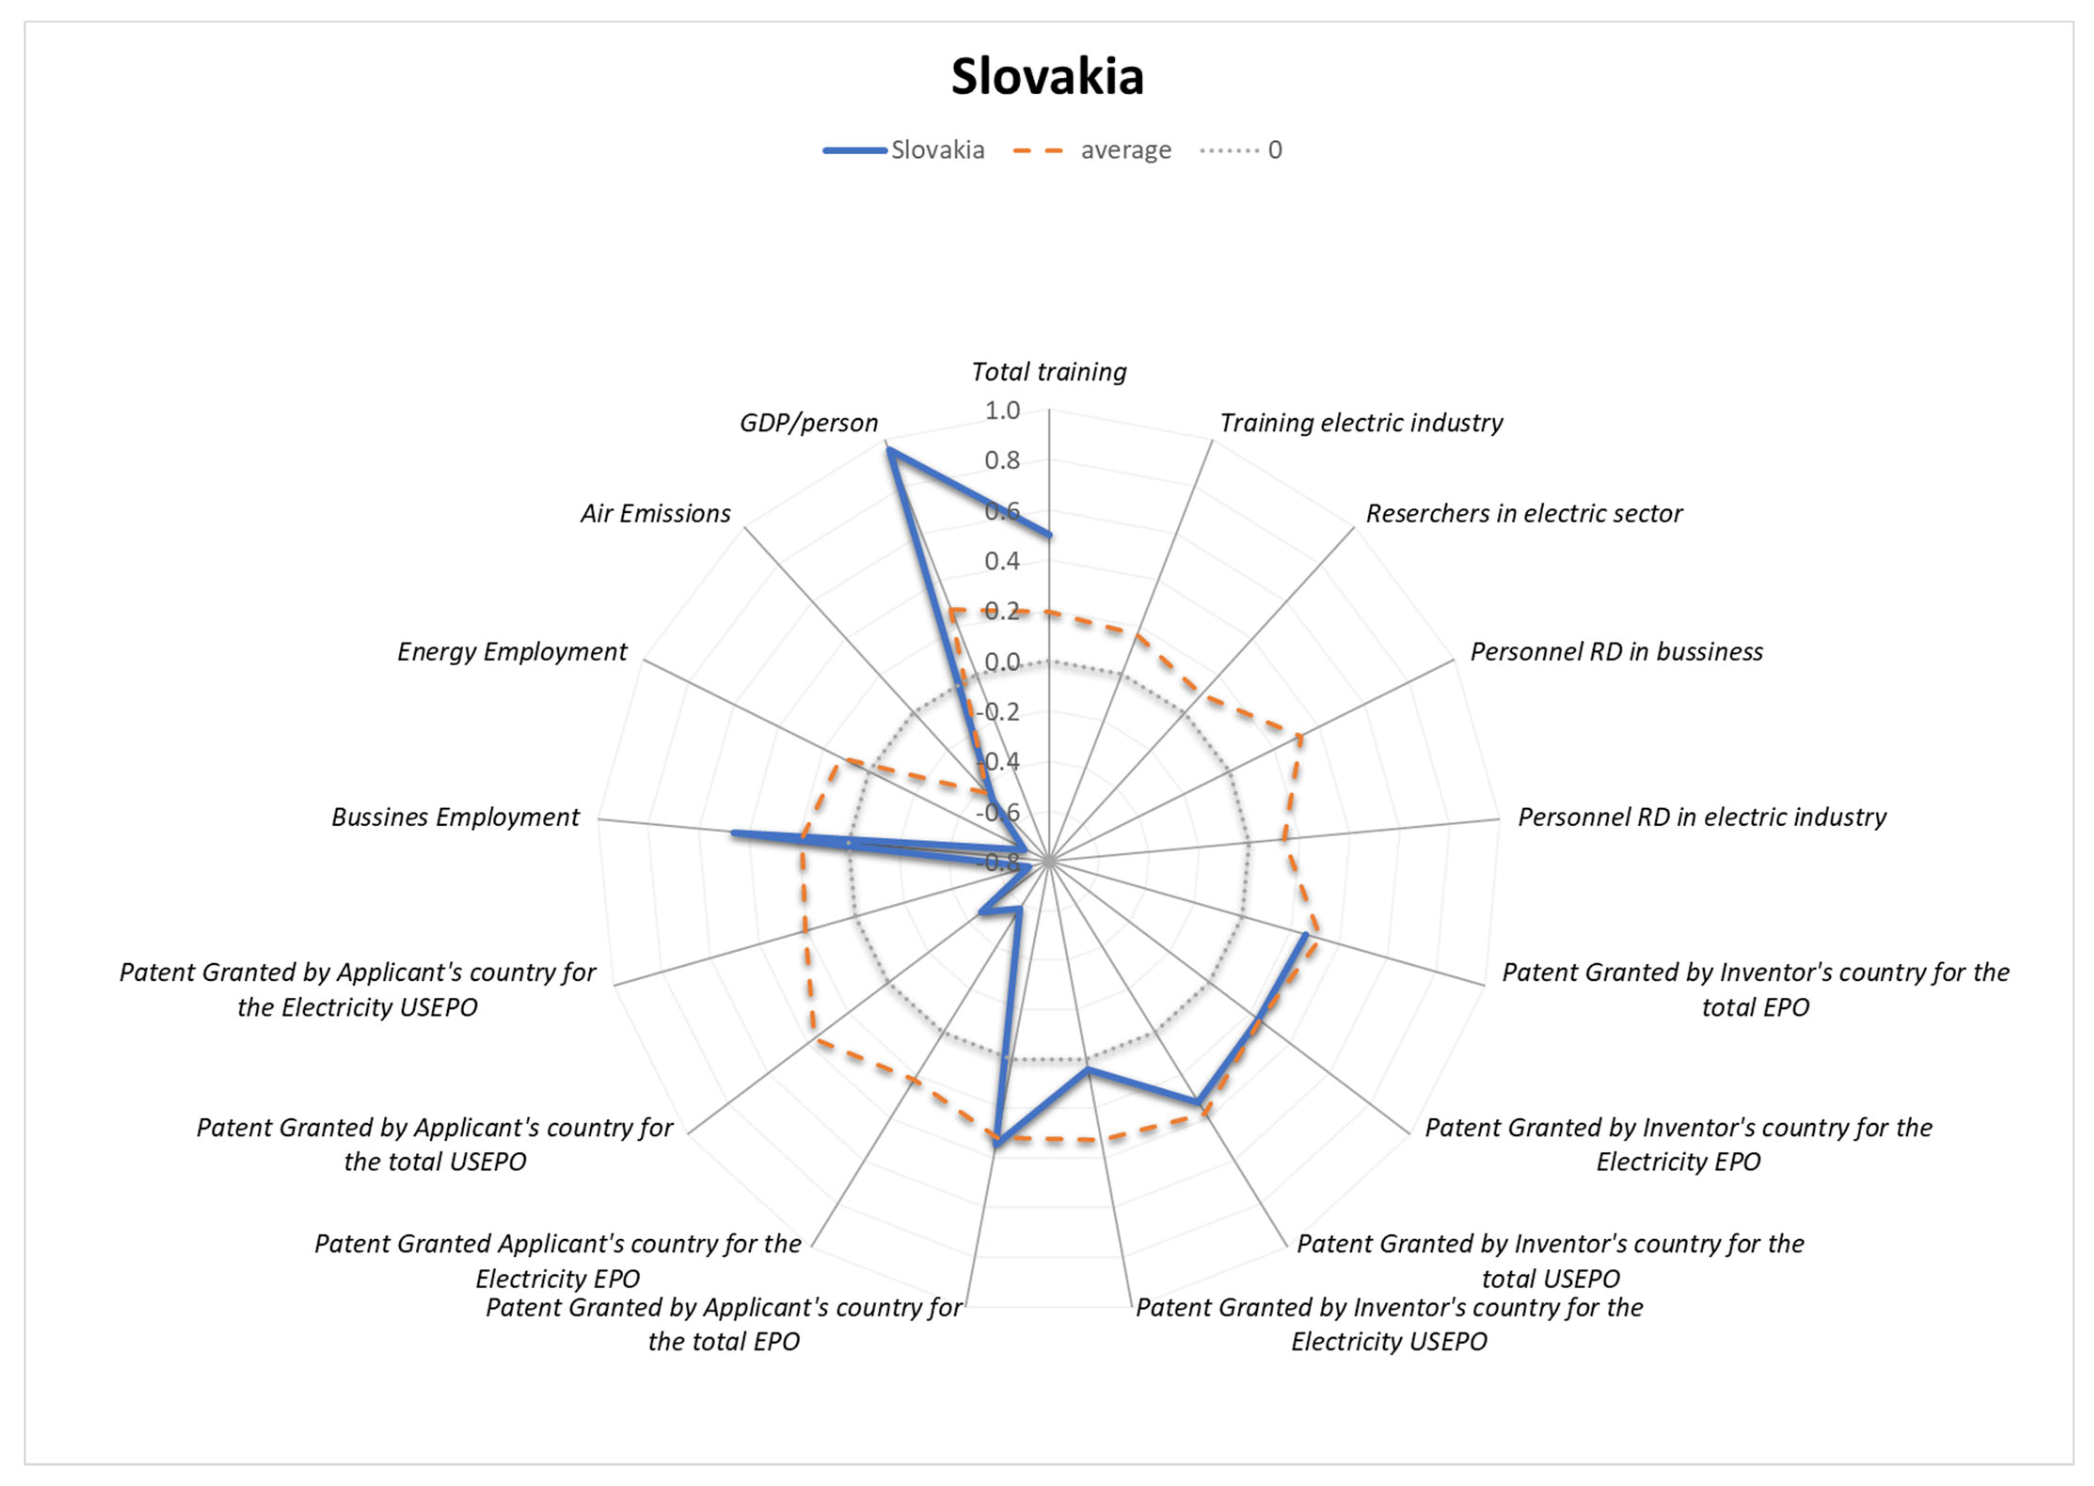
5.22. Slovakia—Not Applicable Profile

Slovakia (Figure 32) presents a perfect synergy of the energy sector and the sustainable economic growth while predominantly highlighting the occurrence of trade-offs (relative to employment rate and intellectual property. Due to lack of essential data, it was created a partial profile, but it couldn’t be classified in the proposed profiles.

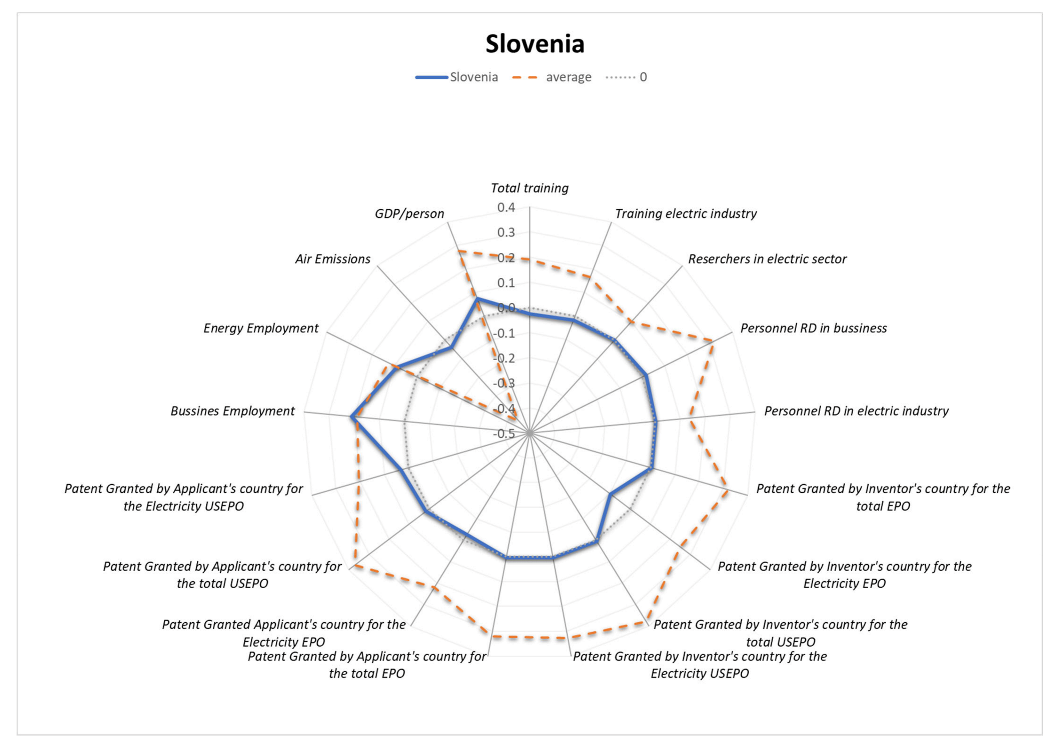
5.23. Slovenia—No KT

Slovenia (Figure 33) does not present any trace of synergy, assuming that knowledge transfer does not occur for the realization of the sustainable development goals.

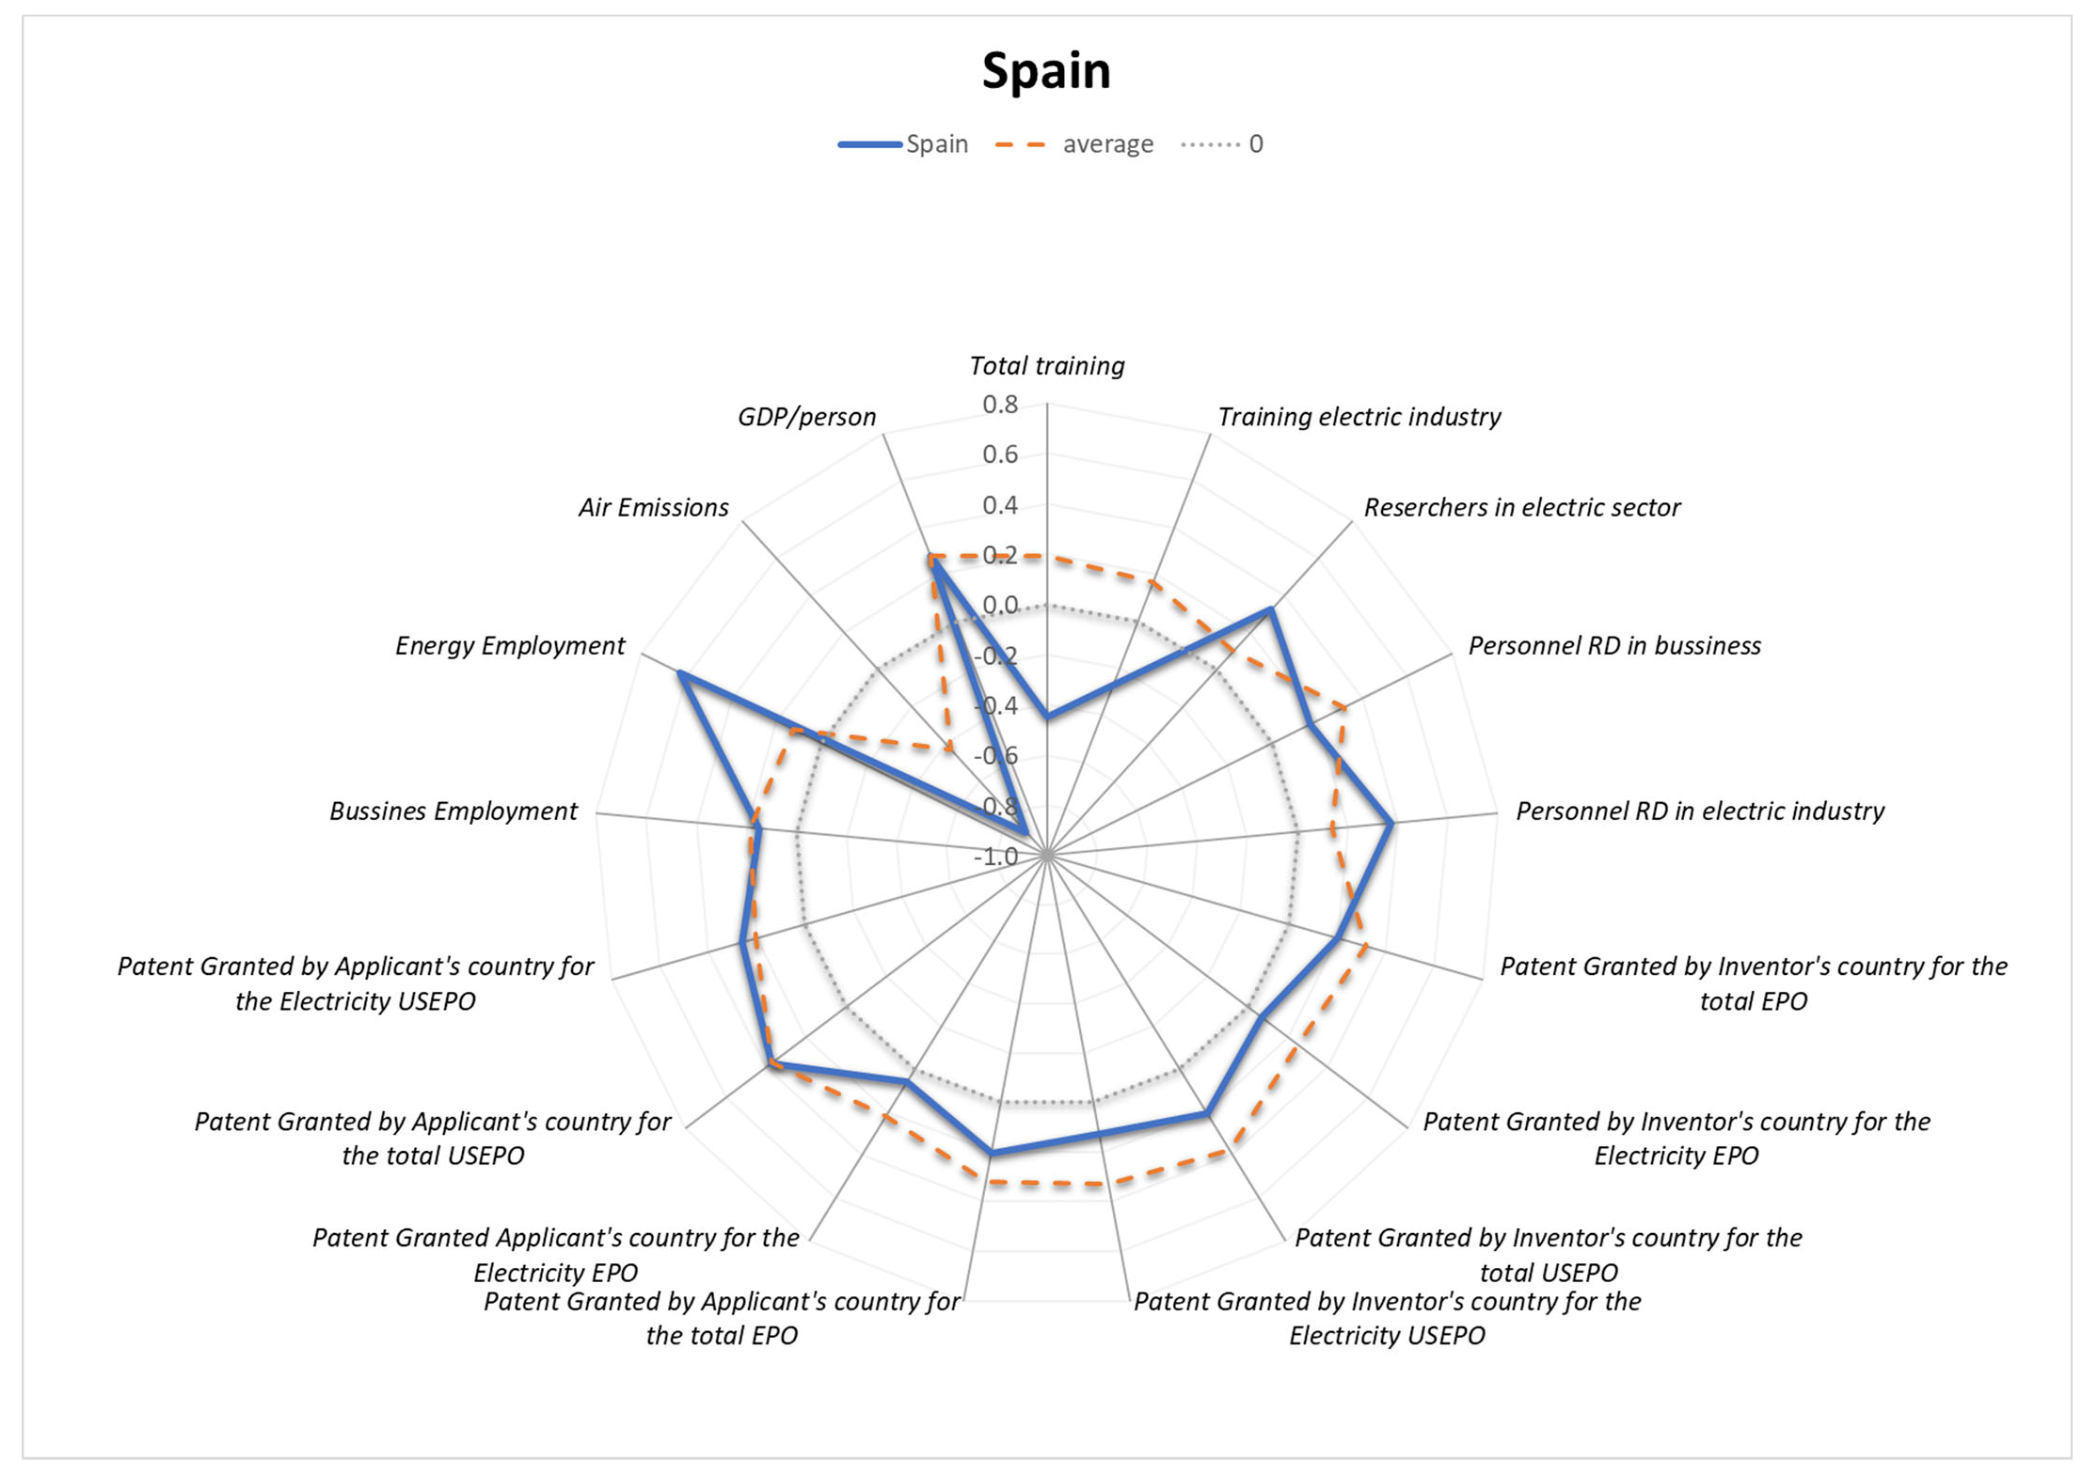
5.24. Spain—Local Innovator

In the case of Spain (Figure 34), the representation of the model is almost aligned with the European average, just as in the case of other West European countries. The synergy is apparent in the case of employment in the energy sector, while the trade-off occurs in relation to the air emissions intensity of industry. Therefore, the knowledge transfer is performed via formal channels, majorly influencing the progress of the SDG 8 implementation.

5.25. Sweden—Implementer

Sweden (Figure 35) proposes almost perfect synergies of energy sector and adult participation in learning, with knowledge transfer occurrence on both formal and informal channels. The trade-off is apparent for the sustainable industry, just as in the case of the European average.

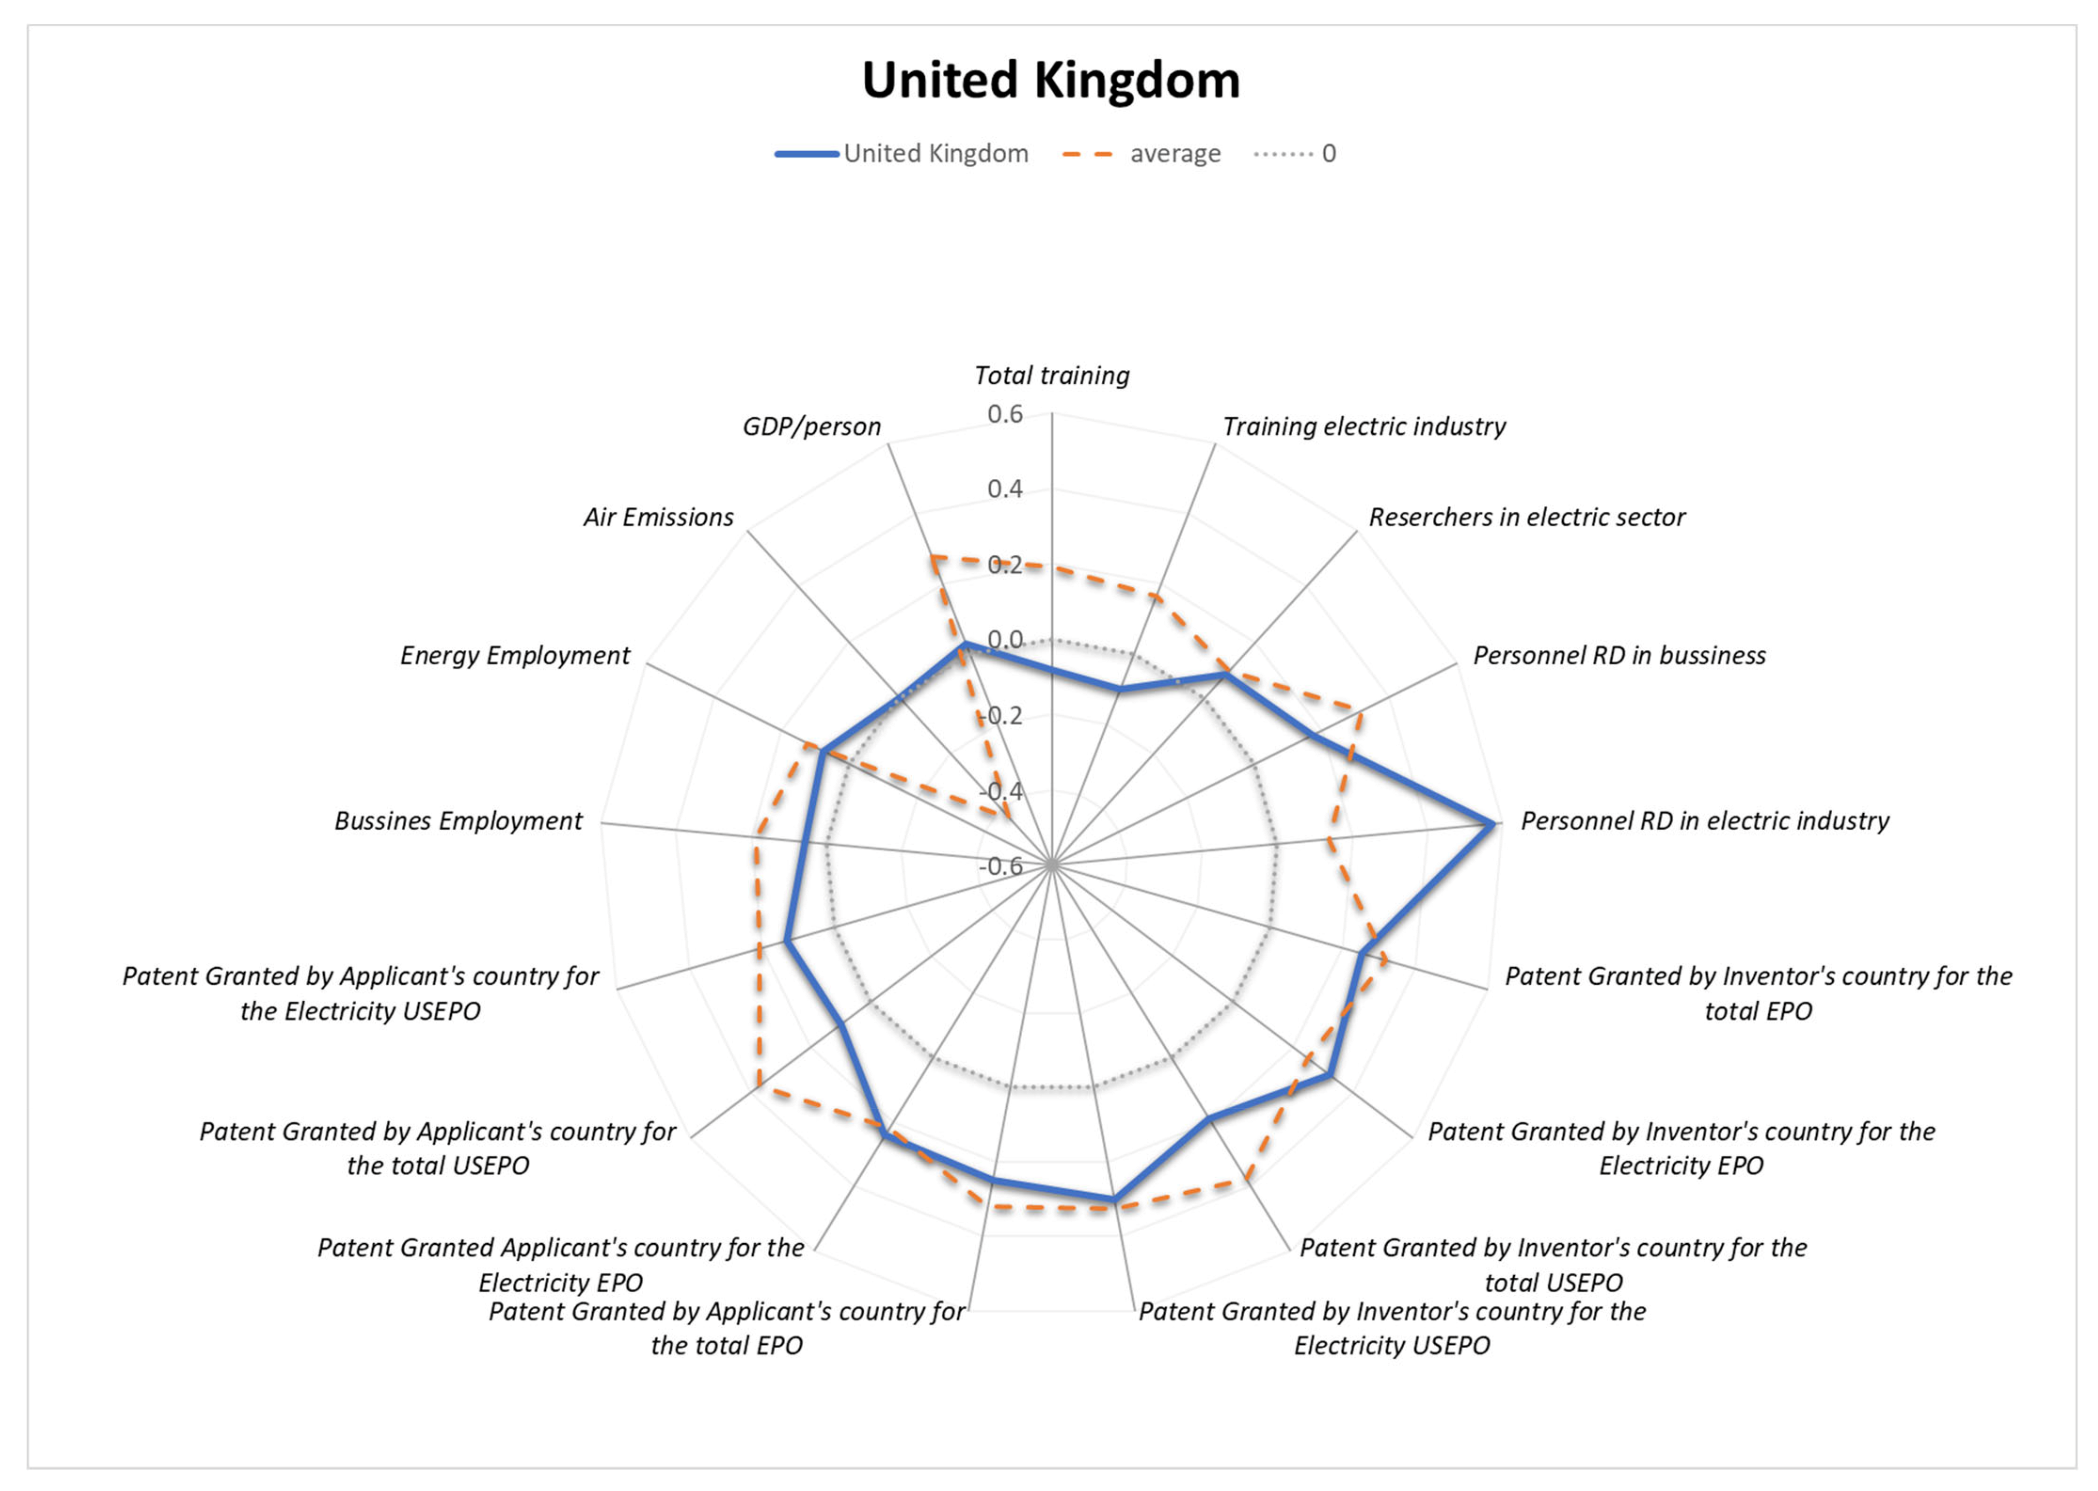
5.26. UK—Global Innovator

For the UK (Figure 36), the model resembles the European average, with two major differences—the perfect synergy of the energy sector and R&D personnel in the electric industry, and the lack of a trade-off in rapport with the sustainable industry. Here, the representation is pretty diffused across the indicators’ categories, showcasing an apparent uniformity in the KT occurrences. Despite the global innovator profile UK is not at all implementer.

6. Conclusions

The capacity to transfer knowledge from one entity to another represents one of the major forces of socio-economic growth. The manifestation of knowledge transfer has a wide range of outputs, including the creation of synergies within a given economic sector. The current research has motioned toward identifying the sources of synergies of knowledge transfer and the energy sector by adhering to the sustainable development framework. The main SDGs utilized as a vantage point in the paper have been related to the following objectives: the development of resilient infrastructure, the promotion of inclusive and sustainable industrialization and innovation (SDG 9); the accessibility to diverse sources of reliable, sustainable, and modern energy solutions (SDG 7); the adherence to inclusive and equitable education services and lifelong learning opportunities (SDG 4); and the promotion of sustainable economic growth given a productive and efficient employment sector (SDG 8). Moreover, based on the SDGs, the indicators’ categories have been identified as the following: R&D and innovation, Patent applications and grants, Adult learning, Employment rate, Sustainable economic growth, and Sustainable industry. The dependent variable in the study has been the share of renewable energy in the gross final energy consumption by sector.
H1 is demonstrated by the first stage of the research, which worked on the output of a bi-dimensional synergy between the share of renewable energy and all the other indicators, retrieving some important information. The observations from this testing showcased a significant progress in the realization of SDG 8 and SDG 9 across certain countries included in the study while addressing the apparition of certain trade-offs that derailed the target realization in case of SDG 4, SDG 8, and SDG 9 for certain countries included in the study. Moreover, the average calculations for bi-dimensional synergies showed that there is no indication for synergies at the regional level, and in terms of industry sustainability, there is a slight trade-off registered in the model. It can be disclosed that the European model presents partial success and is unilateral. The growth in the share of renewable energy consumption from the final consumption is linked to the trade-off in air emissions and has a positive impact on the environment, although it does not generate new jobs. The job creation and employment rate are delinked from the share of renewable energy consumption growth. This is a side effect of the sectoral KT, as the knowledge creation in the energy sector is low. Moreover, the growth of the consumption of energy products and services and the number of researchers in the field is also delinked. The main knowledge transfer occurs trans-sectoral, as the production of knowledge in the energy sector is relatively low, and it is not adopted, utilized, and exploited through tacit knowledge mechanisms.
H2 is demonstrated by the second stage of the model, which drew models based on tri-dimensional synergy equations in rapport with the following indicators: total training, training electric industry, R&D personnel in electric industry, employment in energy sector, air emissions intensity of industry, and real GDP per capita. The results obtained by interpreting those models are summarized as follows:
  • Synergies between the share in the renewable consumption and tacit knowledge flows (both training and training in energy sector) are linked with the third dimension of synergies in income and employment growth. This is the case of Norway, Sweden, and Finland. According to the framework of Chini [23], these countries present (except for Finland) the Integrated Players KT model. The national models are differentiating through the explicit knowledge transfers, the patents, and R&D personnel in business (in the case of Sweden);
  • Spain and Slovakia have the profile of implementers with synergies between the tacit knowledge (training) and the development of the renewable energy sector, while they showcase a gap in the explicit knowledge transfer. For those models, they displayed unwanted synergies with the growth of air emissions. This is an indication of an outdated system with old technologies;
  • Trade-offs between the share in the renewable consumption and explicit knowledge flows (X6, X7, X10, and X11) are linked with the third dimension of synergies in air emissions. This is the case of Denmark, France, Ireland, and Finland. According to the framework of Chini [23], these countries present (except from Finland) the Global Innovators KT model.
  • The last part of the paper is represented by the country analysis, which discloses the apparition of synergies as combined efforts and work of different elements and mechanisms of the energy sector, as well as of trade-offs, for the realization of the sustainable development targets across the European area. Below, the representation of the country analysis was realized under the form of a KT model matrix based on the Chini [23] framework and determined by the obtained results of this study.
The results are synthesized in Table 13.
Based on the above country matrix, it becomes obvious that the KT flows together with the intellectual property mechanisms are not enough for the creation of the desired synergies at the 3D level: economic, social, and environmental. By adding on the SDGs, a decisive step is being made—that of implementing a new set of values. The latter discloses the fact that profits can no longer be made solely from the knowledge exploitation. In such a situation, there are certain visible KT models (Italy, Latvia, UK). As integrated players, those countries, although efficient in their KT, do not record any synergies with the income level growth (therefore, it can be concluded that the new jobs created in those countries have low quality). Moreover, those KT models do not have the desired effect on the environment (which is represented by a diminishing trend in air emissions). Austria has an implementer KT model, and Belgium has a global innovator KT model. Both countries present synergies with the employment rate and the income level, although those synergies do not showcase any drops in air emissions.
The new EU strategical framework described by The Clean Energy Package for the renewable energy sector is meant to redesign the KT policy in a corporative manner, following the KT of Chini [23], especially the Integrated Players model. This solution will fill the gap of tacit knowledge sharing in view to foster the regional cooperation for a cost-effective development of renewables to the new electricity market across UE countries.
The main contributions of the study are the following:
-
Firstly, the analysis created around the testing for bi-dimensional synergies between renewable energy share in the final consumption (Y) and all the other variables in the study offers the possibility of identifying the national strengths and weakness;
-
Secondly, the study presents the evaluation of the tri-dimensional synergies between renewable energy shares in the final consumption (Y), one selected indicator (X12/X13/X3/X15/X17/X16), and all the other variables in the study, offering an image of the contribution, giving insights about the region potential of growth and the leaders;
-
Thirdly, the study included a discussion on the country profiles and the KT typology of the latter.
In conclusion, the transformation of the renewable energy sector in the new strategic framework implies the utilization of specific tools that follow a certain precision in implementation and in evaluation. The contribution of this paper to the scientific knowledge lies in the realization of an evaluation model for the renewable energy sector, based on the creation of synergies with the income level and employment rate in the EU, considering the sustainability planning framework. The results of the model underline the KT matrix of Chini [23] and propose a wider typology of 32 classification categories of a multicriterial KT, as it is presented in Table 13.
The countries classification using the KT matrix developed for synergies in renewable energies represents a transparent, coherent, and logical way of evaluation of the national profile, the strength and weakness, as well as the local, regional, and global behavior.
One of the most important scientific achievements of the study is represented by the detections of a way of measuring the synergies. It is followed by the dynamic perspectives of the model considering the need of correction and the upgrade to the current reality. This framework is dynamic, it presents a stage as the basis of the next decision making, and it can be updated while measuring the progress of relevant public policies for the synergy support of the renewable energy sector in the European Union. The proposed model aims at modifying the knowledge transfer mechanisms in the energy sector in order to foster innovation and the transformation of the energy sector aligned with the EU Clean Energy Package.
The limitations of the research rose from the lack of KT data and the inhomogeneity of the national reports reflected in the Eurostat database, which ultimately creates difficulties in evaluating the synergies. At the same time, according to Luukkanen [27], the synergies evaluated with the comparison method using a rage from −1 to 1 are more explorative than statistical. Based on the results, we can evaluate the existence of the synergy within the range but cannot detect a correlation (linear or non-linear). The study calculates the potential synergies between a very large number of factors that can reflect the contribution of KT in renewable energy and identifies behavioral partners at the national level. To identify trends and to determine the strength between the factors, a more detailed specific analysis has to be conducted. Nevertheless, the present study gives a first highly interdisciplinary insight regarding the cooperation and KT model.
Further developments are the replication of the model for evaluating the synergies of KT with other areas of interest under the SDGs framework as a support for policy makers and the EU cohesion and resilience paradigms.

Author Contributions

Conceptualization A.G. and C.L.; methodology A.G., C.L., A.-E.I.; software, C.L.; validation, S.P., A.G.; formal analysis, A.-E.I.; investigation and resources, C.L. and S.P.; writing—original draft preparation, A.-E.I. and C.L.; writing—review and editing, A.G. and S.P.; visualization, A.-E.I.; supervision, A.G.; project administration, A.G.; funding acquisition, A.G. All authors have read and agreed to the published version of the manuscript.

Funding

The APC was funded by EEA Grants, Financial Mechanism 2014−2021 though contract number 18-COP−0032.

Institutional Review Board Statement

Not applicable.

Informed Consent Statement

Not applicable.

Acknowledgments

This paper is part of the Project School of Knowledge Production and Transfer for Global Economy and Governance, funded by Iceland, Liechtenstein and Norway through the EEA Grants, Financial Mechanism 2014−2021 though contract number 18-COP−0032.

Conflicts of Interest

The authors declare no conflict of interest. The funders had no role in the design of the study; in the collection, analyses, or interpretation of data; in the writing of the manuscript, or in the decision to publish the results.

References

  1. DG Energy. European Commission Strategic Plan 2020–2024; European Commission: Brussels, Belgium, 2020. [Google Scholar]
  2. Qian, X.; Liu, X.; Pu, R. Evaluation of knowledge transfer efficiency based on the synergy of innovative clusters. RJCM 2020, 1, 1–25. [Google Scholar] [CrossRef]
  3. Alola, A.A.; Bekun, F.V.; Sarkodie, S.A. Dynamic impact of trade policy, economic growth, fertility rate, renewable and non-renewable energy consumption on ecological footprint in Europe. Sci. Total. Environ. 2019, 685, 702–709. [Google Scholar] [CrossRef] [PubMed]
  4. Guimón, J. Policy Initiatives to Enhance the Impact of Public Research: Promoting Excellence, Transfer and Co-Creation; OECD Publishing: Paris, France, 2019; Volume 81. [Google Scholar]
  5. Davenport, T.H.; Prusak, L. Working Knowledge. How Organizations Manage What They Know; Harvard Business School Press: Boston, MA, USA, 1998. [Google Scholar]
  6. Sveiby, K.-E. A knowledge-based theory of the firm to guide in strategy formulation. J. Intellect. Cap. 2001, 2, 344–358. [Google Scholar] [CrossRef] [Green Version]
  7. Argote, L.; Ingram, P. Knowledge Transfer: A Basis for Competitive Advantage in Firms. Organ. Behav. Hum. Decis. Process. 2000, 82, 150–169. [Google Scholar] [CrossRef] [Green Version]
  8. De Luca, P.; Rubio, M.C. The curve of knowledge transfer: A theoretical model. Bus. Process. Manag. J. 2019, 25, 10–26. [Google Scholar] [CrossRef]
  9. Milagres, R.; Bucharth, A. Knowledge transfer in interorganizational partnerships: What do we know? Bus. Process Manag. J. 2019, 25, 27–68. [Google Scholar] [CrossRef] [Green Version]
  10. Vlajcic, D.; Marzi, G.; Caputo, A.; Dabic, M. The role of geographical distance on the relationship between cultural intelligence and knowledge transfer. Bus. Process. Manag. J. 2019, 25, 104–125. [Google Scholar] [CrossRef] [Green Version]
  11. Secundo, G.; Toma, A.; Schiuma, G.; Passiante, G. Knowledge transfer in open innovation: A classification framework for healthcare ecosystems. Bus. Process Manag. J. 2019, 25, 144–163. [Google Scholar] [CrossRef]
  12. D’Andreamatteo, A.; Ianni, L.; Rangone, A.; Paolone, F.; Sargiacomo, M. Institutional pressures, isomorphic changes and key agents in the transfer of knowledge of Lean in Healthcare. Bus. Process. Manag. J. 2019, 25, 164–184. [Google Scholar] [CrossRef]
  13. Paoloni, P.; Cesaroni, F.M.; Demartini, P. Relational capital and knowledge transfer in universities. Bus. Process. Manag. J. 2019, 25, 185–201. [Google Scholar] [CrossRef]
  14. Cardoni, A.; Dumay, J.; Palmaccio, M.; Celenza, D. Knowledge transfer in a start-up craft brewery. Bus. Process. Manag. J. 2019, 25, 219–243. [Google Scholar] [CrossRef]
  15. Rifkin, J. The Zero Marginal Cost Society: The Internet of Things, the Collaborative Commons and the Eclipse of Capitalism; Palgrave MacMillan: New York, NY, USA, 2014. [Google Scholar]
  16. Bienhaus, F.; Haddud, A. Procurement 4.0: Factors influencing the digitisation of procurement and supply chains. Bus. Process. Manag. J. 2018, 24, 965–984. [Google Scholar] [CrossRef]
  17. Müller, J.M.; Buliga, O.; Voigt, K.-I. Fortune favors the prepared: How SMEs approach business model innovations in Industry 4.0. Technol. Forecast. Soc. Chang. 2018, 132, 2–17. [Google Scholar] [CrossRef]
  18. Schneider, P. Managerial challenges of Industry 4.0: An empirically backed research agenda for a nascent field. Rev. Manag. Sci. 2018, 12, 803–848. [Google Scholar] [CrossRef]
  19. Huws, U. The Transformation of Work in a Global Knowledge Economy: Towards a Conceptual Framework. TATuP Z. Tech. Theor. Prax. 2006, 15, 103–108. [Google Scholar]
  20. Blohm, M. An Enabling Framework to Support the Sustainable Energy Transition at the National Level. Sustainability 2021, 13, 3834. [Google Scholar] [CrossRef]
  21. Zhou, Y.; Pan, M.; Urban, F. Comparing the International Knowledge Flow of China’s Wind and Solar Photovoltaic (PV) Industries: Patent Analysis and Implications for Sustainable Development. Sustainability 2018, 10, 1883. [Google Scholar] [CrossRef] [Green Version]
  22. Apostolopoulos, N.; Chalvatzis, K.J.; Liargovas, P.G.; Newbery, R.; Rokou, E. The role of the expert knowledge broker in rural development: Renewable energy funding decisions in Greece. J. Rural. Stud. 2020, 78, 96–106. [Google Scholar] [CrossRef]
  23. Chini, T.C. Effective Knowledge Transfer in Multinational Corporations; Palgrave Macmillan: London, UK, 2004; ISBN 978-1-349-52114-2. [Google Scholar]
  24. Weitz, N.; Nilsson, M.; Davis, M. A Nexus Approach to the Post-2015 Agenda: Formulating Integrated Water, Energy, and Food SDGs. SAIS Rev. Int. Aff. 2014, 34, 37–50. [Google Scholar] [CrossRef]
  25. Blanc, D.L. Towards Integration at Last? The Sustainable Development Goals as a Network of Targets; DESA, Working Paper No. 141; United Nations Department of Economic and Social Affairs (UN DESA): New York, NY, USA, 2015. [Google Scholar]
  26. Duguma, L.A.; Wambugu, S.W.; Minang, P.A.; van Noordwijk, M. A systematic analysis of enabling conditions for synergy between climate change mitigation and adaptation measures in developing countries. Environ. Sci. Policy 2014, 42, 138–148. [Google Scholar] [CrossRef] [Green Version]
  27. Luukkanen, J.; Vehmas, J.; Panula-Ontto, J.; Allievi, F.; Kaivo-Oja, J.; Pasanen, T.; Auffermann, B. Synergies or Trade-offs? A New Method to Quantify Synergy Between Different Dimensions of Sustainability. Environ. Policy Gov. 2012, 22, 337–349. [Google Scholar] [CrossRef] [Green Version]
  28. Mainali, B.; Luukkanen, J.; Silveira, S.; Kaivo-oja, J. Evaluating synergies and trade-offs among Sustainable Development Goals (SDGs): Explorative analyses of development paths in South Asia and Sub-Saharan Africa. Sustainability 2018, 10, 815. [Google Scholar] [CrossRef] [Green Version]
  29. Banerjee, O.; Cicowiez, M.; Horridge, M.; Vargas, R. Evaluating synergies and trade-offs in achieving the SDGs of zero hunger and clean water and sanitation: An application of the IEEM Platform to Guatemala. Ecol. Econ. 2019, 161, 280–291. [Google Scholar] [CrossRef]
  30. Halsnæs, K.; Garg, A. Assessing the Role of Energy in Development and Climate Policies—Conceptual Approach and Key Indicators. World Dev. 2011, 39, 987–1001. [Google Scholar] [CrossRef]
  31. Zhao, Z.; Cai, M.; Wang, F.; Winkler, J.A.; Connor, T.; Chung, M.G.; Liu, J. Synergies and tradeoffs among Sus-tainable Development Goals across boundaries in a metacoupled world. Sci. Total Environ. 2021, 751, 141749. [Google Scholar] [CrossRef]
  32. Landuyt, D.; Broekx, S.; Goethals, P.L.M. Unit Bayesian belief networks to analyse trade-offs among ecosystem services at the regional scale. Ecol. Indic. 2016, 71, 327–335. [Google Scholar] [CrossRef]
  33. Hicks, C.; Graham, N.; Cinner, J. Synergies and tradeoffs in how managers, scientists, and fishers value coral reef ecosystem services. Glob. Environ. Chang. 2013, 23, 1444–1453. [Google Scholar] [CrossRef]
  34. Kearney, S.; Fonte, S.; García, E.; Siles, P.; Chan, K.; Smukler, S. Evaluating ecosystem service trade-offs and synergies from slash-and-mulch agroforestry systems in El Salvador. Ecol. Indic. 2019, 105, 264–278. [Google Scholar] [CrossRef]
  35. Jain, R.; Singh, A.R.; Yadav, H.C.; Mishra, P.K. Using data mining synergies for evaluating criteria at pre-qualification stage of supplier selection. J. Intell. Manuf. 2012, 25, 165–175. [Google Scholar] [CrossRef]
  36. Ahmad, M.; Wang, X.; Hilger, T.H.; Luqman, M.; Nazli, F.; Hussain, A.; Zahir, Z.A.; Latif, M.; Saeed, Q.; Malik, H.A.; et al. Evaluating Biochar-Microbe Synergies for Improved Growth, Yield of Maize, and Post-Harvest Soil Characteristics in a Semi-Arid Climate. Agronomy 2020, 10, 1055. [Google Scholar] [CrossRef]
  37. Meerow, S. A green infrastructure spatial planning model for evaluating ecosystem service tradeoffs and synergies across three coastal megacities. Environ. Res. Lett. 2019, 14, 125011. [Google Scholar] [CrossRef] [Green Version]
  38. Alfaro-Navarro, J.-L.; López-Ruiz, V.-R.; Peña, D.N. A New Sustainability City Index Based on Intellectual Capital Approach. Sustainability 2017, 9, 860. [Google Scholar] [CrossRef] [Green Version]
  39. López-Ruiz, V.-R.; Alfaro-Navarro, J.-L.; Nevado-Peña, D. Knowledge-city index construction: An intellectual capital perspective. Expert Syst. Appl. 2014, 41, 5560–5572. [Google Scholar] [CrossRef]
  40. Pace, N.; Daidone, S.; Davis, B.; Handa, S.; Knowles, M.; Pickmans, R. One Plus One can be Greater than Two: Evaluating Synergies of Development Programmes in Malawi. J. Dev. Stud. 2018, 54, 2023–2060. [Google Scholar] [CrossRef]
  41. McCarthy, N.; Lipper, L.; Mann, W. Evaluating synergies and trade-offs among food security, development, and climate change. In Climate Change Mitigation and Agriculture; Routledge: London, UK, 2013; pp. 70–80. [Google Scholar]
  42. Van Velzen, L.; Pennock, S. Cross-Sector Knowledge Transfer. North Sea Solutions for Innovation in Corrosion for Energy; NeSSIE: Glasgow, UK, 2018; p. 28. [Google Scholar]
  43. European Commission; Statistical Office of the European Union. Sustainable Development in the European Union: Monitoring Report on Progress towards the SDGs in an EU Context: 2021 Edition; Publications Office: Luxembourg, 2021. [Google Scholar]
  44. OECD STIP COMPASS How to Measure the Influence of Knowledge Transfer on Innovation? 2021. Available online: https://stip.oecd.org/stip/knowledge-transfer/journeys/influenceOfKnowledgeTransferOnInnovation (accessed on 12 August 2021).
  45. OECD. Frascati Manual 2015Guidelines for Collecting and Reporting Data on Research and Experimental Development. The Measurement of Scientific, Technological and Innovation Activities; OECD: Paris, France, 2015; ISBN 978-92-64-23880-0. [Google Scholar]
  46. Kaivo-oja, J.; Luukkanen, J.; Malaska, P. Methodology for the Analysis of Critical Industrial Ecology Trends: An Advanced Sustainability Analysis of the Finnish Economy. Futura 2020, 21, 45–61. [Google Scholar]
Figure 1. Effective knowledge transfer in multinational corporations. Source: Adapted form [23], p. 59.
Energies 15 00276 g001
Figure 2. Strategic mandates of subsidiaries in knowledge transfer in MNCs. Source: Authors’ representation Adapted from [23], p 59.
Energies 15 00276 g002
Figure 3. Synergy measurement of three variables. Source: Adapted from [4].
Energies 15 00276 g003
Figure 4. Bi-dimensional synergies between renewable energy share of final consumption versus R&D, patents, training, employment, wealth, and emissions. Source: Authors’ representation.
Energies 15 00276 g004
Figure 5. Tri-dimensional synergies in rapport with total training (X12). Source: Authors’ representation. Source: Authors’ results synthesis, 2021.
Energies 15 00276 g005
Figure 11. Synergy and trade-off occurrence—AT. Source: Authors’ representation.
Energies 15 00276 g011
Figure 12. Synergy and trade-off occurrence—BE. Source: Authors’ representation.
Energies 15 00276 g012
Figure 13. Synergy and trade-off occurrence—CZ. Source: Authors’ representation.
Energies 15 00276 g013
Figure 14. Synergy and trade-off occurrence—DK. Source: Authors’ representation.
Energies 15 00276 g014
Figure 15. Synergy and trade-off occurrence—EE. Source: Authors’ representation.
Energies 15 00276 g015
Figure 16. Synergy and trade-off occurrence—FI. Source: Authors’ representation.
Energies 15 00276 g016
Figure 17. Synergy and trade-off occurrence—FR. Source: Authors’ representation.
Energies 15 00276 g017
Figure 18. Synergy and trade-off occurrence—DE. Source: Authors’ representation.
Energies 15 00276 g018
Figure 19. Synergy and trade-off occurrence—EL. Source: Authors’ representation.
Energies 15 00276 g019
Figure 20. Synergy and trade-off occurrence—HU. Source: Authors’ representation.
Energies 15 00276 g020
Figure 21. Synergy and trade-off occurrence—IS. Source: Authors’ representation.
Energies 15 00276 g021
Figure 22. Synergy and trade-off occurrence—IE. Source: Authors’ representation.
Energies 15 00276 g022
Figure 23. Synergy and trade-off occurrence—IT. Source: Authors’ representation.
Energies 15 00276 g023
Figure 24. Synergy and trade-off occurrence—LV. Source: Authors’ representation.
Energies 15 00276 g024
Figure 25. Synergy and trade-off occurrence—LT. Source: Authors’ representation.
Energies 15 00276 g025
Figure 26. Synergy and trade-off occurrence—LU. Source: Authors’ representation.
Energies 15 00276 g026
Figure 27. Synergy and trade-off occurrence—NL. Source: Authors’ representation.
Energies 15 00276 g027
Figure 28. Synergy and trade-off occurrence—NO. Source: Authors’ representation.
Energies 15 00276 g028
Figure 29. Synergy and trade-off occurrence—PL. Source: Authors’ representation.
Energies 15 00276 g029
Figure 30. Synergy and trade-off occurrence—PT. Source: Authors’ representation.
Energies 15 00276 g030
Figure 31. Synergy and trade-off occurrence—RO. Source: Authors’ representation.
Energies 15 00276 g031
Figure 32. Synergy and trade-off occurrence—SK. Source: Authors’ representation.
Energies 15 00276 g032
Figure 33. Synergy and trade-off occurrence—SL. Source: Authors’ representation.
Energies 15 00276 g033
Figure 34. Synergy and trade-off occurrence—ES. Source: Authors’ representation.
Energies 15 00276 g034
Figure 35. Synergy and trade-off occurrence—SE. Source: Authors’ representation.
Energies 15 00276 g035
Figure 36. Synergy and trade-off occurrence—UK. Source: Authors’ representation.
Energies 15 00276 g036
Table 1. Association of variables.
Explicit Knowledge (Objective)Tacit Knowledge (Subjective)
Knowledge of rationality (mind) Knowledge of experience (body)
Sequential knowledge (there and then) Simultaneous knowledge (here and now)
Digital knowledge (theory) Analogue knowledge (practice)
Variable association and interpretation
Researchers (X1, X2, X3)Training (X12, X13)
Patents (X4, X5, X6, X7, X8, X9, X10, X11)
Variables of impact(X14, X15, X16, X17)
Source: Authors concept and variables association using Chini terminology [23].
Table 2. Description of research indicators.
Indicator CategoryIndicators That Measure
Progress in the Framework of Sustainable Development
Var.SD Objective ProgressKT Characteristics and ChannelSDG
Dimension
Renewable energyShare of renewable energy in gross final energy consumption by sectorYLT—significant progress
ST—moderate progress
Green energy → direct result of KT synergiesSDG7
R&D and innovation—Researchers & BERD personnel (total & energy)Researchers Internal Personnel (energy)X1LT—significant progress
ST—significant progress
Formal KT channel—explicit KTSDG9
R&D personnel in businessX2
R&D personnel in electric industryX3
Patent applications and grants to the European Patent OfficePatent granted by inventor’s country for the total EPOX4Formal KT channel—explicit KTSDG9
Patent granted by inventor’s country for the electricity EPOX5
Patent granted by inventor’s country for the total USEPOX6
Patent granted by inventor’s country for the electricity USEPOX7
Patent granted by applicant’s country for total EPOX8
Patent granted by applicant’s country for the electricity EPOX9
Patent granted by applicant’s country for the total USEPOX10
Patent granted by applicant’s country for the electricity USEPOX11
Adult learning/Adult participation in learningTotal trainingX12LT—significant progress
ST—movement away from target
Informal KT channel—tacit KTSDG4
Share of adults with at least basic digital skills/Training electric industryX13ST—insufficient progressFormal KT channel—explicit KT
Employment rateEmployment in enterprisesX14LT—moderate progress
ST—moderate progress
Economic impact of KT policies measured in terms of jobsSDG8
Employment in energy sectorX15
Sustainable economic growthReal GDP per capitaX16Economic impact of KT policies measured in terms of incomeSDG8
Sustainable industryAir emissions intensity of industryX17LT—significant progress
ST—significant progress
Environment impact of KT policies measured in terms of greening the economySDG9
Source: Authors’ own synthesis and concept, based on [43,44,45].
Table 3. KT synergies in energy sector analyzed in connection to the SDGs.
SDG (in Order of Importance)SDG ObjectiveLong-Term and Short-Term Progress
SDG 9SDG 9 calls for building resilient and sustainable infrastructure and promotes inclusive and sustainable industrialization. It also recognizes the importance of research and innovation for finding lasting solutions to social, economic, and environmental challenges.Showcased significant progress toward the sustainable development objective as well as toward the EU target, both long and short-term.
SDG 7SDG 7 calls for ensuring universal access to modern energy services, improving energy efficiency and increasing the share of renewable energy. To accelerate the transition to an affordable, reliable, and sustainable energy system that fulfills these demands, countries need to facilitate access to clean energy research and technology and to promote investment in resource- and energy-efficient solutions and low-carbon energy infrastructure.In the long term, it showcased significant progress toward the sustainable development objective as well as toward the EU target.
In the short term, it showcased moderate progress toward the sustainable development objective, as well as toward the EU target.
SDG 4SDG 4 seeks to ensure access to equitable and quality education through all stages of life as well as to increase the number of young people and adults who have the relevant skills for employment, decent jobs, and entrepreneurship. The goal also envisages the elimination of gender and income disparities in access to education.In the long term, it showcased significant progress toward the sustainable development objective as well as toward the EU target.
In the short term, it showcased movement away from the EU target and moderate progress toward the SD objective.
SDG 8SDG 8 recognizes the importance of sustained economic growth and high levels of economic productivity for the creation of well-paid quality jobs, as well as resource efficiency in consumption and production. It calls for opportunities for full employment and decent work for all alongside the eradication of forced labor, human trafficking and child labor, and the promotion of labor rights and safe and secure working environments.Showcased moderate progress towards the EU target, and moderate movement away from SD objective, both long and short-term.
Source: Authors’ adaptation from the European Commission [43,44,45].
Table 4. Normalized indicators’ change (2010–2017).
YX1X2X3X4X5X6X7X8X9X10X11X12X13X14X15X16X17
AT7.920.130.524.490.5111.2108.3168.8113.0188.187.2155.811.924.40.31.34.6−40.0
BE138.7−25.353.3162.379.8116.957.057.889.2148.439.56.711.945.56.7−4.75.2−30.0
CZ81.771.250.6135.6162.5166.2256.0321.6198.0283.954.070.323.540.9−6.69.116.4−60.0
DK83.1−56.1 −61.890.8126.783.190.5107.2133.085.780.8−15.2−18.93.50.98.9−66.7
EE65.5101.86.7214.1277.2454.0185.1410.1171.4230.063.90.231.8 17.6−11.229.9−37.0
FI27.342.1−7.946.197.056.841.022.881.349.239.225.312.215.619.320.83.7−30.8
FR34.616.812.73.857.564.852.457.461.571.644.042.2202.6189.4−0.23.15.5−25.0
DE89.7−7.829.511.147.555.436.542.350.563.630.328.80.8−9.627.416.110.9−33.3
EL98.8547.5105.6390.2121.5439.6115.196.4127.1 61.0−3.642.2 6.42.4−15.14.2
HU5.9−38.564.8−38.047.1157.393.2180.0−0.825.823.556.6139.4 14.9−3.820.60.0
IS1.07900.020.711900.0254.8−100.0135.9424.4290.9 177.7208.8−3.3 1.217.2−33.3
IE92.4−41.660.3−44.9122.3171.9120.3160.1187.7480.1146.8141.319.8 13.31.446.9−60.0
IT69.7204.171.1166.439.824.749.580.336.4−0.419.518.534.826.0−1.92.0−0.8−40.0
LV29.3−7.7−28.9700.079.5 62.1 78.7 57.0 22.0 12.80.936.4−5.6
LT146.7−33.382.80.0953.322.7108.8367.81333.378.3101.4303.929.6 1.0−25.141.0−55.6
LU112.8 −3.0 0.5427.662.4395.6204.91610.9612.32286.431.2 17.840.94.3−50.0
NL43.854.960.837.892.265.465.782.480.766.792.7121.28.93.37.313.75.9−37.5
NO6.7 33.4 84.229.355.343.297.2−9.545.9−9.09.09.616.59.44.4−11.1
PL96.9115.4296.0216.1342.2707.2414.4533.6388.3864.3199.3192.1−36.6−50.5 −23.625.4−8.1
PT33.4−36.056.9−35.7108.3−51.4246.3359.7141.8 190.1112.083.9 1.333.83.9−16.8
RO38.1−100.039.3−96.6505.0867.7364.5257.2311.1 70.4−15.9−26.3 19.1−18.133.5−25.8
SK20.1 75.0 77.682.661.3478.858.3−34.5−43.4−14.410.0 9.2−13.919.2−42.9
SI0.71030.041.1178.0164.2−7.2114.3140.9174.3−27.647.023.0−27.6−39.93.47.99.5−17.6
ES21.967.53.758.8108.0311.7104.6169.1106.5363.158.884.2−9.8−6.03.213.86.0−25.0
SE18.2 15.3 101.1170.3112.2237.298.6126.9111.7241.620.815.5 6.78.7−45.5
CH 58.175.574.794.164.1152.2100.0120.42.5−2.9 5.2−50.0
TR 107.9134.377.0268.5373.4544.3619.4233.1385.4513.6382.868.031.944.871.442.3
UK285.024.449.3162.772.792.054.285.770.968.928.737.3−23.6−28.216.621.98.70.0
Source: Authors computation with Eurostat date, 2020.
Table 5. Bi-dimensional synergies.
YX1YX2YX3YX4YX5YX6YX7YX8YX9YX10YX11YX12YX13YX14YX15YX16YX17
AT0.40.30.30.10.10.10.00.10.00.10.10.70.30.00.20.6−0.2
BE−0.20.40.90.60.80.40.40.60.90.30.00.10.30.00.00.0−0.2
CZ0.90.60.60.50.50.30.30.40.30.70.90.30.5−0.10.10.2−0.7
DK−0.7 −0.70.90.71.00.90.80.61.01.0−0.2−0.20.00.00.1−0.8
EE0.60.10.30.20.10.40.20.40.31.00.00.5 0.3−0.20.5−0.6
FI0.6−0.30.60.30.50.70.80.30.60.70.90.40.60.70.80.1−0.9
FR0.50.40.10.60.50.70.60.60.50.80.80.20.20.00.10.2−0.7
DE−0.10.30.10.50.60.40.50.60.70.30.30.0−0.10.30.20.1−0.4
EL0.20.90.30.80.20.91.00.8 0.60.00.4 0.10.0−0.20.0
HU−0.20.1−0.20.10.00.10.0−0.10.20.30.10.0 0.4−0.60.30.0
IS0.00.10.00.00.00.00.00.0 0.00.0−0.3 0.90.10.0
IE−0.40.7−0.50.80.50.80.60.50.20.60.70.2 0.10.00.5−0.6
IT0.31.00.40.60.40.70.90.50.00.30.30.50.40.00.00.0−0.6
LV−0.3−1.00.00.4 0.5 0.4 0.5 0.8 0.40.00.8−0.2
LT−0.20.60.00.20.20.70.40.10.50.70.50.2 0.0−0.20.3−0.4
LU 0.0 0.00.30.60.30.60.10.20.00.3 0.20.40.0−0.4
NL0.80.70.90.50.70.70.50.50.70.50.40.20.10.20.30.1−0.9
NO 0.2 0.10.20.10.20.1−0.70.1−0.70.70.70.40.70.7−0.6
PL0.80.30.40.30.10.20.20.20.10.50.5−0.4−0.5 −0.20.3−0.1
PT−0.90.6−0.90.3−0.70.10.10.2 0.20.30.4 0.01.00.1−0.5
RO−0.41.0−0.40.10.00.10.10.1 0.5−0.4−0.7 0.5−0.50.9−0.7
SK 0.3 0.30.20.30.00.3−0.6−0.5−0.70.5 0.5−0.71.0−0.5
SI0.00.00.00.0−0.10.00.00.00.00.00.00.00.00.20.10.10.0
ES0.30.20.40.20.10.20.10.20.10.40.3−0.5−0.30.10.60.3−0.9
SE 0.8 0.20.10.20.10.20.10.20.10.90.9 0.40.5−0.4
CH
TR0.00.00.00.00.00.00.00.00.00.00.00.00.00.00.00.0
UK0.10.20.60.30.30.20.30.20.20.10.1−0.1−0.10.10.10.00.0
Source: Authors computation, 2021.
Table 6. Results of bi-dimensional synergies.
VariablesSynergy/Trade-OffInterpretation
Share of renewable energy in the final consumption and Patent granted by Applicant’s country for the total USEPOSynergyRelatively important at 0.4
Share of renewable energy in the final consumption and Patent granted by Inventor’s country for the total USEPOSynergyRelatively important at 0.4
Share of renewable energy in the final consumption and GDP/personSynergyLow importance at 0.3
Share of renewable energy in the final consumption and R&D personnel in businessSynergyLow importance at 0.3
Share of renewable energy in the final consumption and Training electric industrySynergyVery low importance at 0.2
Share of renewable energy in the final consumption and Total trainingSynergyVery low importance at 0.2
Share of renewable energy in the final consumption and Air emissionTrade-offRelatively important at 0.4 (this showcases the efficiency of the KT policy in the renewable energy sector at European level as an impact factor on the environment)
Share of renewable energy in the final consumption and Researchers in the electric sector/Energy Employment/R&D personnel in electric industryTrade-offVery low importance at 0.1/0
Source: Authors’ interpretation.
Table 13. KT models matrix by country.
Local
Innovator
ImplementerGlobal InnovatorIntegrated Player
With desirable trade-off with air emissionsWithout jobs and income synergies Denmark, FranceCzech Republic
With job synergiesSpainPortugalNetherlands
With income synergies Finland
With jobs and income synergiesEstonia, RomaniaSweden Norway
Without desirable trade-off with air emissionsWithout jobs and income synergiesPoland LithuaniaItaly, Latvia, UK
With job synergies Germany, Hungary, Luxembourg
With income synergies
With jobs and income synergies AustriaBelgium
Source: Authors’ results and interpretation.
Publisher’s Note: MDPI stays neutral with regard to jurisdictional claims in published maps and institutional affiliations.

