
Optimal Solar Plant Site Identification Using GIS and Remote Sensing: Framework and Case Study


_Sun.png)
Abstract
:1. Introduction
1.1. Background
1.2. Problem Statement
1.3. Aim and Objectives
- To identify the contributing parameters that are important in locating PV plants within an area;
- To apply the AHP as a Multicriteria Decision Analysis approach to quantify and develop a weight for each parameter;
- To delineate and map optimal solar PV sites using GIS techniques;
- To calculate the potential photovoltaic electricity production (PVOUT) for each site evaluated for suitability.
1.4. Literature Review
- Ascertaining a better classification method for categorizing residential areas: RF;
- Providing a method for calculating the potential electricity consumption for each region (PVOUT);
- Creating a model that can be replicated to fit various regions, without the need to repeat the project, but providing similar data.
2. Materials and Methods
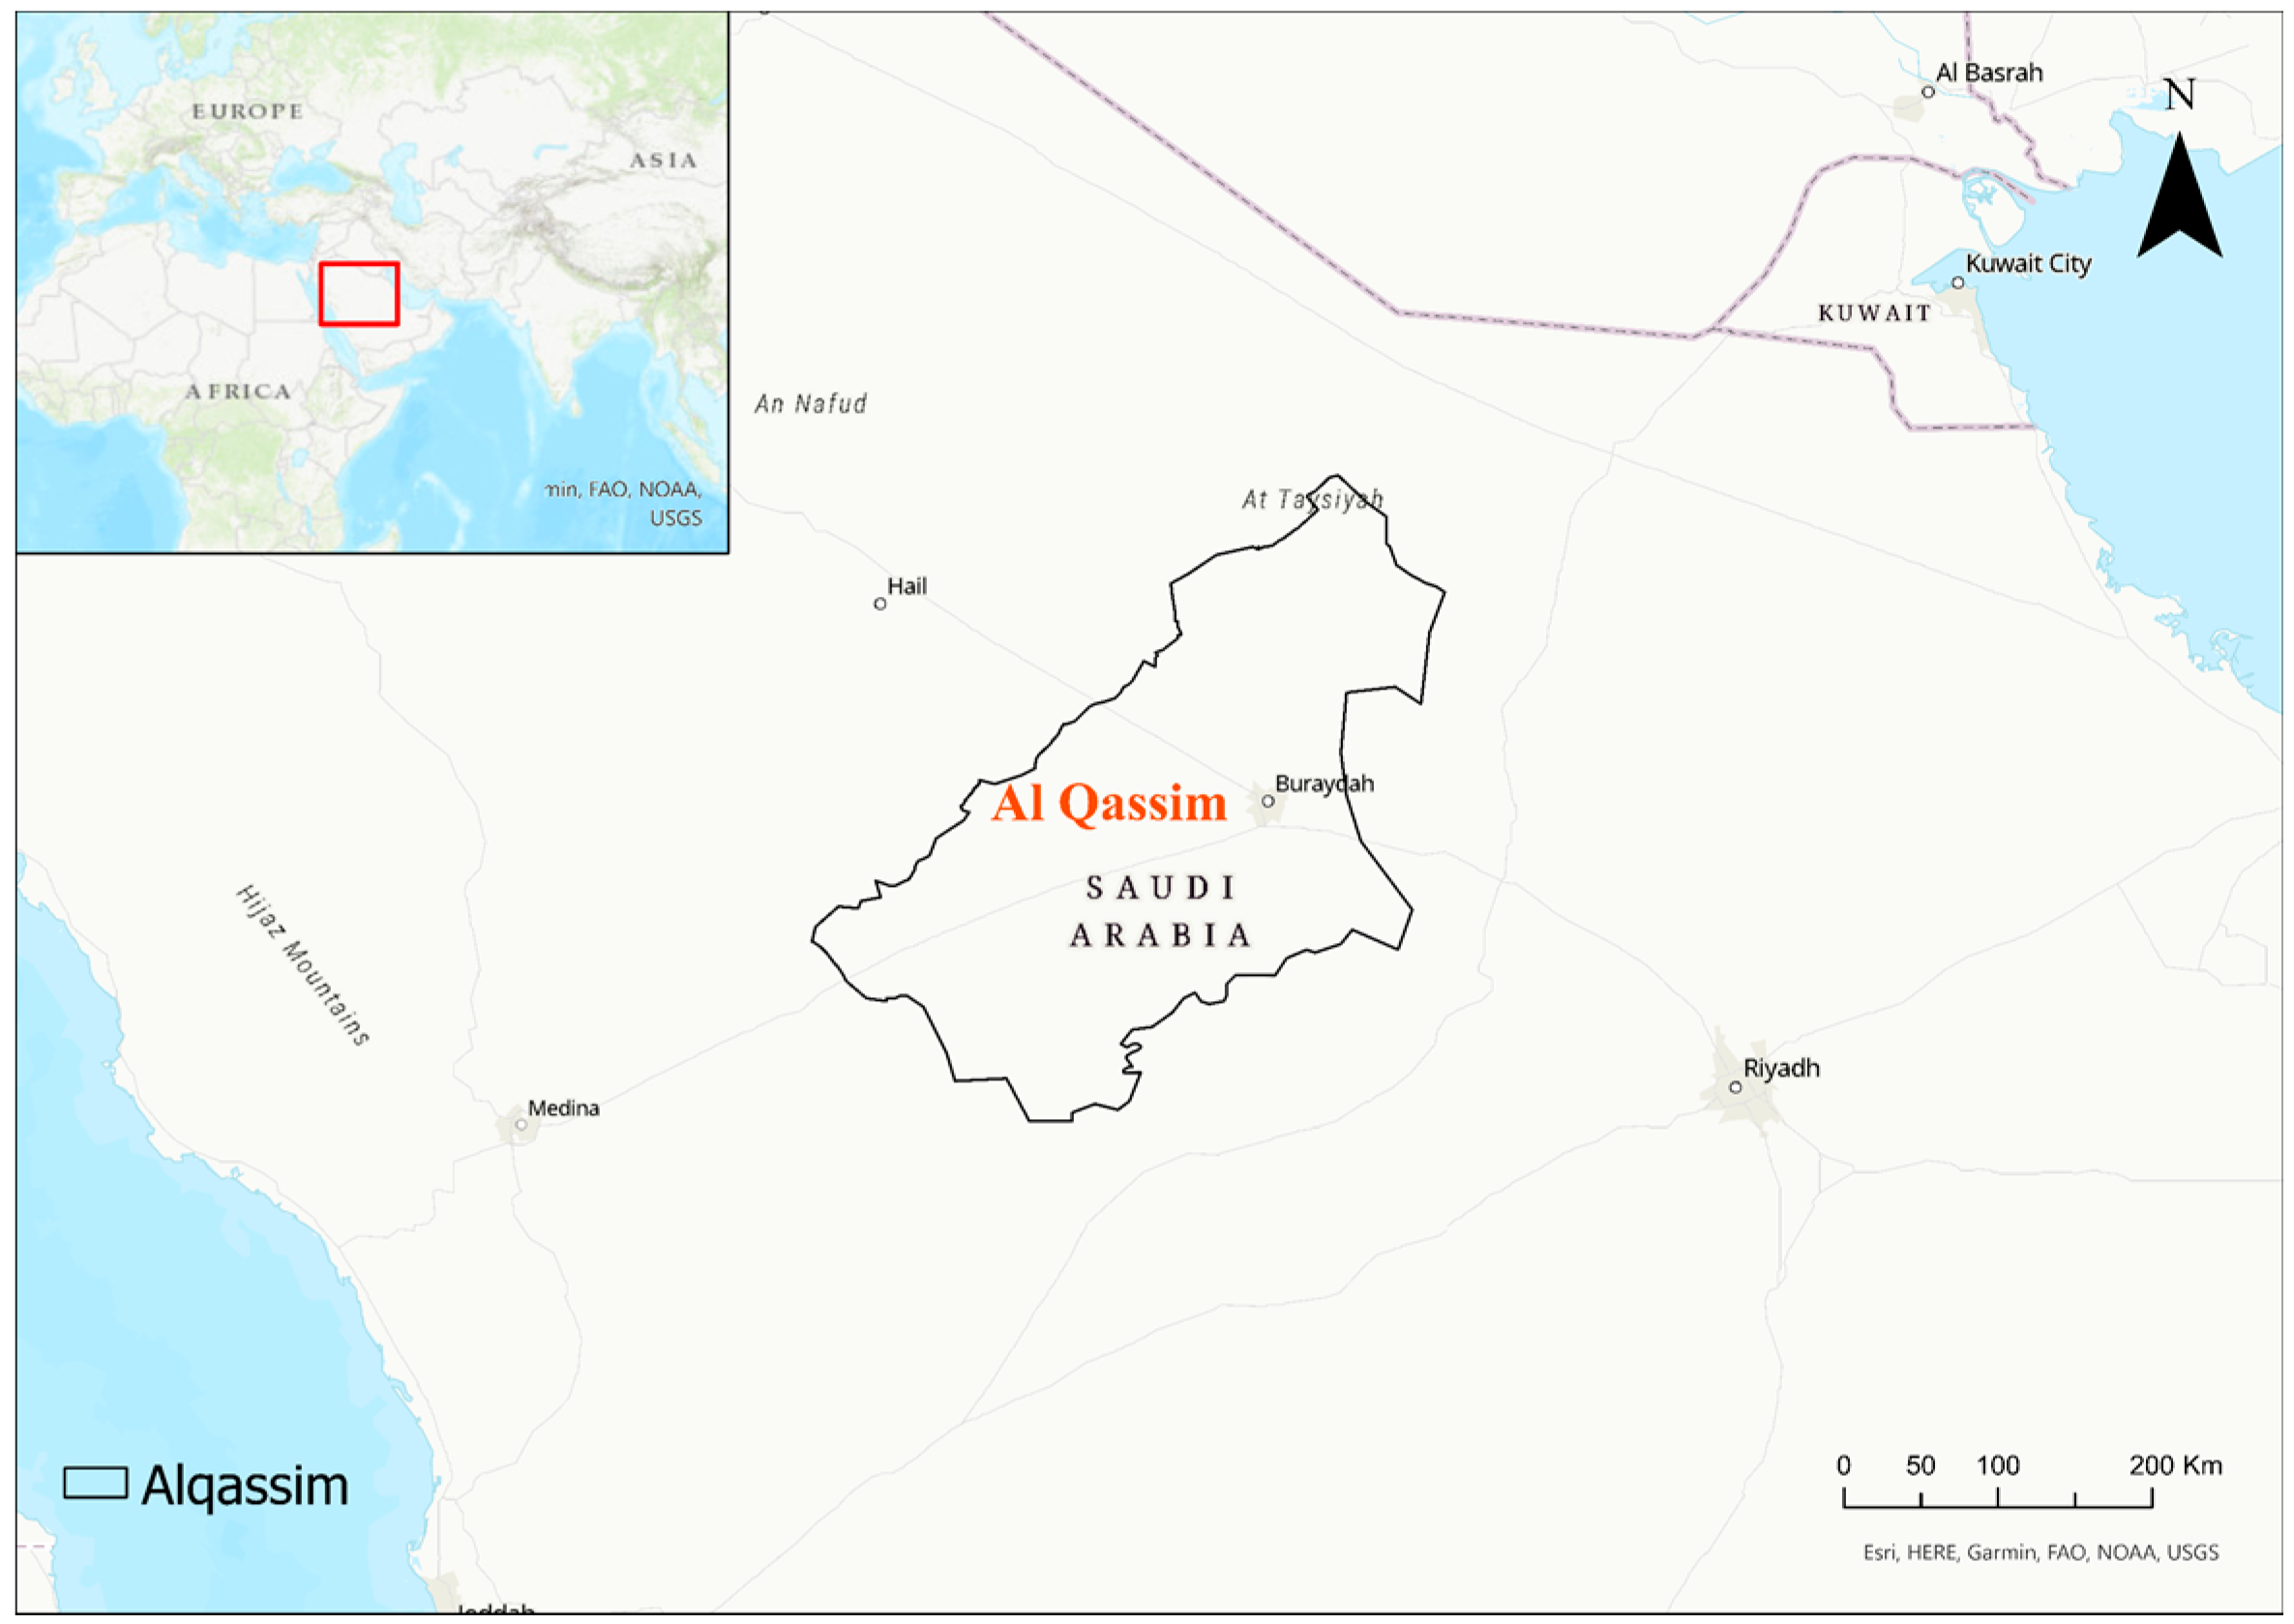
2.1. Study Area and Data Collection
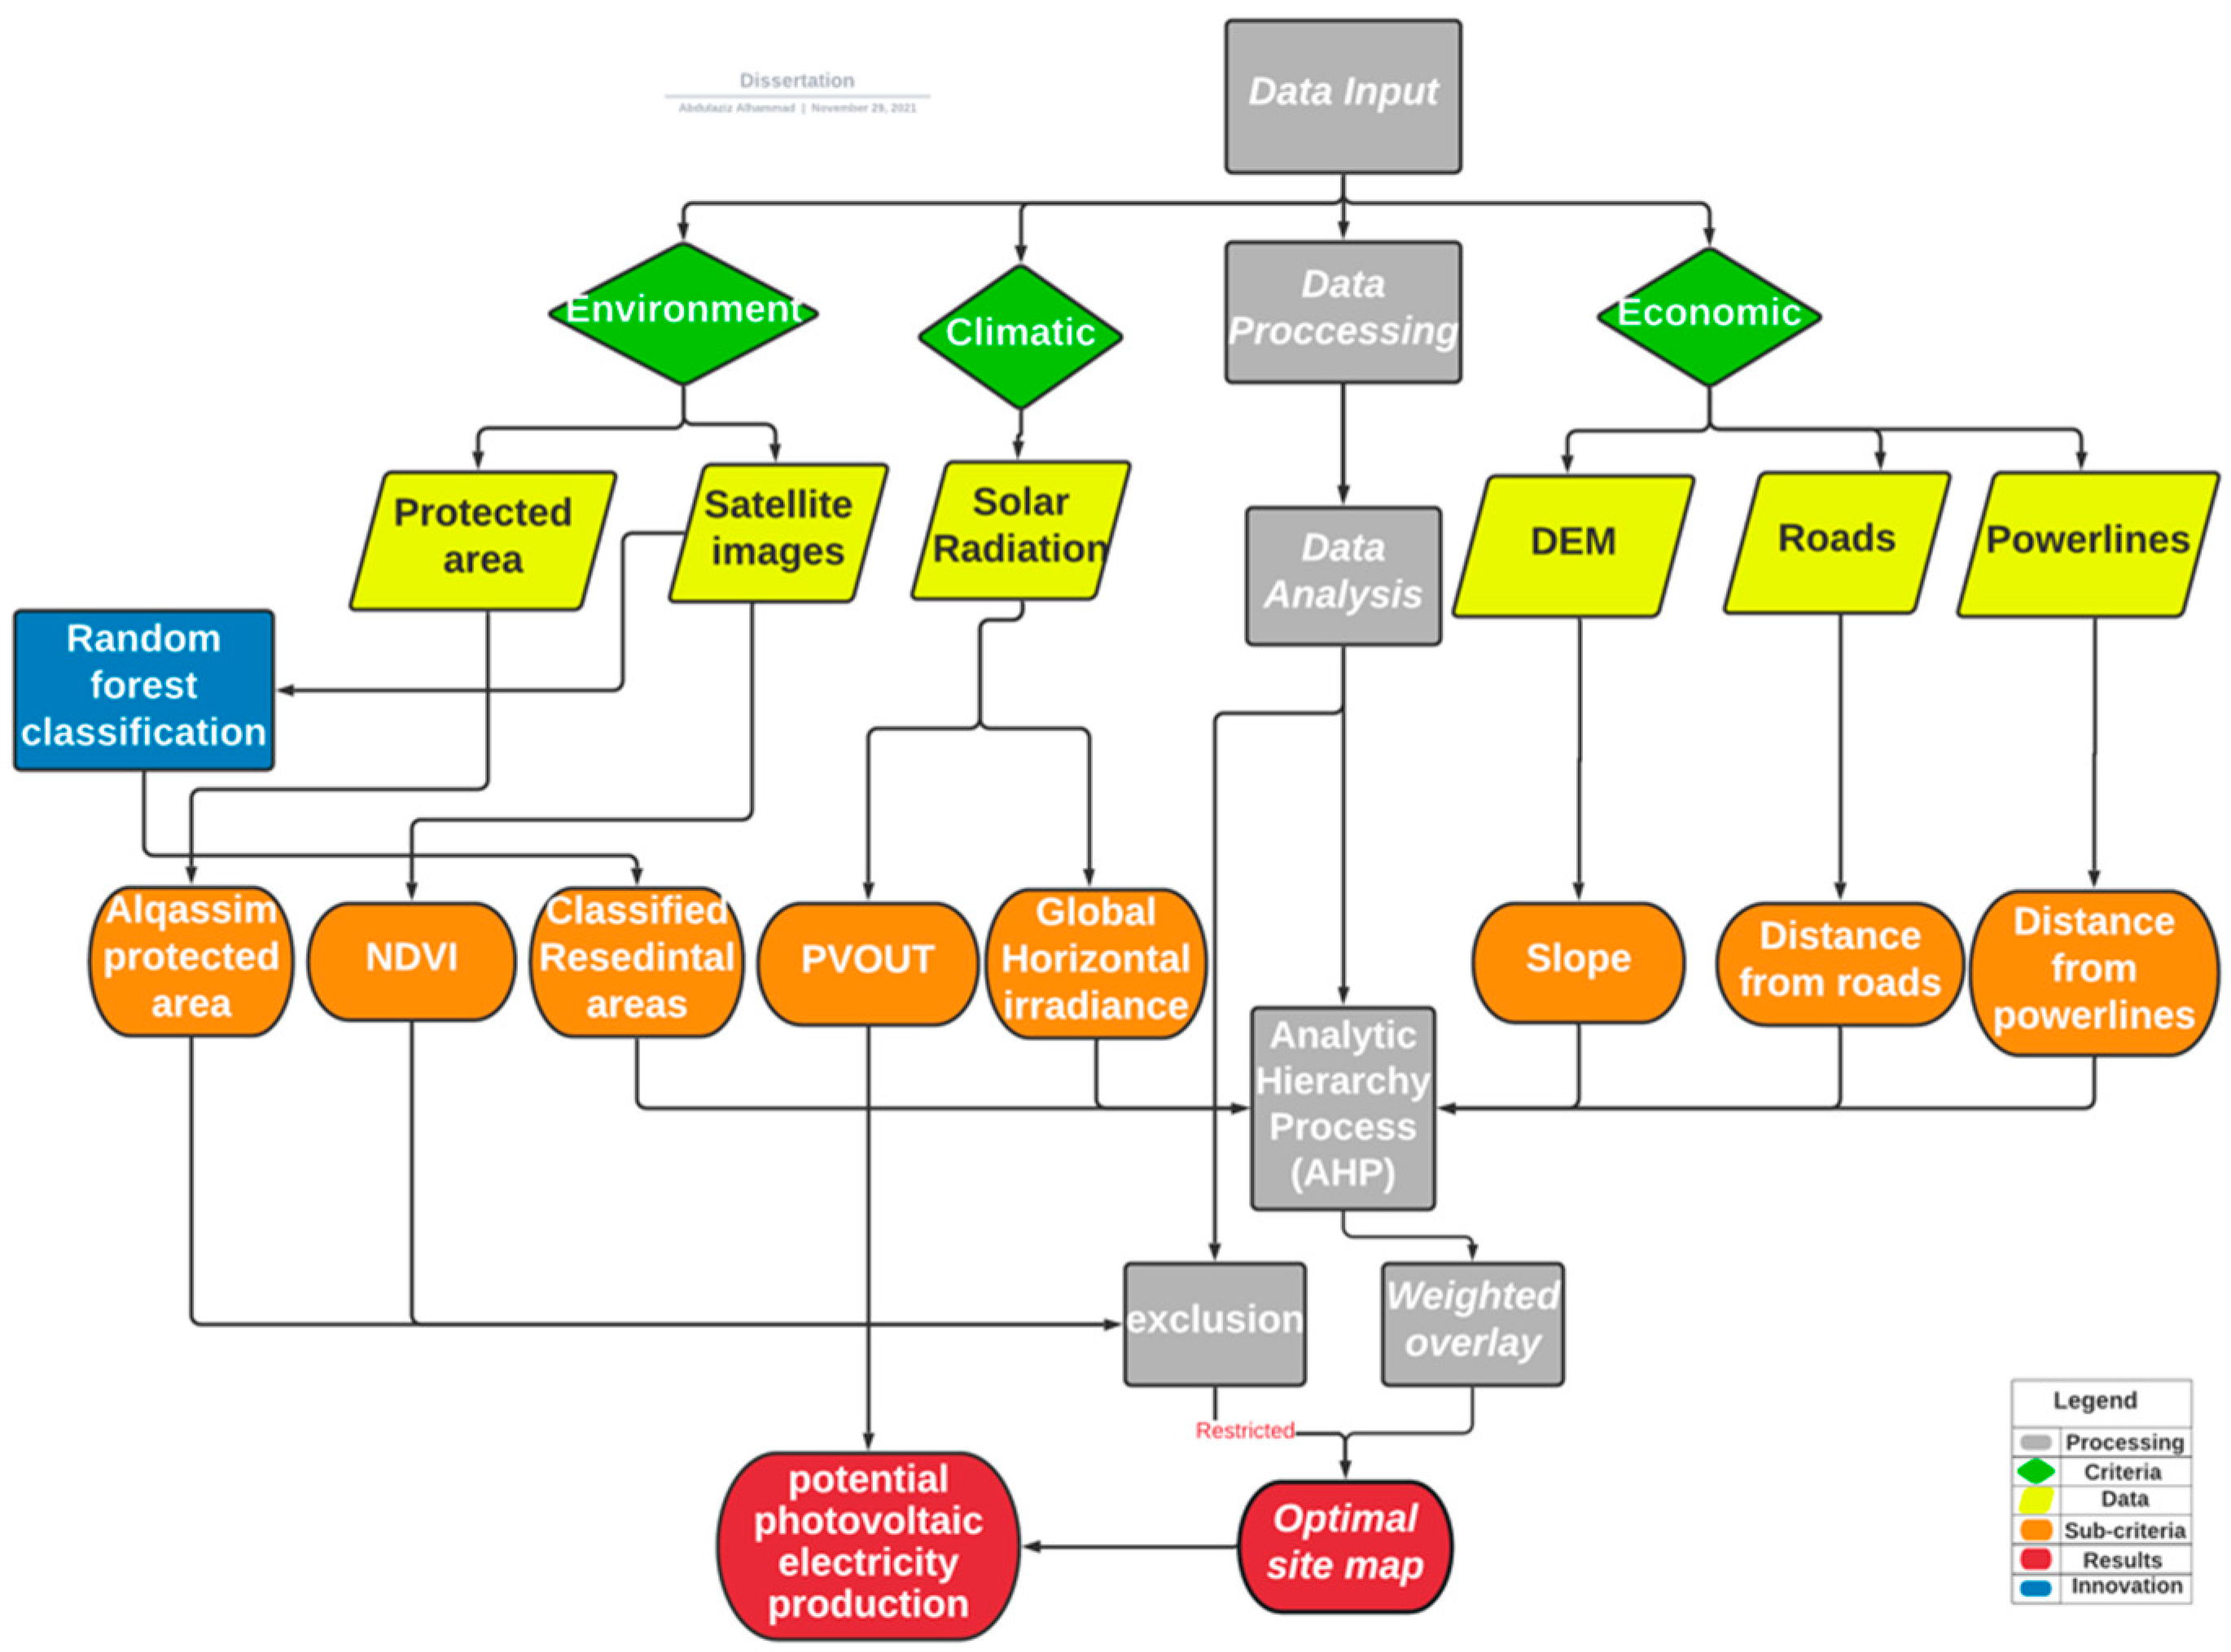
2.2. Methodological Framework
2.3. Selection Criteria
2.3.1. Economic Criteria
2.3.2. Environmental Criteria
2.3.3. Climatic Criteria
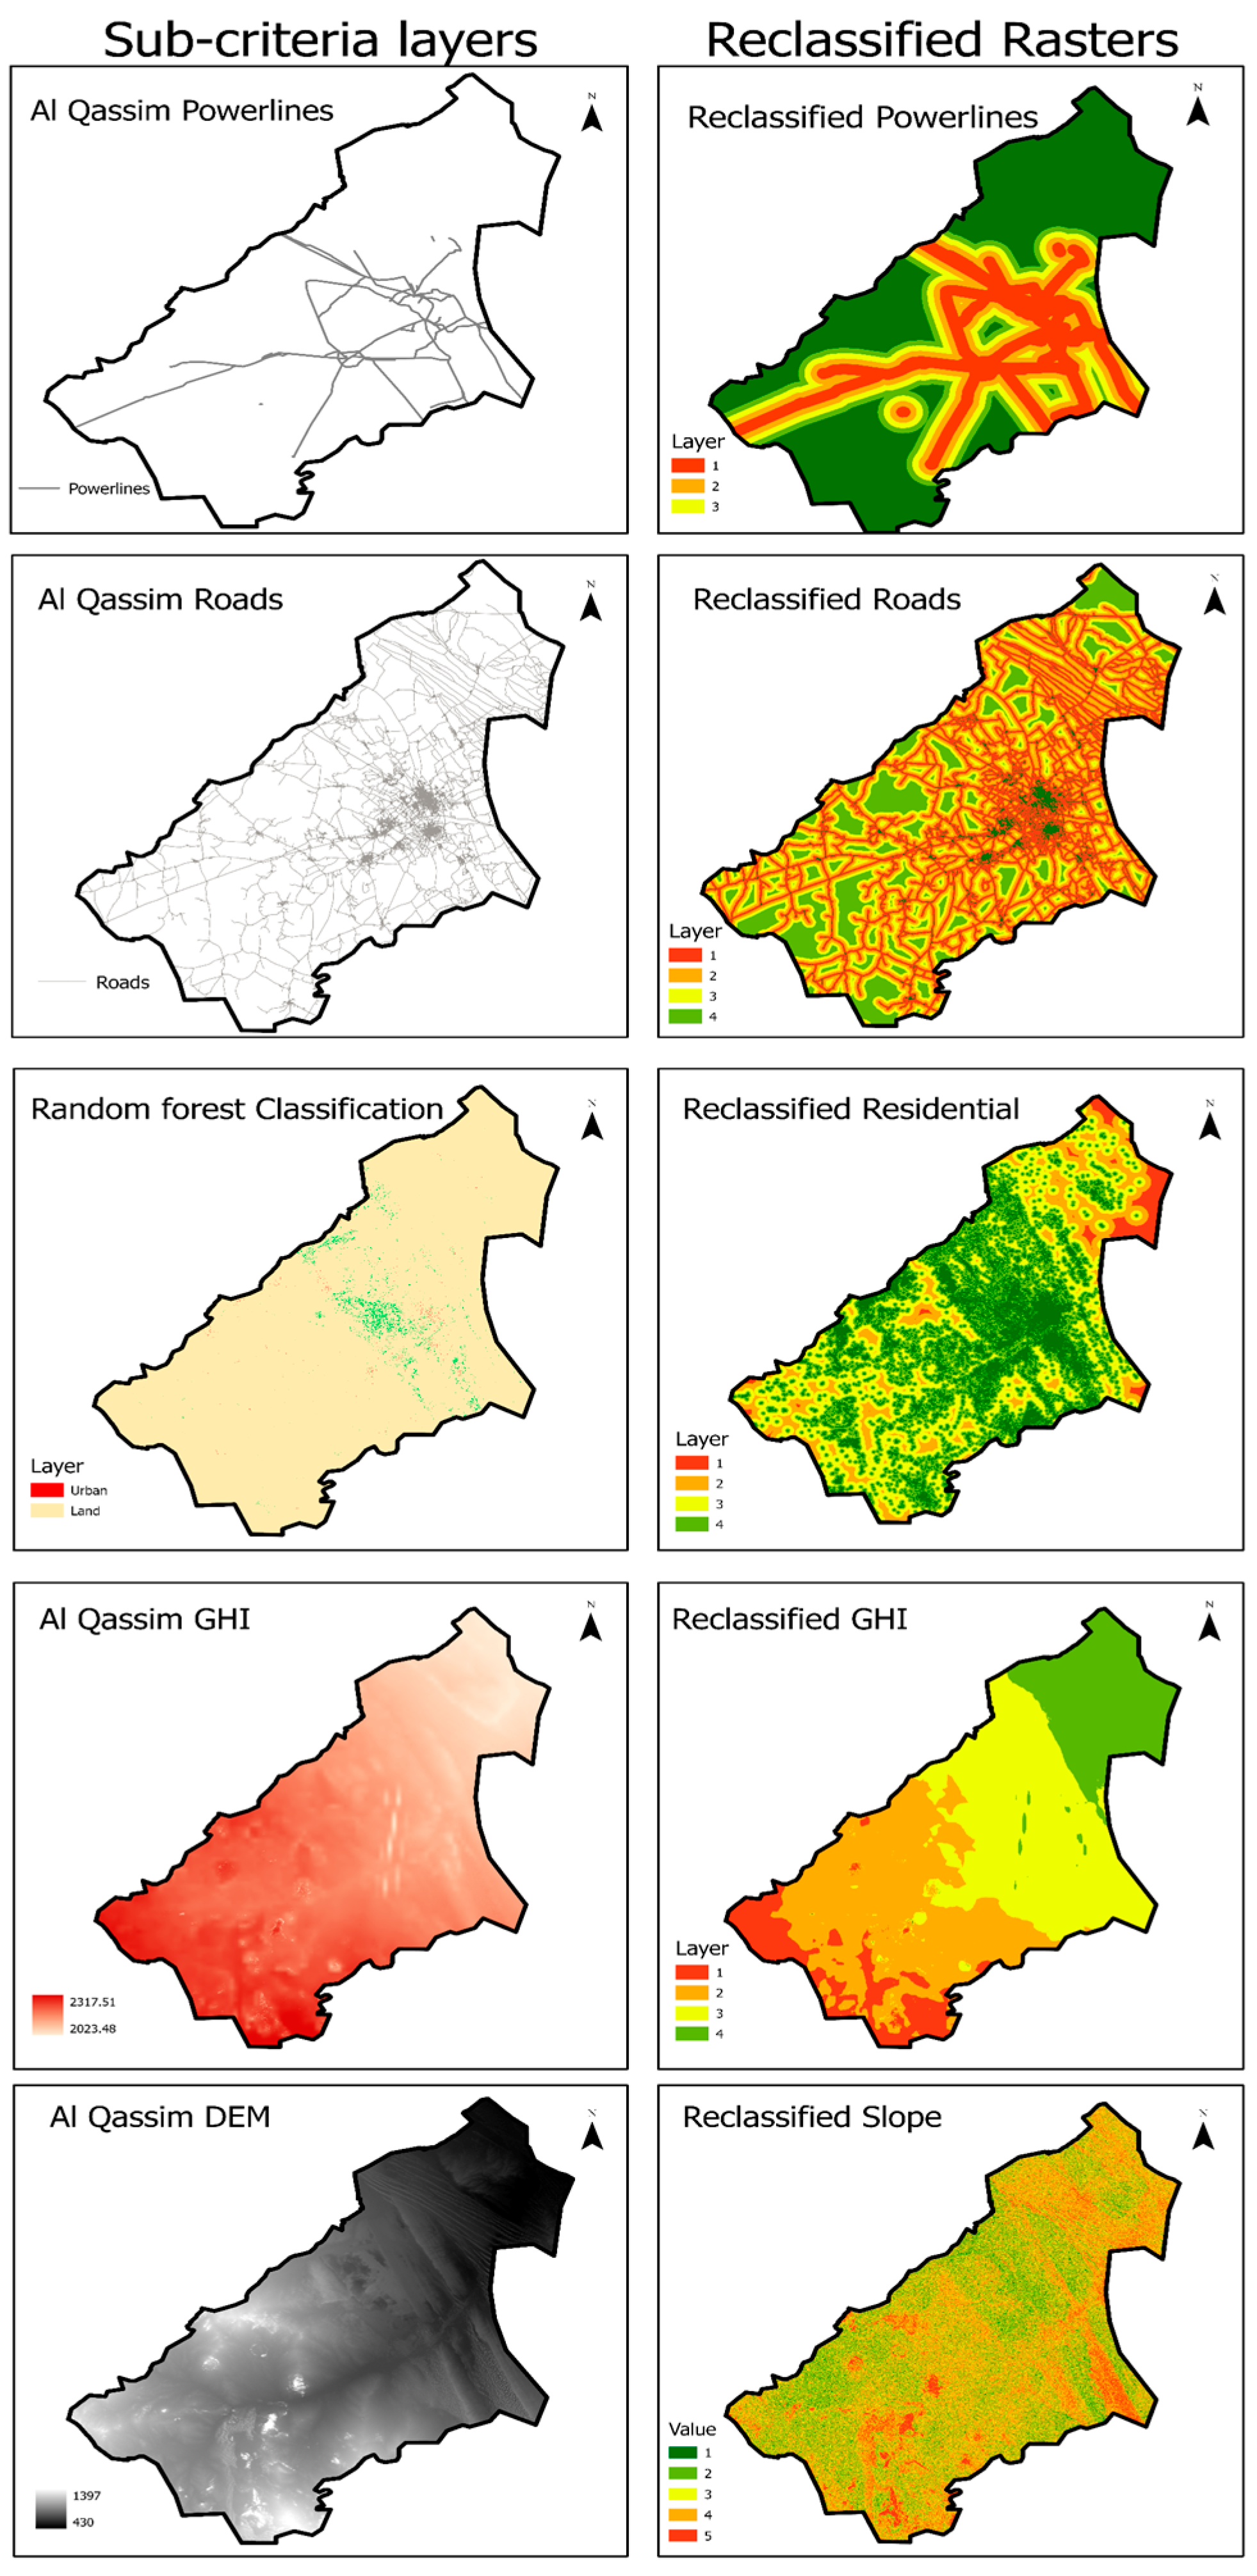
2.4. Data Processing and Modeling
2.4.1. Economic Factors
Proximity to Roads
- Clip the road data to the study area boundary.
- Create raster buffers for the roads using the Euclidian distance tool. “Euclidean distance is a way to perform distance analysis in ArcGIS Spatial Analyst. Euclidean distance functions measure the straight-line distance from each cell to the nearest source. Not only can you determine the attribution, but you can also calculate the distance and direction to the nearest source”, [35] paragraph one.
- Reclassify the Euclidian distance data results of the roads using the previous mentioned study to create the buffers.
- These results were then used later on with the weighted overlay analysis in Section 2.5.
Proximity to Powerlines
Slope
2.4.2. Environmental Factors
Distance from Residential Areas
- Maximum number of trees/50
- Maximum tree depth/30
- Maximum number of samples per class/100,000
2.4.3. Climatic Factors
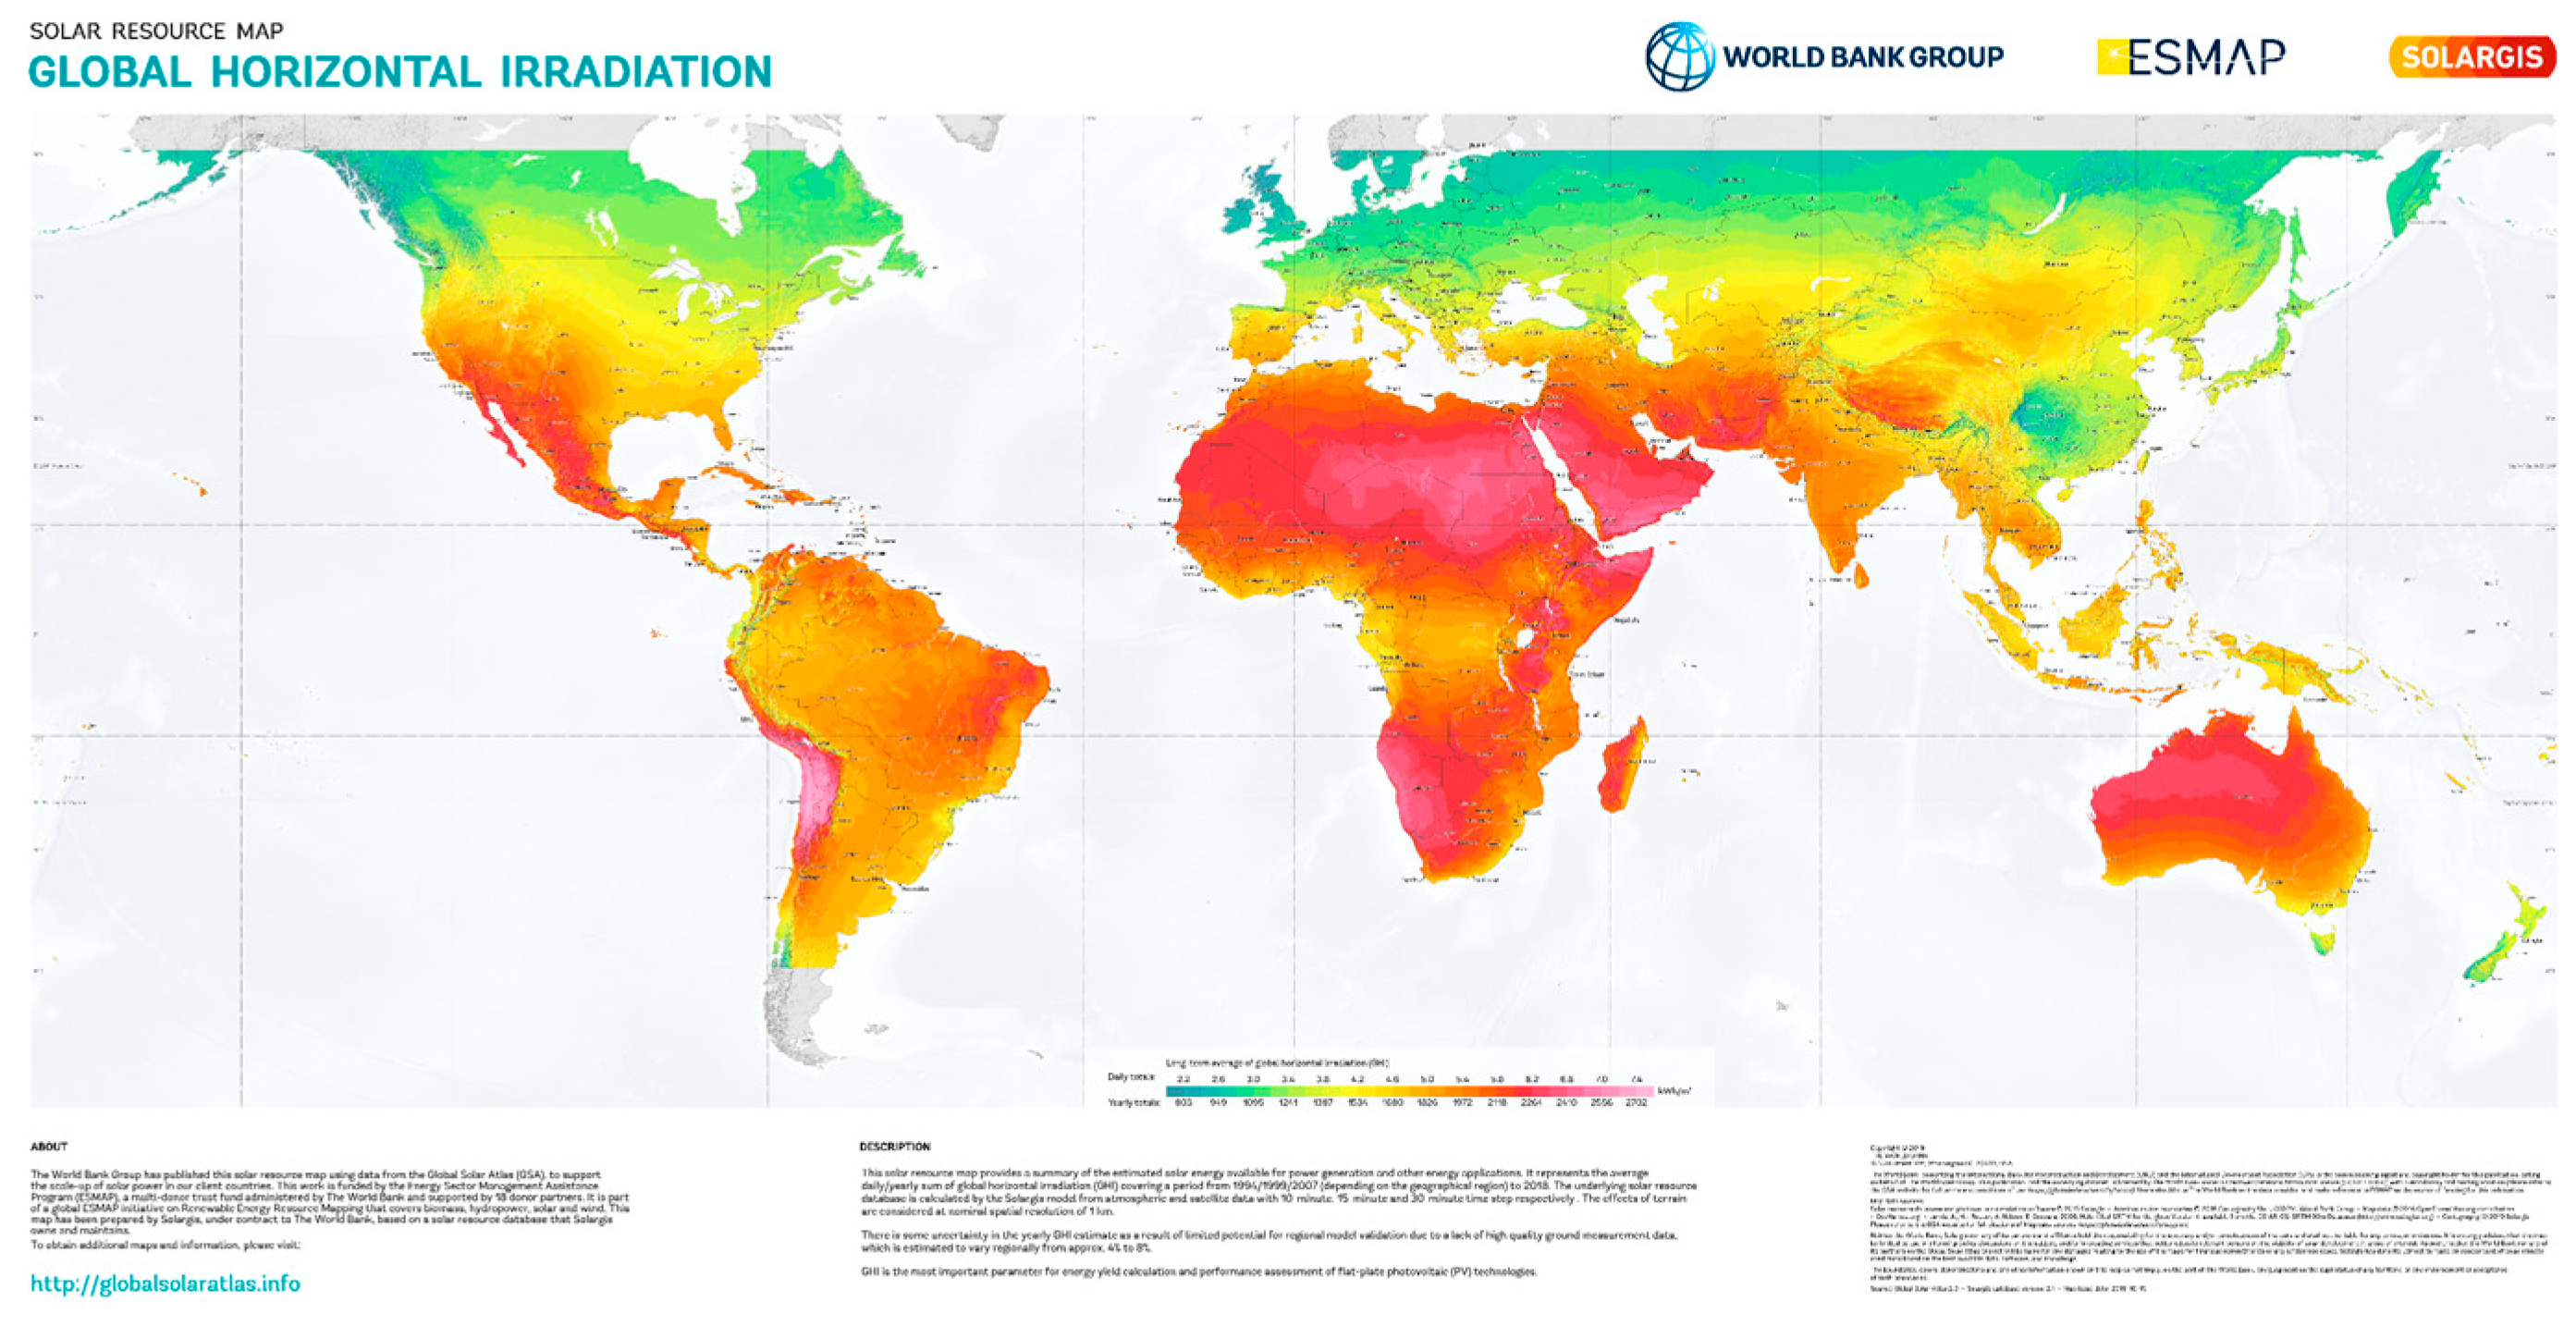
Global Horizontal Irradiance (GHI)
- DNI = Direct Normal Irradiance
- θz = zenith angle
- DHI = Diffused Horizontal Irradiance
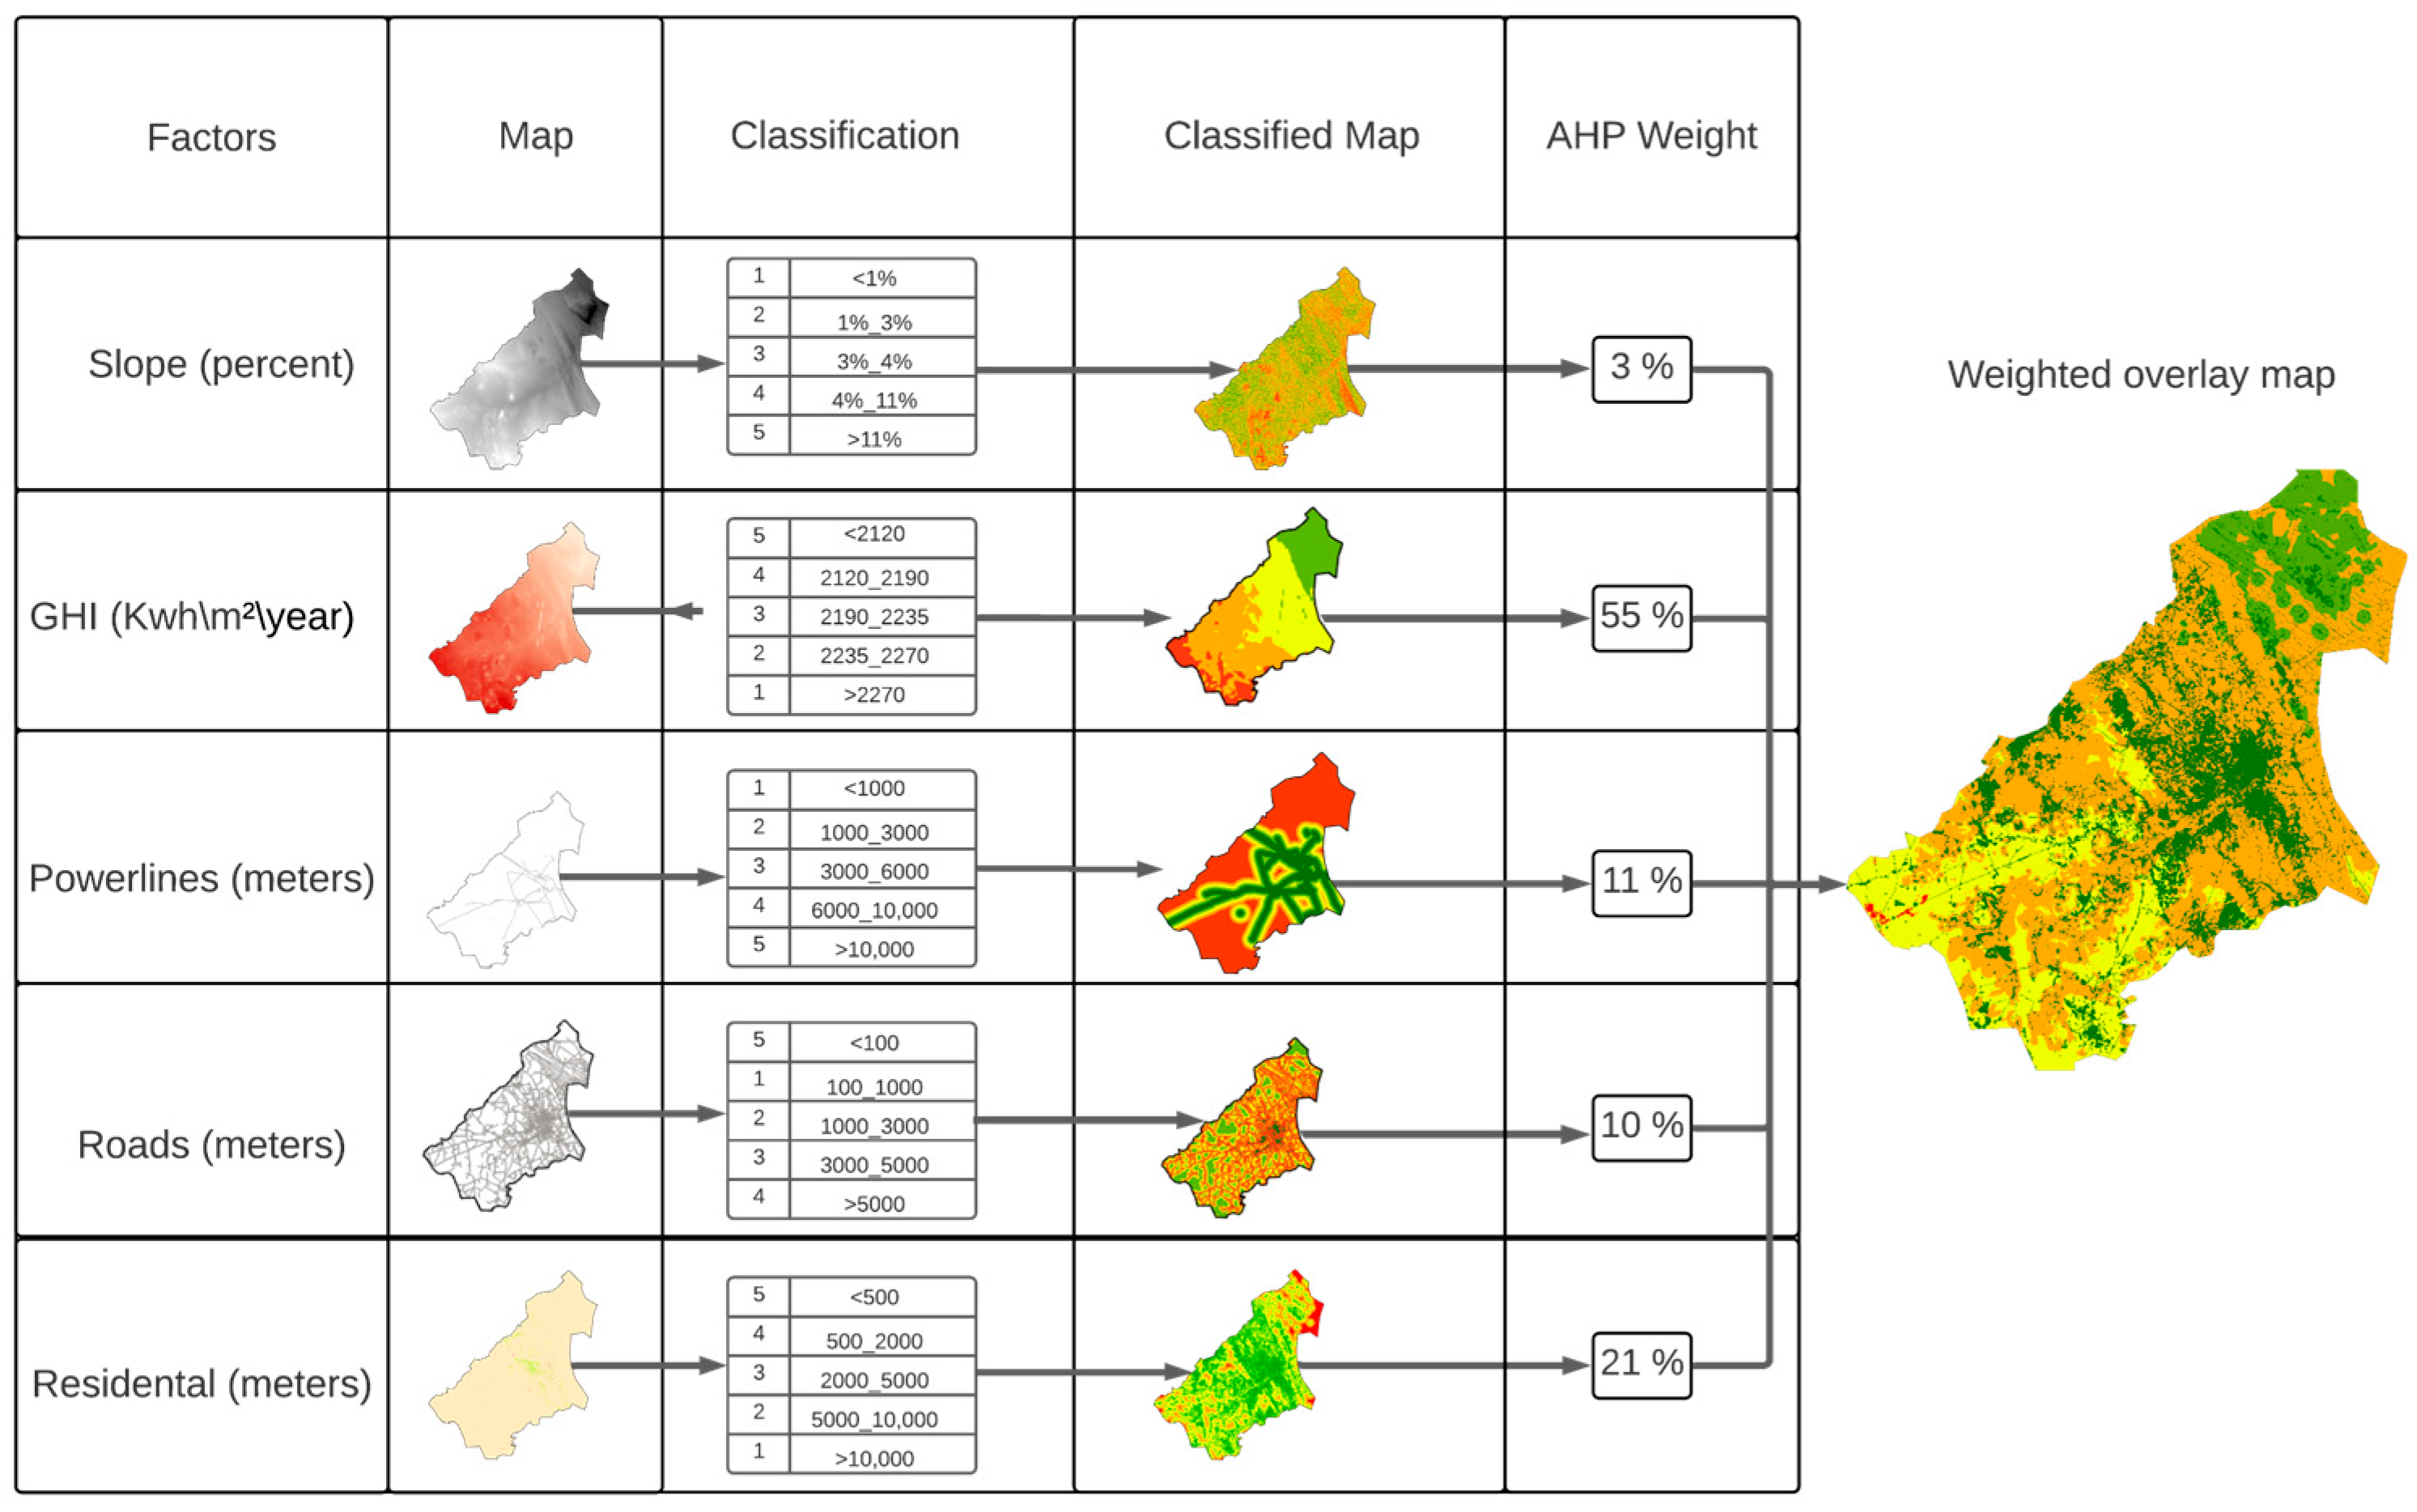
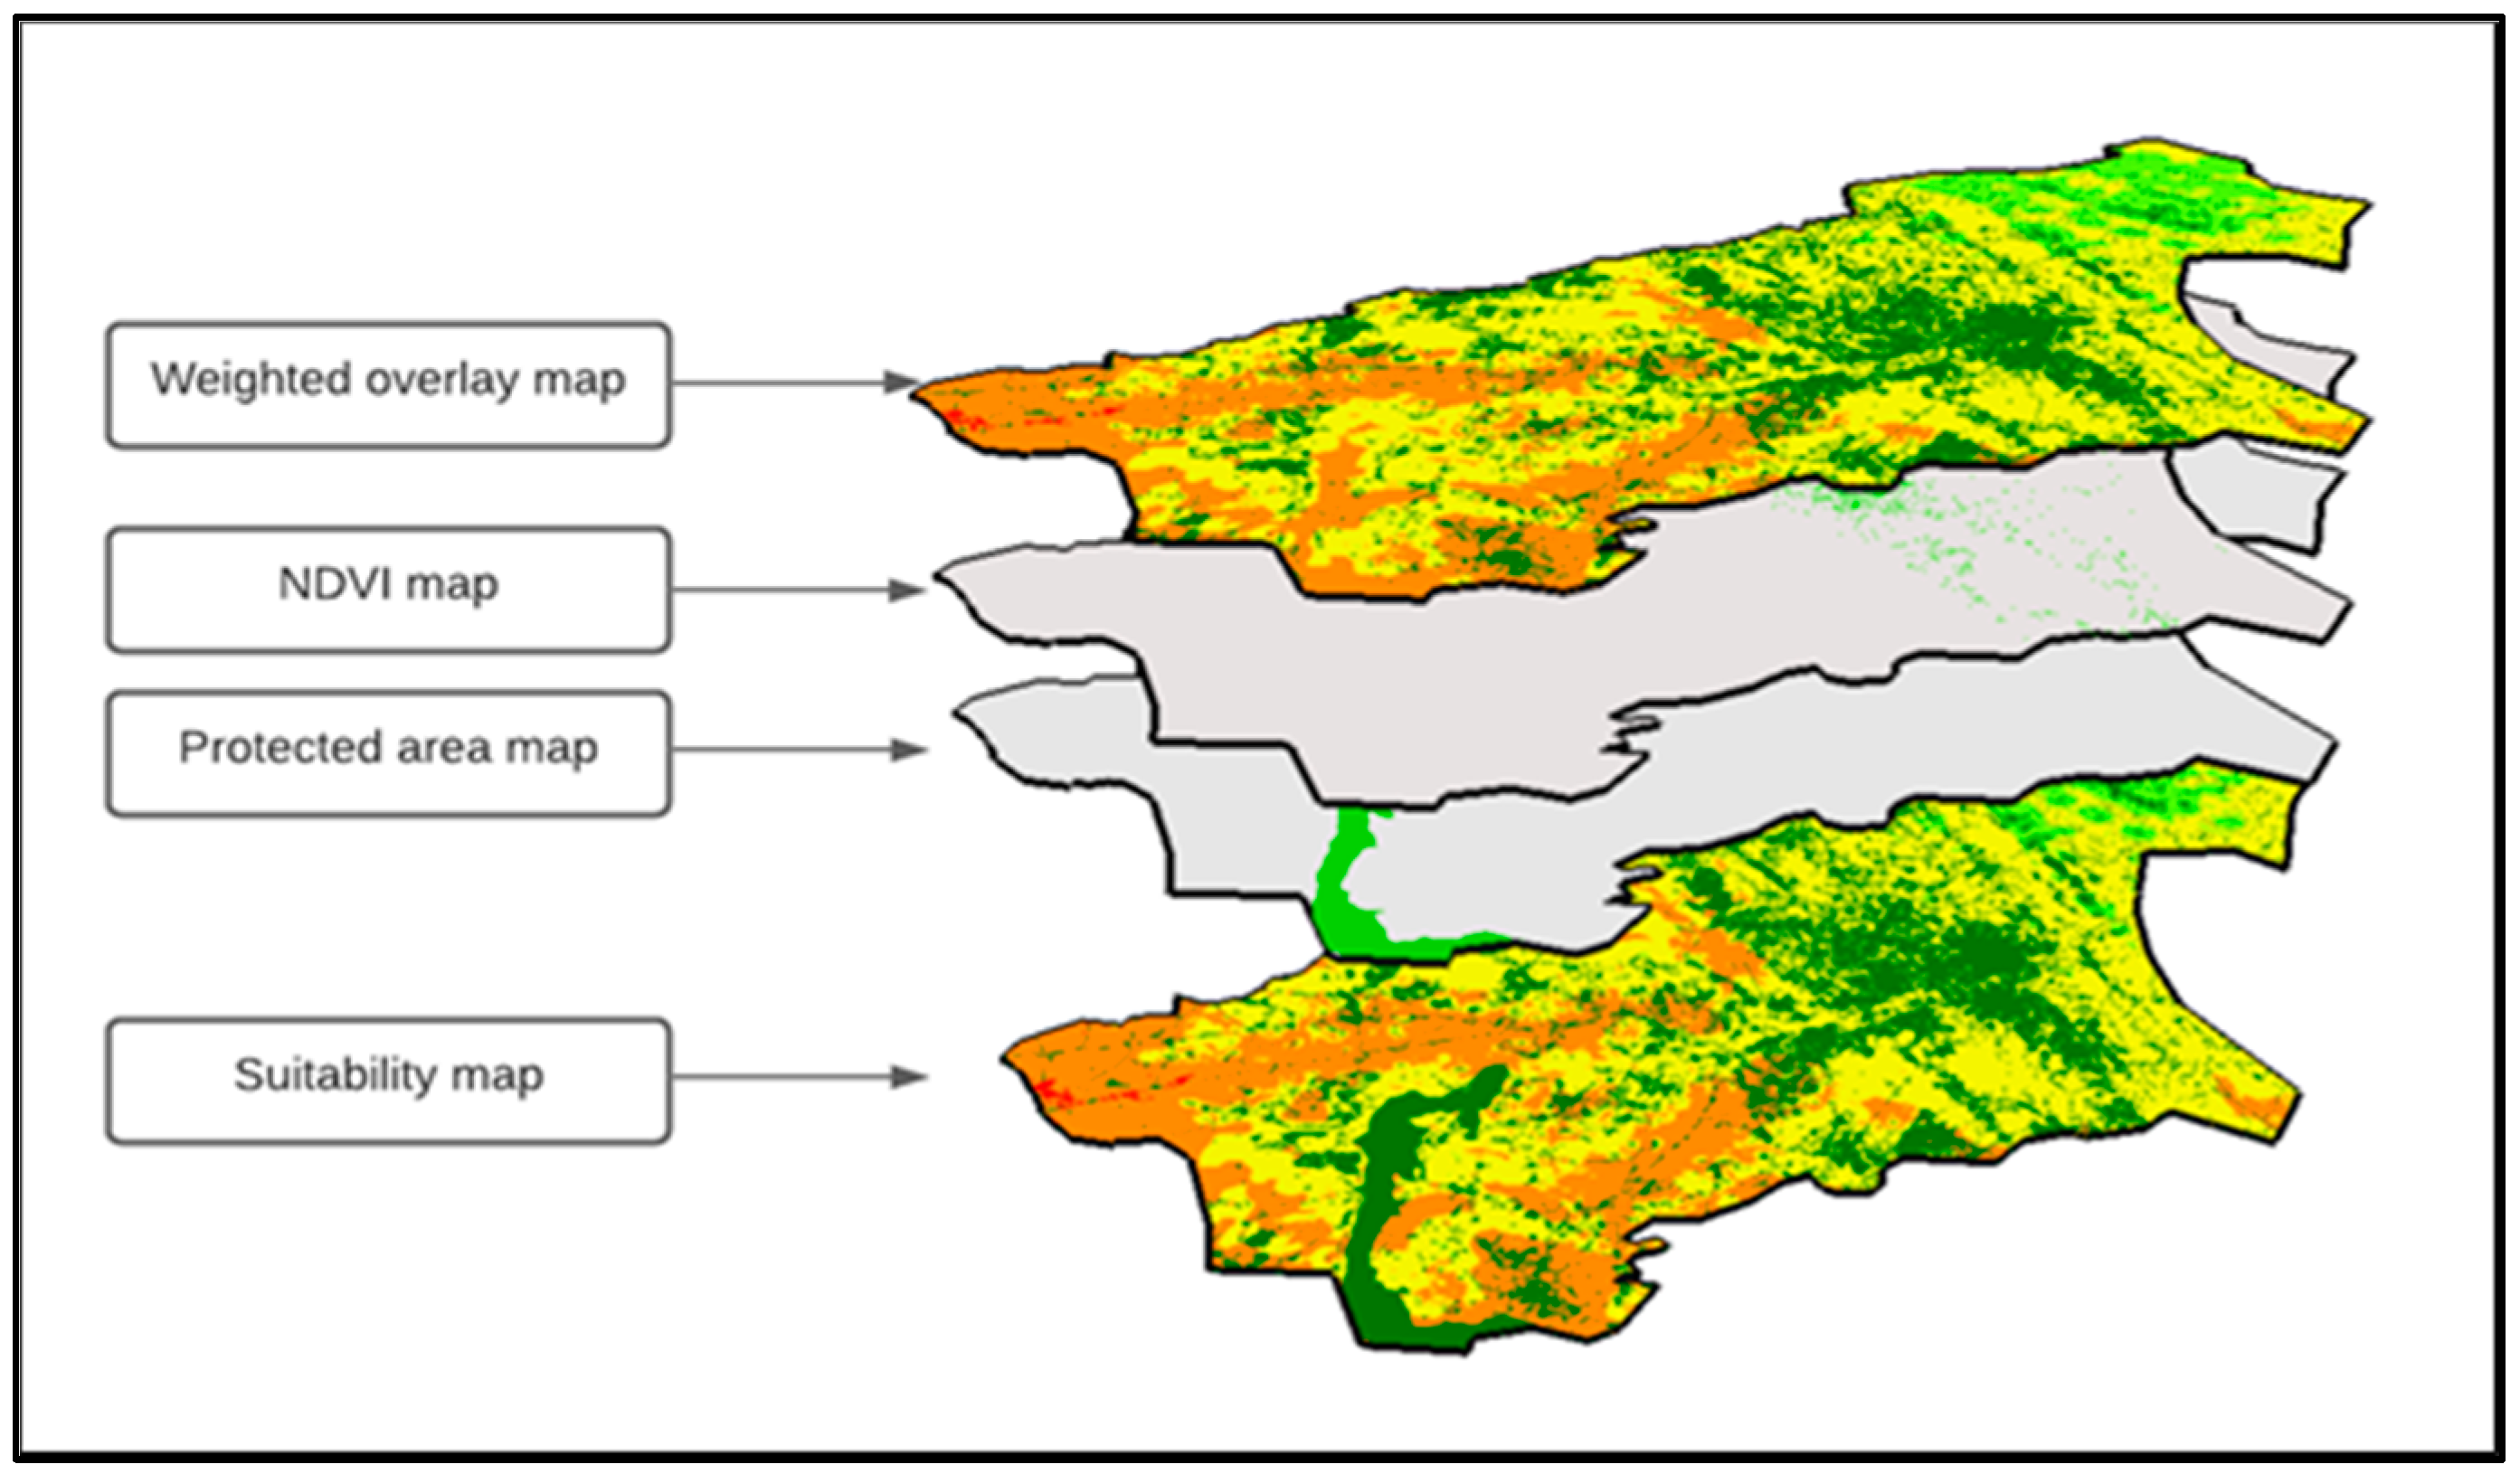
2.5. Weighted Overlay Analysis Using AHP
- PVPI = Photovoltaic potential indicator
- Wj = Weight
- j = the layer
- Xi = value of each class with respect to the j
- m = total number of parameters
- n = total number of classes
2.6. Excluded Areas
2.6.1. Normalized Difference Vegetation Index (NDVI)
- red band 1 = band 5 NIR
- green band 2 = band 3 green
- blue band 3 = blue band 2
- 1 = from 1 to 0.1999
- 2 = from 0.20 to 1
2.6.2. Protected Areas
2.7. Project Analysis Model
3. Results
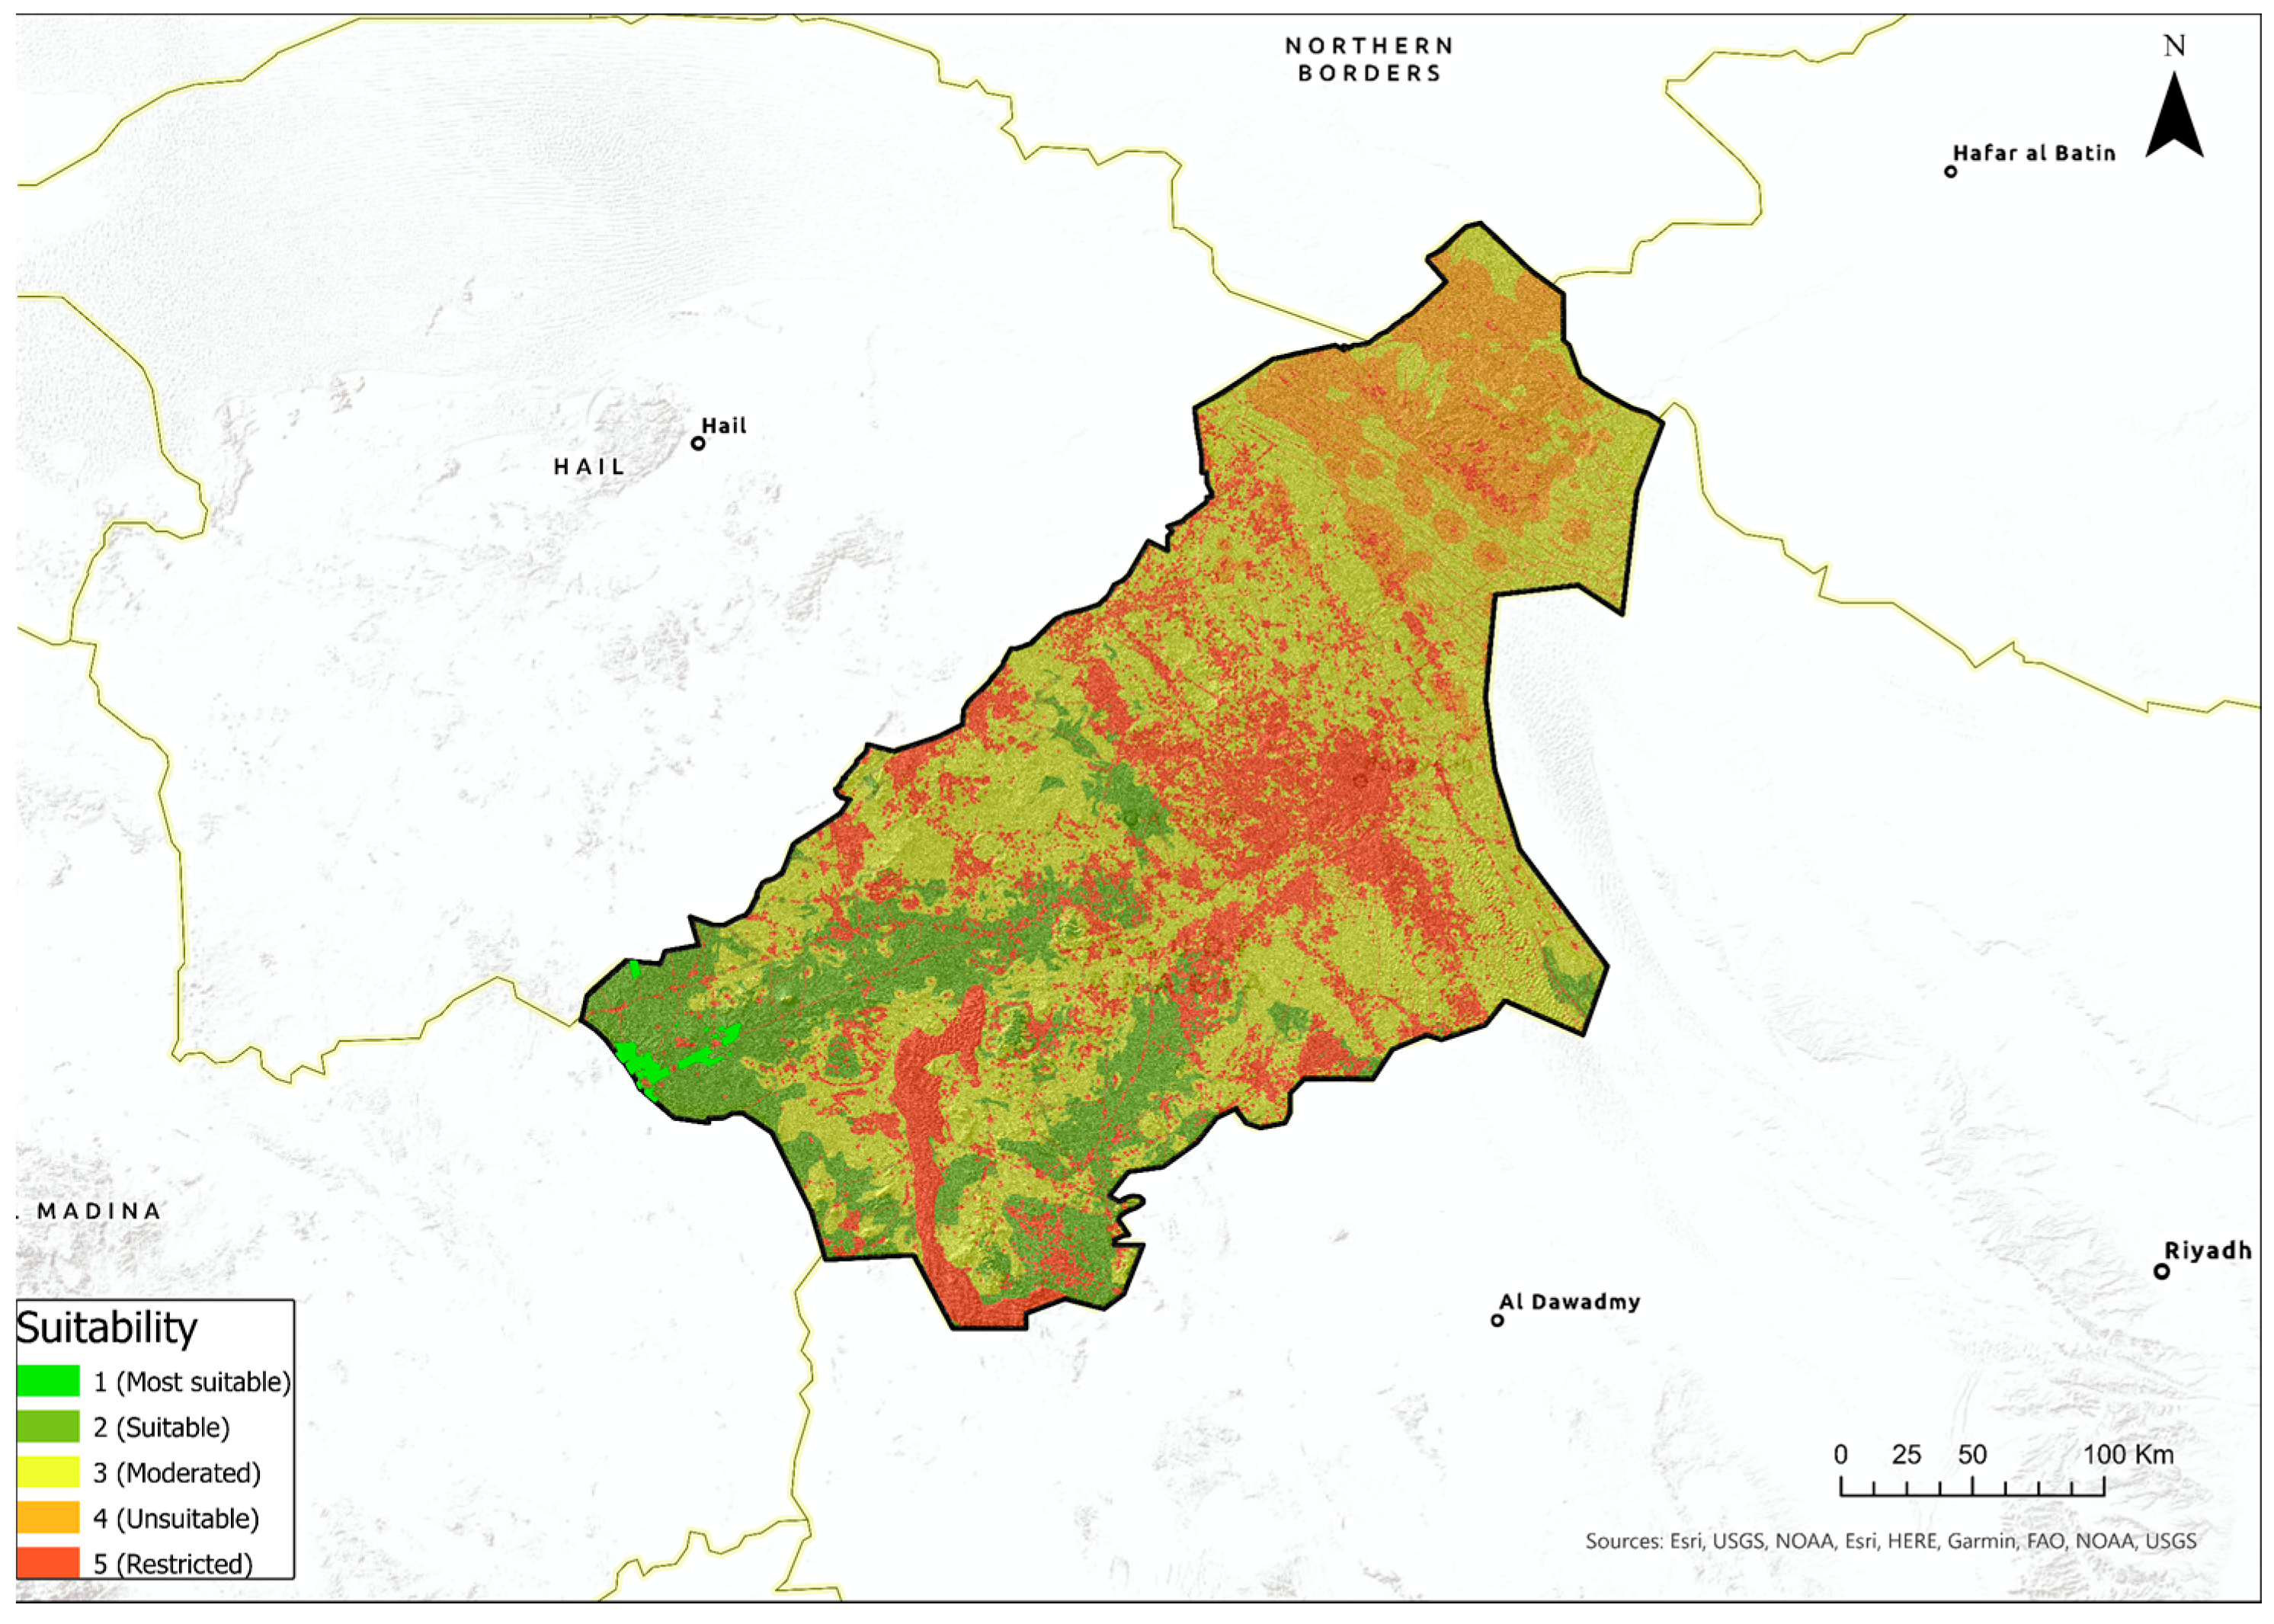
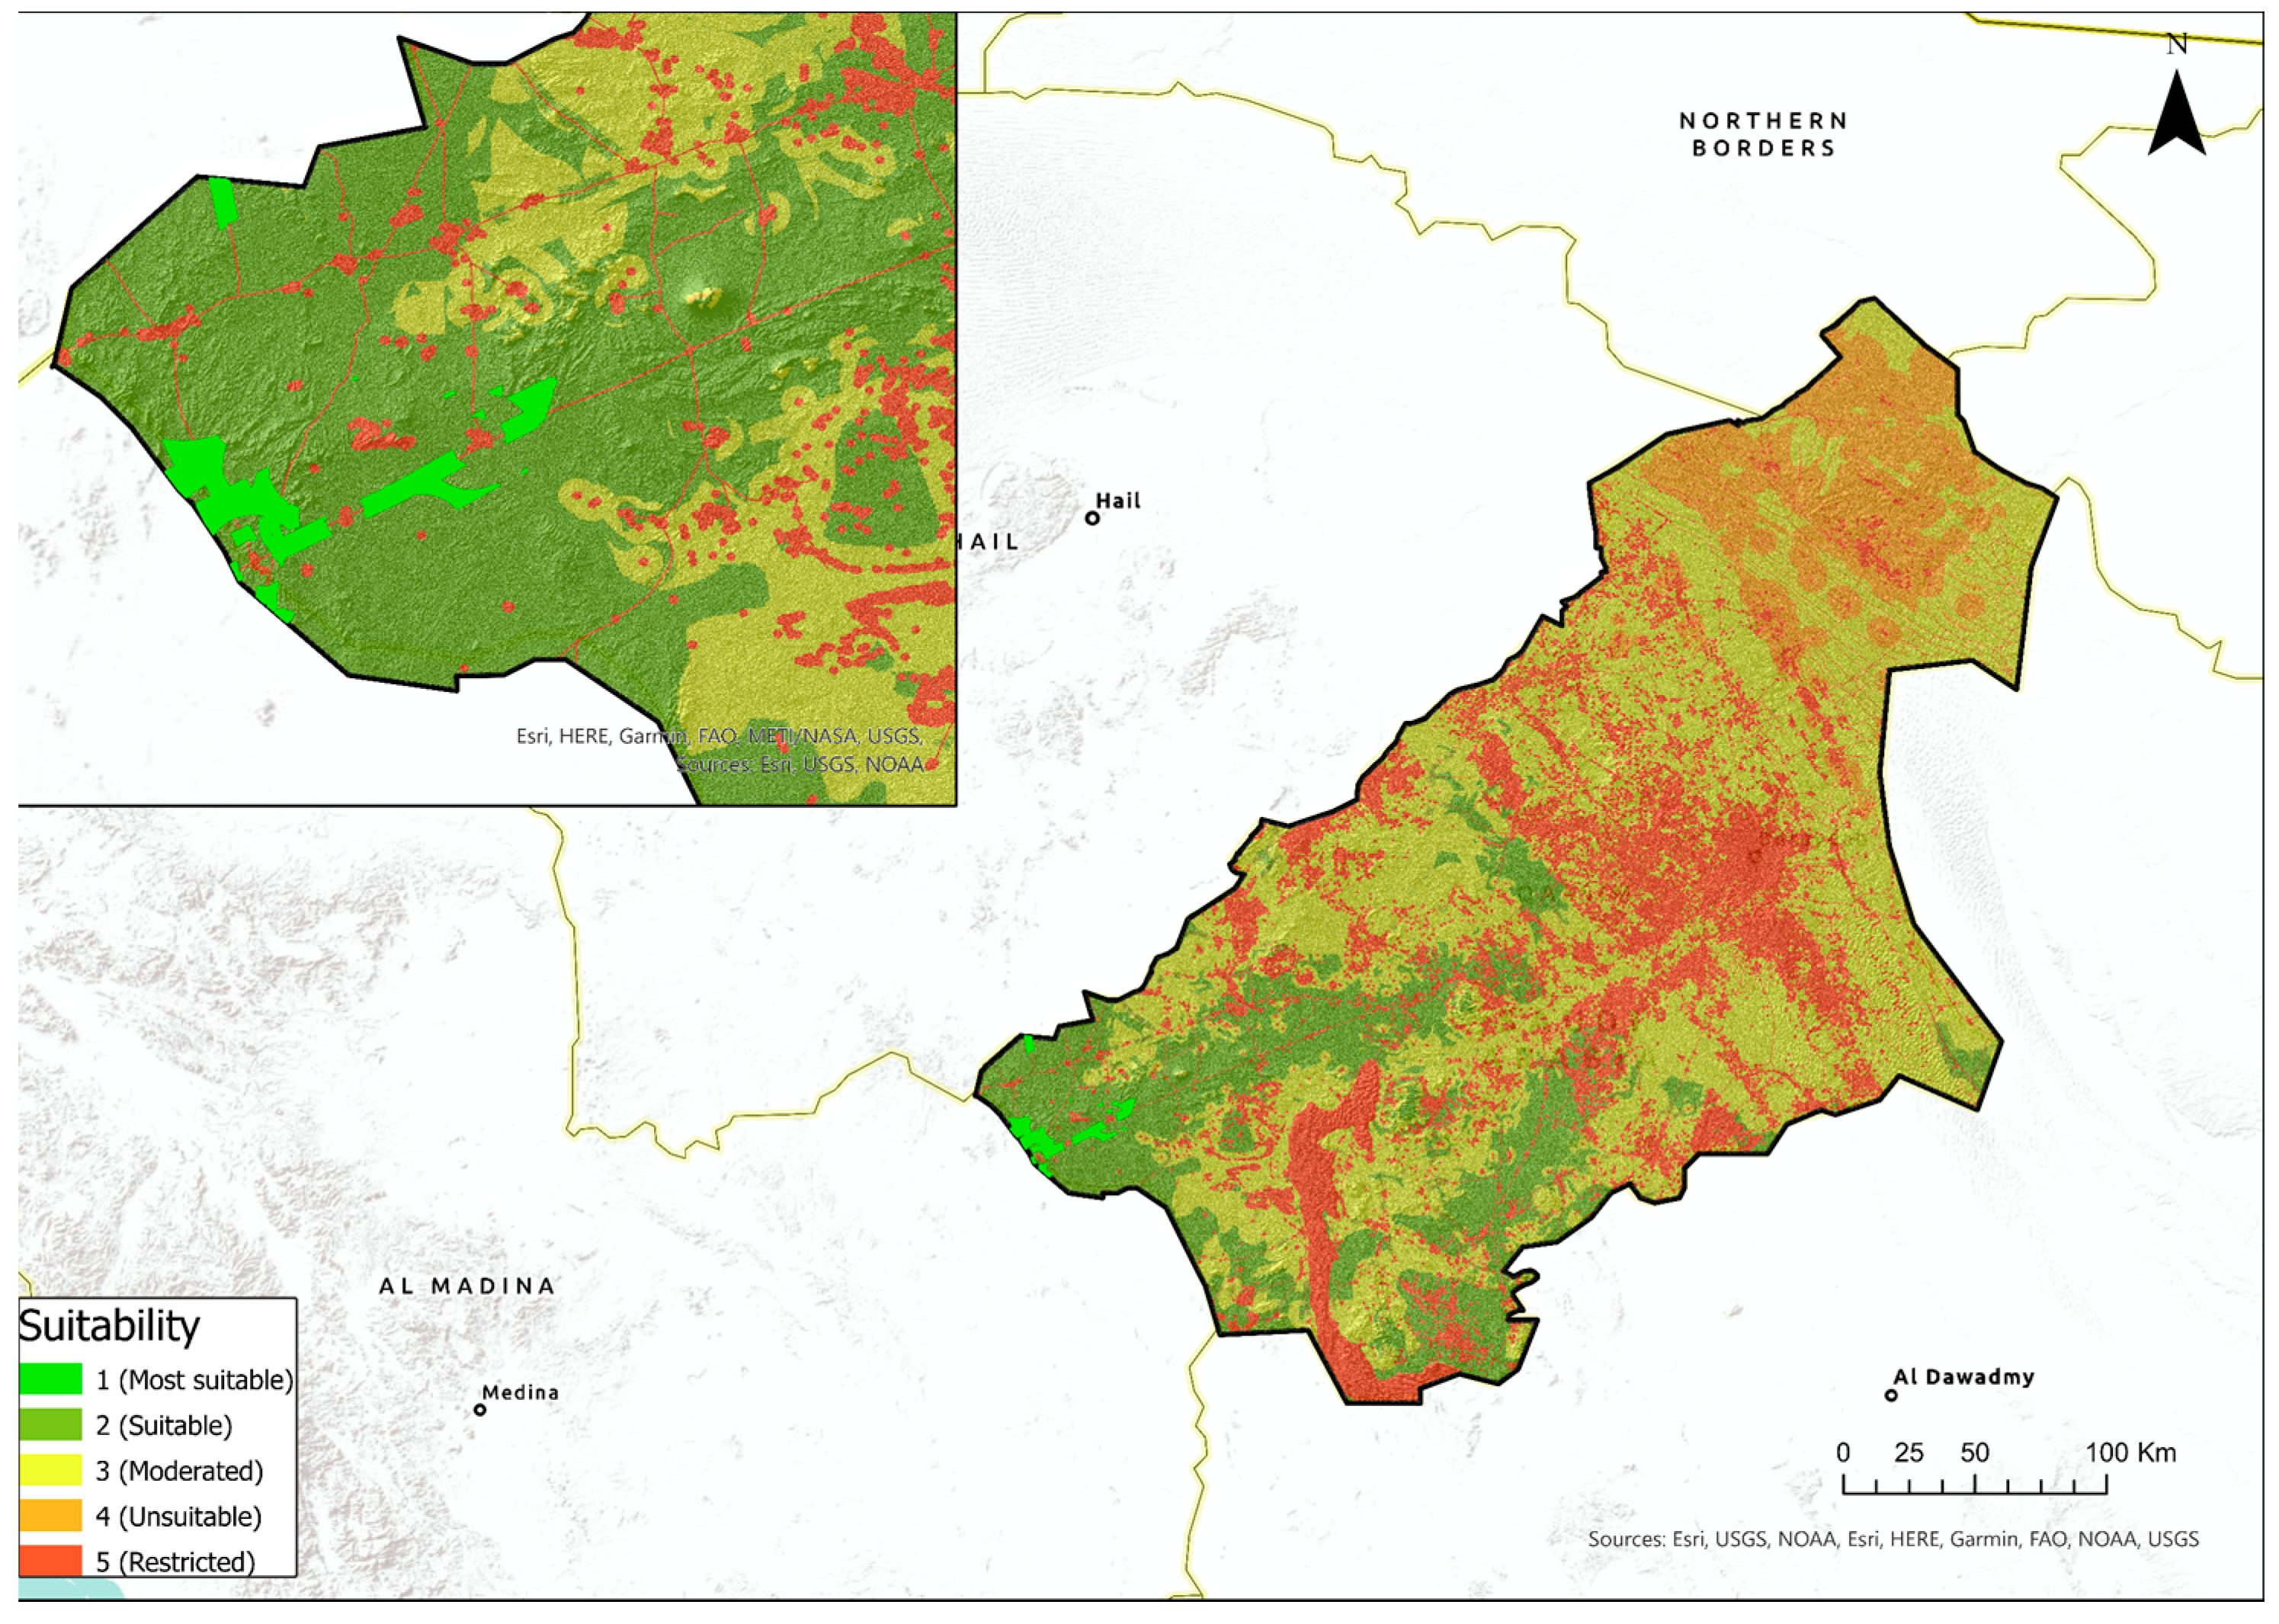
3.1. The Suitability Maps
3.2. Potential Photovoltaic Electricity Production
4. Discussion and Conclusions
Supplementary Materials
Author Contributions
Funding
Institutional Review Board Statement
Informed Consent Statement
Conflicts of Interest
References
- Al Garni, H.Z.; Awasthi, A. Solar PV power plant site selection using a GIS-AHP based approach with application in Saudi Arabia. Appl. Energy 2017, 206, 1225–1240. [Google Scholar] [CrossRef]
- United Nations Saudi Arabia. Sustainable Development Goal. Available online: https://saudiarabia.un.org/en/sdgs/7 (accessed on 19 October 2021).
- Alghamdi, A.S. Potential for Rooftop-Mounted PV Power Generation to Meet Domestic Electrical Demand in Saudi Arabia: Case Study of a Villa in Jeddah. Energies 2019, 12, 4411. [Google Scholar] [CrossRef] [Green Version]
- US Energy Information Administration. Country Analysis Brief: Saudi Arabia. Available online: https://www.eia.gov/international/content/analysis/countries_long/Saudi_Arabia/saudi_arabia.pdf (accessed on 24 October 2021).
- Saudi Arabia Government. Saudi Vision 2030. Available online: https://vision2030.gov.sa/en/node/87 (accessed on 27 October 2021).
- BP. BP Statistical Review of World Energy 2019, 68th ed.; BPX Energy: Denver, CO, USA, 2019; Available online: https://www.bp.com/content/dam/bp/business-sites/en/global/corporate/pdfs/energy-economics/statistical-review/bp-stats-review-2019-full-report.pdf (accessed on 27 October 2021).
- Elshurafa, A.M.; Muhsen, A.R. The Upper Limit of Distributed Solar PV Capacity in Riyadh: A GIS-Assisted Study. Sustainability 2019, 11, 4301. [Google Scholar] [CrossRef] [Green Version]
- Asif, M.; Hassanain, M.A.; Nahiduzzaman, K.M.; Sawalha, H. Techno-economic assessment of application of solar PV in building sector: A case study from Saudi Arabia. Smart Sustain. Built Environ. 2019, 8, 34–52. [Google Scholar] [CrossRef]
- Khan, G.; Rathi, S. Optimal site selection for solar PV power plant in an Indian state using geographical information system (GIS). Int. J. Emerg. Eng. Res. Technol. 2014, 2, 260–266. [Google Scholar]
- Joseph, J.I.; Umoren, A.M.; Markson, I. Development of optimal site selection method for large scale solar photovoltaic power plant. Math. Softw. Eng. 2016, 2, 66–75. [Google Scholar]
- Li, D. Using GIS and Remote Sensing Techniques for Solar Panel Installation Site Selection. Master’s Thesis, University of Waterloo, Waterloo, ON, Canada, 2013. Available online: http://hdl.handle.net/10012/7960 (accessed on 10 August 2021).
- Díaz, C.; Domínguez, B.; Prieto, C. Integrating MCDA and GIS for renewable energy spatial models: Assessing the individual and combined potential for wind, solar and biomass energy in Southern Spain. Clean Technol. Environ. Policy 2019, 21, 1855–1869. [Google Scholar] [CrossRef]
- Nebey, A.H.; Taye, B.Z.; Workineh, T.G. Site Suitability Analysis of Solar PV Power Generation in South Gondar, Amhara Region. J. Energy 2020, 2020, 15. [Google Scholar] [CrossRef]
- Ibrahim, G.R.F.; Hamid, A.A.; Darwesh, U.M.; Rasul, A. A GIS-based Boolean logic-analytical hierarchy process for solar power plant (case study: Erbil Governorate—Iraq). Environ. Dev. Sustain. 2021, 23, 6066–6083. [Google Scholar] [CrossRef]
- Teofilo, A.; Radosevic, N.; Tao, Y.; Iringan, J.; Liu, C. Investigating potential rooftop solar energy generated by Leased Federal Airports in Australia: Framework and implications. J. Build. Eng. 2021, 41, 102390. [Google Scholar] [CrossRef]
- Radosevic, N.; Duckham, M.; Liu, G.J.; Sun, Q. Solar radiation modeling with KNIME and Solar Analyst: Increasing environmental model reproducibility using scientific workflows. Environ. Model. Softw. 2020, 132, 104780. [Google Scholar] [CrossRef]
- Abd, M.H. Optimal location for solar cells by using remote sensing and GIS techniques, within Najaf city—Iraq as a case study. Sci. Int. 2018, 30, 587–596. [Google Scholar]
- Sun, Y.W.; Hof, A.; Wang, R.; Liu, J.; Lin, Y.J.; Yang, D.W. GIS-based approach for potential analysis of solar PV generation at the regional scale: A case study of Fujian Province. Energy Policy 2013, 58, 248–259. [Google Scholar] [CrossRef]
- Ahmad, M.W.; Reynolds, J.; Rezgui, Y. Predictive modelling for solar thermal energy systems: A comparison of support vector regression, random forest, extra trees and regression trees. J. Clean. Prod. 2018, 203, 810–821. [Google Scholar] [CrossRef]
- Aldagheiri, M.I. Accessibility Analysis of Roads Network in Al-Qassim Region. J. Arab. Hum. Sci. 2014, 8, 1–25. [Google Scholar]
- Solargis. Global Solar Atlas 2.0. 2020. Available online: https://globalsolaratlas.info/download/world (accessed on 15 July 2021).
- King Saud University. Al Qassim Roads, Vector. Available online: https://fac.ksu.edu.sa/falmutlaq/page/226516 (accessed on 3 March 2021).
- Open Street Map. Alqassim Power Lines, Vector. Available online: https://www.openstreetmap.org/#map=6/24.965/42.710 (accessed on 10 March 2021).
- U.S. Geological Survey. Digital Elevation Model, Raster. Available online: https://www.usgs.gov/faqs/what-digital-elevation-model-dem/ (accessed on 10 March 2021).
- Protected Planet. Protected Areas, Vector. Available online: https://www.protectedplanet.net/country/SAU (accessed on 18 March 2021).
- U.S. Geological Survey. The European Space Agency’s Multispectral Instrument on the Sentinel-2, 2017, Raster, USGS EROS Archive. Available online: https://earthexplorer.usgs.gov/ (accessed on 1 March 2021).
- Solargis; World Bank Group. Solar Resource GIS Data of Saudi Arabia, Raster. Available online: https://solargis.com/maps-and-gis-data/download/saudi-arabia (accessed on 5 March 2021).
- Hejmanowska, B.; Hnat, E. Multi-factoral evaluation of residential area locations: Case study of Podegrodzie local authority. Arch. Photogramm. Cartogr. Remote Sens. 2009, 20, 109–121. [Google Scholar]
- Janke, J.R. Multicriteria GIS modeling of wind and solar farms in Colorado. Renew. Energy 2010, 35, 2228–2234. [Google Scholar] [CrossRef]
- Hott, R.; Santini, R.; Brownson, J. GIS-based Spatial Analysis for Large-scale Solar Power and Transmission Line issues: Case Study of Wyoming, US. In Proceedings of the 41st American Solar Energy Society Meeting, Denver, CO, USA, 13–17 May 2012; pp. 1–6. [Google Scholar]
- Tahri, M.; Hakdaoui, M.; Maanan, M. The evaluation of solar farm locations applying Geographic Information System and Multi-Criteria Decision-Making methods: Case study in southern Morocco. Renew. Sustain. Energy Rev. 2015, 51, 1354–1362. [Google Scholar] [CrossRef]
- Ruiz, H.; Sunarso, A.; Ibrahim-Bathis, K.; Murti, S.; Budiarto, I. GIS-AHP Multi Criteria Decision Analysis for the optimal location of solar energy plants at Indonesia. Energy Rep. 2020, 6, 3249–3263. [Google Scholar] [CrossRef]
- Yousefi, H.; Hafeznia, H.; Yousefi-Sahzabi, A. Spatial site selection for solar power plants using a gis-based boolean-fuzzy logic model: A case study of Markazi Province, Iran. Energies 2018, 11, 1648. [Google Scholar] [CrossRef] [Green Version]
- Noorollahi, E.; Fadai, D.; Akbarpour Shirazi, M.; Ghodsipour, S.H. Land suitability analysis for solar farms exploitation using GIS and fuzzy analytic hierarchy process (FAHP)—A case study of Iran. Energies 2016, 9, 643. [Google Scholar] [CrossRef] [Green Version]
- Environmental Systems Research Institute (ESRI) UK & Ireland. Distance Analysis. Available online: https://www.esriuk.com/software/arcgis/extensions/spatialanalyst/key-features/distance (accessed on 5 October 2021).
- Uyan, M. GIS-based solar farms site selection using analytic hierarchy process (AHP) in Karapinar region, Konya/Turkey. Renew. Sustain. Energy Rev. 2013, 28, 11–17. [Google Scholar] [CrossRef]
- Rodríguez, J.L.G.; Suárez, M.C.G. Comparison of Mathematical Algorithms for Determining the Slope Angle in Gis Environment aplicación de algoritmos matemáticos en la determinación de la inclinación de pendiente en un entorno sig. AquaLAC 2010, 2, 78–82. [Google Scholar]
- Environmental Systems Research Institute (ESRI). How Slope Works. Available online: https://pro.arcgis.com/en/pro-app/latest/tool-reference/3d-analyst/how-slope-works.htm (accessed on 5 October 2021).
- Breiman, L. Random Forests; University of California, Statistics Department: Berkeley, CA, USA, 2001; Volume 94720. [Google Scholar]
- Freund, Y.; Schapire, R. Machine Learning. In Proceedings of the ICML’96: Proceedings of the Thirteenth International Conference on International Conference on Machine Learning, Bari, Italy, 3–6 July 1996; pp. 148–156. [Google Scholar]
- Breiman, L. Random forests. Mach. Learn. 2001, 45, 5–32. [Google Scholar] [CrossRef] [Green Version]
- Environmental Systems Research Institute (ESRI). Euclidean Distance. Available online: https://desktop.arcgis.com/en/arcmap/10.3/tools/spatial-analyst-toolbox/euclidean-distance.htm (accessed on 5 October 2021).
- Padovan, A.; del Col, D.; Sabatelli, V.; Marano, D. DNI estimation procedures for the assessment of solar radiation availability in concentrating systems. Energy Procedia 2014, 57, 1140–1149. [Google Scholar] [CrossRef]
- Frye, C. About the Geometrical Interval Classification Method; Environmental Systems Research Institute (ESRI): Redlands, CA, USA, 2017; Available online: https://www.esri.com/arcgis-blog/products/product/mapping/about-the-geometrical-interval-classification-method/ (accessed on 5 October 2021).
- Saaty, T.L. L. Highlights and critical points in the theory and application of the analytic hierarchy process. Eur. J. Oper. Res. 1994, 74, 426–447. [Google Scholar] [CrossRef]
- Environmental Systems Research Institute (ESRI). Understanding Weighted Overlay 2014. Available online: https://www.esri.com/about/newsroom/wp-content/uploads/2019/05/understanding-weighted-overlay.pdf (accessed on 5 October 2021).
- Pettorelli, N. The Normalized Difference Vegetation Index, 1st ed.; Oxford University Press: New York, NY, USA, 2013. [Google Scholar]
- Protected Planet. UNEP-WCMC 2021, Protected Area Profile for Saudi Arabia from the World Database of Protected Areas. Available online: https://www.protectedplanet.net/en (accessed on 22 October 2021).
- Charabi, Y.; Gastli, A. PV site suitability analysis using GIS-based spatial fuzzy multi-criteria evaluation. Renew. Energy 2011, 36, 2554–2561. [Google Scholar] [CrossRef]
- Yushchenko, A.; de Bono, A.; Chatenoux, B.; Patel, M.K.; Ray, N. GIS-based assessment of photovoltaic (PV) and concentrated solar power (CSP) generation potential in West Africa. Renew. Sustain. Energy Rev. 2018, 81, 2088–2103. [Google Scholar] [CrossRef]
- Solargis. Longterm Yearly Average of Potential Photovoltaic Electricity Production2021, Global Solar Atlas 2.0, Saudi Arabia. Available online: https://globalsolaratlas.info/global-pv-potential-study (accessed on 20 March 2021).


| Applied Technique | Location | Criteria |
|---|---|---|
| Analysis criteria and exclusion criteria [9] | Rajasthan state/India | Availability of solar radiation, availability of vacant land, accessibility from national highways, distance from existing transmission lines, variation in local climate, module soiling |
| PVsyst simulation software [10] | Imo State/Nigeria | Global irradiation on the horizontal plane, available energy, yearly unit cost of energy, population, land mass |
| AHP [11] | Waterloo/USA | Generation efficiency, economic, environmental |
| AHP [12] | Malaga/Spain | Settlements, tourism facilities, road network, rail network, antennae and military areas, environmental protected areas, rivers, electric grid, slope, high-potential agricultural areas |
| AHP [13] | Amhara/Ethiopia | Irradiance, roads, town, soil, slope, land use, forest, stream, school |
| AHP [14] | Erbil/Iraq | Faults, natural reserves, rivers, slope, elevation, transmission line, roads, airport and military area, urban areas, villages, oil and Gas fields |
| Criteria | Sub-Criteria | Data Format | Source | Spatial Resolution |
|---|---|---|---|---|
| Economic | Roads | Vector | [22] | N. A |
| Powerlines | Vector | [23] | N. A | |
| Slope | Raster | [24] | 30 m | |
| Environmental | Protected areas | Vector | [25] | N. A |
| Satellite Images (Distance from residential areas) (NDVI) | Raster | [26] | 10 m | |
| Climatic | Solar irradiance | Raster | [27] | 30 m |
| Designation | Qualification | Reciprocal (Decimal) |
|---|---|---|
| Professor | PhD | Tallinn University of Technology |
| Professor | PhD | The University of Western Australia |
| PhD candidate | MSc | Tallinn University of Technology |
| Scale | Degree of Importance |
|---|---|
| 1 | Equally important |
| 2 | Equally to moderately important |
| 3 | Moderately important |
| 4 | Moderately to strongly important |
| 5 | Strongly important |
| 6 | Strongly to very strongly important |
| 7 | Very strongly important |
| 8 | Very strongly to extremely important |
| 9 | Extremely important |
| Factor | GHI (A) | Proximity to a Residential Area (B) | Proximity to Roads (C) | Proximity to Powerlines (D) | Slope Percentage (E) | Eigenvalue (Eg) | Weight |
|---|---|---|---|---|---|---|---|
| GHI (1) | 1 | 4 | 6 | 6 | 9 | 4.210 | 0.55 |
| Proximity to residential areas (2) | 0.25 | 1 | 3 | 2 | 7 | 1.838 | 0.21 |
| Proximity to roads (3) | 0.17 | 0.33 | 1 | 1 | 4 | 0.678 | 0.10 |
| Proximity to powerlines (4) | 0.17 | 0.50 | 1 | 1 | 5 | 0.678 | 0.11 |
| Slope percentage (5) | 0.11 | 0.14 | 0.25 | 0.20 | 1 | 0.281 | 0.03 |
| Criteria | Criteria Weight | Sub-Criteria | Sub-Criteria Weight |
|---|---|---|---|
| Economic | 24% | Distance from roads | 10% |
| Distance from power lines | 11% | ||
| Slope | 3% | ||
| Environmental | 21% | Distance from residential areas | 21% |
| Climatic | 55% | GHI | 55% |
| Suitability Rank | Area | Area Percentage |
|---|---|---|
| Most suitable | 111 KM2 | 0.16% |
| Suitable | 12,231 KM2 | 17.37% |
| Moderated | 32,669 KM2 | 46.42% |
| Unsuitable | 7159 KM2 | 10.17% |
| Restricted | 18,210 KM2 | 25.88% |
Publisher’s Note: MDPI stays neutral with regard to jurisdictional claims in published maps and institutional affiliations. |
© 2022 by the authors. Licensee MDPI, Basel, Switzerland. This article is an open access article distributed under the terms and conditions of the Creative Commons Attribution (CC BY) license (https://creativecommons.org/licenses/by/4.0/).
Share and Cite
Alhammad, A.; Sun, Q.; Tao, Y. Optimal Solar Plant Site Identification Using GIS and Remote Sensing: Framework and Case Study. Energies 2022, 15, 312. https://doi.org/10.3390/en15010312
Alhammad A, Sun Q, Tao Y. Optimal Solar Plant Site Identification Using GIS and Remote Sensing: Framework and Case Study. Energies. 2022; 15(1):312. https://doi.org/10.3390/en15010312
Chicago/Turabian StyleAlhammad, Abdulaziz, Qian (Chayn) Sun, and Yaguang Tao. 2022. "Optimal Solar Plant Site Identification Using GIS and Remote Sensing: Framework and Case Study" Energies 15, no. 1: 312. https://doi.org/10.3390/en15010312
APA StyleAlhammad, A., Sun, Q., & Tao, Y. (2022). Optimal Solar Plant Site Identification Using GIS and Remote Sensing: Framework and Case Study. Energies, 15(1), 312. https://doi.org/10.3390/en15010312