Article

Scale Effect on Producing Gaseous and Liquid Chemical Fuels via CO2 Reduction

State Key Laboratory of Multiphase Flow in Power Engineering, Xi’an Jiaotong University, Xi’an 710049, China
*
Authors to whom correspondence should be addressed.
These authors contributed equally to this work.
Energies 2022, 15(1), 335; https://doi.org/10.3390/en15010335
Submission received: 24 November 2021 / Revised: 15 December 2021 / Accepted: 17 December 2021 / Published: 4 January 2022
(This article belongs to the Special Issue Advances in Tandem Architectures toward High-Efficiency Solar Cells)

Abstract

:
Producing chemical fuels from sunlight is a sustainable way to utilize solar energy and reduce carbon emissions. Within the current photovoltaic-electrolysis or photoelectrochemical-based solar fuel generation system, electrochemical CO2 reduction is the key step. Although there has been important progress in developing new materials and devices, scaling up electrochemical CO2 reduction is essential to promote the industrial application of this technology. In this work, we use Ag and In as the representative electrocatalyst for producing gas and liquid products in both small and big electrochemical cells. We find that gas production is blocked more easily than liquid products when scaling up the electrochemical cell. Simulation results show that the generated gas product, CO, forms bubbles on the surface of the electrocatalyst, thus blocking the transport of CO2, while there is no such trouble for producing the liquid product such as formate. This work provides methods for studying the mass transfer of CO, and it is also an important reference for scaling up solar fuel generation devices that are constructed based on electrochemical CO2 reduction.

1. Introduction

Since the industrial revolution, the massive exploitation and consumption of fossil energy have caused irreparable worldwide environmental problems. The current concentration of CO2 in the atmosphere has obviously increased compared to the beginning of the industrial revolution and has caused global warming [1]. To date, various solar fuel generation approaches have been developed to cut down on carbon emissions [2,3]. One approach, solar-driven CO2 reduction (CO2R), can absorb sunlight and recycle carbon emissions directly. Owing to the rapid development of tandem solar cells and photoelectrodes, the solar-driven CO2R system that utilizes photovoltaic-electrolysis or photoelectrochemical cells performs particularly well [4,5]. Surface chemical reaction plays an important role in all of the developed solar-driven CO2R technologies [6]. It is generally known that CO2R reactions can be independently studied by electrochemical CO2R reactions, in which CO2 can be easily reduced into carbon-based fuels, including gaseous products, such as CO, CH4, C2H6, C2H4, C2H2, etc., and liquid products, such as HCOOH, CH3COOH, CH3OH, C2H5OH, etc. [7,8]. Among these products, CO and HCOOH are produced via two-electron CO2 electrochemical reduction, which means that producing 1 mole of CO or HCCOH requires the minimum amount of electrons. Moreover, CO and HCOOH are primary products/intermediates, and other C1, C2, and C3 products would be subsequently generated after CO [9]. Since only a few reaction steps are needed, it is easier to get a high selectivity for producing CO or HCOOH than other products.
At present, state-of-the-art technology for electrochemical CO2R utilizes metal as the catalyst [10,11]. CO is produced from a carbon-bound *COOH, which binds to the surface of the catalyst through a carbon atom [12]. Previous works point out through first-principles calculations that the product selectivity of the CO2R reaction is significantly related to the adsorption and desorption characteristics of CO and other intermediates [13,14]. For transition metals with a relatively large binding energy to CO (Pt, Ni, Fe, etc.), CO will adhere to the surface of the catalyst and block the following CO2R reactions, in turn, producing H2 as the main product. For transition metals with a relatively small binding energy to CO (Ag, Au, Zn, etc.), once CO is generated, it will quickly leave the surface of the catalyst. In this case, the main product is CO. Only the binding energy of CO and Cu is listed in the middle area. Therefore, Cu is the only metal catalyst that prefers C2+ [15,16,17]. Unlike producing CO, HCOOH is generated from HCOO*, which binds to the surface of the catalyst through 2 O atoms [18,19]. Also, there is no subsequent reaction following HCOOH. Metals such as In, Bi, Pb, Sn, Cd, and Hg reduce CO2 to HCOOH with high selectivity [20].
Despite the rapid growth of this technology, at this stage, the testing of electrochemical CO2R mainly relies on lab-scale cells. To promote industry applications of electrochemical CO2R, scaling up electrochemical CO2 reduction is essential to explore a successful method [21]. In this work, we select Ag and In as the representative catalysts for producing gas (CO) and liquid (HCOOH) products during scaling-up electrochemical cells. We find that CO generation on Ag suffers a significant selectivity loss. While being different from the CO2R performance on Ag, In kept the high selectivity to formate in the large electrochemical cell.

2. Materials and Methods

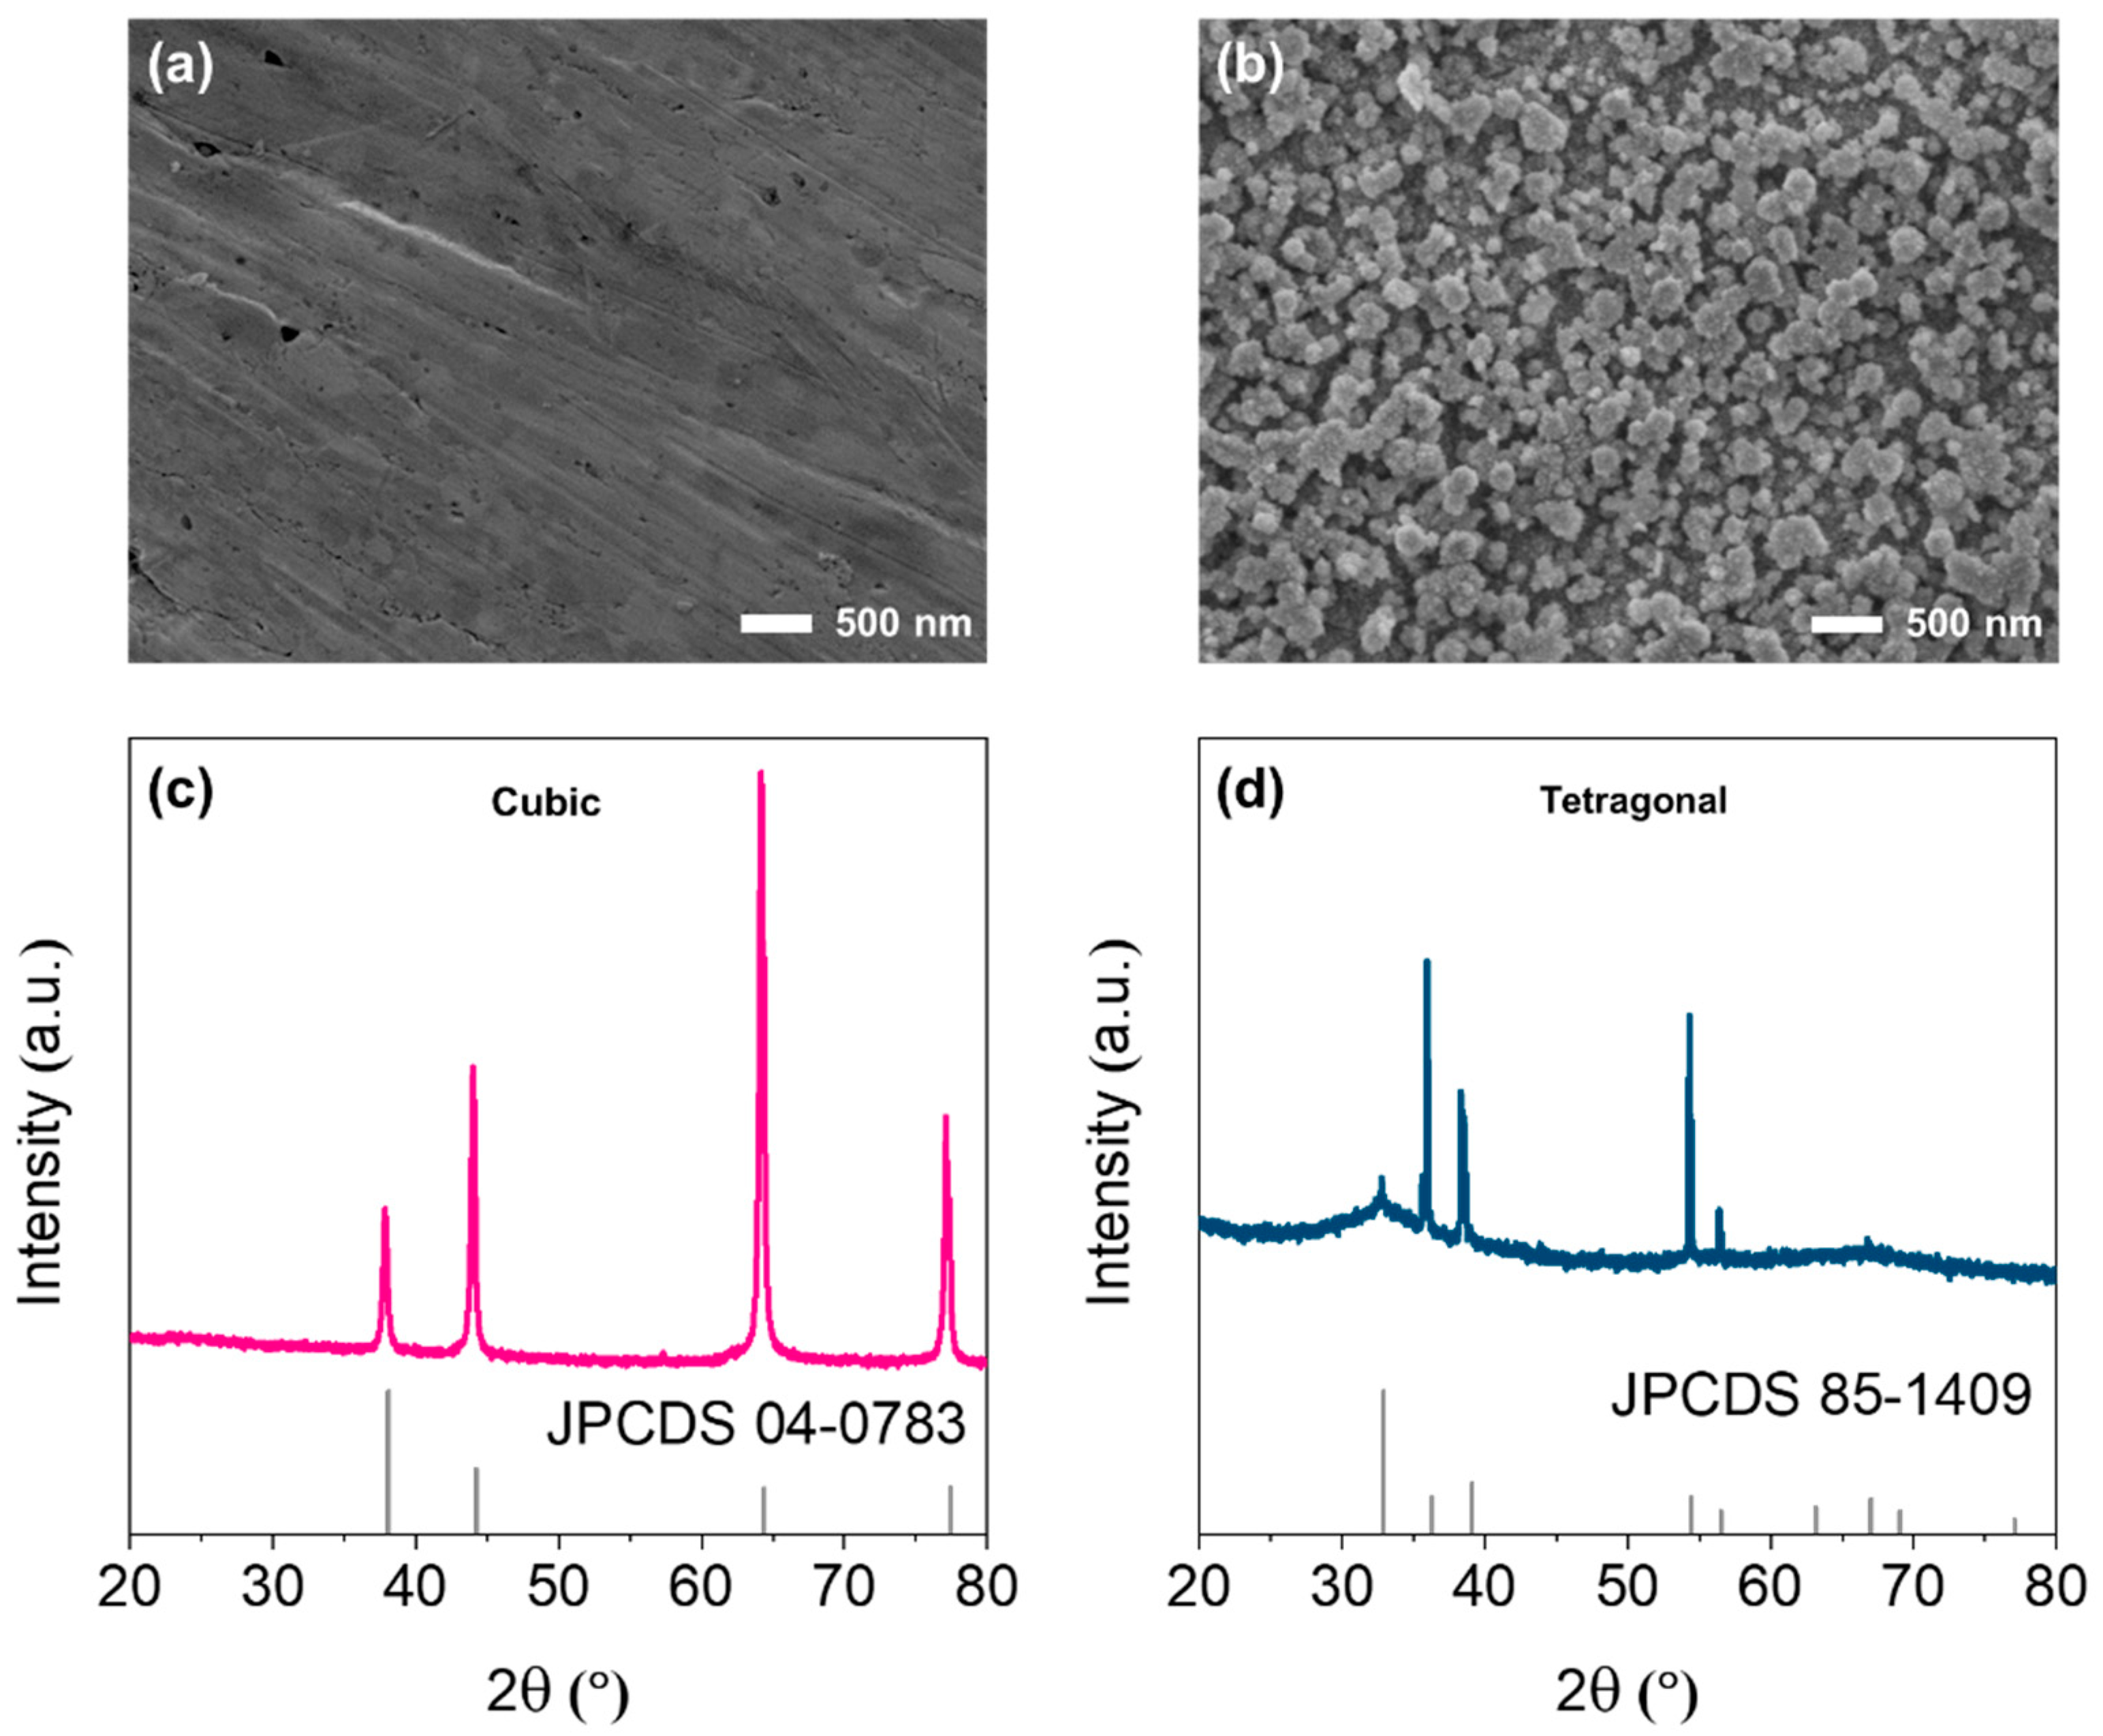
2.1. Surface Preparation

The commercial Ag (99.99%) and In (99.99%) foil were used as electrocatalysts for CO2R. Field emission scanning electron microscope (FE-SEM, JEOL JSM-7800F) and X-ray diffraction (XRD, X’Pert PRO MPD, PANalytical, The Netherlands, Cu Kα irradiation, λ = 1.541 874 Å) were used to characterize surfaces.

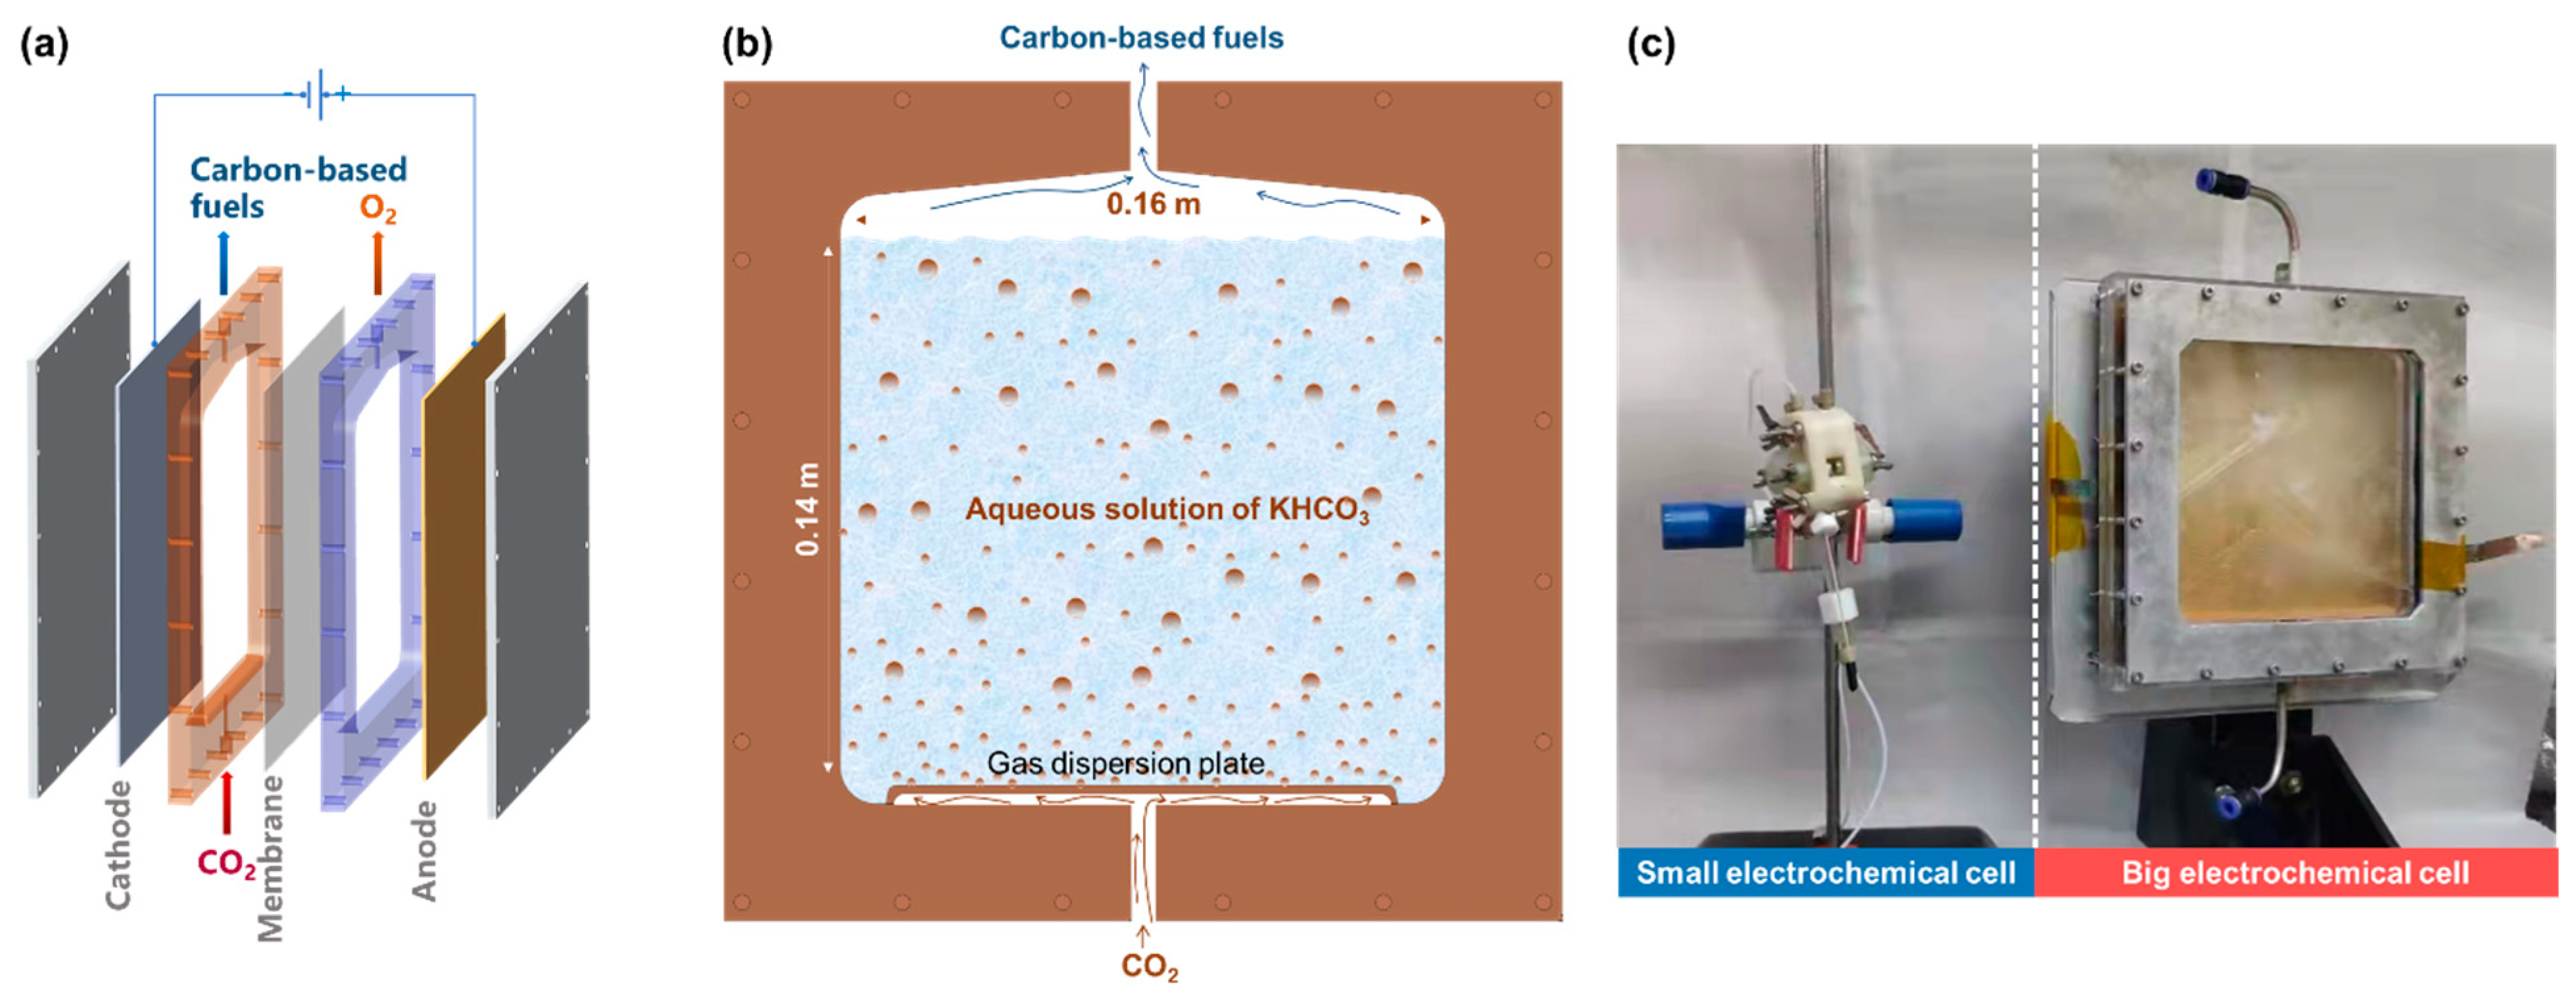
2.2. Electrochemical Cell

As shown in Figure 1, the big electrochemical cell is self-made and keeps a conventional H type arrangement, including a cathodic cover plate, cathode, catholyte chamber, membrane, anolyte chamber, anode, anodic cover plate, and some necessary ports [22]. Within the catholyte chamber, a self-made gas dispersion plate (quartz sands, porosity: G4) is used to produce small CO2 bubbles that further flow into the catholyte. The flow rate of CO2 is controlled by a mass flow controller (Alicat Scientific). The active surface is ~224 cm2 (160 mm × 140 mm). The gas products flow out of the chamber from the top and are purged in GC continuously. During the measurements, a two-electrode configuration was used for the big electrochemical cell. As a comparison, the active surface of the cathode in the small electrochemical cell is 1 cm2. During the measurements, a three-electrode configuration was used for the small electrochemical cell. Silver/silver chloride (Ag/AgCl) served as the reference electrode. The measured applied potential versus the Ag/AgCl was further converted to the reversible hydrogen electrode (RHE) scale using the formula VRHE = VAg/AgCl + 0.059 pH + 0.1976 V. In both electrochemical cells, an anion exchange membrane (Selemion AMV, AGC Inc., Tokyo, Japan) was used to separate the catholyte and anolyte chambers to prevent the oxidation of CO2R products. Pt filament was used as the counter electrode. A total of 99.9% base metal pure potassium bicarbonate (KHCO3) (Sinopharm Chemical Reagent Co., Ltd., Shanghai, China) was used as the precursor salt for making the electrolyte used in this study. Deionized water was provided by a Millipore water system (18.2 MΩ cm resistivity, total organic carbon concentration less than 5 ppb).

2.3. Product Analysis

Gas products (H2, CO, CH4, C2H6, and C2H4) were analyzed on-line by gas chromatography from Shimadzu, including one thermal conductivity detector and two flame ionization detectors. Liquid products were collected after electrolysis and analyzed by high-performance liquid chromatography (1260 Infinity II LC System, Agilent Technologies, Inc., Santa Clara, CA, USA) with a refractive index detector (RID) and a column (Aminex HPX 87-H, Bio-Rad Laboratories, Inc., Hercules, CA, USA) from Bio-Rad. A total of 1 mM diluted sulfuric acid was used as the eluent, and 10 μL of the sample was injected into the column.

2.4. Mass Transport Simulations

The mass transfer performances of CO2 and CO in catholyte were simulated with a commercial finite element software, COMSOL. The diffusion coefficients of CO were set at 2.03 × 10⁻⁹ m2/s [9]. The initial concentration of CO in the bulk electrolyte was set at 0 mM.

3. Results and Discussion
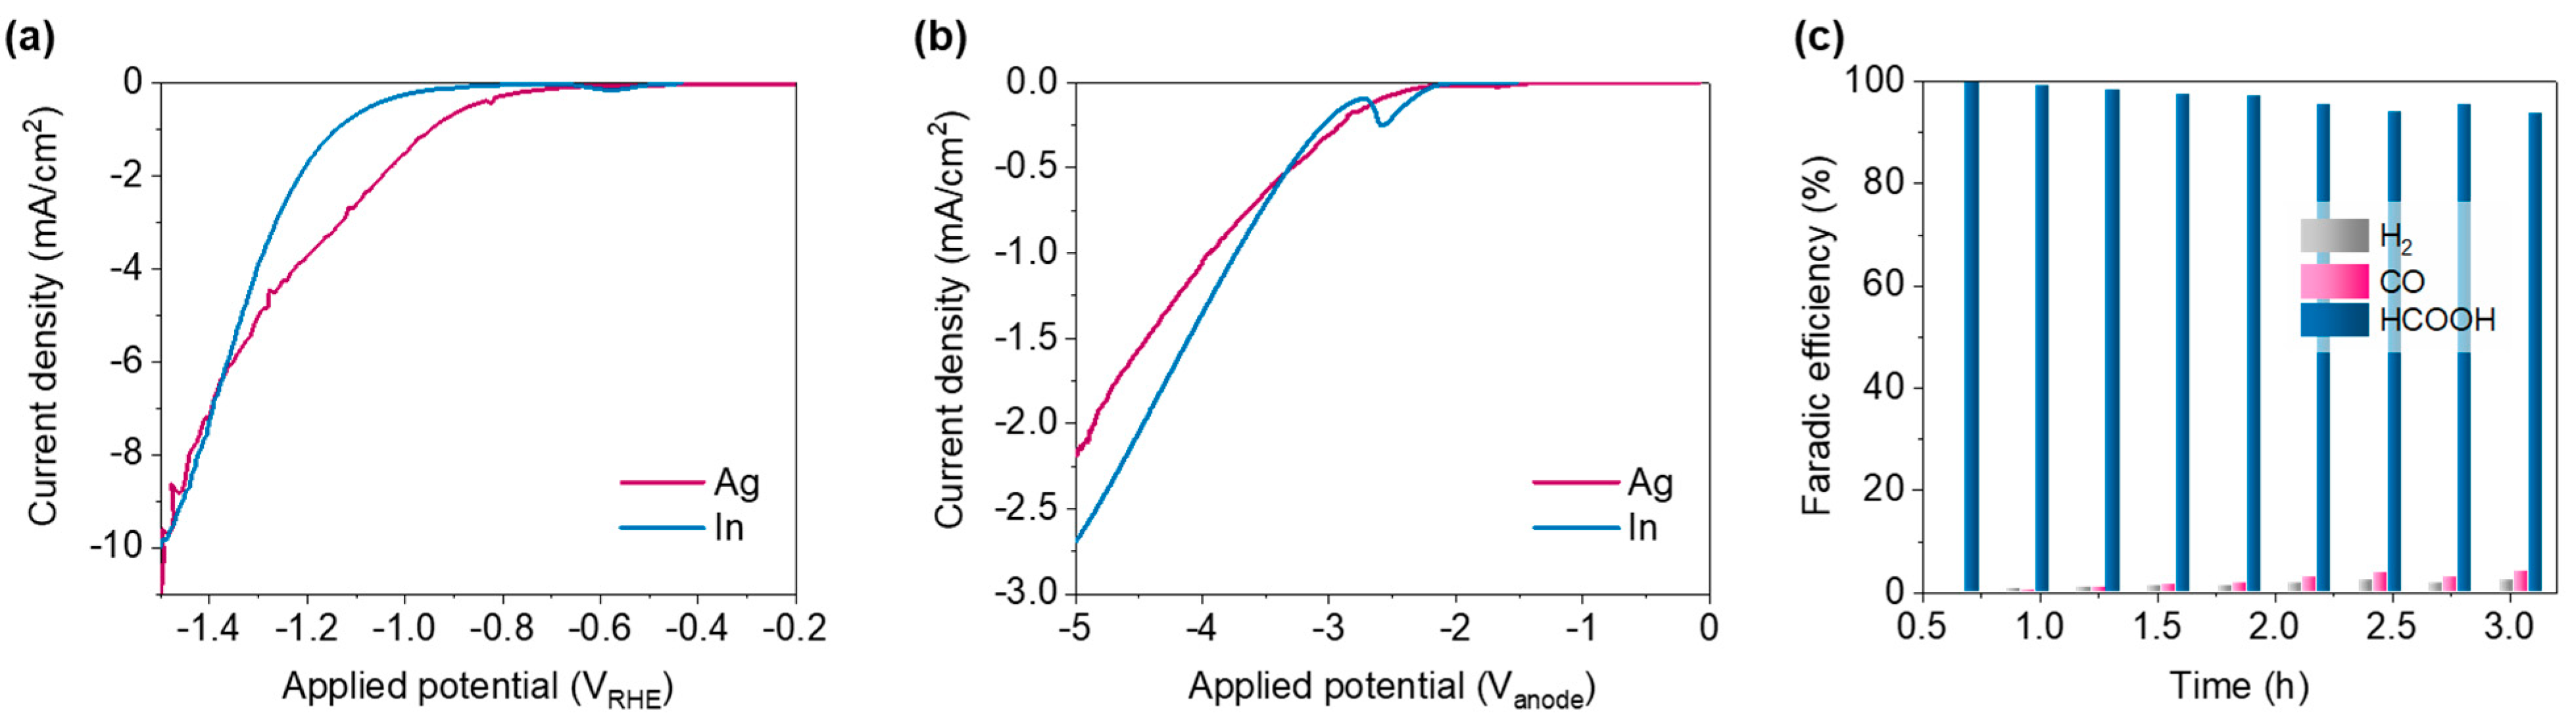
3.1. Ag and In

Prior to each experiment, metal foils were mechanically polished by fine-grained sandpaper until no discoloration was visible and then cleaned by an electropolishing process which was conducted in phosphoric acid (85% in H2O). A constant applied voltage was set at 2.1 V vs. a Pt counter electrode placed at a distance of 3 cm [22]. The morphology of Ag and In are shown in Figure 2. Ag has an extremely smooth surface, while the surface of In is full of nanoparticles, around hundreds of nanometers in diameter. Figure 2c,d shows the XRD measurements taken for Ag and In, revealing that Ag has a cubic phase and In has a tetragonal phase.

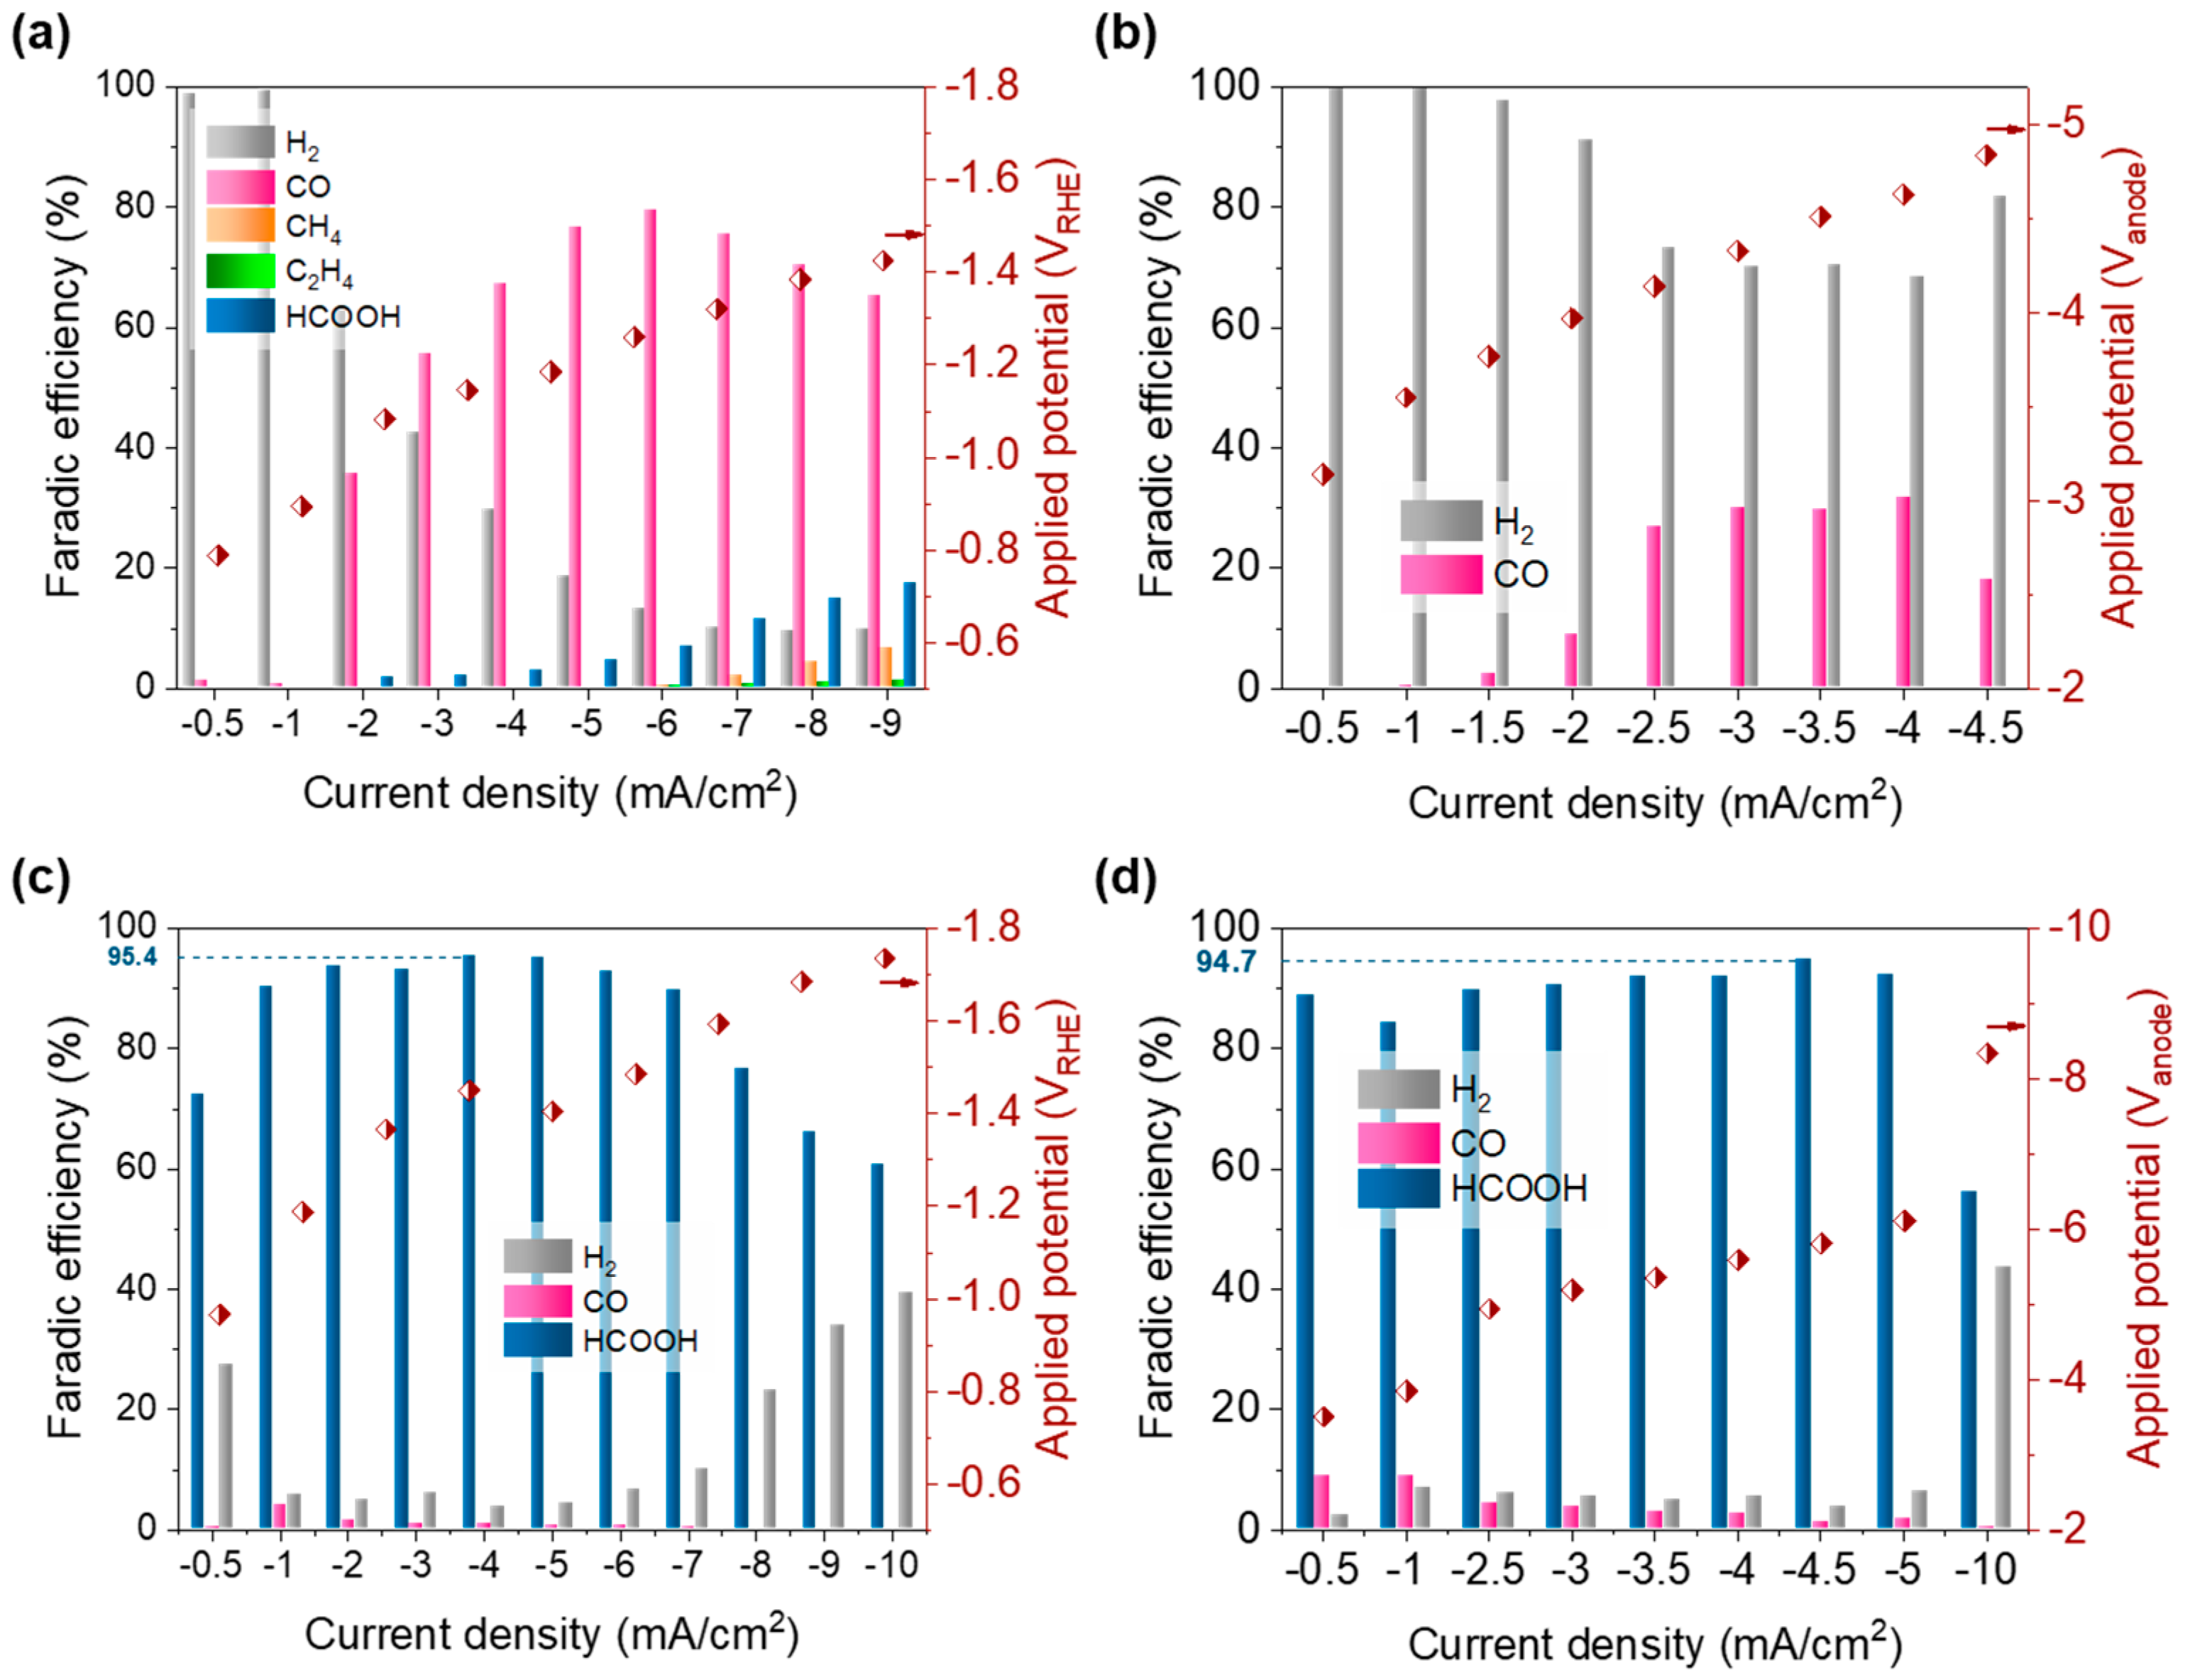
3.2. Producing Gaseous and Liquid Products

In general, a manual ohmic drop correction should be carried out when using a constant-potential mode. However, this ohmic drop correction is not constant during CO2R measurements due to the continuous change of the electrolyte (liquid products, water evaporate, etc.). Hence, in this work, all of the electrochemical measurements were operated in constant-current mode. A higher current density means higher applied potential. For Ag in the small electrochemical cell, H2 is the main product at a relatively low current density (Figure 3a). As the standard reaction potential of CO (−0.12 versus the standard hydrogen electrode) is slightly higher than that of H2 (0 versus the standard hydrogen electrode) [8], a higher applied potential would promote CO production. When the current density increased higher than 3 mA/cm2, CO became the main product and peaked (~80%) at 6 mA/cm2. A small amount of CH4, C2H4 were also detected at a current density higher than 7 mA/cm2. This CO2R performance agrees with the literature [23,24]. It has been widely recognized from the experimental results that Ag will produce CO with appropriately applied potential. Recently, using the cationic modifier dihexadecyldimethylammonium bromide, high purity Ag foil electrocatalytic CO production achieved selectivity approaching 100% at low applied potential [25]. However, the Ag catalytic CO2R performance in the big electrochemical cell is an exception. As shown in Figure 3b, H2 is always the main product. Although a significant amount of CO was produced at the current range of 3–8 mA/cm2, the highest selectivity only reached ~30%, which is much lower than the one measured in the small electrochemical cell.
For In in the small electrochemical cell, formate is always the main product (Figure 3c), except when excessively high potential (equal to high current density) is applied to the electrocatalyst. The highest selectivity of formate reached 95.4%, which is consistent with the literature values [26,27]. Interestingly, the selectivity to formate in the big electrochemical cell is still very high (Figure 3d). For both electrochemical cells, the hydrogen production was increased at a relatively high applied potential range. Moreover, the linear sweep voltammograms (Figure 4a,b) indicate that the onset potential of In is higher than Ag. For In in the big electrochemical cell, the selectivity of formate kept at ~95% within a 3-h test, as shown in Figure 4c. In this case, one curiosity was why CO2R performed so differently for Ag and In in the big electrochemical cell.

3.3. CO Blocks the Transport of CO2

Mass transport simulations of CO concentration contours were employed to estimate the conversion efficiency of the CO intermediate. As shown in Figure 5, CO flux from Ag was set at 6.08 × 10⁻⁵ mol/(m2·s), which is equivalent to the measured saturated partial current density of 1.16 mA/cm2 in the big electrochemical cell. We set the boundary condition of the top to be 0 mM CO. That is because the partial pressure of CO in the outlet flow is very low, even for the best CO2R performance. According to Henry’s law, the concentration of CO at the upper surface of the electrolyte should be very small. As the massive CO2 bubbles are mainly located at the centerline of the catholyte chamber, we use a discontinuous boundary to simulate the effect of CO2 bubbles on bringing CO away from the catholyte.
Figure 6a,b show CO concentration contours (false color) for the Ag/catholyte interface. As we have no way of knowing the real distribution of CO2 bubbles within the catholyte chamber, various CO2 bubbles ratios are used to find a result relatively close to the experimental condition. For the big electrochemical cell, it can be seen that the trapped CO significantly decreased with the ratio of the CO2 bubble increased from 0.1% to 50%. Especially, the CO concentration is close to 0 for 50% CO2 bubbles ratio, indicating no need to try the ratio higher than 50%. It is also notable that, for the height ranging from 0 mm to 130 mm, the surface CO concentration for all of the CO2 bubbles ratios are higher than 180 mM (Figure 6c). In general, the supersaturation required to initiate bubble nucleation in water is varied from 1.3 to 320 [28,29]. Considering the solubility limit of CO in water is 1 mM [30]. In our opinion, CO bubbles should be formed easily near the Ag surface in the big electrochemical cell. As the reactant, CO2 should be transferred to the surface of the cathode from the bulk area. The generated CO bubbles stand in the way of CO2 transformation and further block the transport of CO2.
As shown in Figure 6b, the trapped CO in the small electrochemical cell is obviously less than that in the big electrochemical cell. Also, for the height ranging from 0 mm to 10 mm, the surface CO concentration for all of the CO2 bubbles ratios are no more than 180 mM (Figure 6d), indicating there would be less chance for bubble nucleation in the small electrochemical cell than that in the big electrochemical cell. Therefore, we have reason to believe that the upper surface of the electrolyte could provide enough room for moving the produced CO away quickly and thus prevent bubble nucleation. In contrast, most of the active surface is far away from the upper surface of the electrolyte, thus resulting in over-saturated CO at the cathode surface. The generated CO bubbles in the big electrochemical cell block the mass transfer route of CO2, and further cause an aggravation of producing CO. Unlike the gas product, such as CO, producing a liquid product, such as formate, would not generate bubbles at the surface of the electrode. Therefore, the aggravation of CO2R in the big electrochemical cell with Ag did not happen in the big electrochemical cell with In.

4. Conclusions

In summary, we found a different phenomenon when producing CO and formate from scaling up electrochemical CO2R. Specifically, we have shown that Ag could produce CO with high selectivity (~80%) in the small electrochemical cell, but performs worse in the big electrochemical cell (the selectivity was less than 30%). However, the space scale had a different effect on In, the metal that produces formate as the main CO2R product. The selectivity of formate reached 95% in both small and big electrochemical cells. Mass transport simulations display that the surface CO concentration of the Ag catalytic system in the big electrochemical cell is higher than 180 mM in most areas, which obviously exceeds the limiting of bubble nucleation. In contrast, the surface CO concentration in the small electrochemical cell is much lower, no more than 180 mM. Therefore, we believe it is the bubbles generated from the gas product that make CO2R worse in the big electrochemical cell.

Author Contributions

Conceptualization, Y.L. and Y.C.; methodology, Y.L., Y.C., and D.L.; software, X.G. and T.M.; formal analysis, Y.L. and D.L.; data curation, Y.L., D.L. and F.W.; writing—original draft preparation, Y.L.; writing—review and editing, Y.C.; funding acquisition, Y.C. All authors have read and agreed to the published version of the manuscript.

Funding

This research was funded by the National Natural Science Foundation of China, grant number 51906199 and 52076177, the Shaanxi Technical Innovation Guidance Project, grant number 2018HJCG-14, and the China Postdoctoral Science Foundation Funded Project, grant number 2019M663703.

Institutional Review Board Statement

Not applicable.

Informed Consent Statement

Not applicable.

Data Availability Statement

Not applicable.

Acknowledgments

We thank Guiwei He for SEM and XRD measurements.

Conflicts of Interest

The authors declare no conflict of interest.

References

  1. Martinez, J.; Marti Herrero, J.; Villacis, S.; Riofrio, A.J.; Vaca, D. Analysis of energy, CO2 emissions and economy of the technological migration for clean cooking in Ecuador. Energy Policy 2017, 107, 182–187. [Google Scholar] [CrossRef]
  2. Cheng, C.; Dong, C.-L.; Shi, J.; Mao, L.; Huang, Y.-C.; Kang, X.; Zong, S.; Shen, S. Regulation on polymerization degree and surface feature in graphitic carbon nitride towards efficient photocatalytic H2 evolution under visible-light irradiation. J. Mater. Sci. Technol. 2022, 98, 160–168. [Google Scholar] [CrossRef]
  3. Zhang, Y.; Shi, J.; Huang, Z.; Guan, X.; Zong, S.; Cheng, C.; Zheng, B.; Guo, L. Synchronous construction of CoS2 in-situ loading and S doping for g-C3N4: Enhanced photocatalytic H2-evolution activity and mechanism insight. Chem. Eng. J. 2020, 401, 126135. [Google Scholar] [CrossRef]
  4. Jia, J.; Seitz, L.C.; Benck, J.D.; Huo, Y.; Chen, Y.; Ng, J.W.D.; Bilir, T.; Harris, J.S.; Jaramillo, T.F. Solar water splitting by photovoltaic-electrolysis with a solar-to-hydrogen efficiency over 30%. Nat. Commun. 2016, 7, 13237. [Google Scholar] [CrossRef]
  5. Bhattacharyya, S.; Mishra, B. Photoelectrochemical Reduction of CO2 and Electrochemical Oxidation of CO. In Electrochemical Energy Conversion and Storage Systems for Future Sustainability, 1st ed.; Apple Academic Press: Palm Bay, FL, USA, 2020; pp. 57–92. [Google Scholar]
  6. Liu, Y.; Bai, S.; Wang, F.; Chen, Y. Photoelectrochemical technology for solar fuel generation, from single photoelectrodes to unassisted cells: A review. Environ. Chem. Lett. 2021, in press. [Google Scholar] [CrossRef]
  7. Nitopi, S.; Bertheussen, E.; Scott, S.B.; Liu, X.; Engstfeld, A.K.; Horch, S.; Seger, B.; Stephens, I.E.L.; Chan, K.; Hahn, C.; et al. Progress and perspectives of electrochemical CO2 reduction on copper in aqueous electrolyte. Chem. Rev. 2019, 119, 7610–7672. [Google Scholar] [CrossRef] [Green Version]
  8. Liu, Y.; Guo, L. On factors limiting the performance of photoelectrochemical CO2 reduction. J. Chem. Phys. 2020, 152, 100901. [Google Scholar] [CrossRef] [Green Version]
  9. Liu, Y.; Qiu, H.; Li, J.; Guo, L.; Ager, J.W. Tandem electrocatalytic CO2 reduction with efficient intermediate conversion over pyramid-textured Cu–Ag catalysts. ACS Appl. Mater. Interfaces 2021, 13, 40513–40521. [Google Scholar] [CrossRef]
  10. Hori, Y.; Murata, A.; Takahashi, R. Formation of hydrocarbons in the electrochemical reduction of carbon dioxide at a copper electrode in aqueous solution. J. Chem. Soc. Faraday Trans. 1989, 85, 2309–2326. [Google Scholar] [CrossRef]
  11. Hori, Y.; Wakebe, H.; Tsukamoto, T.; Koga, O. Electrocatalytic process of CO selectivity in electrochemical reduction of CO2 at metal electrodes in aqueous media. Electrochim. Acta 1994, 39, 1833–1839. [Google Scholar] [CrossRef]
  12. Feaster, J.T.; Shi, C.; Cave, E.R.; Hatsukade, T.; Abram, D.N.; Kuhl, K.P.; Hahn, C.; Nørskov, J.K.; Jaramillo, T.F. Understanding selectivity for the electrochemical reduction of carbon dioxide to formic acid and carbon monoxide on metal electrodes. ACS Catal. 2017, 7, 4822–4827. [Google Scholar] [CrossRef]
  13. Kuhl, K.P.; Hatsukade, T.; Cave, E.R.; Abram, D.N.; Kibsgaard, J.; Jaramillo, T.F. Electrocatalytic conversion of carbon dioxide to methane and methanol on transition metal surfaces. J. Am. Chem. Soc. 2014, 136, 14107–14113. [Google Scholar] [CrossRef] [PubMed]
  14. Peterson, A.A.; Nørskov, J.K. Activity descriptors for CO2 electroreduction to methane on transition-metal catalysts. J. Phys. Chem. Lett. 2012, 3, 251–258. [Google Scholar] [CrossRef]
  15. Lum, Y.; Ager, J.W. Evidence for product-specific active sites on oxide-derived Cu catalysts for electrochemical CO2 reduction. Nat. Catal. 2019, 2, 86–93. [Google Scholar] [CrossRef]
  16. Zheng, T.; Liu, C.; Guo, C.; Zhang, M.; Li, X.; Jiang, Q.; Xue, W.; Li, H.; Li, A.; Pao, C.-W.; et al. Copper-catalysed exclusive CO2 to pure formic acid conversion via single-atom alloying. Nat. Nanotechnol. 2021, 16, 1386–1393. [Google Scholar] [CrossRef]
  17. Choi, C.; Kwon, S.; Cheng, T.; Xu, M.; Tieu, P.; Lee, C.; Cai, J.; Lee, H.M.; Pan, X.; Duan, X.; et al. Highly active and stable stepped Cu surface for enhanced electrochemical CO2 reduction to C2H4. Nat. Catal. 2020, 3, 804–812. [Google Scholar] [CrossRef]
  18. Duan, Y.-X.; Zhou, Y.-T.; Yu, Z.; Liu, D.-X.; Wen, Z.; Yan, J.-M.; Jiang, Q. Boosting production of HCOOH from CO2 electroreduction via Bi/CeOx. Angew. Chem. Int. Ed. 2021, 60, 8798–8802. [Google Scholar] [CrossRef] [PubMed]
  19. Jiang, B.; Zhang, X.-G.; Jiang, K.; Wu, D.-Y.; Cai, W.-B. Boosting formate production in electrocatalytic CO2 reduction over wide potential window on pd surfaces. J. Am. Chem. Soc. 2018, 140, 2880–2889. [Google Scholar] [CrossRef]
  20. Kumawat, A.S.; Sarkar, A. Electrochemical reduction of CO2 on Pb–Bi–Sn metal mixtures: Importance of eutectics. SN Appl. Sci. 2019, 1, 317. [Google Scholar] [CrossRef] [Green Version]
  21. Yang, Y.; Li, F. Reactor design for electrochemical CO2 conversion toward large-scale applications. Curr. Opin. Green Sustain. Chem. 2021, 27, 100419. [Google Scholar] [CrossRef]
  22. Kuhl, K.P.; Cave, E.R.; Abram, D.N.; Jaramillo, T.F. New insights into the electrochemical reduction of carbon dioxide on metallic copper surfaces. Energy Environ. Sci. 2012, 5, 7050–7059. [Google Scholar] [CrossRef]
  23. Lu, W.; Zhang, Y.; Zhang, J.; Xu, P. Reduction of gas CO2 to CO with high selectivity by Ag nanocube-based membrane cathodes in a photoelectrochemical system. Ind. Eng. Chem. Res. 2020, 59, 5536–5545. [Google Scholar] [CrossRef]
  24. Mahyoub, S.A.; Qaraah, F.A.; Chen, C.; Zhang, F.; Yan, S.; Cheng, Z. An overview on the recent developments of Ag-based electrodes in the electrochemical reduction of CO2 to CO. Sustain. Energy Fuels 2020, 4, 50–67. [Google Scholar] [CrossRef]
  25. Buckley, A.K.; Cheng, T.; Oh, M.H.; Su, G.M.; Garrison, J.; Utan, S.W.; Zhu, C.; Toste, F.D.; Goddard, W.A.; Toma, F.M. Approaching 100% selectivity at low potential on Ag for electrochemical CO2 reduction to CO using a surface additive. ACS Catal. 2021, 11, 9034–9042. [Google Scholar] [CrossRef]
  26. Bohlen, B.; Wastl, D.; Radomski, J.; Sieber, V.; Vieira, L. Electrochemical CO2 reduction to formate on indium catalysts prepared by electrodeposition in deep eutectic solvents. Electrochem. Commun. 2020, 110, 106597. [Google Scholar] [CrossRef]
  27. Guo, W.; Tan, X.; Bi, J.; Xu, L.; Yang, D.; Chen, C.; Zhu, Q.; Ma, J.; Tayal, A.; Ma, J.; et al. Atomic Indium catalysts for switching CO2 electroreduction products from formate to CO. J. Am. Chem. Soc. 2021, 143, 6877–6885. [Google Scholar] [CrossRef]
  28. Chen, Q.; Luo, L.; Faraji, H.; Feldberg, S.W.; White, H.S. Electrochemical measurements of single H2 nanobubble nucleation and stability at Pt nanoelectrodes. J. Phys. Chem. Lett. 2014, 5, 3539–3544. [Google Scholar] [CrossRef]
  29. Lubetkin, S. The motion of electrolytic gas bubbles near electrodes. Electrochim. Acta 2002, 48, 357–375. [Google Scholar] [CrossRef]
  30. Lum, Y.; Ager, J.W. Sequential catalysis controls selectivity in electrochemical CO2 reduction on Cu. Energy Environ. Sci. 2018, 11, 2935–2944. [Google Scholar] [CrossRef] [Green Version]
Figure 1. CO2R electrochemical cell. Schematic illustration of (a) the structure layout of the self-built big electrochemical cell and (b) catholyte chamber. (c) Optical image of the electrochemical cells used in this work. The small electrochemical cell is manufactured by a stereolithography 3D printer (Formlabs, form 2). The catholyte chamber and anolyte chamber of the big electrochemical cell are made of acrylic glass. The gas dispersion plate is a self-made sintered glass filter with a porosity of G4.
Energies 15 00335 g001
Figure 2. Morphology and crystal structure. SEM images of (a) Ag and (b) In. XRD patterns of (c) Ag and (d) In. Spectra are plotted versus the equivalent Cu Kα 2θ diffraction angle.
Energies 15 00335 g002
Figure 3. Comparison of CO2R performance. Product distributions and applied potentials against current density for (a) Ag in the small electrochemical cell, (b) Ag in the big electrochemical cell, and (c) In in the small electrochemical cell, and (d) In in the big electrochemical cell. For all the measurements, the electrolyte is 0.1 M aqueous solution of KHCO3. The volume of catholyte in the small electrochemical cell is ~2 mL with a CO2 flow rate of 5 sccm. The volume of catholyte in the big electrochemical cell is ~400 mL. The CO2 flow rate of 100 sccm is chosen to ensure a similar mass transfer environment as the small electrochemical cell.
Energies 15 00335 g003
Figure 4. Linear sweep voltammograms for (a) small electrochemical cell and (b) big electrochemical cell. (c) Product distributions against time for In in the big electrochemical cell (the current density is kept at ~0.5 mA/cm2).
Energies 15 00335 g004
Figure 5. Schematic illustration of the modeling CO transfer for Ag. 2-dimensional modeling (6 mm × 140 mm) was carried on the cross-section of the catholyte chamber. The CO2 bubbles ratio indicates the proportion of the light gray area. For example, 50% CO2 bubbles ratio means 50% area of the center plane, which is parallel to the cathode and involves the centerline of the catholyte chamber, is occupied by CO2 bubbles.
Energies 15 00335 g005
Figure 6. Mass transport modeling. CO concentration contours for the cross-section of the catholyte chamber in (a) the big electrochemical cell and (b) the small electrochemical cell. The CO2 bubbles ratio was set at 0.1%, 1%, 10%, and 50%, respectively. The surface CO concentration versus the height of reactor curves in (c) the big electrochemical cell and (d) the small electrochemical cell.
Energies 15 00335 g006
Publisher’s Note: MDPI stays neutral with regard to jurisdictional claims in published maps and institutional affiliations.

