
Real Time Sustainable Power Quality Analysis of Non-Linear Load under Symmetrical Conditions


 ,
,  , and
, and 
Abstract
:1. Introduction
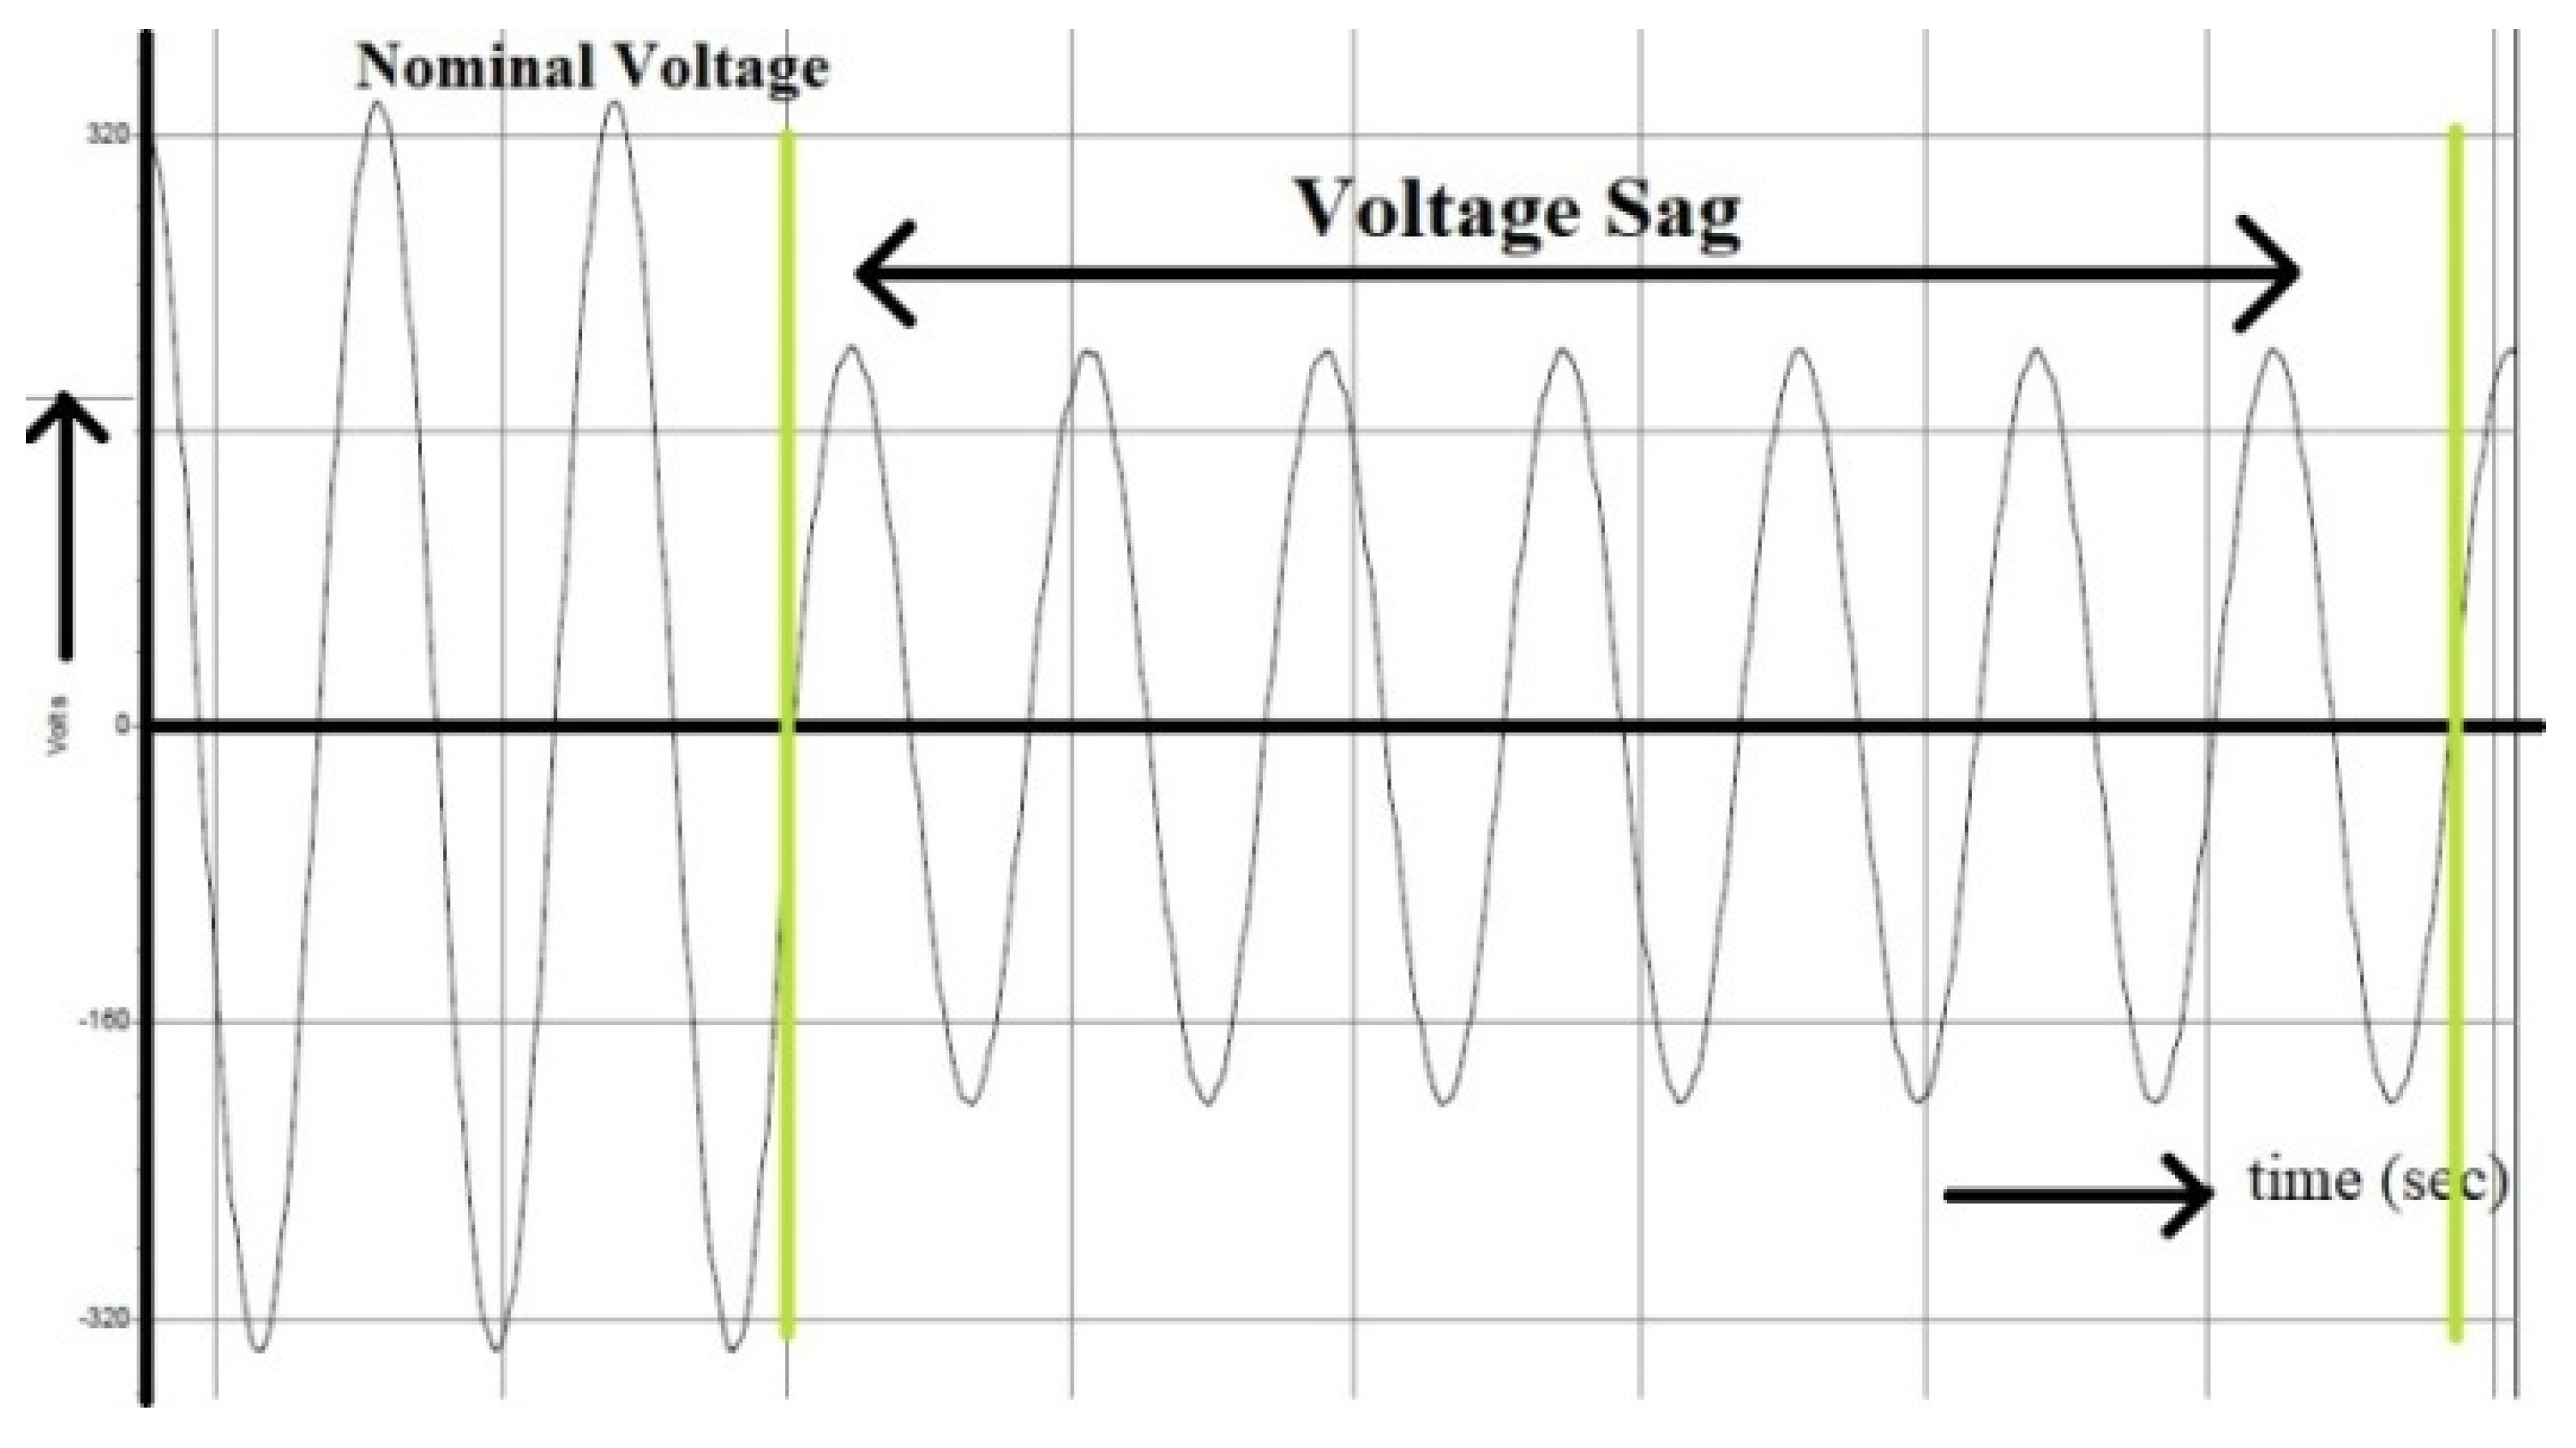
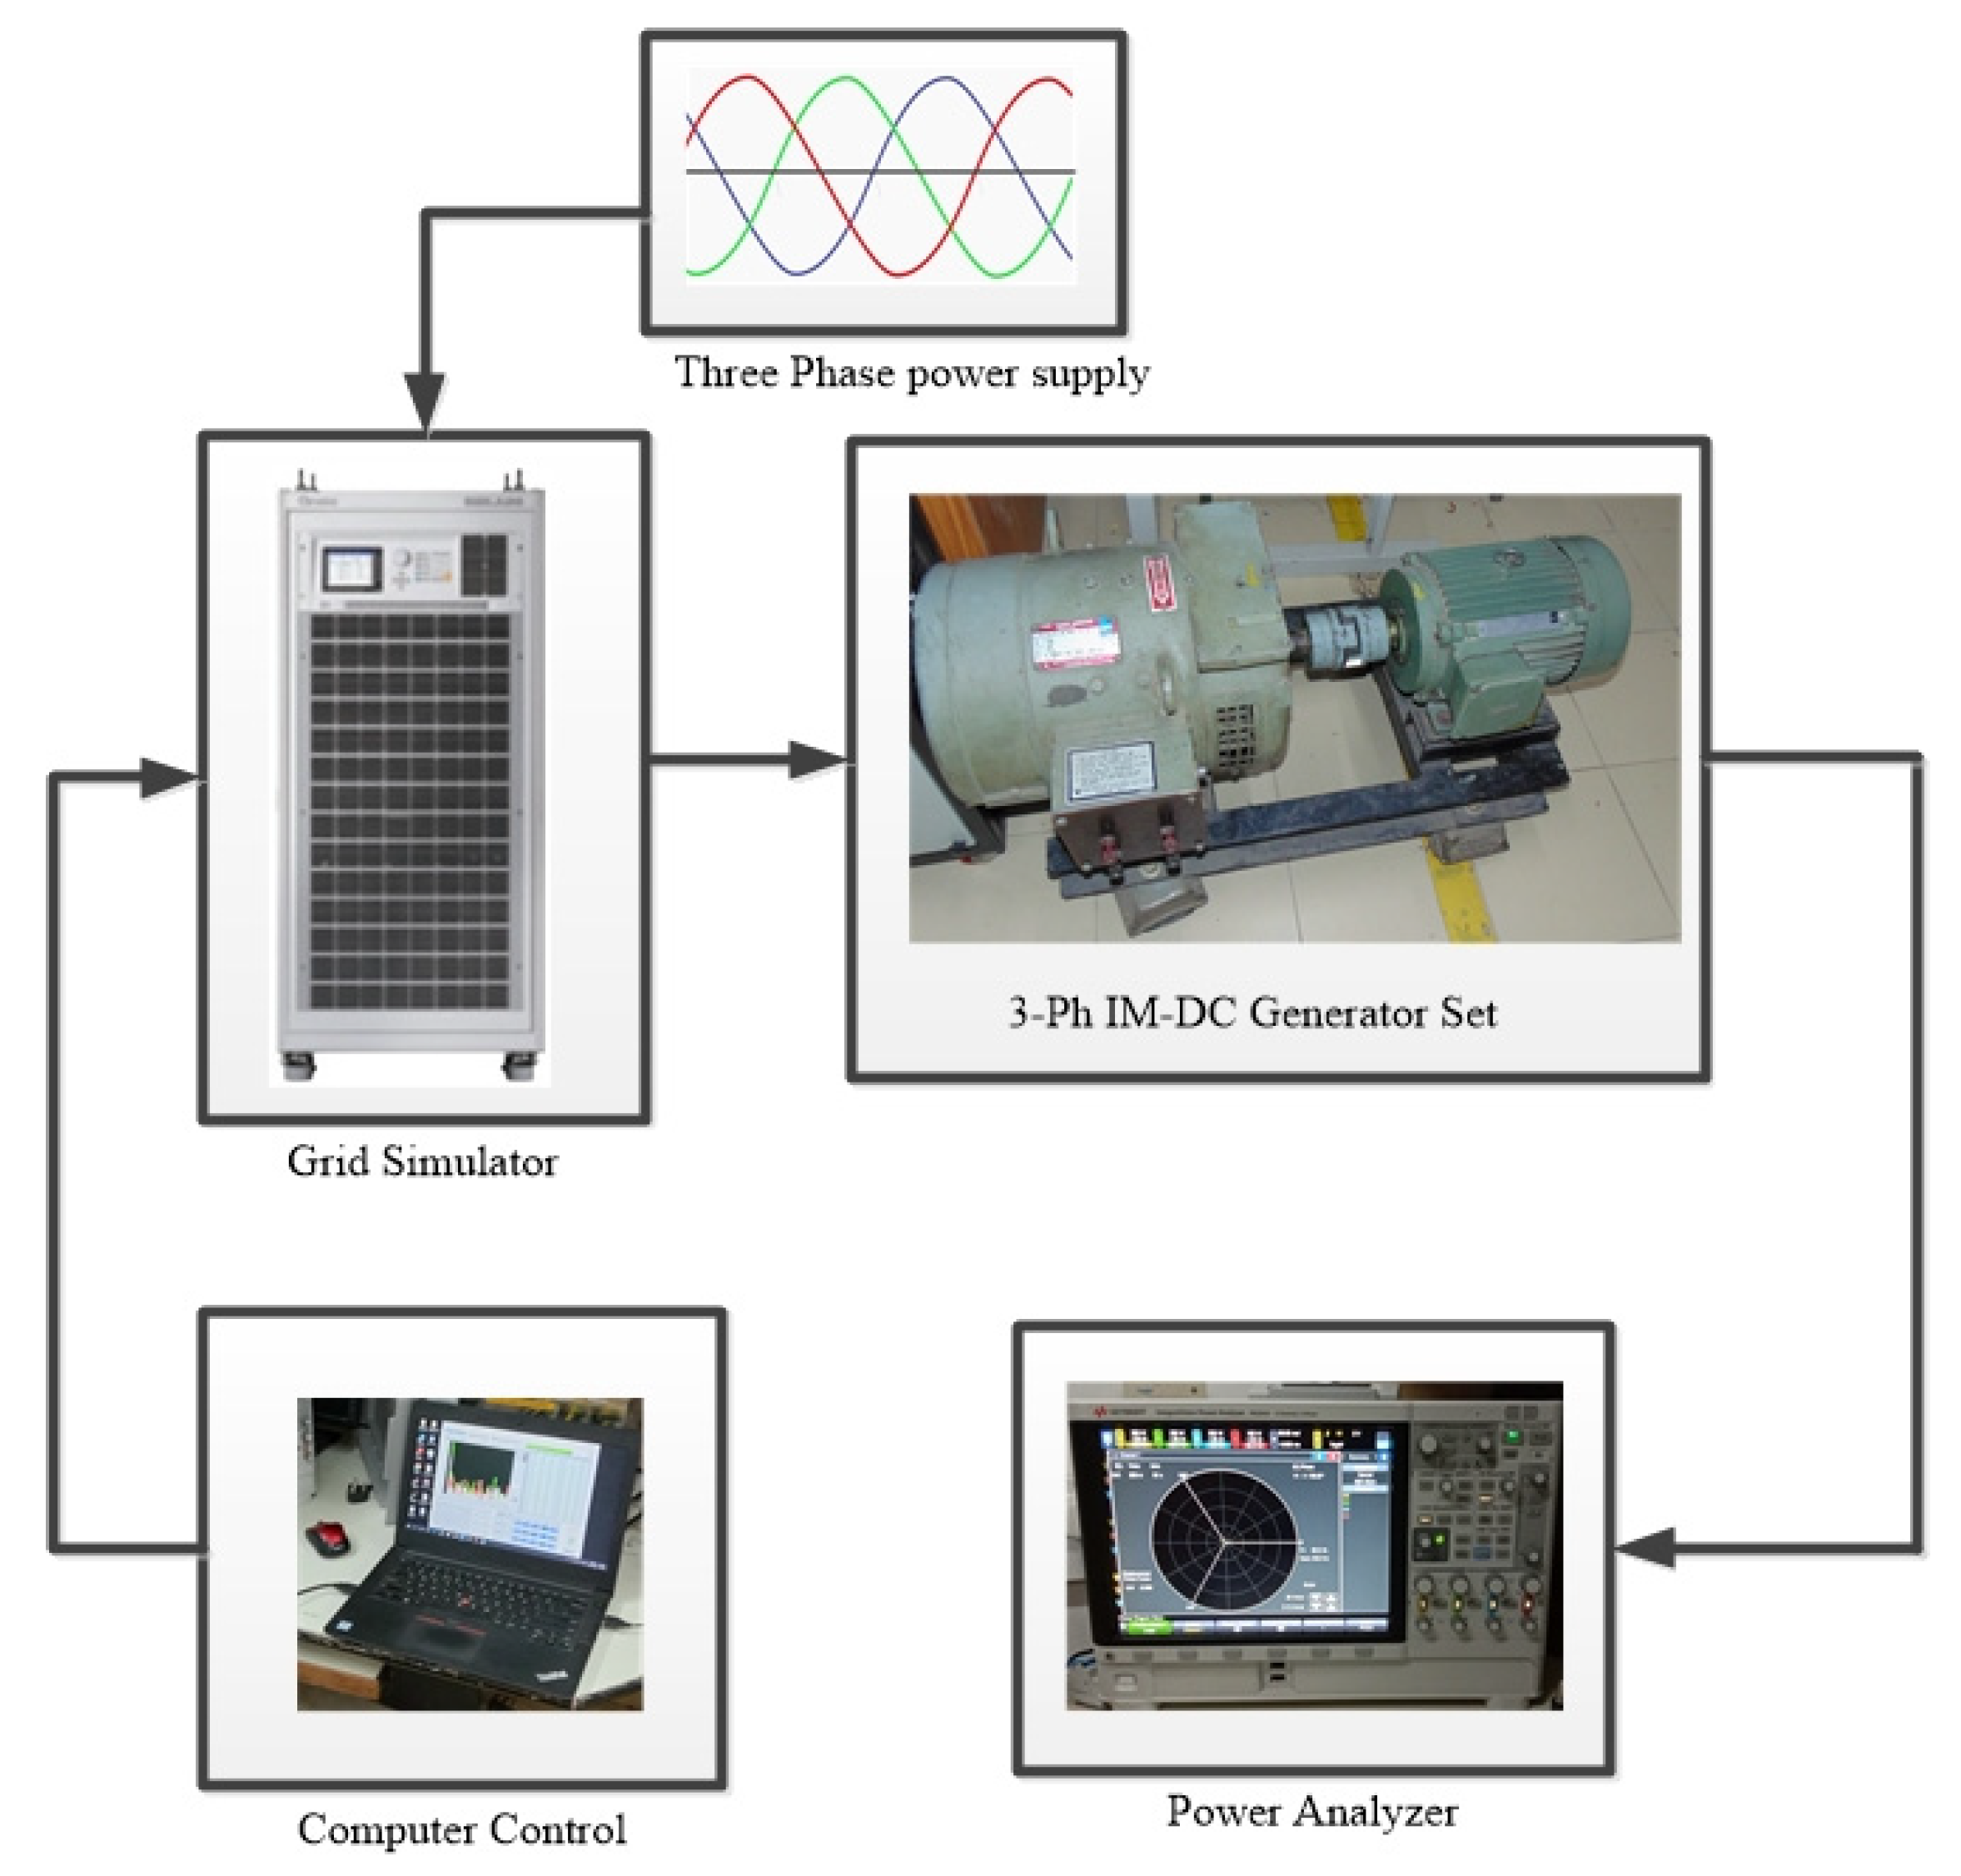
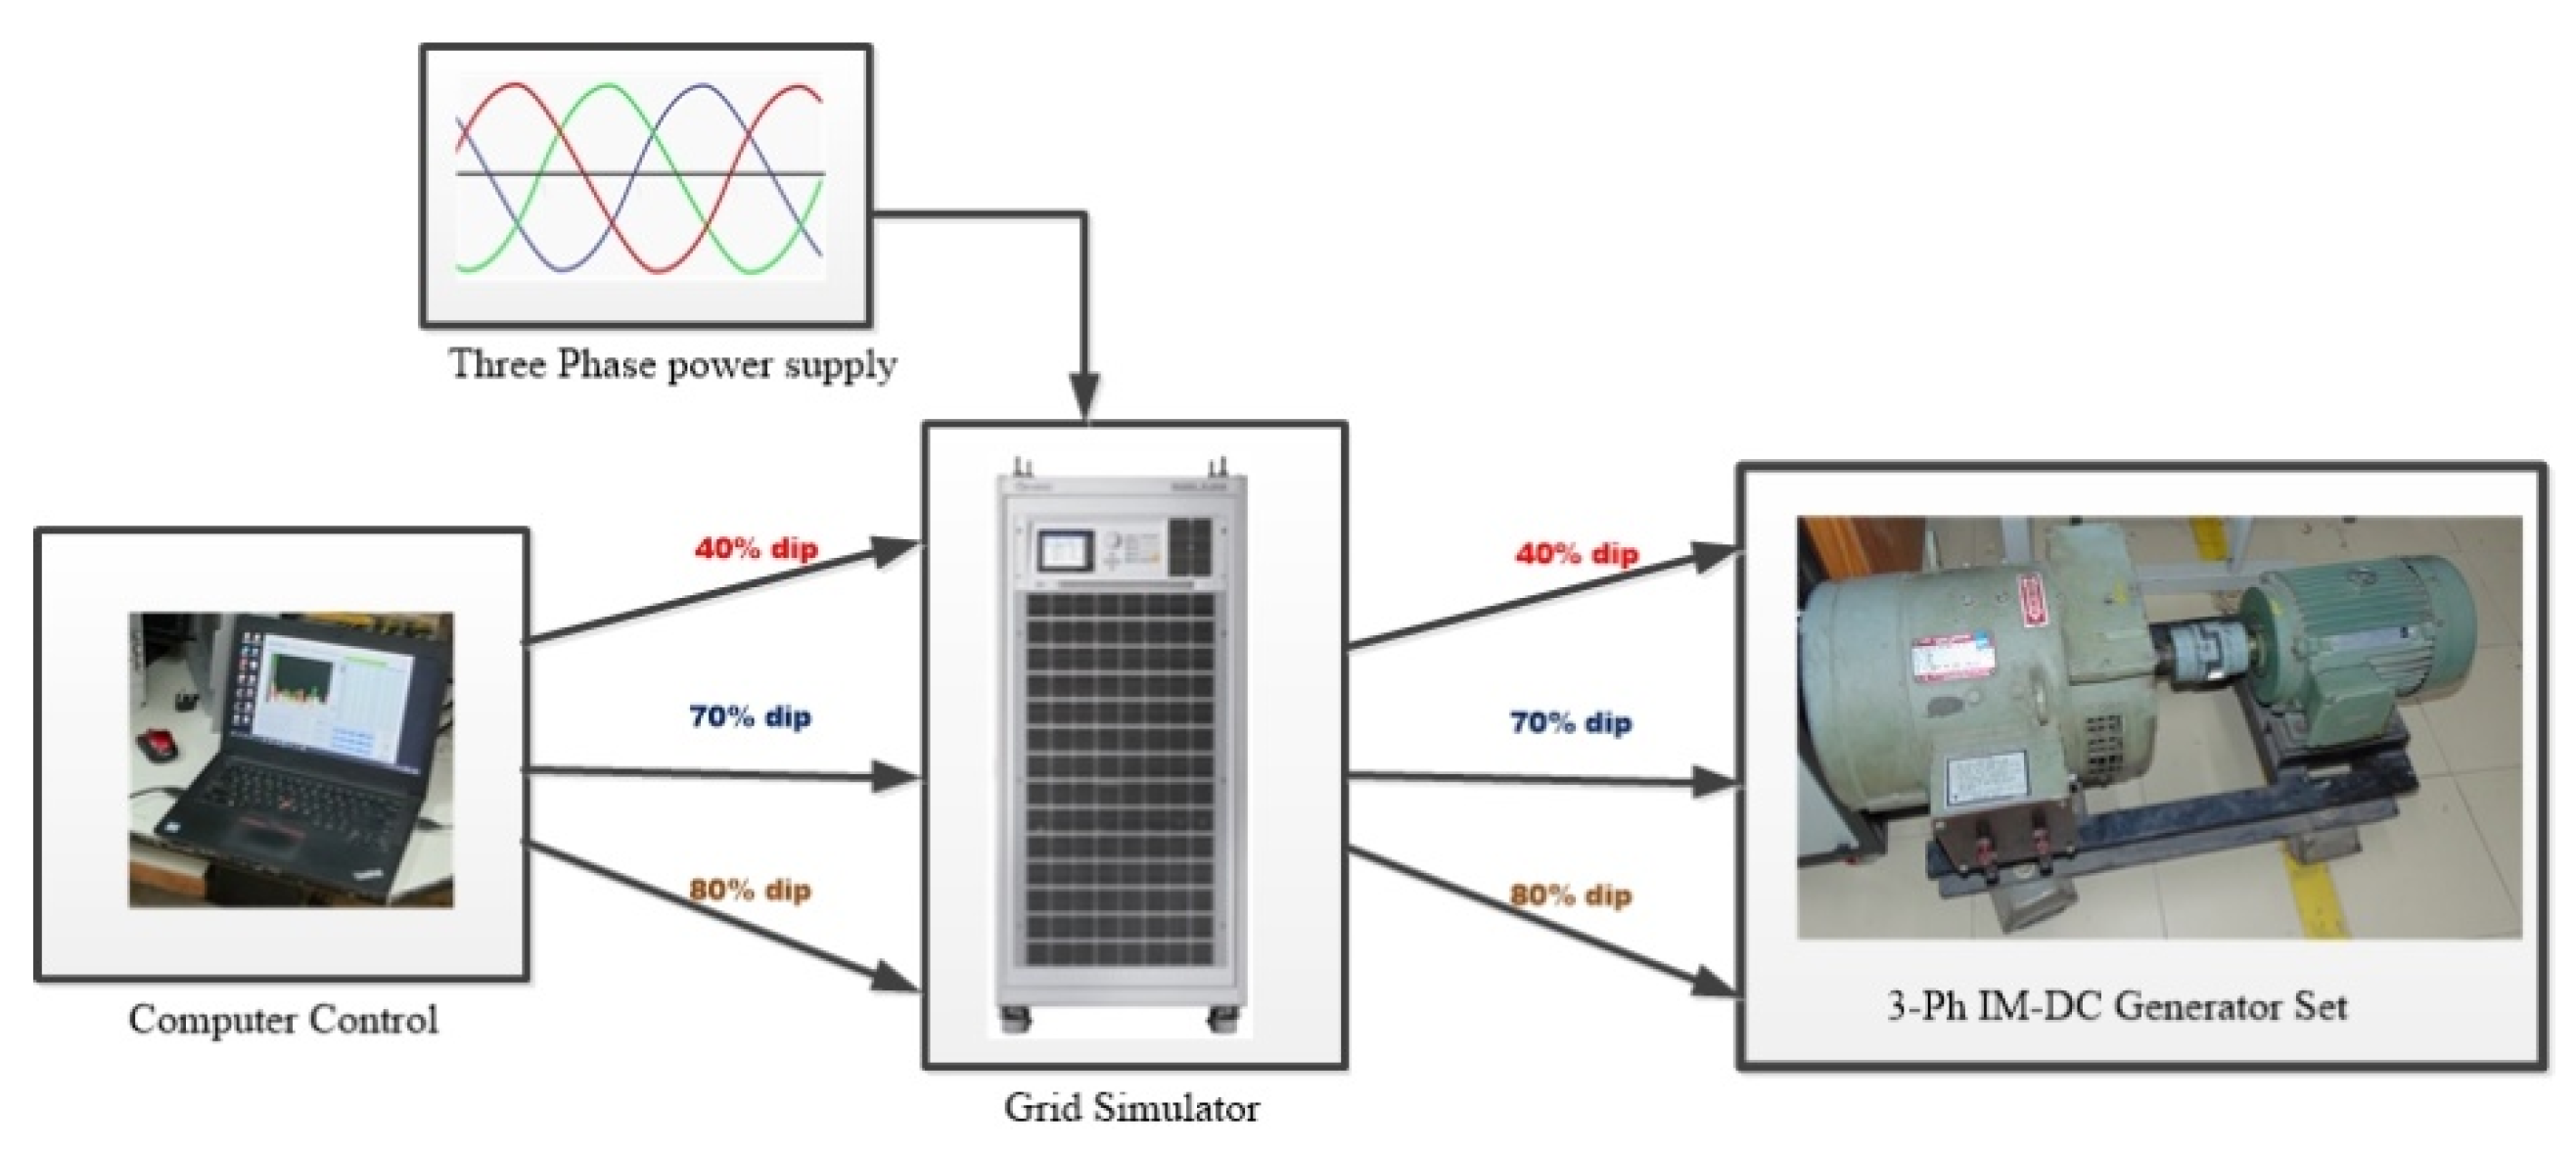
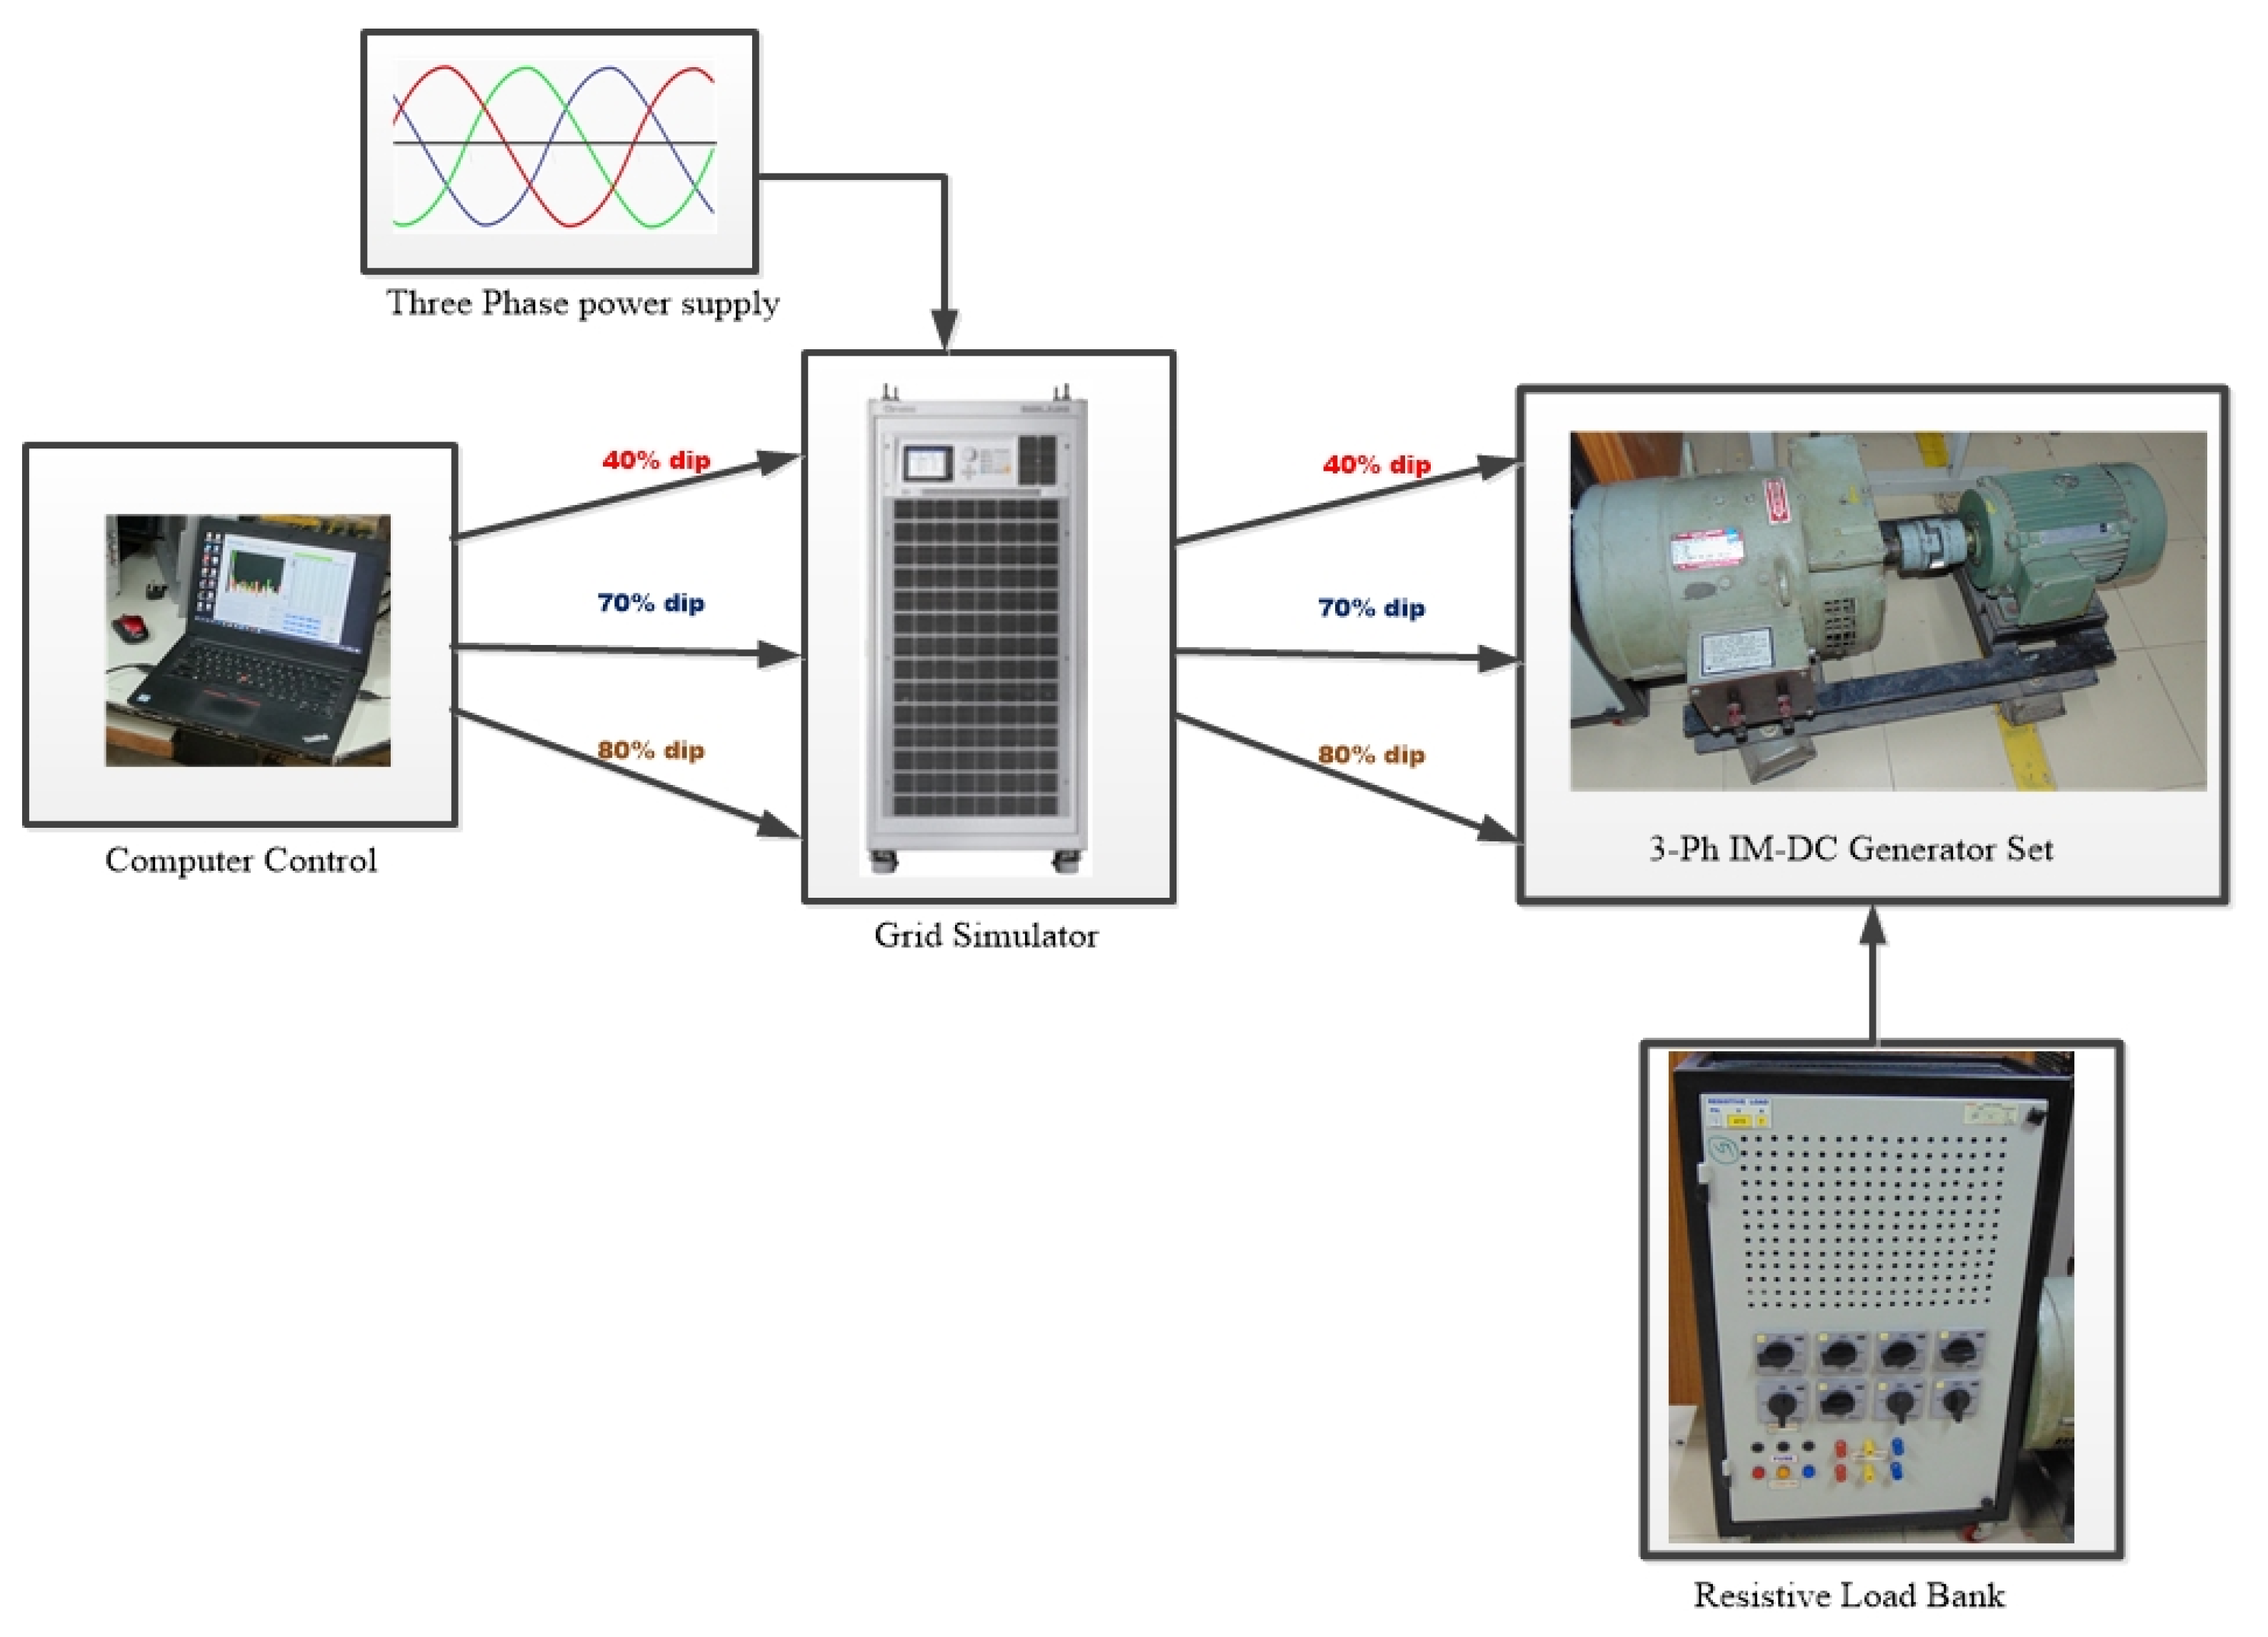
2. Methodology to Test the Sag Conditions Analysis of Sag Conditions
2.1. Regenerative Grid Simulator
2.2. Computer Control
2.3. Load
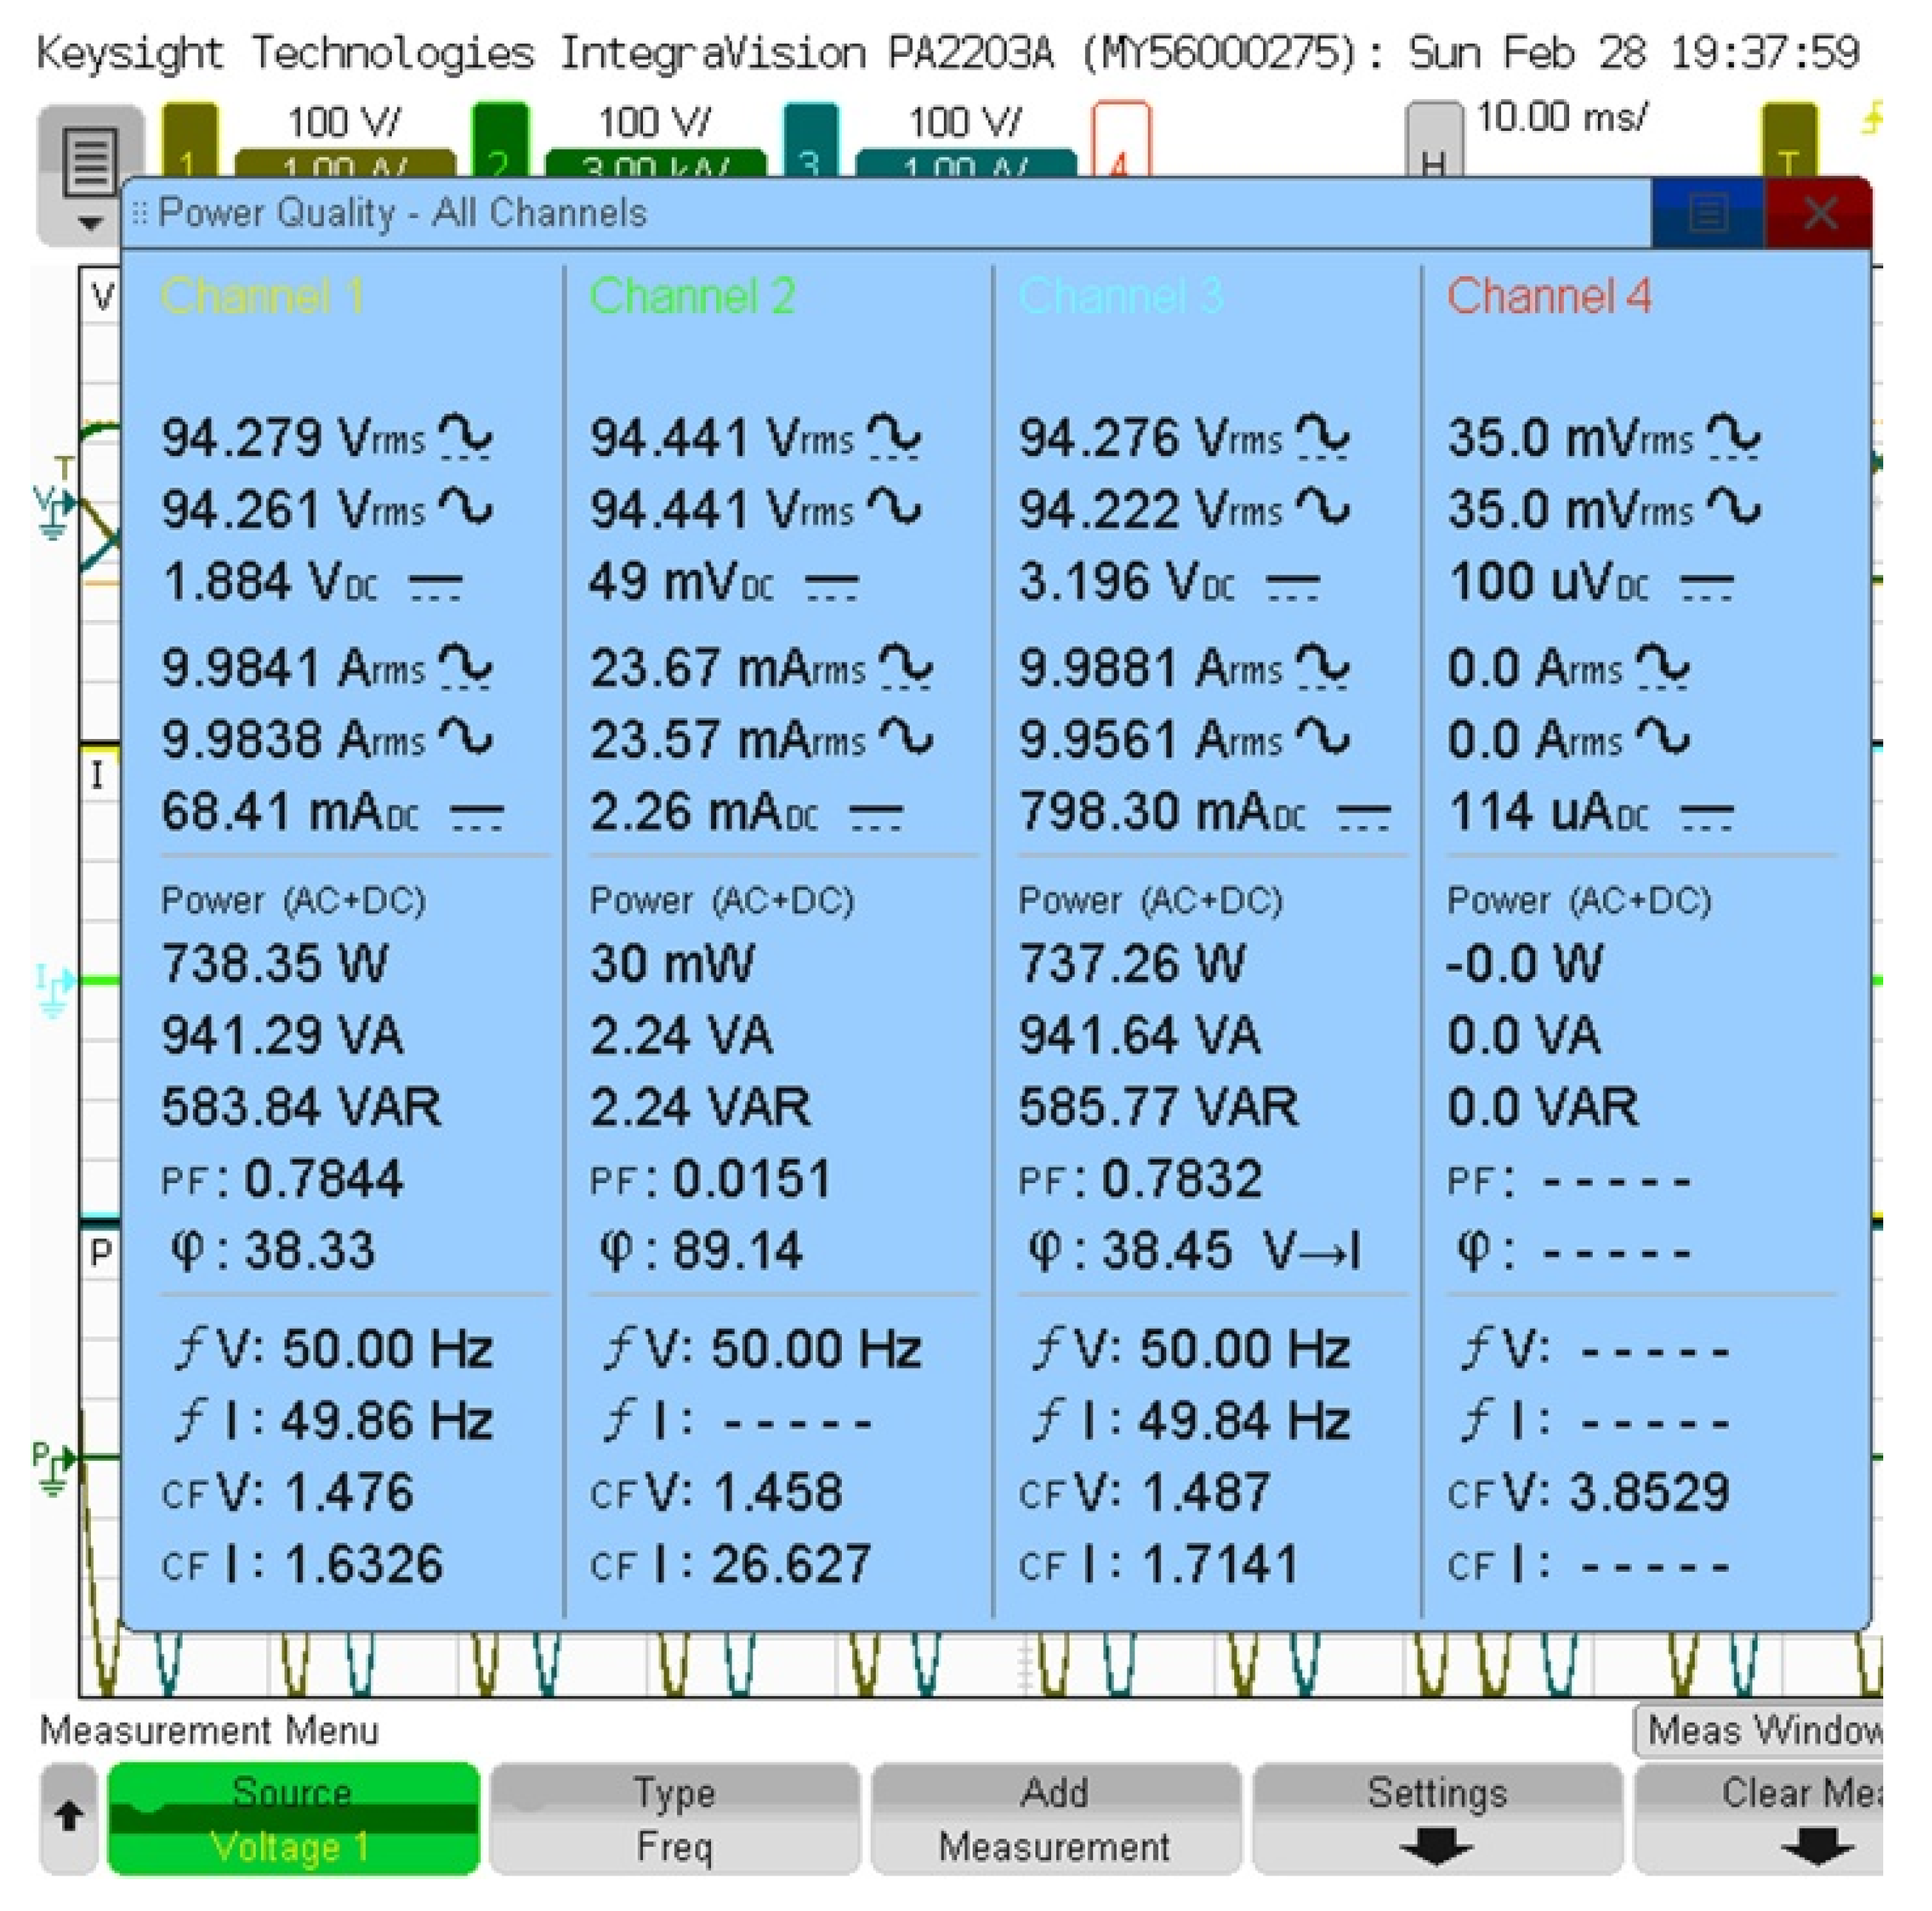
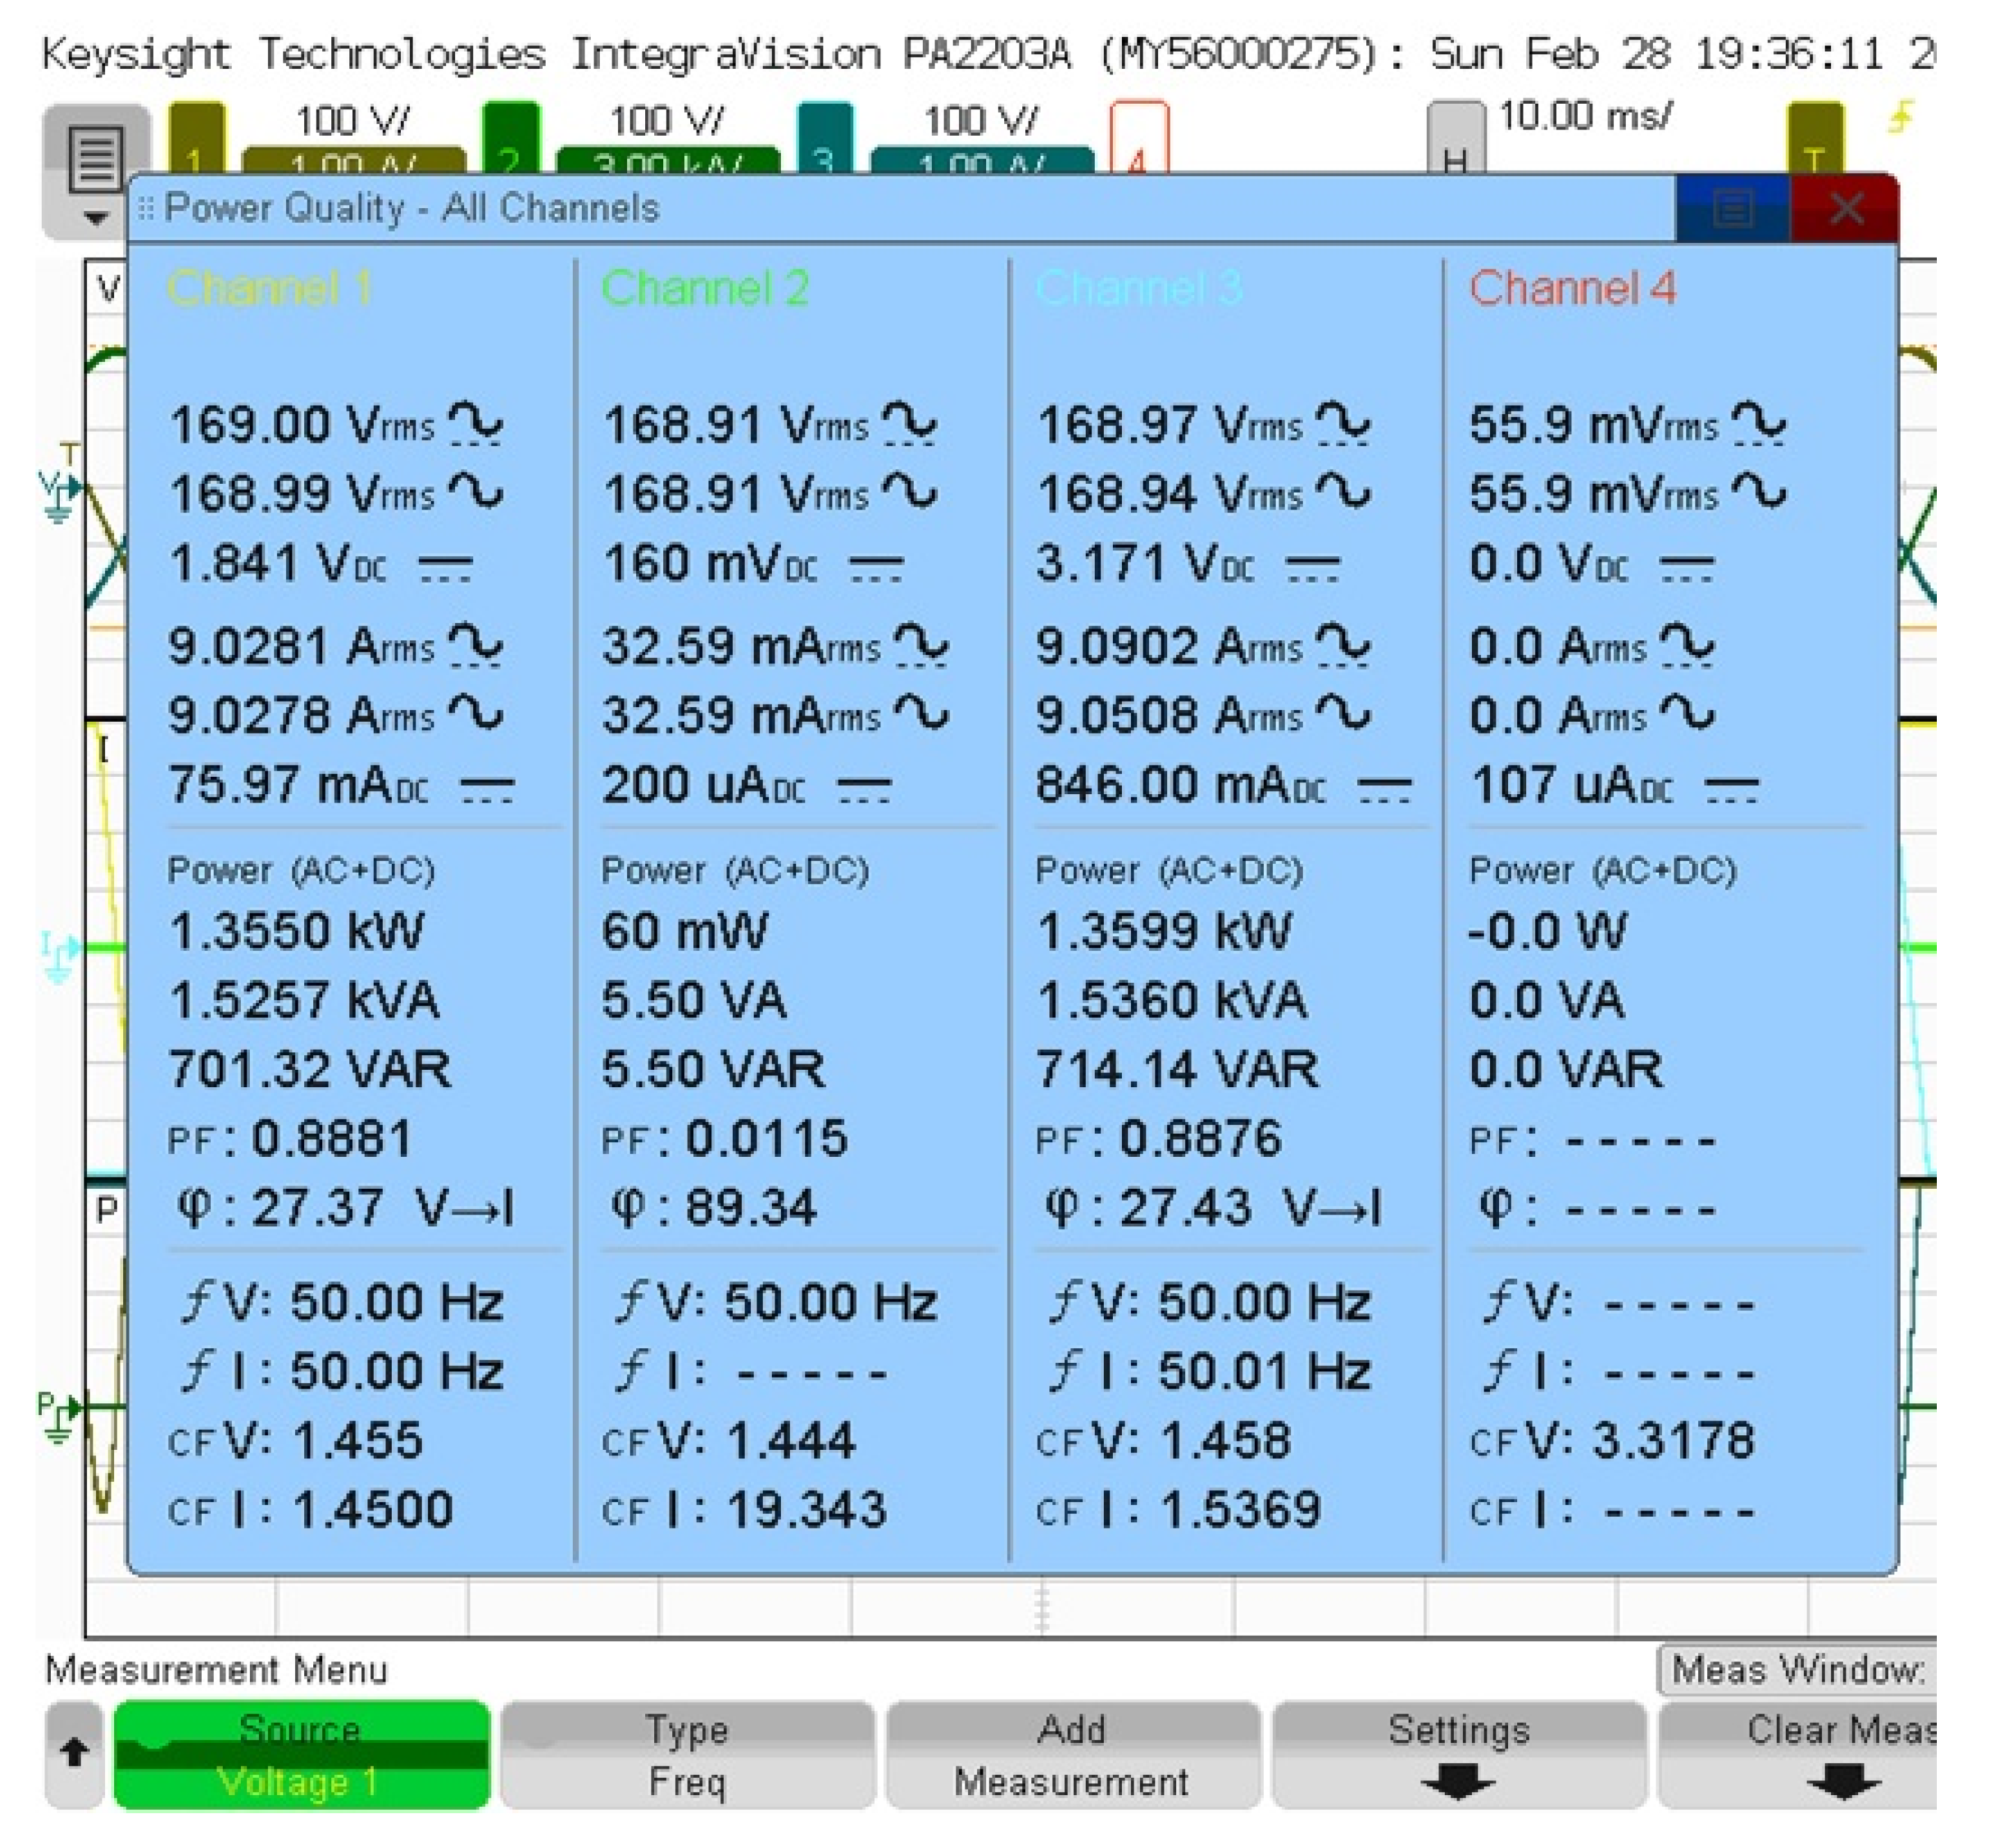
2.4. Measurement
2.5. Test Process
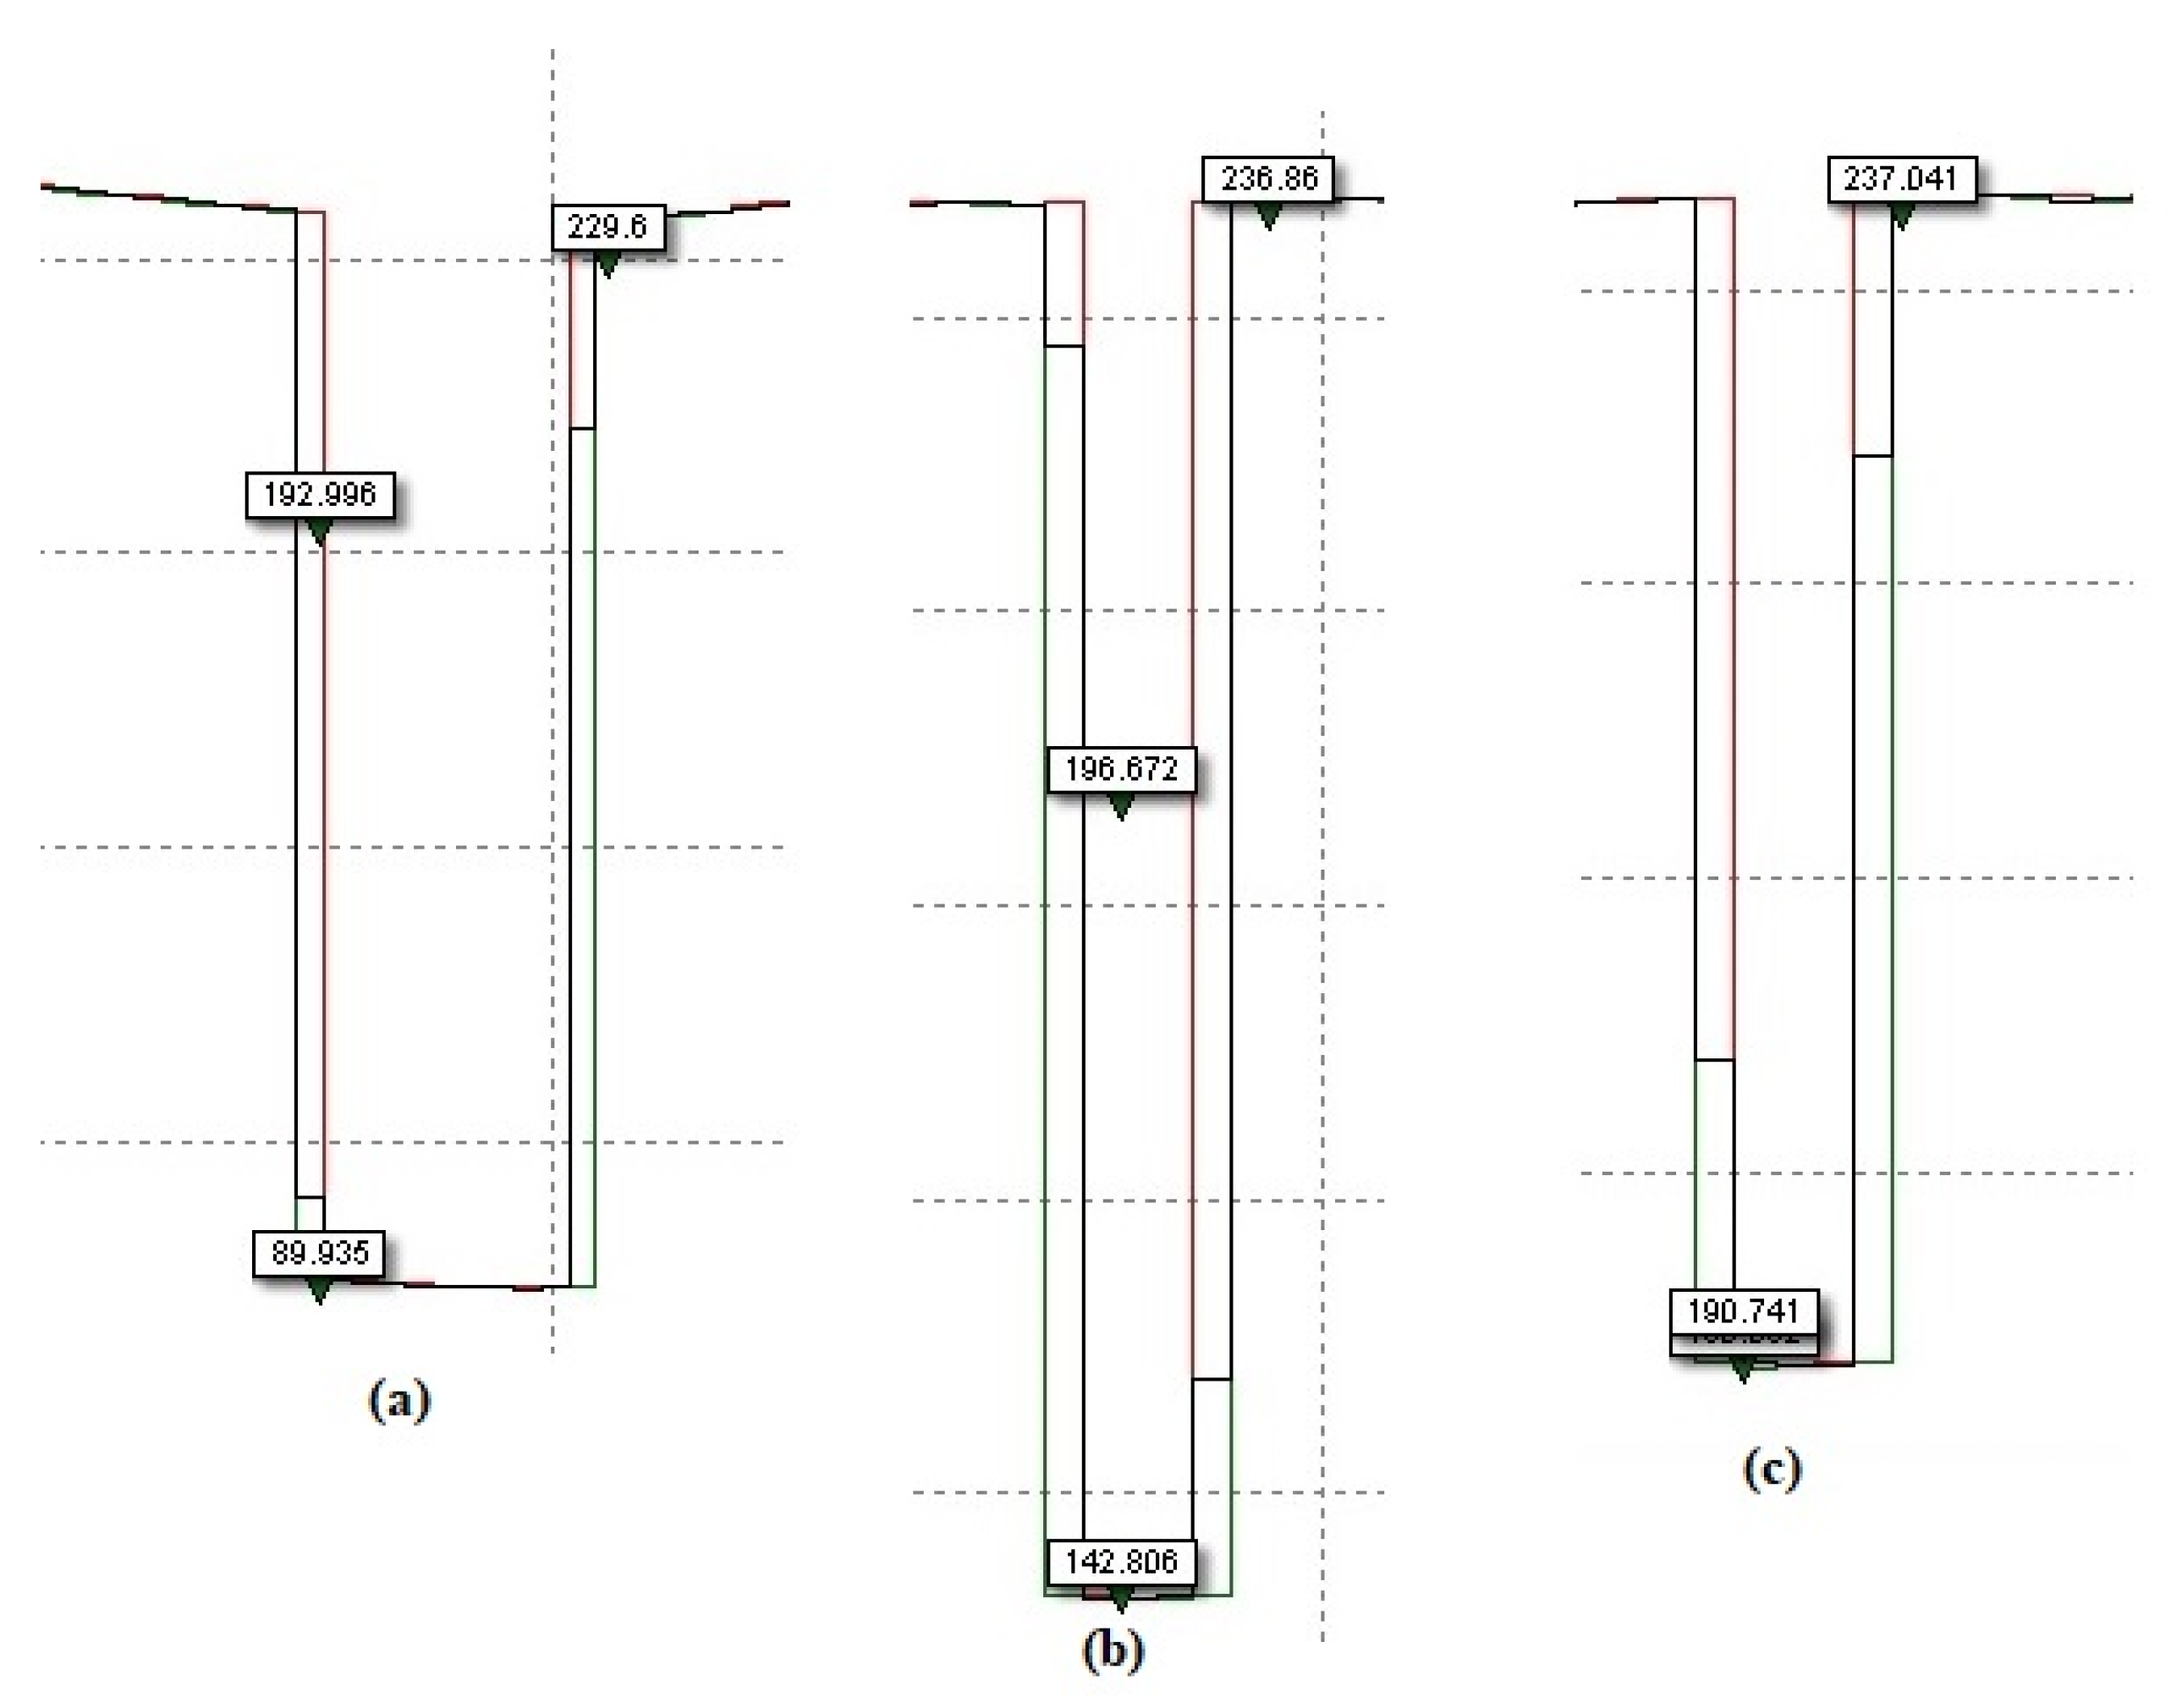
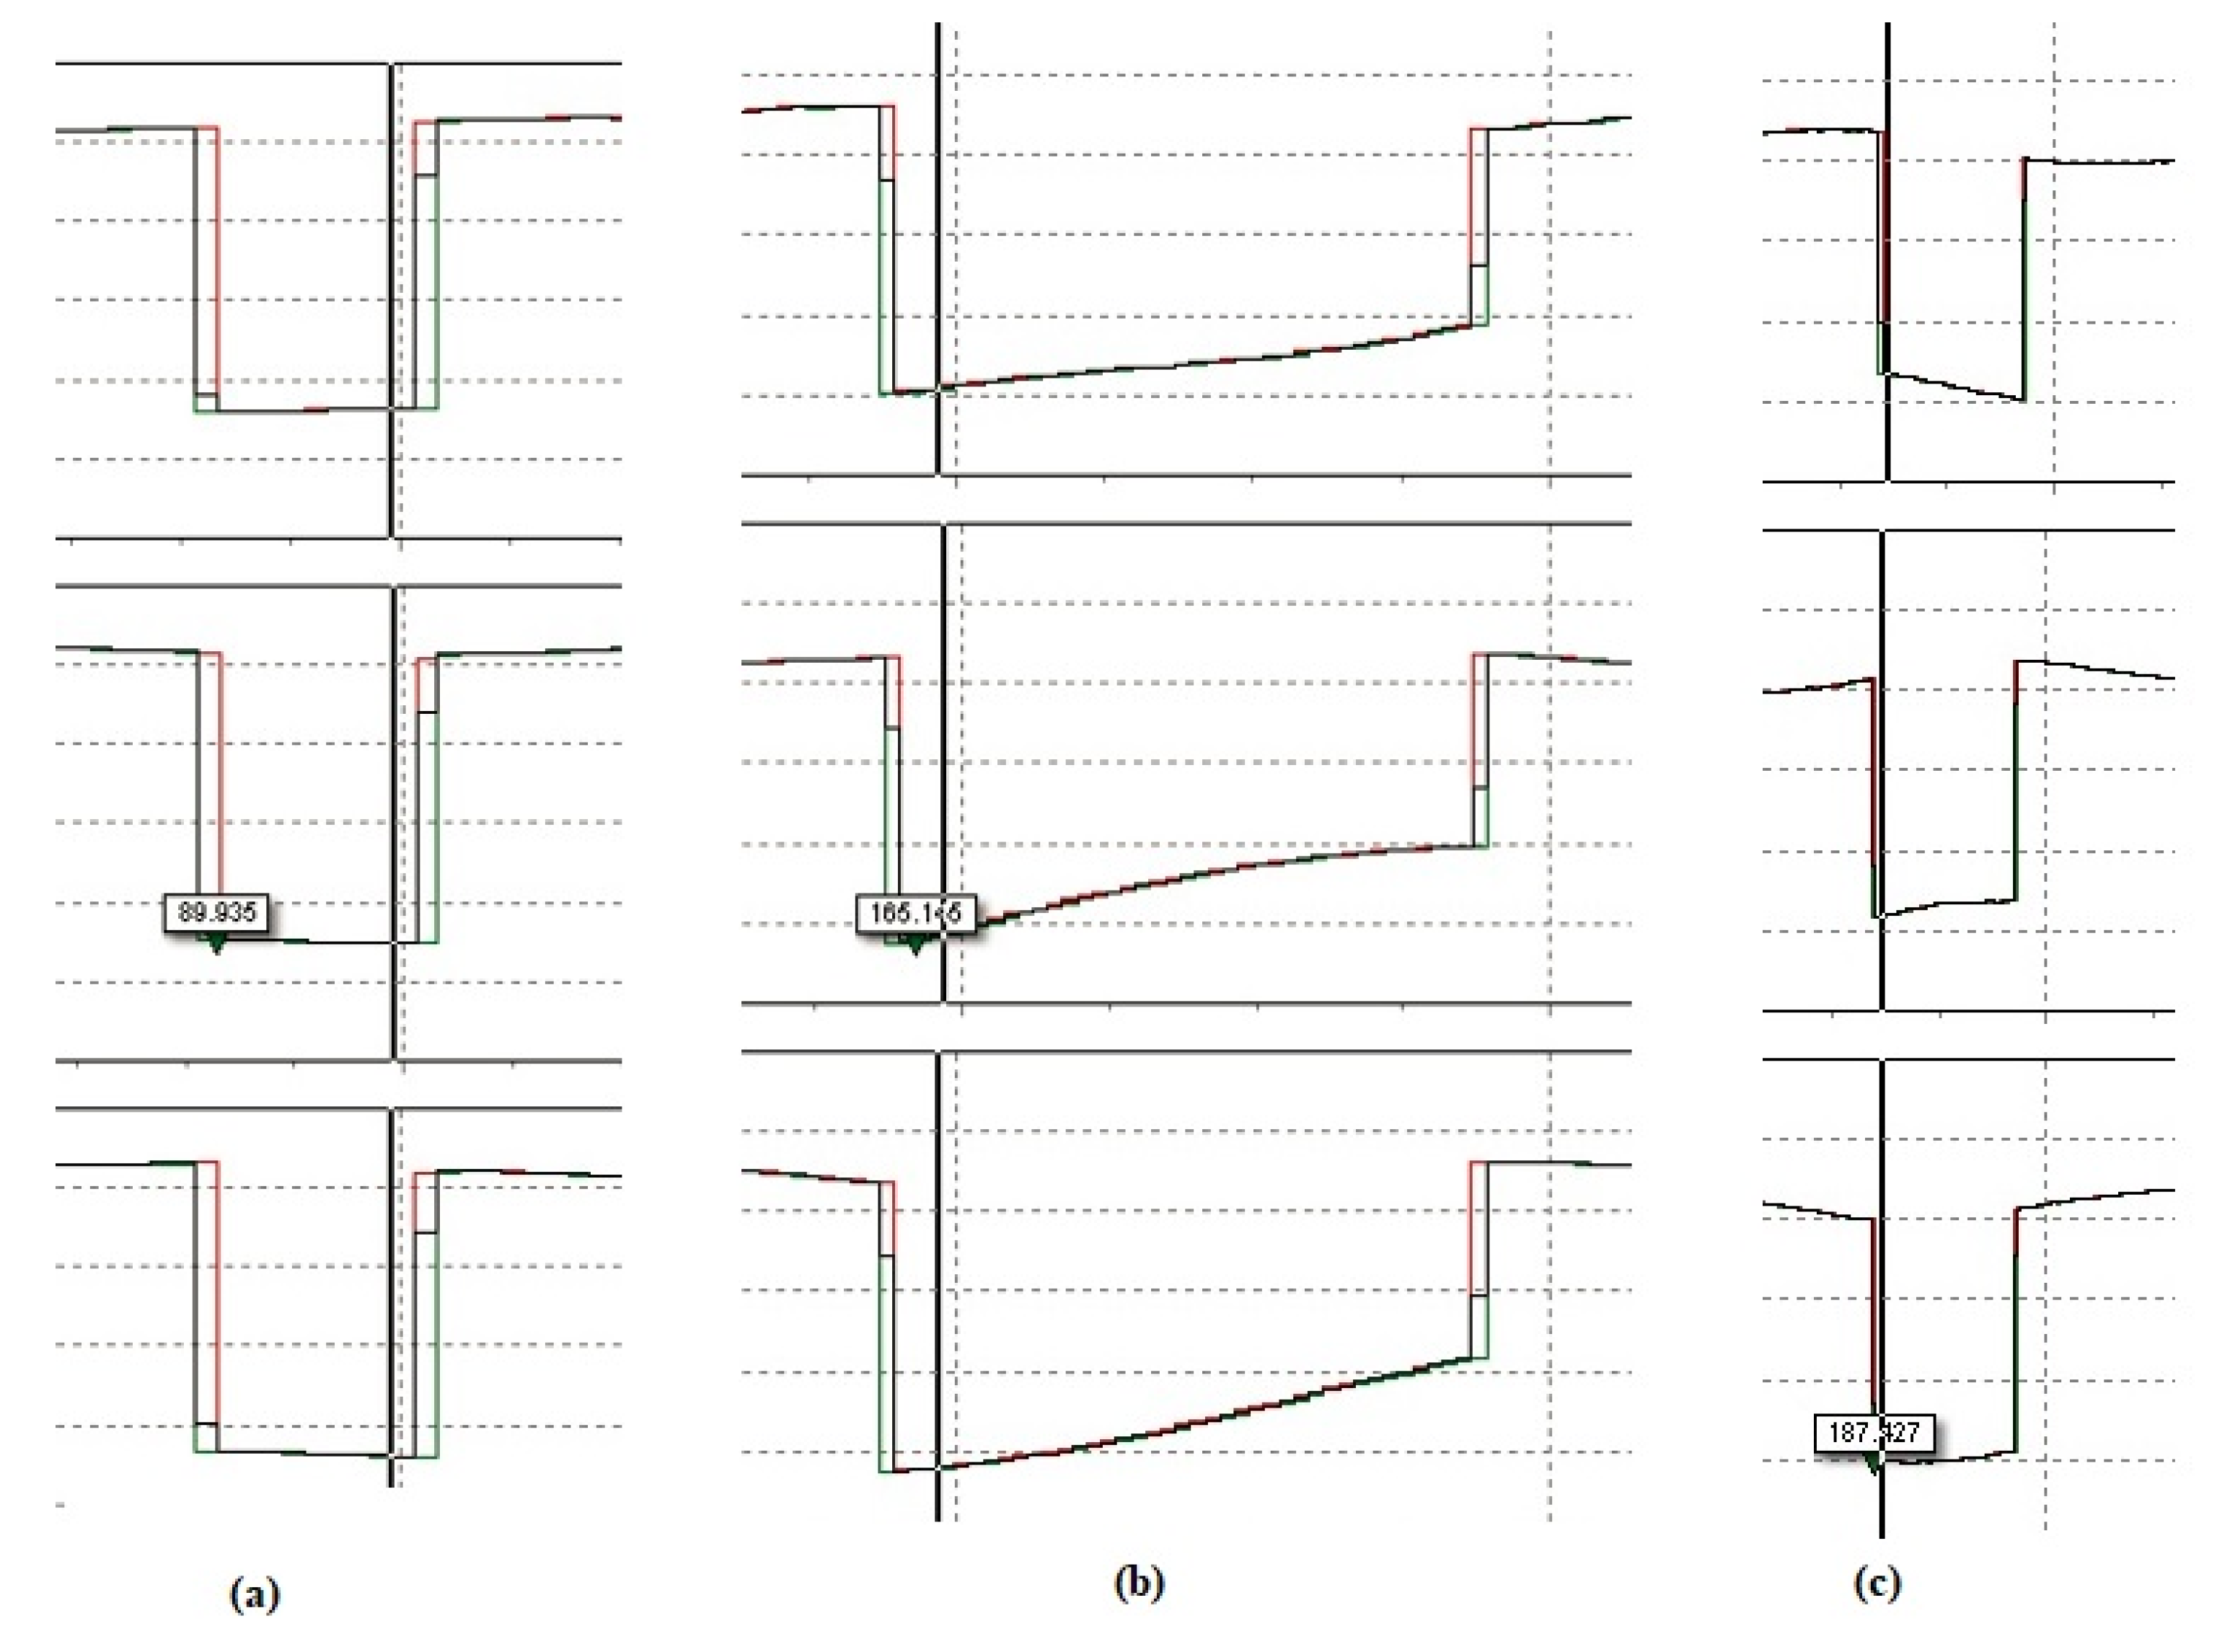
3. Analysis of Sag Conditions
3.1. Regenerative Grid Supply with Voltage Sag
3.2. Induction Motor under Voltage Sag
3.3. Three Phase Sag
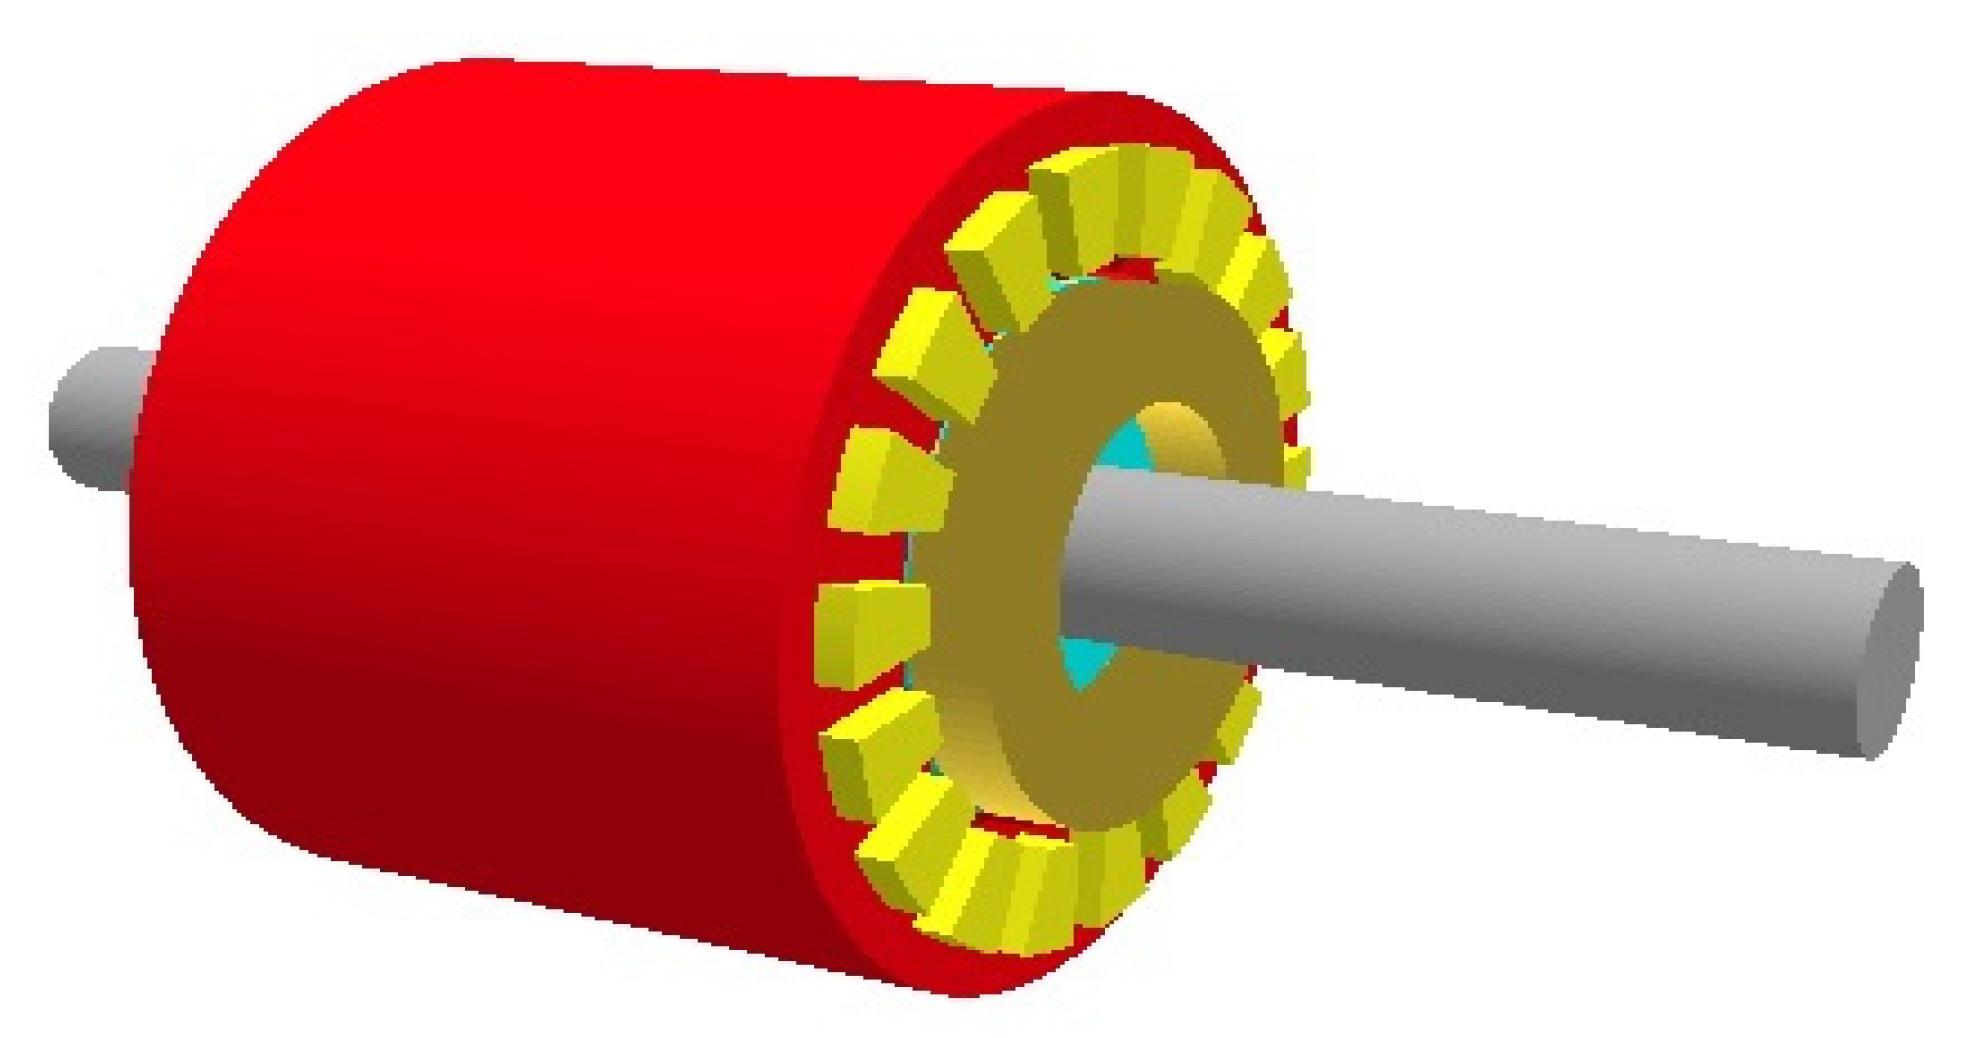
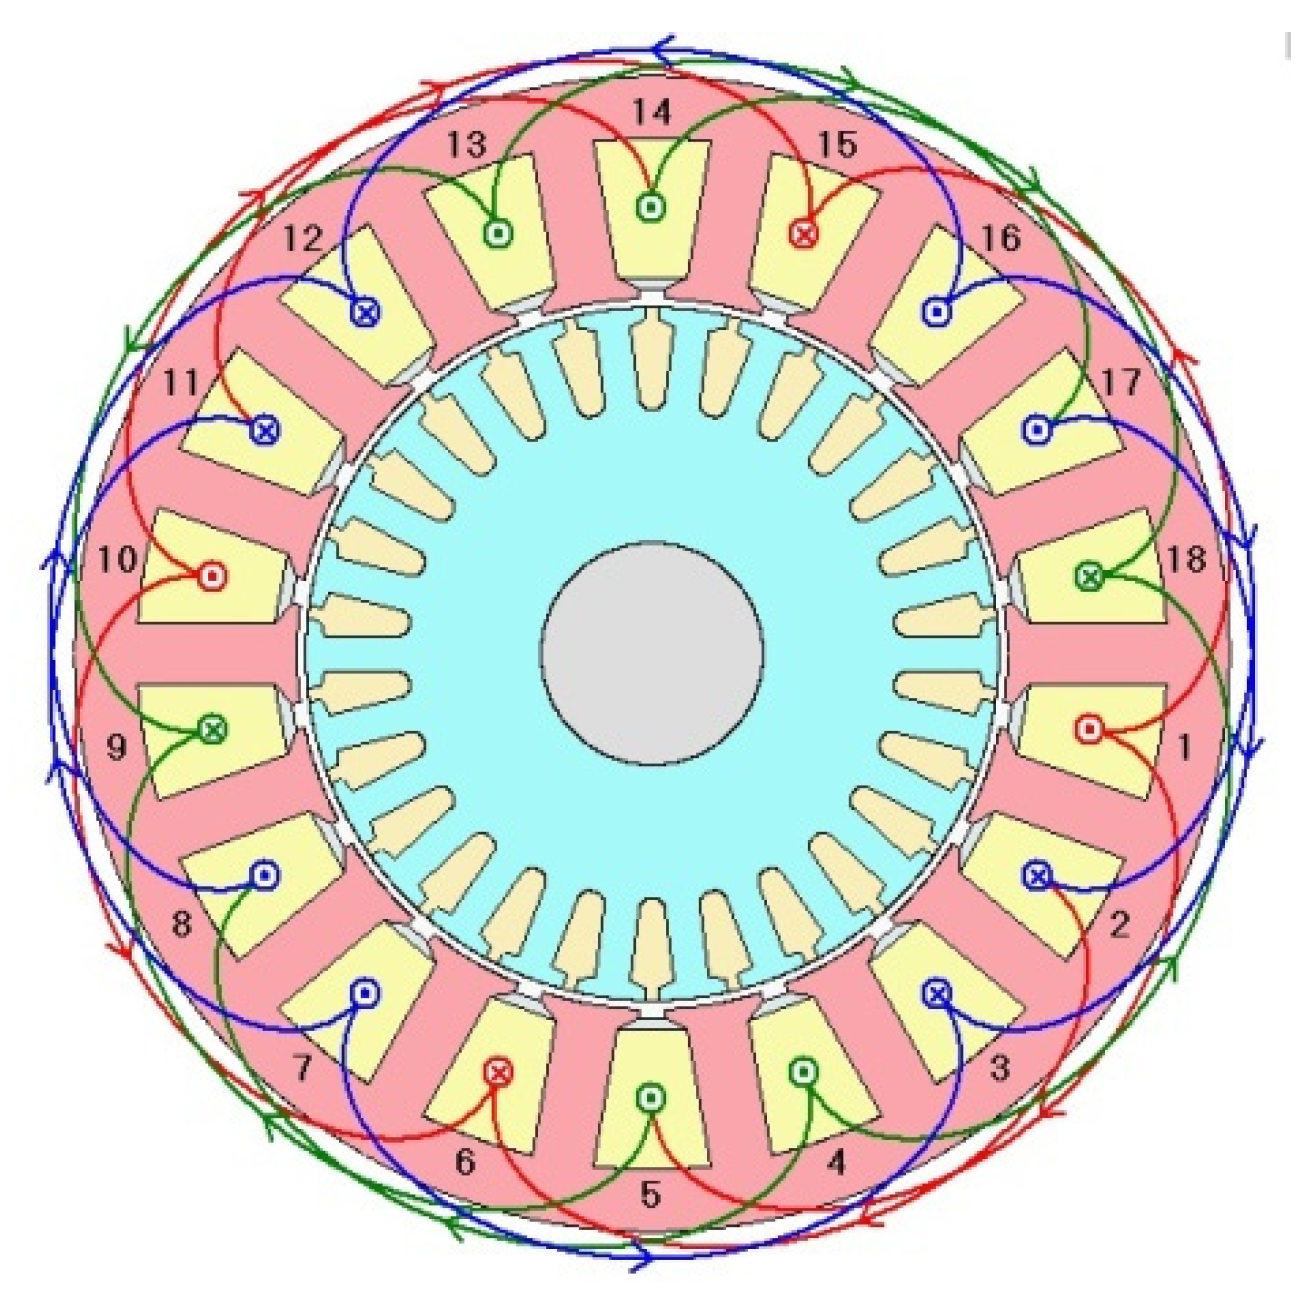
4. Design Modifications of the Induction Motor Using ANSYS
- (a)
- Machine Geometry
- (b)
- Input Data (Materials)
- (c)
- Machine Winding
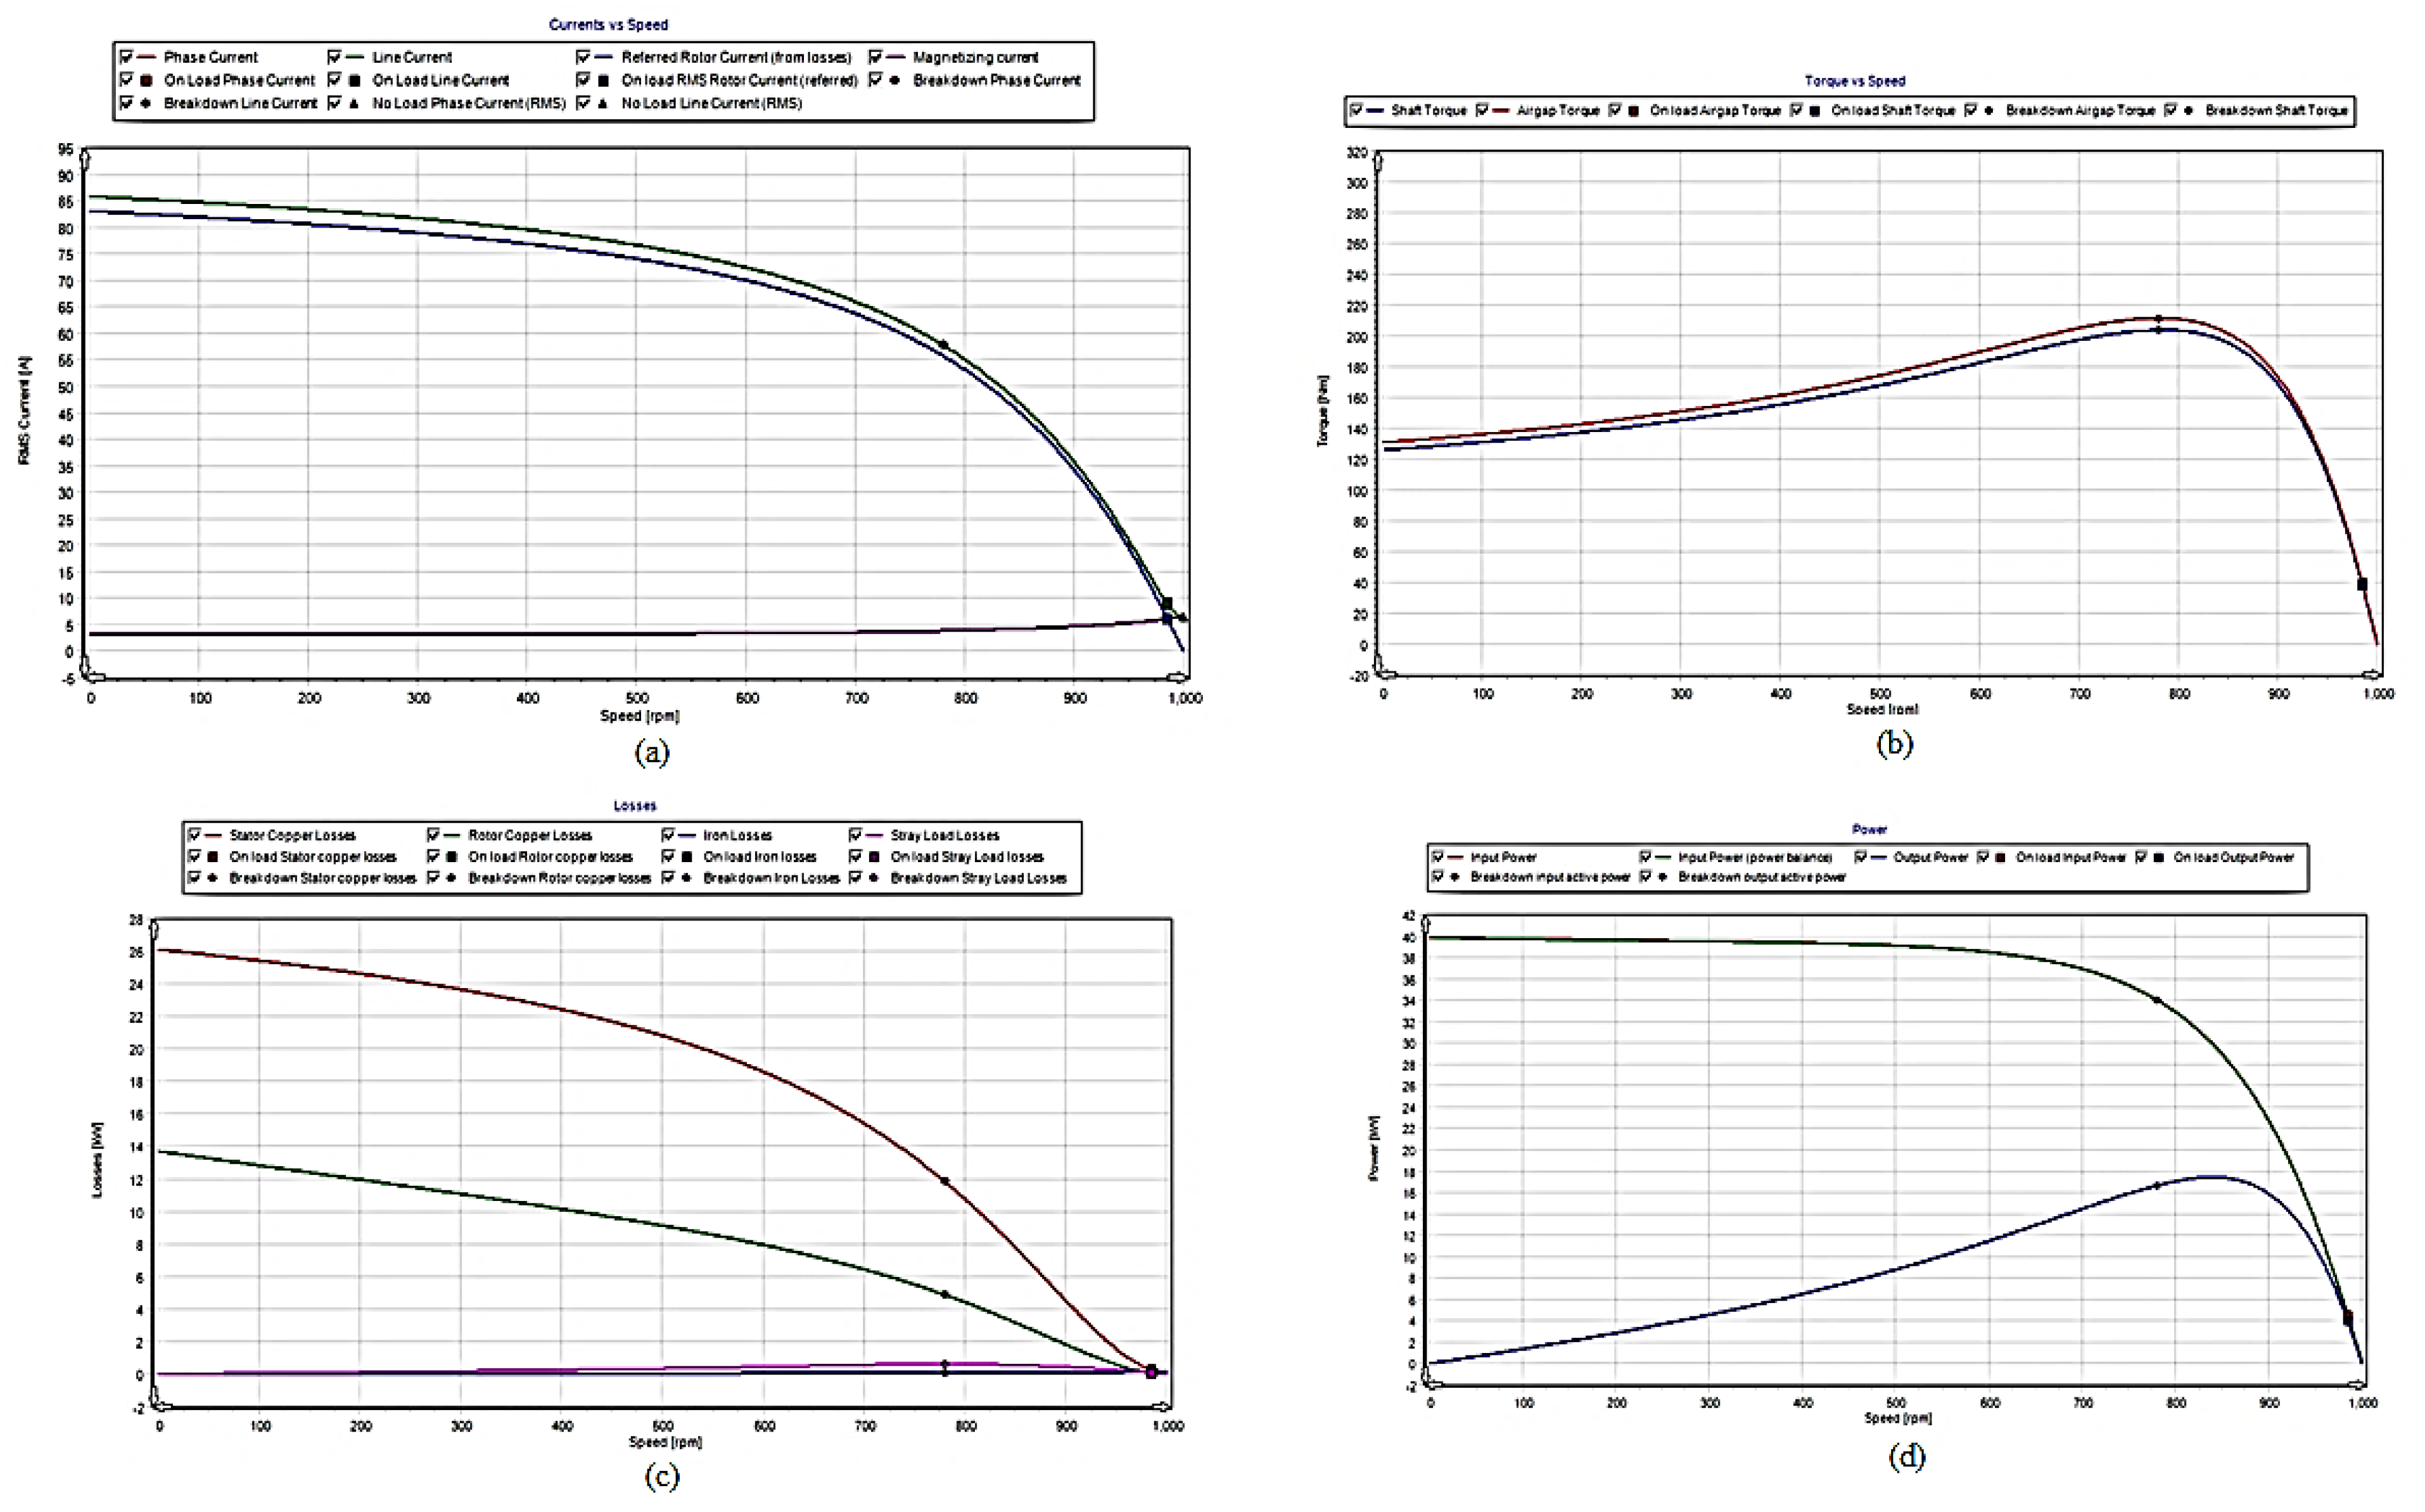
5. Simulation Results
6. Conclusions and Future Scope
Author Contributions
Funding
Institutional Review Board Statement
Informed Consent Statement
Conflicts of Interest
References
- Huang, A.; Xiao, X.; Wang, Y. Evaluation Scheme of Voltage Sag Immunity in Sensitive Industrial Process. IEEE Access 2021, 9, 66398–66407. [Google Scholar] [CrossRef]
- Hasan, S.; Muttaqi, K.M.; Sutanto, D. Application of the Automatic Segmented Hilbert Huang Transform Method for the Evaluation of the Single-Event Characteristics of Voltage Sags in Power Systems. IEEE Trans. Ind. Appl. 2021, 57, 1882–1891. [Google Scholar] [CrossRef]
- Cunha, M.F.; Jacobina, C.B.; de Freitas, N.B. Grid-Connected Induction Motor Using a Floating DC-Link Converter under Unbalanced Voltage Sag. IEEE Trans. Ind. Appl. 2021, 57, 1609–1618. [Google Scholar] [CrossRef]
- Liu, J.; Zhao, C.; Xie, Z. Power and Current Limiting Control of Wind Turbines Based on PMSG under Unbalanced Grid Voltage. IEEE Access 2021, 9, 9873–9883. [Google Scholar] [CrossRef]
- Cheerangal, M.J.; Jain, A.K.; Das, A. Control of Rotor Field-Oriented Induction Motor Drive during Input Supply Voltage Sag. IEEE J. Emerg. Sel. Top. Power Electron. 2021, 9, 2789–2796. [Google Scholar] [CrossRef]
- Paul, D.; Goswami, A.K.; Kumar, S.; Jain, S.; Pandey, A. Propagation of Voltage Sag Considering Different Winding Connections: Impact on the Healthiness of Transformers. IEEE Trans. Ind. Appl. 2020, 56, 6186–6196. [Google Scholar] [CrossRef]
- Han, Y.; Feng, Y.; Yang, P.; Xu, L.; Xu, Y.; Blaabjerg, F. Cause, Classification of Voltage Sag, and Voltage Sag Emulators and Applications: A Comprehensive Overview. IEEE Access 2020, 8, 1922–1934. [Google Scholar] [CrossRef]
- Serrano-Fontova, A.; Torrens, P.C.; Bosch, R. Power Quality Disturbances Assessment during Unintentional Islanding Scenarios. A Contribution to Voltage Sag Studies. Energies 2019, 12, 3198. [Google Scholar] [CrossRef] [Green Version]
- Ma, L.; Tian, D.; Liu, T.; Gao, S.; Dong, P. An Evaluation Method for Bus and Grid Structure Based on Voltage Sags/Swells Using Voltage Ellipse Parameters. IEEE Access 2021, 9, 101959–101971. [Google Scholar] [CrossRef]
- Zhang, L.; Bollen, M.H.J. Characteristic of voltage dips (sags) in power systems. IEEE Trans. Power Deliv. 2002, 15, 827–832. [Google Scholar]
- Alipoor, J.; Doroudi, A.; Ghaseminezhad, M. Detection of the Critical Duration of Different Types of Voltage Sags for Synchronous Machine Torque Oscillation. Energy Power Eng. 2012, 04, 117–124. [Google Scholar] [CrossRef] [Green Version]
- Mendes, A.; Cardoso, A.J.M. Performance analysis of three-phase induction motor drives under inverter fault conditions. In Proceedings of the 4th IEEE International Symposium on Diagnostics for Electric Machines, Power Electronics and Drives, 2003, SDEMPED 2003, Atlanta, GA, USA, 24–26 August 2003; pp. 205–210. [Google Scholar]
- Programmable Automated Test Equipment. Available online: https://www.chromausa.com (accessed on 1 January 2021).
- Electronic Design, Test Automation and Measurement Equipment. Available online: https://www.keysight.com (accessed on 1 January 2021).
- Gallo, D.; Landi, C.; Luiso, M.; Fiorucci, E. Survey on Voltage Dip Measurements in Standard Framework. IEEE Trans. Instrum. Meas. 2013, 63, 374–387. [Google Scholar] [CrossRef]
- Thakur, P.; Singh, A.K. Unbalance Voltage Sag Fault-Type Characterization Algorithm for Recorded Waveform. IEEE Trans. Power Deliv. 2013, 28, 1007–1014. [Google Scholar] [CrossRef]
- Li, Y.; Mao, C.; Zhang, B.; Zeng, J. Voltage Sag Study for a Practical Industrial Distribution Network. In Proceedings of the 2006 International Conference on Power System Technology, Chongqing, China, 22–26 October 2006; pp. 1–4. [Google Scholar]
- Janda, M.; Makki, Z.; Konicek, P. Calculation of the vibration induction motor using the finite element method. In Proceedings of the 16th International Conference on Mechatronics—Mechatronika 2014, Brno, Czech Republic, 3–5 December 2014; pp. 526–529. [Google Scholar]
- Electromagnetic Compatibility (EMC)Part 4–11: Testing and Measurement Electromagnetic Compatibility (EMC)Part 4–11: Testing and Measurement Techniques Voltage Dips, Short Interruptions and Voltage Variations Immunity Tests; IEC Standard 61000-4-11; International Electrotechnical Commission: London, UK, 2004.


| S.No | Dip | IR (A) | IY (A) | IB (A) | Transient Current | ||
|---|---|---|---|---|---|---|---|
| IR (A) | IY (A) | IB (A) | |||||
| 1 | 80% | 4.5 | 15.9 | 11.7 | 8 | 10.9 | 8.8 |
| 2 | 70% | 3.4 | 10.6 | 8.3 | 4 | 10.5 | 8.3 |
| 3 | 40% | 4.0 | 6.4 | 6.4 | 5.2 | 8.2 | 7.1 |
| S.No | Dip | IR (A) | IY (A) | IB (A) | Transient Current | ||
|---|---|---|---|---|---|---|---|
| IR (A) | IY (A) | IB (A) | |||||
| 1 | 80% | 4.6 | 9.7 | 8.0 | 7.0 | 7.0 | 7.0 |
| 2 | 70% | 4.0 | 11.3 | 8.8 | 7.3 | 8.3 | 7.6 |
| 3 | 40% | 4.7 | 16.9 | 12.4 | 7.8 | 15.2 | 11.4 |
| 3-Ph Induction Motor-DC Generator Unit Under Neutral Connection [Full Load Conditions] | |||||||
|---|---|---|---|---|---|---|---|
| S.No | Dip | Phase Currents | Transient Current | ||||
| IR (A) | IY (A) | IB (A) | IR (A) | IY (A) | IB (A) | ||
| 1 | 80% | 7.8 | 7.8 | 7.8 | 8.7 | 8.6 | 8.4 |
| 2 | 70% | 9.2 | 9 | 9 | 18.8 | 9.2 | 7.9 |
| 3 | 40% | 12.9 | 12.8 | 12.9 | 14.2 | 15.2 | 15.2 |
| 3-Ph Induction Motor-DC Generator Unit Under Neutral Connection [Full Load Conditions] | |||||||
|---|---|---|---|---|---|---|---|
| S.No | Dip | Phase Currents | Transient Current | ||||
| IR (A) | IY (A) | IB (A) | IR (A) | IY (A) | IB (A) | ||
| 1 | 80% | 2.5 | 2.5 | 2.5 | 4.4 | 4.4 | 4.1 |
| 2 | 70% | 2.3 | 2.3 | 2.3 | 4.7 | 4.6 | 4.3 |
| 3 | 40% | 1.4 | 1.4 | 1.9 | 7.4 | 6.9 | 5.9 |
| S.No | Dip | Line-Line Voltages | Phase Currents | Speed (rpm) | Weight S (Kg) | Torque T (N-m) | ||||
|---|---|---|---|---|---|---|---|---|---|---|
| VRY (V) | VYB (V) | VBR (V) | IR (A) | IY (A) | IB (A) | |||||
| 1 | 0% | 414 | 417 | 414 | 3.4 | 3.4 | 3.8 | 1498 | 0 | 0.00 |
| 2 | 410 | 415 | 410 | 3.2 | 3.2 | 3.7 | 1498 | 0 | 0.00 | |
| 3 | 415 | 416 | 414 | 3.5 | 3.3 | 3.6 | 1498 | 0 | 0.00 | |
| 4 | 415 | 416 | 413 | 3.7 | 3.5 | 3.7 | 1490 | 3.2 | 4.71 | |
| 5 | 413 | 414 | 411 | 4.1 | 4.1 | 4.2 | 1486 | 5.2 | 7.65 | |
| 6 | 413 | 414 | 412 | 4.3 | 4.3 | 4.4 | 1480 | 7.1 | 10.45 | |
| 7 | 413 | 414 | 411 | 5 | 4.8 | 5 | 1472 | 9.4 | 13.83 | |
| 8 | 412 | 414 | 410 | 5.3 | 5.3 | 5.5 | 1468 | 10.8 | 15.89 | |
| 9 | 40% | 249.1 | 249.1 | 247.3 | 1.5 | 1.3 | 1.5 | 1498 | 0 | 0.00 |
| 10 | 250 | 247 | 248.7 | 1.5 | 1.8 | 1.5 | 1496 | 0 | 0.00 | |
| 11 | 252 | 253 | 251 | 2 | 1.5 | 2.2 | 1486 | 2.6 | 3.83 | |
| 12 | 251.4 | 252.1 | 250.3 | 2.5 | 1.8 | 2.6 | 1478 | 3.6 | 5.30 | |
| 13 | 250.6 | 251.5 | 249.6 | 3.1 | 2.5 | 3.2 | 1470 | 4.5 | 6.62 | |
| 14 | 249.7 | 250.5 | 248.3 | 3.4 | 2.8 | 3.5 | 1464 | 4.8 | 7.06 | |
| 15 | 249.1 | 249.9 | 248.1 | 4 | 4.1 | 4.1 | 1454 | 5.5 | 8.09 | |
| 16 | 247.8 | 248.8 | 247.3 | 4.5 | 4.3 | 4.5 | 1442 | 7 | 10.30 | |
| 17 | 242.8 | 243.7 | 241.7 | 4.5 | 4.6 | 4.6 | 1436 | 7.1 | 10.45 | |
| 18 | 70% | 290 | 288 | 288 | 1.6 | 1.8 | 1.6 | 1498 | 0 | 0.00 |
| 19 | 290.3 | 289.7 | 287.7 | 1.8 | 1.6 | 1.8 | 1497 | 0 | 0.00 | |
| 20 | 288.6 | 289.1 | 286.6 | 2 | 1.2 | 2 | 1492 | 2.1 | 3.09 | |
| 21 | 287.8 | 286.9 | 285.9 | 2.5 | 1.6 | 2.6 | 1484 | 3.2 | 4.71 | |
| 22 | 286.7 | 285.7 | 284.5 | 2.8 | 2.3 | 2.7 | 1476 | 4.3 | 6.33 | |
| 23 | 285.9 | 285.4 | 284.2 | 3.5 | 3.1 | 3.5 | 1466 | 5.9 | 8.68 | |
| 24 | 285 | 284.6 | 283.4 | 3.4 | 3.6 | 3.8 | 1458 | 6.9 | 10.15 | |
| 25 | 283.7 | 283.8 | 282 | 4.6 | 4.6 | 4.6 | 1454 | 7.8 | 11.48 | |
| 26 | 80% | 331.6 | 331 | 331 | 2.1 | 2 | 2.3 | 1498 | 0 | 0.00 |
| 27 | 331 | 330 | 328.3 | 2.2 | 1.5 | 2.2 | 1496 | 0 | 0.00 | |
| 28 | 330.4 | 329.5 | 328.1 | 2.4 | 1.6 | 2.3 | 1492 | 1.7 | 2.50 | |
| 29 | 329.3 | 328.8 | 327 | 2.8 | 2.1 | 2.6 | 1488 | 2.9 | 4.27 | |
| 30 | 328.8 | 328.5 | 326.4 | 2.7 | 2.5 | 2.7 | 1486 | 3.4 | 5.00 | |
| 31 | 328.2 | 327.5 | 325.7 | 3.4 | 3 | 3.3 | 1480 | 4.7 | 6.92 | |
| 32 | 327.4 | 327.4 | 325.2 | 3.7 | 3.5 | 3.7 | 1476 | 5.4 | 7.95 | |
| 33 | 326.8 | 326.8 | 324.4 | 3.8 | 3.7 | 3.8 | 1468 | 6.6 | 9.71 | |
| S.No | Dip | Line-Line Voltages | Phase Currents | Speed (rpm) | Weight S (Kg) | Torque T(N-m) | ||||
|---|---|---|---|---|---|---|---|---|---|---|
| VRY (V) | VYB (V) | VBR (V) | IR (A) | IY (A) | IB (A) | |||||
| 1 | 0% | 415 | 417 | 414 | 0.4 | 0.5 | 0.5 | 1498 | 0 | 0.00 |
| 2 | 414 | 416 | 412 | 0.7 | 0.7 | 0.7 | 1484 | 2.5 | 3.68 | |
| 3 | 414 | 415 | 412 | 1.7 | 0.6 | 1.6 | 1472 | 4.2 | 6.18 | |
| 4 | 413 | 414 | 411 | 2.2 | 1.5 | 2.2 | 1456 | 6 | 8.83 | |
| 5 | 412 | 414 | 412 | 2.8 | 2.4 | 2.4 | 1432 | 7.2 | 10.59 | |
| 6 | 411 | 413 | 410 | 3.8 | 3.6 | 4.1 | 1398 | 9.4 | 13.83 | |
| 7 | 411 | 413 | 411 | 4.7 | 4.7 | 4.7 | 1380 | 10.3 | 15.16 | |
| 8 | 409 | 412 | 409 | 5.4 | 5.1 | 5.5 | 1324 | 11.6 | 17.07 | |
| 9 | 408 | 411 | 408 | 5.9 | 5.6 | 6.1 | 1286 | 12.6 | 18.54 | |
| 10 | 40% | 249 | 248.7 | 247.5 | 0.2 | 0.1 | 0.1 | 1494 | 0 | 0.00 |
| 11 | 246.7 | 245.9 | 245.2 | 1.4 | 0.4 | 1.2 | 1450 | 2.4 | 3.53 | |
| 12 | 246.1 | 245.1 | 244.4 | 1.6 | 1.5 | 1.6 | 1432 | 3 | 4.41 | |
| 13 | 247 | 246.7 | 245 | 1.9 | 1.5 | 1.6 | 1432 | 2.8 | 4.12 | |
| 14 | 70% | 289.5 | 289.7 | 287.5 | 0.1 | 0.1 | 0 | 1496 | 0 | 0.00 |
| 15 | 288.1 | 288.7 | 286.7 | 0.5 | 0.4 | 0.6 | 1468 | 2 | 2.94 | |
| 16 | 288.3 | 288.9 | 287.2 | 0.6 | 0.4 | 0.3 | 1462 | 2.6 | 3.83 | |
| 17 | 286.7 | 286.4 | 284.8 | 1.4 | 1.5 | 1.4 | 1456 | 2.8 | 4.12 | |
| 18 | 80% | 332 | 331.9 | 330.4 | 0.4 | 0.1 | 0.4 | 1498 | 0 | 0.00 |
| 19 | 330.6 | 331.2 | 329.6 | 1.2 | 0.2 | 0.6 | 1472 | 2.8 | 4.12 | |
| 20 | 330.3 | 330.8 | 328 | 1.5 | 0.4 | 1.5 | 1466 | 3 | 4.41 | |
| 21 | 329.5 | 331.1 | 329.7 | 1.5 | 0.4 | 1.5 | 1464 | 3.2 | 4.71 | |
| S.No | Dip | Line-Line Voltages | Phase Currents | Speed (rpm) | Weight S (Kg) | Torque T (N-m) | ||||
|---|---|---|---|---|---|---|---|---|---|---|
| VRY (V) | VYB (V) | VBR (V) | IR (A) | IY (A) | IB (A) | |||||
| 1 | 0% | 415 | 418 | 415 | 0.25 | 0.25 | 0.25 | 1494 | 0 | 0.00 |
| 2 | 414 | 417 | 415 | 0.5 | 0.3 | 0.6 | 1486 | 1.6 | 2.35 | |
| 3 | 414 | 417 | 415 | 0.6 | 0.6 | 0.6 | 1480 | 2.8 | 4.12 | |
| 4 | 413 | 417 | 414 | 0.6 | 0.6 | 0.5 | 1478 | 3 | 4.41 | |
| 5 | 415 | 419 | 415 | 1.5 | 1.4 | 1.5 | 1472 | 3.2 | 4.71 | |
| 6 | 40% | 249 | 249.5 | 247.6 | 0 | 0 | 0 | 1492 | 0 | 0.00 |
| 7 | 248.1 | 248.7 | 246.8 | 0.3 | 0.3 | 0.3 | 1474 | 1.2 | 1.77 | |
| 8 | 248.3 | 249.7 | 246.9 | 0.5 | 0.5 | 0.5 | 1464 | 1.6 | 2.35 | |
| 9 | 248 | 249.9 | 246.6 | 0.8 | 0.8 | 0.8 | 1462 | 1.8 | 2.65 | |
| 10 | 247.8 | 248.6 | 246.7 | 1 | 1 | 1 | 1458 | 2 | 2.94 | |
| 11 | 248 | 248.9 | 246.5 | 1.1 | 1.1 | 1.1 | 1454 | 2.1 | 3.09 | |
| 12 | 70% | 290.4 | 291.7 | 288.1 | 0 | 0 | 0 | 1494 | 0 | 0.00 |
| 13 | 289.2 | 290.4 | 286.6 | 0.2 | 0.2 | 0.2 | 1480 | 1.2 | 1.77 | |
| 14 | 289.2 | 291.4 | 287.9 | 0.5 | 0.5 | 0.5 | 1472 | 1.6 | 2.35 | |
| 15 | 289.2 | 291.1 | 287.6 | 0.7 | 0.7 | 0.7 | 1470 | 1.9 | 2.80 | |
| 16 | 288.7 | 291.2 | 287.7 | 0.8 | 0.8 | 0.8 | 1466 | 2 | 2.94 | |
| 17 | 287.6 | 290.3 | 287.2 | 1 | 0.9 | 1 | 1546 | 2 | 2.94 | |
| 18 | 80% | 332 | 333.6 | 329.3 | 0.4 | 1 | 0.5 | 1492 | 0 | 0.00 |
| 19 | 331 | 331.6 | 328.8 | 0.5 | 0.6 | 0.5 | 1478 | 1.7 | 2.50 | |
| 20 | 330.1 | 331.3 | 328 | 0.6 | 0.6 | 0.6 | 1472 | 2 | 2.94 | |
| 21 | 328.9 | 330.3 | 328.1 | 0.8 | 0.8 | 0.8 | 1470 | 2.2 | 3.24 | |
| 22 | 330 | 331 | 328.3 | 1 | 1 | 1.2 | 1466 | 2.4 | 3.53 | |
Publisher’s Note: MDPI stays neutral with regard to jurisdictional claims in published maps and institutional affiliations. |
© 2021 by the authors. Licensee MDPI, Basel, Switzerland. This article is an open access article distributed under the terms and conditions of the Creative Commons Attribution (CC BY) license (https://creativecommons.org/licenses/by/4.0/).
Share and Cite
Bandla, P.B.; Vairavasundaram, I.; Teekaraman, Y.; Kuppusamy, R.; Nikolovski, S. Real Time Sustainable Power Quality Analysis of Non-Linear Load under Symmetrical Conditions. Energies 2022, 15, 57. https://doi.org/10.3390/en15010057
Bandla PB, Vairavasundaram I, Teekaraman Y, Kuppusamy R, Nikolovski S. Real Time Sustainable Power Quality Analysis of Non-Linear Load under Symmetrical Conditions. Energies. 2022; 15(1):57. https://doi.org/10.3390/en15010057
Chicago/Turabian StyleBandla, Pavan Babu, Indragandhi Vairavasundaram, Yuvaraja Teekaraman, Ramya Kuppusamy, and Srete Nikolovski. 2022. "Real Time Sustainable Power Quality Analysis of Non-Linear Load under Symmetrical Conditions" Energies 15, no. 1: 57. https://doi.org/10.3390/en15010057
APA StyleBandla, P. B., Vairavasundaram, I., Teekaraman, Y., Kuppusamy, R., & Nikolovski, S. (2022). Real Time Sustainable Power Quality Analysis of Non-Linear Load under Symmetrical Conditions. Energies, 15(1), 57. https://doi.org/10.3390/en15010057