Article

Performance Investigation Based on Vital Factors of Agricultural Feeder Supported by Solar Photovoltaic Power Plant †

Department of Electrical Engineering, Yeshwantrao Chavan College of Engineering, Nagpur 441110, India
*
Author to whom correspondence should be addressed.
This paper is an extended version of our paper published in 2021 IEEE International Conference on Electrical, Computer, Communications and Mechatronics Engineering (ICECCME 2021), Mauritius, 7–8 October 2021; pp. 1–7.
Energies 2022, 15(1), 75; https://doi.org/10.3390/en15010075
Submission received: 24 November 2021 / Revised: 17 December 2021 / Accepted: 20 December 2021 / Published: 23 December 2021

Abstract

:
Solar photovoltaic (SPV) installations are growing in the distribution network due to the continuously decreasing prices of solar photovoltaic panels. Installing the SPV Plant on the distribution feeder supplying to the agricultural pumps is a challenging task due to the varying agricultural load pattern of the Agricultural Feeder (AG Feeder). Supply of power and demand creates potential challenges in the low voltage (LV) distribution system. This paper presents a case study of a 2 MW SPV connected to an agricultural feeder in India. Performance analysis has been carried out using field measurement data. The key parameters such as PV Penetration and Capacity Utilization Factor (CUF) are calculated for analysis. Parameters such as Grid Dependency of the load and PV Contribution have been introduced in this paper, which relates to the SPV system behavior more aptly. It is recommended that the Time of Day (ToD) metering with the lowest cost during the solar generation hours will make agricultural consumers shift their demand matching with solar generation hours. Extensive analysis of agricultural feeder connected SPV power plant indicates that the power supply has improved for the feeder during winter and summer months.

1. Introduction

The main economic activity in India is agriculture, and there is a significant area covered by fertile land. In addition, it is a densely populated country and needs large-scale production of food grains. India also receives clear solar radiation for around 300 days. Hence, solar energy and farming are a winning combination. The SPV systems are preferred in powering agricultural load [1], and it has been an essential driver for the ‘Green Revolution’ to increase the productivity of the farm.
In India, in order to promote the agricultural sector, the Ministry of New and Renewable Energy Sources (MNRE) has started the Pradhan Mantri Kisan Urja Suraksha evam Utthan Mahabhiyam (PM-KUSUM) for the development of farmers and for strengthening the rural distribution network. The scheme aims to promote the usage of solar pumps and grid-connected solar power in the agricultural sector. Through PM-KUSUM policy, the Gujarat state in India has announced the Suryashakti Kisan Yojna (SKY) scheme. Under SKY, farmers can install a net–metering SPV powered irrigation pump sets on the fields. This scheme offers several benefits to the farmers, such as well-planned use of water, increased crop cultivation due to the availability of power during the daytime, an additional source of income for the farmers, which results in an improved economy in rural areas [2].
It is very well known that the RES penetration in the LV distribution network has a positive impact, such as reducing the energy losses of distribution feeders, feeding peak energy demands, and providing voltage support to distribution feeders. However, the exponential increase in RES installations over a widespread area of LV distribution may have a negative impact in the form of power quality issues, stability, and protection challenges.
Government of India (GoI) policy initiatives has significantly improved the number of grid-connected SPV systems in LV distribution systems in India. Thus it is of vital importance to realize the technical influence of high penetration levels of SPV systems on the operating performance of these networks. A significant number of research papers that have already been published recognize the possible challenges and effects of integration of distributed generation in LV distribution systems. The researchers have analyzed the power quality impact on LV distribution networks with high penetration levels of SPV by considering real-time case studies.
This paper mainly focuses on, SPV connected AG feeder performance analysis based on the selected site credentials. Feeders are separated to supply electricity to agricultural and non-agricultural consumers at the site. This feeder separation makes a provision to offer a planned power supply to the AG feeder. AG feeder being connected to SPV plant reduces the dependency of AG feeder on Grid supply during the daytime as most of the power is provided by the SPV plant. Therefore, it is decided to analyze the performance of a 2 MW SPV plant. For appropriate analysis, new terms such as ‘Grid Dependency’ and ‘PV Contribution’ have been introduced in this paper. System performance has also been checked via PV Penetration and CUF factors.
The performance analysis of the solar photovoltaic (SPV) system installed at Sagardeep Island in the West Bengal state of India is reported in [3]. The technical and commercial factors of the system were analyzed in this literature, focusing on the effects of SPV installations on social life.
The significance of a grid-connected PV system concerning the erratic nature of renewable generation and the categorization of PV generation pertaining to grid code compliance is investigated and highlighted in [4].
A case study of a distribution feeder is presented in [5], which provides a traditional capacity penetration level of 47% and perhaps more. In addition, it defines PV penetration as “the rated power output of the aggregate PV systems on a distribution circuit segment divided by the peak load of that circuit segment”.
In [6], the significant factors obstructing the growth of renewable energy in India are reported. This study shows that though the status of renewable energy sources, particularly solar and wind systems, is acceptable in India, further attention for enhancing renewable energy sources is necessary.
The methodology for determining the maximum photovoltaic penetration level in the grid is mentioned in [7]. The authors have analyzed the different scenarios of PV penetration levels and extracted the reasons responsible for limiting the PV penetration. It has been mentioned that PV generation is maximum in summer due to irradiation, and selected a summer day to obtain peak PV penetration for the grid.
The voltage quality issues caused due to PV systems integration and their operating characteristics have been analyzed in the paper [8]. The study has been carried out on the real grid-connected PV system located at the University of Queensland (UQ), St. Lucia campus. The collected data has been analyzed for voltage rise, fluctuations, and flickers.
A study that assesses the ability of grid-connected wind and solar resources for the regional power grid of India is presented in [9]. This study concluded that the southern grid has the most potential for renewable energy, followed by the western, eastern, and northeastern grids.
A broad overview of significant problems affecting the distribution system due to PV penetration is illustrated in [10,11]. These papers also discuss relevant issues such as voltage fluctuation, voltage rise, voltage balance, and harmonics and their effect on the system in detail.
The case study and performance comparison of two different solar power plants of 1 MW based on one crucial parameter, Performance Ratio, are explained in [12]. The plants are located at Fatehgarh and Bap (Rajasthan). The authors have discussed a vital performance parameter, ‘Performance Ratio (P.R.) ‘. The authors have inferred that an uncertain rise of the performance ratio to 95% may be possible by detailed analysis.
The effects of connecting a PV system to the grid through simulation of the system in RSCSD software are depicted in [13]. The monthly Performance Ratio was estimated for a PV system connected to a grid at a specific location in India.
The literature review focused on limits of PV penetration due to the voltage variations in LV networks, and Medium Voltage (MV) networks is explained in [14]. The review further revealed that in contrast to the MV level network, voltage violations in the LV network can be avoided even at high penetration levels in certain conditions. High PV integration in the LV distribution network is acceptable without significant changes in the system parameters.
An agricultural system with integrated renewable energy sources for adequate irrigation to improve the overall efficiency of crops is presented in [15]. The paper contributes to verifying and analyzing the technical and economic viability of an agricultural setup consisting of renewable energy sources integrated with an effective irrigation system to strengthen crop cultivation.
Assessment of solar power potential of Silchar (Assam, India) and to perform a feasibility study for the installation of a solar-based power plant is carried out by using an anisotropic sky model in [16]. This radiation data has been used to evaluate the PV power output.
An investigation of power quality characteristics of an urban LV distribution network with high PV penetration levels in Sri Lanka is presented in [17]. The authors also have validated the effects on power flows and voltages of the LV network using field measurements.
A case study based on the analysis of the low-voltage, rural distribution system of Santana da Vargem is discussed in [18].
The solar PV plant of 10 KWp for Shree Samarth Agro-Tech Foundation located in Solapur District of Maharashtra State, India, is presented in [19]. Detailed performance analysis of the proposed system has been carried out using the PVsyst simulation tool.
The survey of the impact of rooftop PV panels on the distribution system is discussed in [20]. The paper incorporates rooftop PV’s effect on voltage quality, power losses, and the working of other voltage regulating devices.
In this paper, Section 2 represents the role of RES, particularly PV, in the agricultural sector in India, giving an insight into the PM-KUSUM policy. A detailed case study of a 2 MW SPV power plant connected to an 11 kV LV Distribution network at Manjarda in Yavatmal district in the Maharashtra state of India is presented in Section 3, and the comprehensive analysis of the collected data has been carried out in Section 4. In addition, two performance parameters, Grid Dependency and PV Contribution are proposed, and the system behavior is analyzed using two existing factors, CUF and PV penetration. Conclusions have been drawn in Section 5.

2. Role of PV in the Agricultural Sector of India

By replacing traditional water pumps with solar water pumps, India can attain 100 GW solar energy by 2022. Grid-connected, net-metred solar pumps are essential in providing secondary income to farmers by giving them access to quality power for irrigation. In India, till now, there have been many success stories of solar powered systems such as solar powered drip irrigation. Solar powered drip irrigation technology has been introduced in the Gosaba Island situated in the Sunderbans region of West Bengal in India under the ‘Cropping System Intensification in the Salt-affected Coastal Zones’ CSISCZ project [21,22]. This solar-powered drip irrigation technology was more beneficial for farmers. There was 20–30% extra yield, 40–60% irrigation water, 40% saving of labor, and growth in the cropping intensity up to 300% than the old practices.
PM-KUSUM policy was launched on 8 March 2019 [23], with a target to install 25,750 MW solar capacities by 2022 with the financial support of Rs. 34,422 crore from the central government. For the financial year of 2020–2021, the ministry of finance has sanctioned 20 lakh farmers to set up standalone solar pumps and permitted 15 lakh farmers to solarize grid-connected agricultural pumps. An addition of 10–15 GW installed capacity is expected if this scheme is successful. It is proposed that farmers use dry/uncultivable land for 25 years for this project. To use cultivable land, a developer must ensure that farmers continue growing crops by installing the plant above minimum height. These installations may supply the daytime load. It is a win-win situation for farmers and the Distribution Company (DISCOM) by achieving a reduction in diesel cost for farmers. Reduction in rural load and achieving Renewable Procurement Obligations (RPO) targets benefit DISCOM.

3. A Detailed Case Study

The 2 MW SPV Power plant in Manjarda, Yavatmal, Maharashtra, India, has been identified for analysis. The plant was commissioned on 24 August 2018 and has been installed according to the guidelines given by the Central Electricity Authority (CEA) of India. Two separate feeders are set as per the feeder separation scheme under Demand Side Management (DSM) schemes by [24]. One feeder is for Gaothan (village lighting and other purposes with 24 × 7 power supply to all consumers) and another for AG feeder to provide 8–10 h of power supply. The primary purpose of installing this SPV power plant is to supply power during the daytime to agricultural pumps during the winter and summer seasons to fulfill the necessity for a high-quality day-time power supply. SPV power plant decreases agricultural power consumption from the grid and increases electrical energy access to farmers. Moreover, due to feeder separation, there is a provision of electricity to agricultural pumps at off-peak hours when electricity demand from other consumers is low, which helps in load management.

3.1. Need for Feeder Separation

Feeder separation becomes the most popular solution to supply electricity to agricultural and non-agricultural consumers (domestic and non-domestic) separately through dedicated feeders. Feeder separation offers planned supply to farming consumers and continuous supply to non-agricultural consumers in rural areas. It helps better load control and improved power supply to farm and non-farm consumers. According to a study conducted by the World Bank in 2014, before feeder separation, more than 80% of consumers in Rajasthan and Gujarat, India suffered from low voltage problems; this reduced to 6% after feeder separation. The rise in electricity supply via feeder separation has also led to socio-economic welfare, including job creation and improved quality of life.
Based on the collected data from the plant, Table 1 represents the site credentials; Table 2 mentions the technical description of the plant. According to the Central Electricity Authority (Technical Standards for Connectivity to the Grid) [25], in the Solar Photovoltaic generating station, each inverter and associated modules will be reckoned as a separate generating unit.
Figure 1 depicts a single line diagram of 33 kV/11 kV Kolambi Substation and a 2 MW Solar Plant at Village Manjarda. The 33 kV Kolambi substation feeds power to three 11 kV feeders; two Gaothan feeders, namely Akola Bazar, and Kolambi and one AG feeder for Akola Bazar through 5 MVA Power Transformer. The generated SPV power is supplied to an 11 kV Akola Bazar AG feeder, and surplus solar energy is then exported to two 11 kV Gaothan feeders.
In case of electricity failure, breakdown, or fault in the feeder, the back-feed arrangement is provided in Figure 1. It depicts that the feeder line is disconnected via AB switch during the defect, breakdown, or supply failure. It detaches a portion of the AG feeder from the 2 MW solar power plant. In such cases, a 2 MW SPV plant will supply the generated solar power to 11 kV Talani AG Feeder to avoid the wastage of generated energy. As soon as the fault clears, solar power is fed back to the AG feeder by closing the AB switch and disconnecting the 11 kV Talani AG Feeder from the 2 MW solar power plant, as depicted in Figure 1.
Feeder details of the Akola Bazar AG feeder and two Gaothan feeders are presented in Table 3.

3.2. Load Details

The Solar power generation point and injection point is Manjarda (Kolambi Substation). The distance between the generation point and injection point is approximately 1.5 km. A 5 MVA transformer has been used to which three outgoing feeders are connected; one AG feeder and two Gaothan feeders. Total 1277 consumers, approximately 3.87 KW, all related to 11 kV Akola Bazar AG feeder. Among them, 1250 are only agricultural pumps of 4935 KW (6616 HP), and the remaining 27 are based on agricultural processes (15.7 KW) having some additional load. The total load connected to the 11 kV Akola Bazar AG feeder is 4.95 MW.

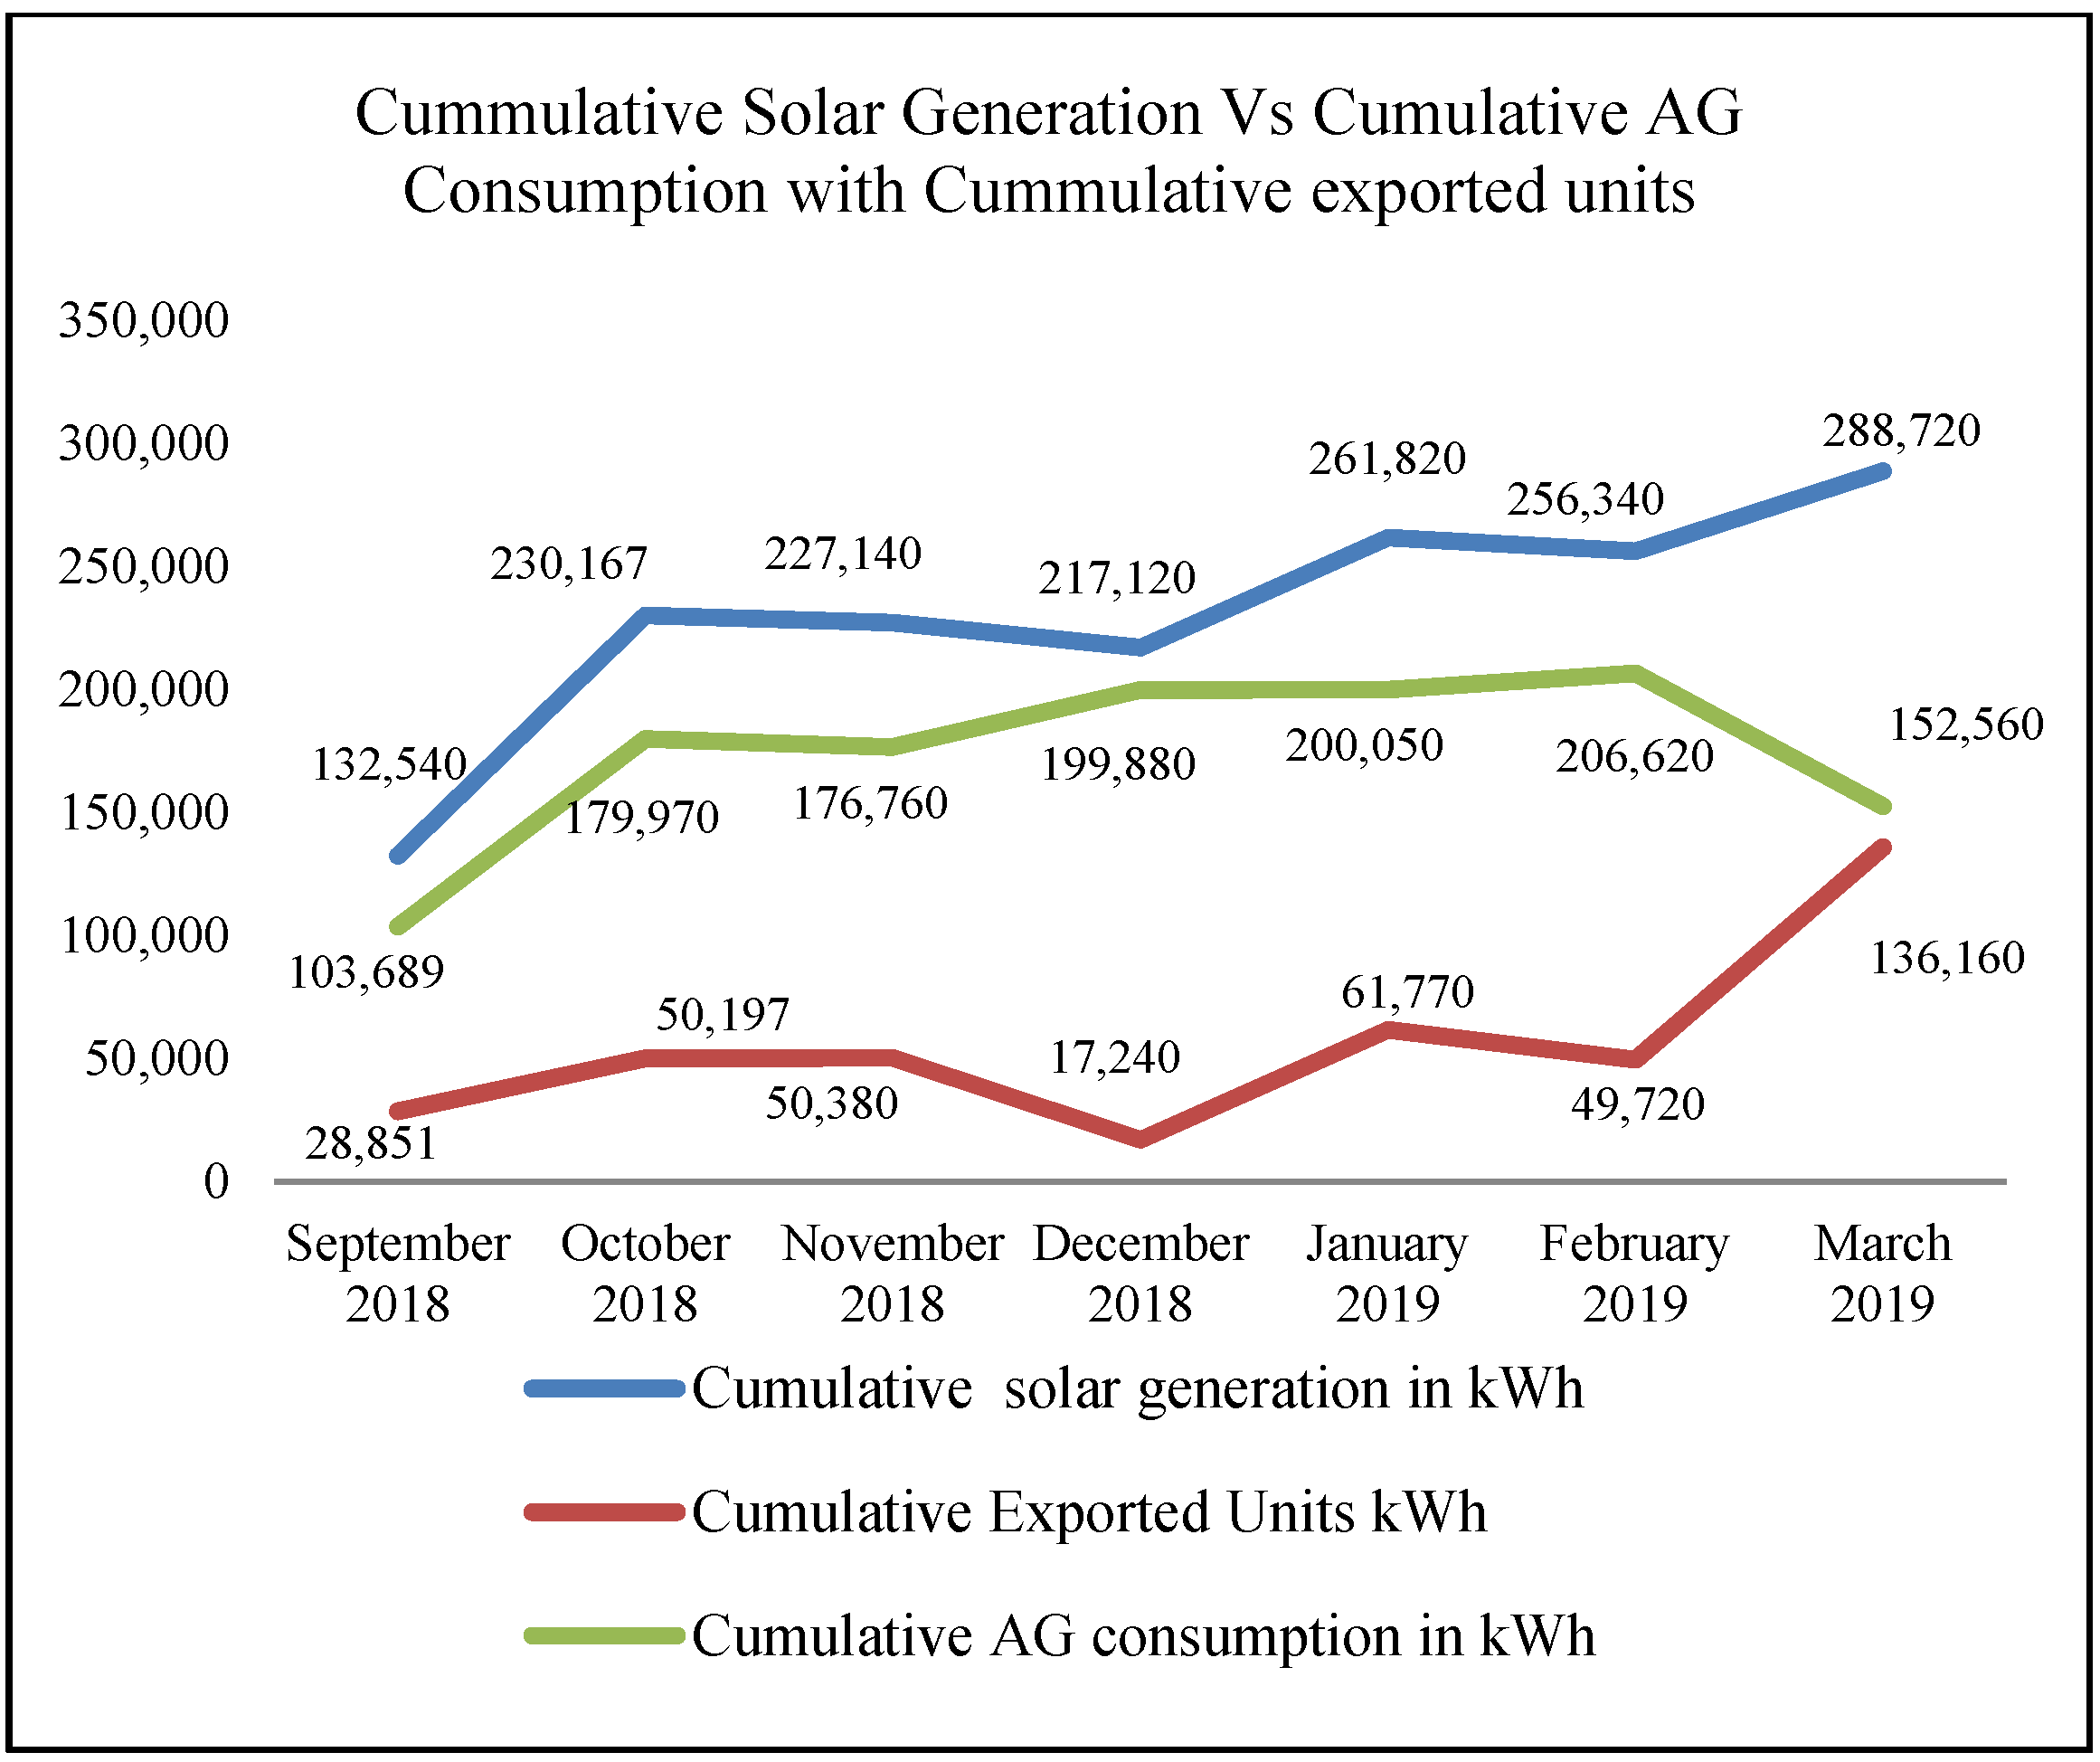
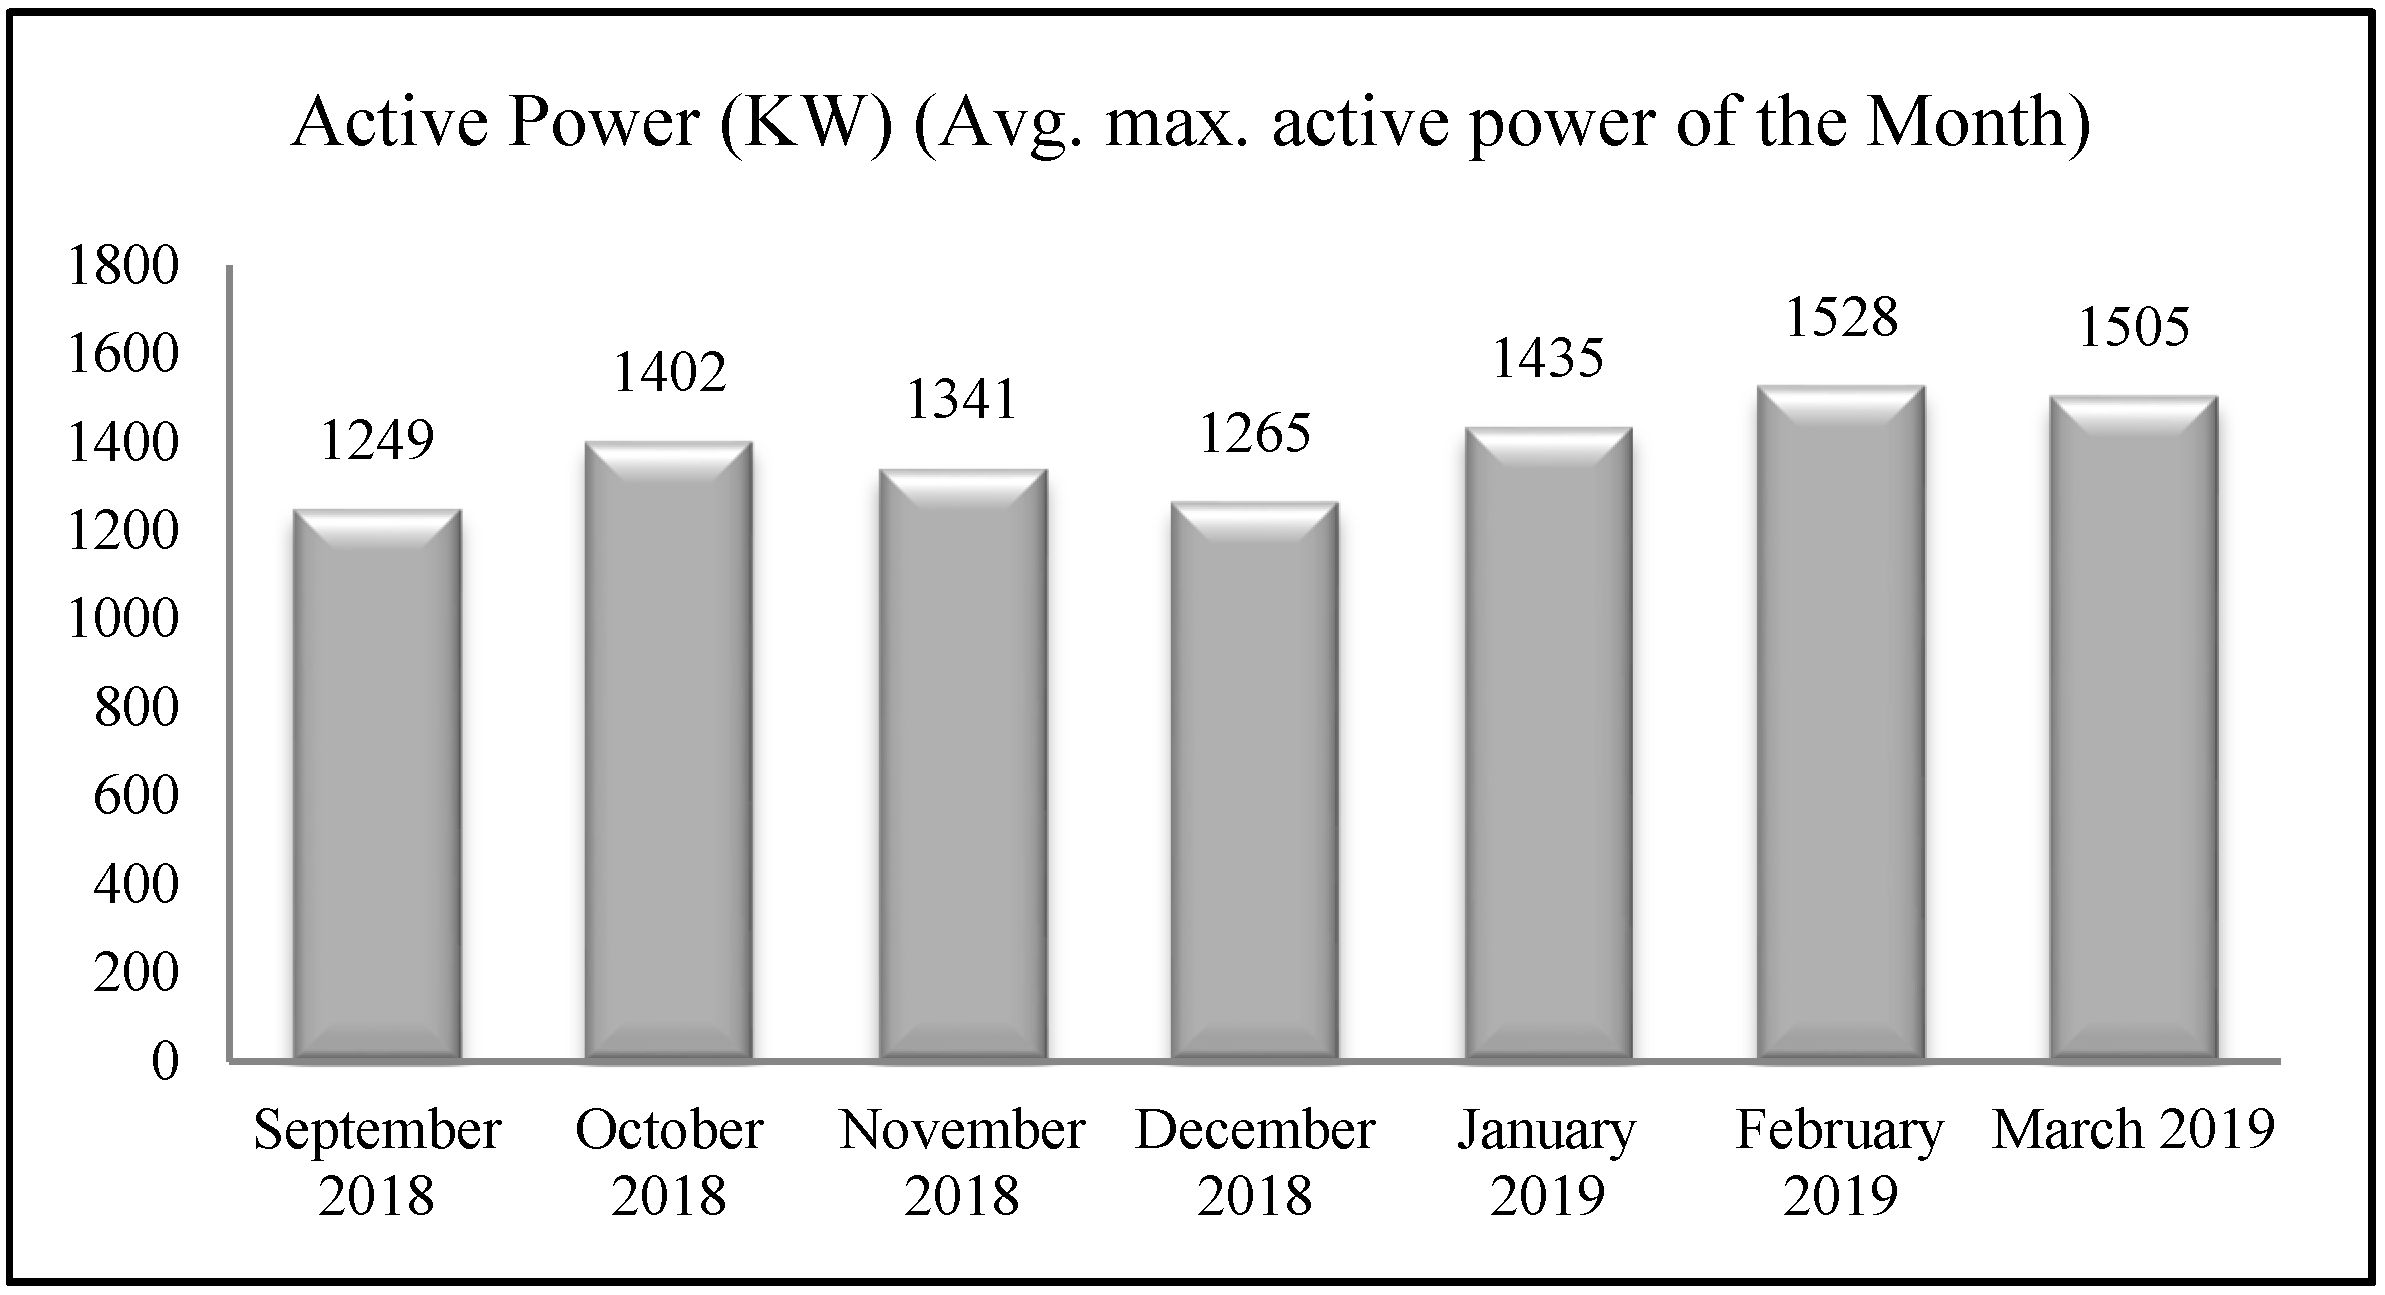
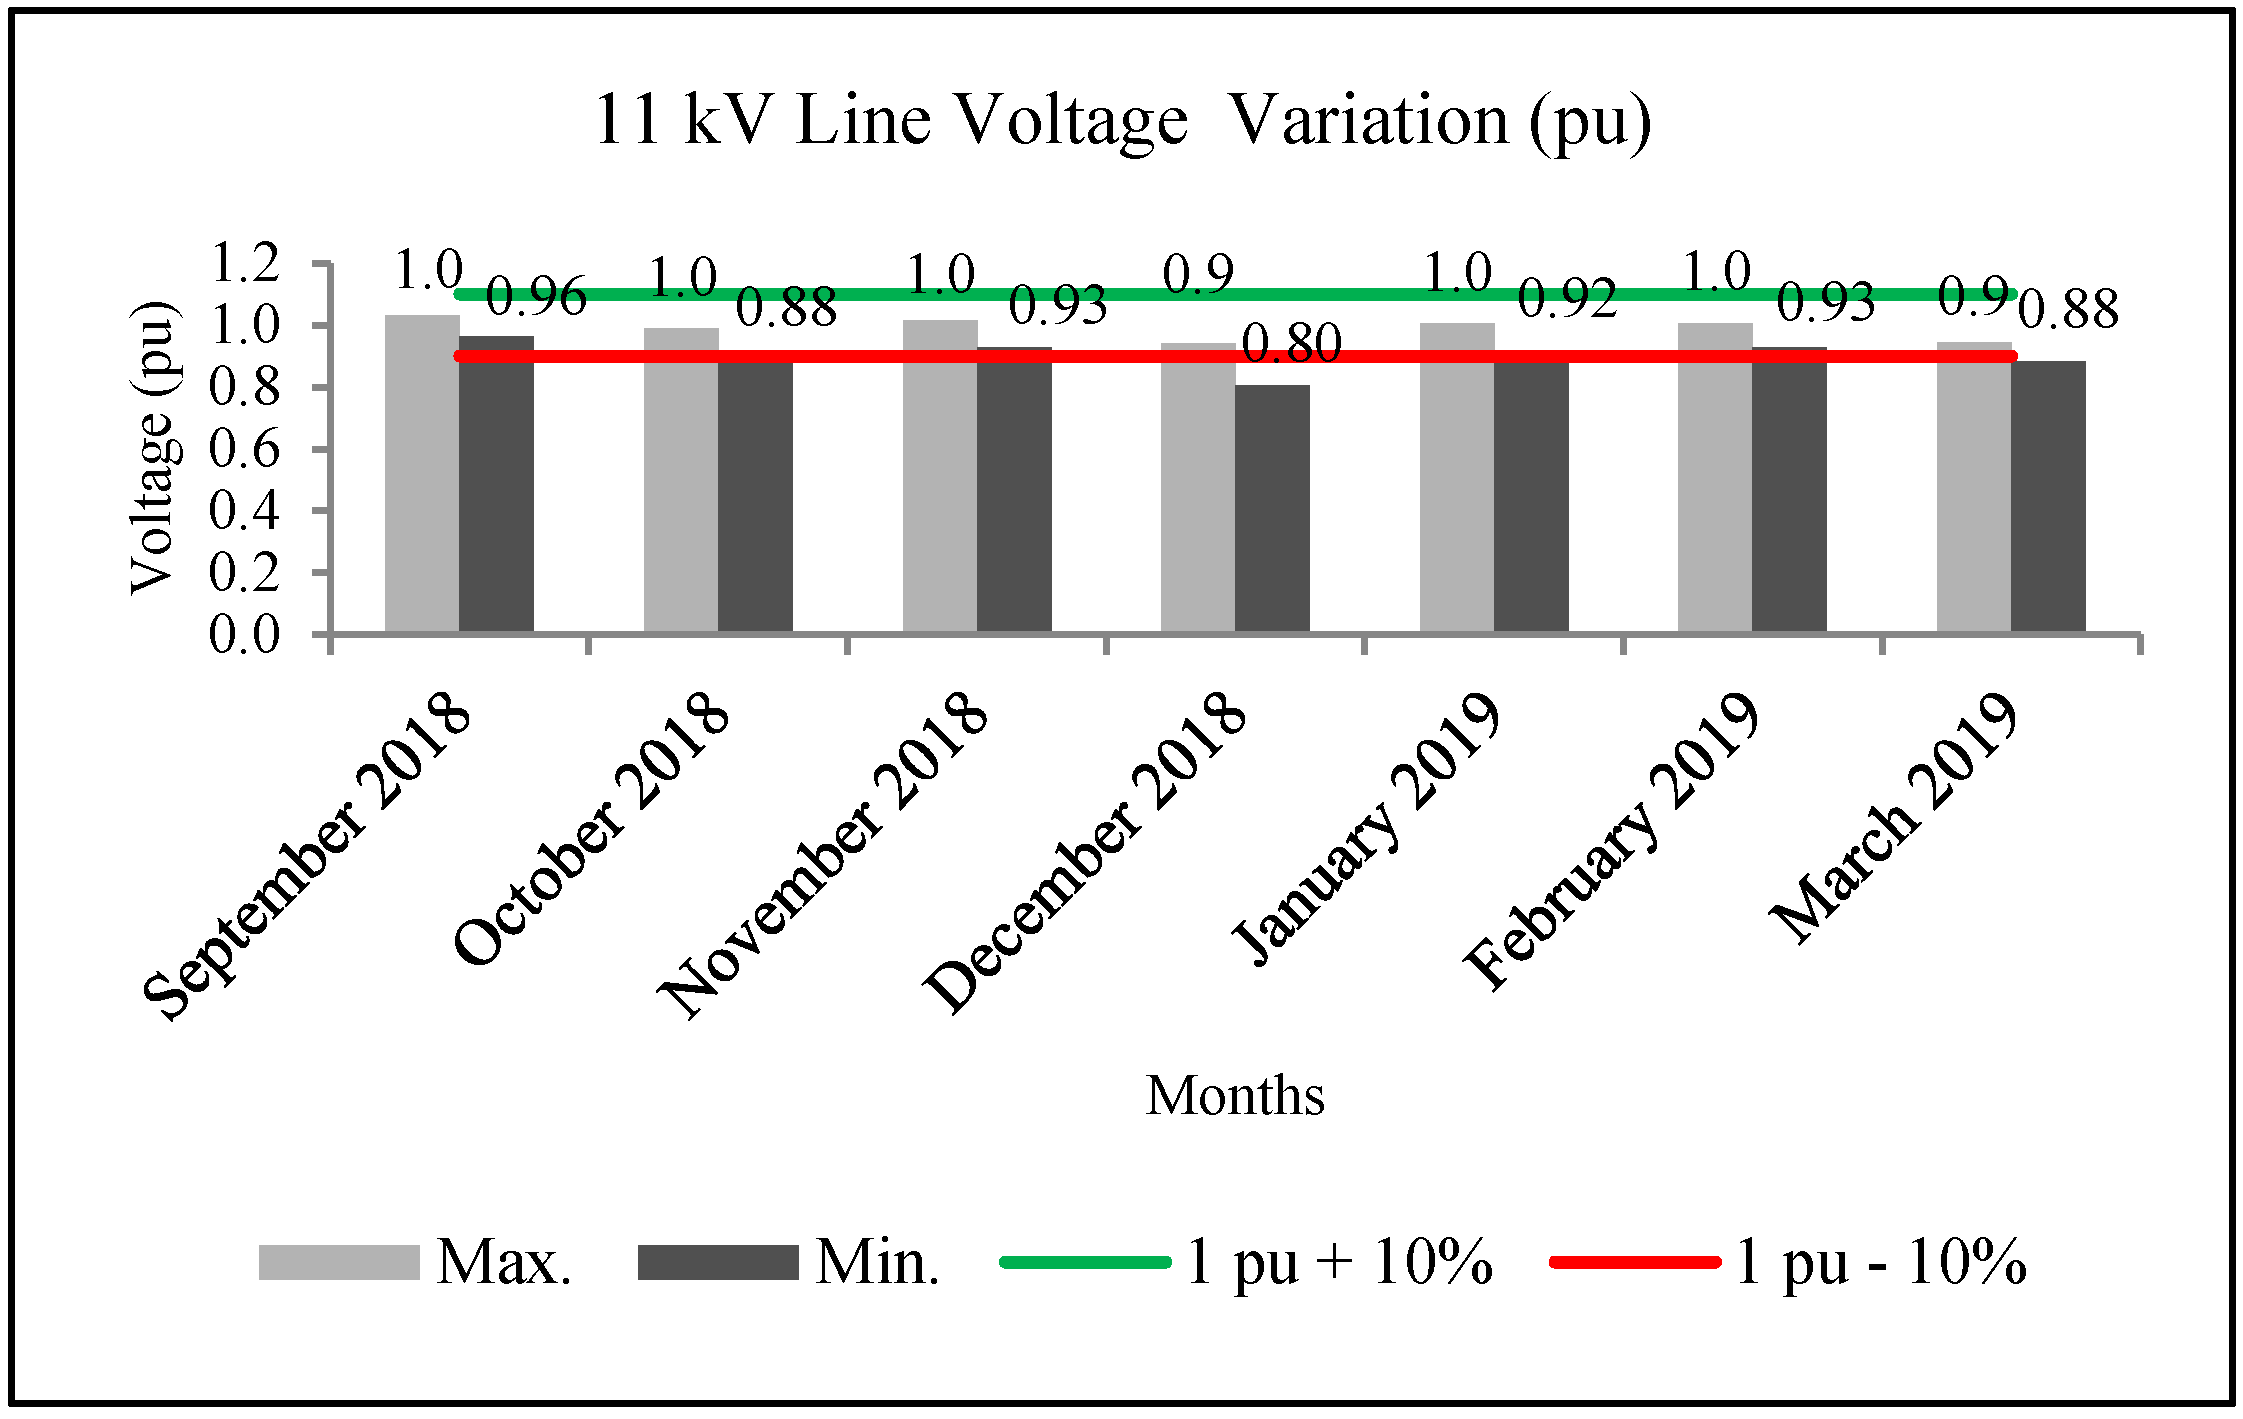
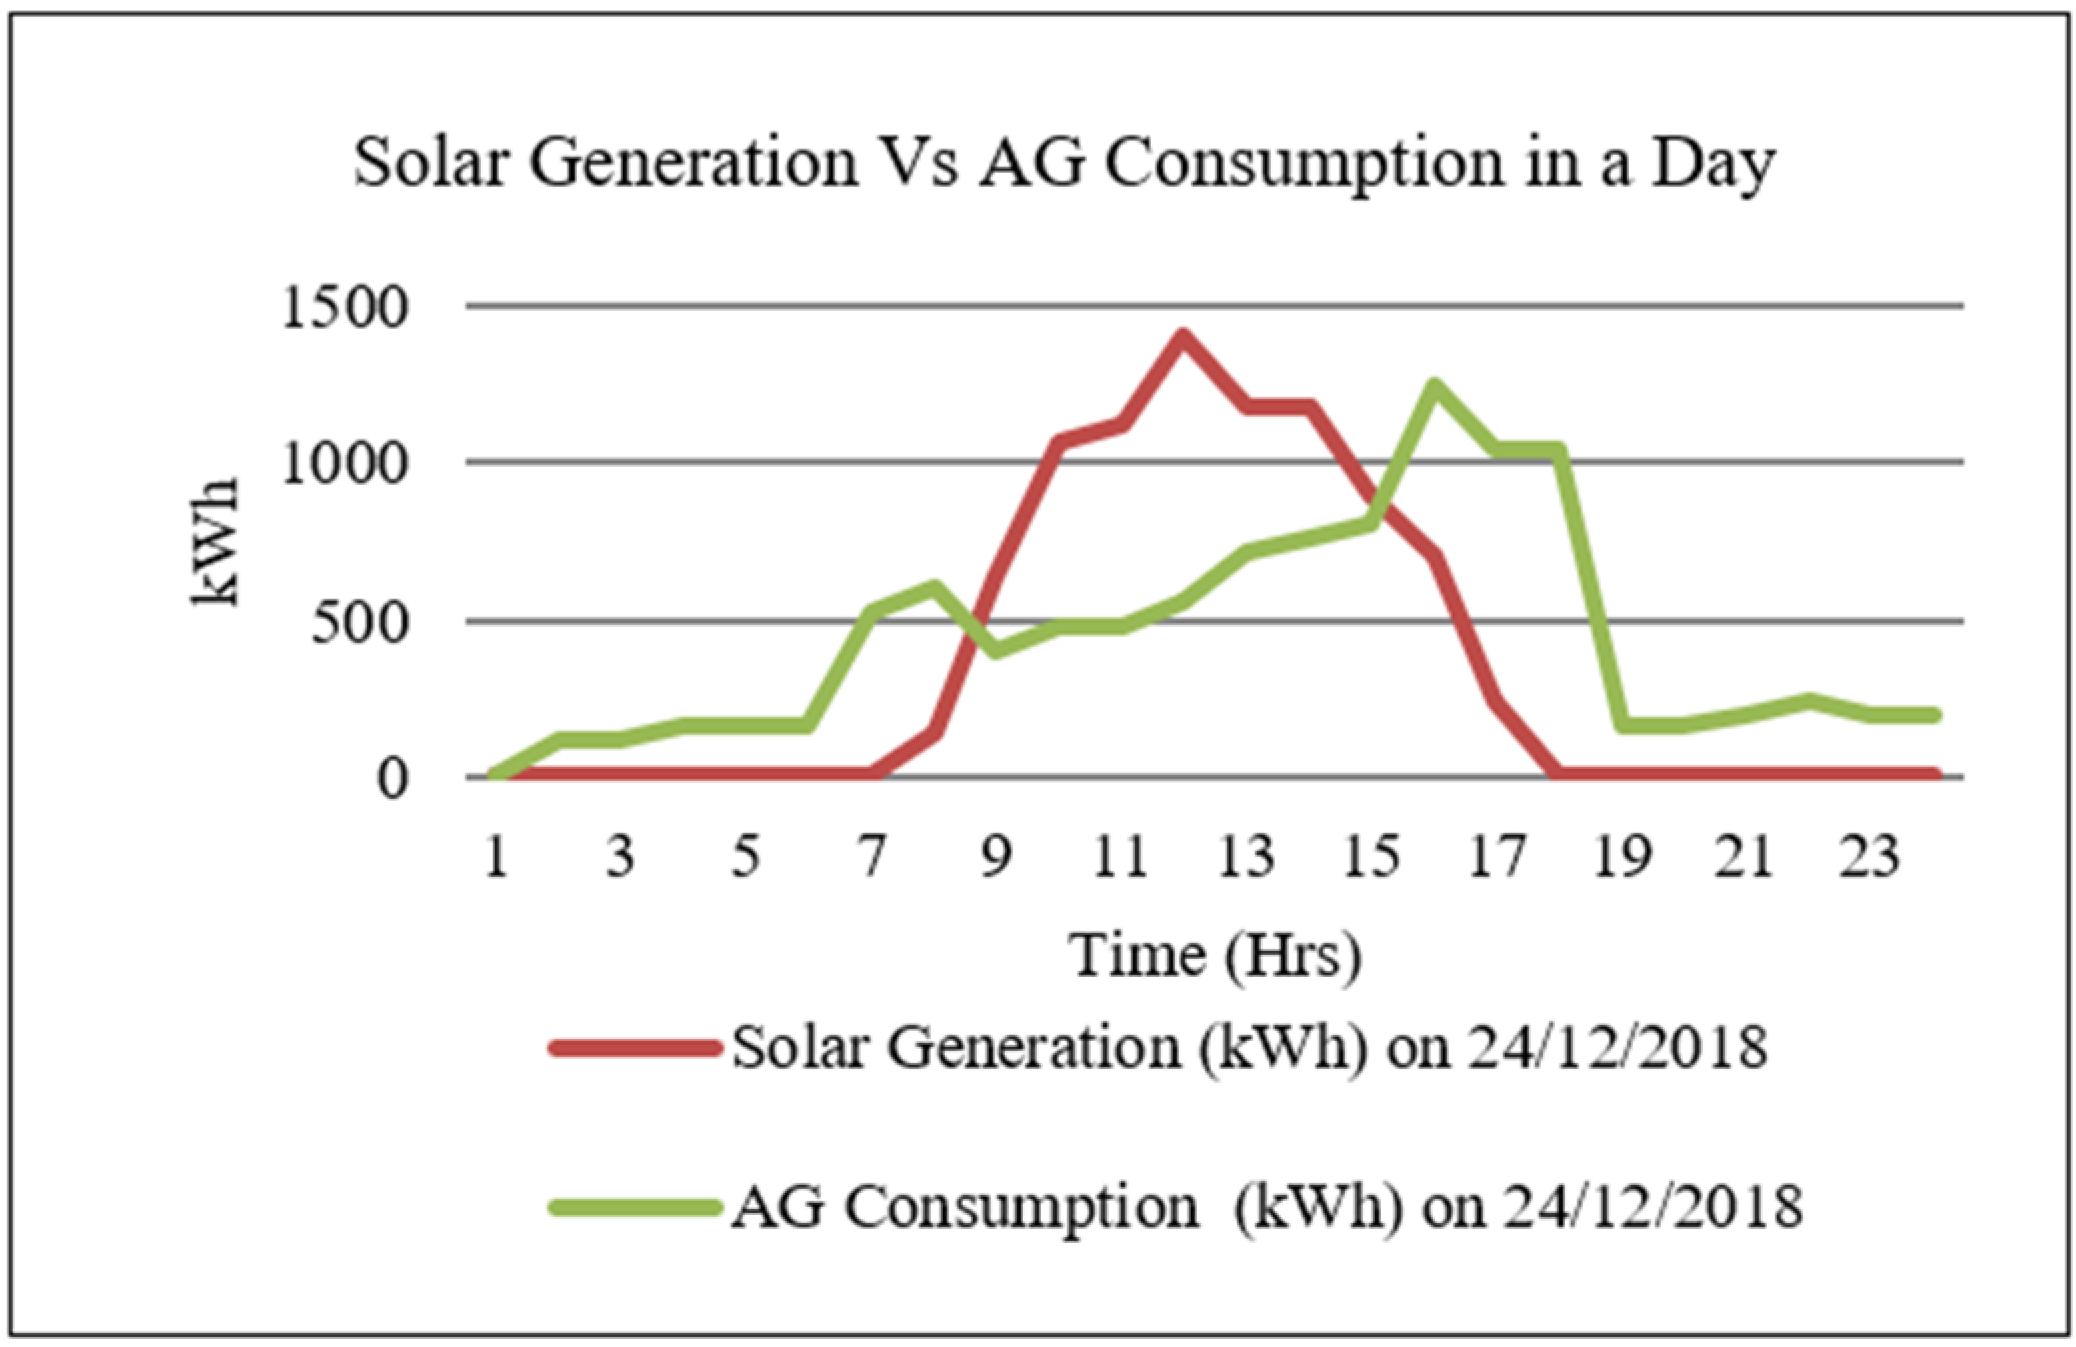
4. Performance Analysis of the Plant

2 MW SPV power plant generation data and AG feeder load side data for seven months (September 2018 to March 2019) were collected for analysis. Indian Metrological department has published the statistical data with the observations over 25 years on an hourly basis. The DISCOM Company has provided the generation data on a daily basis in place of an hourly basis. Considering this, the expected power in a day is calculated using the Hourly Mean Solar Radiation (HMSR) method [26]. February month’s desired solar power is computed using the HMSR method and compared with actual generation values. The detailed analysis of the data collected is presented below.
The comparison of expected solar power generation on days with clear skies versus actual solar power generation for the two months of February 2019 and December 2018 is made. From Figure 2a, it is to be noted that there are fewer variations between actual and expected generations. Due to no interruption and clear sky, the actual generation crosses the expected value on 9, 18, and 26 February 2019. Comparatively, on 3, 7, and 22 February 2019, generation is less than expected due to multiple breakdowns and electricity failures.
In contrast, Figure 2b shows more variations between actual and expected solar power generation of December 2018 than February 2019. Here, it is clear that on 1, 17, 18, and 30 December 2018, the generation dropped down to a lower value because of the following reasons:
  • 1 December 2018: The plant was under shutdown for the duration of 01:44 h due to a technical issue observed in the Vacuum Circuit Breaker (VCB) spring charging AC motor connected to the incomer side of the substation.
  • 17 December 2018: Cloudy weather throughout the day and 33 kV supply failure from 220 kV Yavatmal substation for the duration of 00:08 h.
  • 18 December 2018: Cloudy weather and electricity failure for the duration of 00:25 h.
  • 30 December 2018: Electricity failure for the duration of 00:20 h and breakdown for the time of 05:45 h.
However, 21, 27, 28, 29, and 31 December 2018 reported the higher solar power generation in kWh than expected as a result of clear skies.
For each month, maximum power generation was observed in the afternoon between 12:00 p.m. to 01:00 p.m.
Figure 3 shows month-wise (from September 2018 to March 2019) generated cumulative solar power and cumulative AG consumption with the number of cumulative exported units in kWh. The cumulative solar generation is maximum in the March 2019 owing to more sunshine hours. The AG consumption is more in February 2019 and less in September 2018.
From month-wise exported units, it can be seen that the maximum units are exported to Gaothan feeder in March 2019 because of less AG consumption, and fewer units were exported in December 2018 due to more AG consumption. The excess power exported as depicted in Figure 3 is supplied to the two Gaothan feeders.
Figure 4 represents the hourly maximum active power generated in a day over a month. Here, the variations in a maximum hourly generation are due to cloudy weather, breakdowns of feeder, and the non-availability of grid supply. In September 2018, the average maximum active power was recorded the least of the remaining months because of a higher number of feeder breakdowns. In addition to that, on 2, 8, and 9 September 2018, weather was cloudy throughout the day. The other discrepancies affecting the plant’s performance were grid undervoltage and grid overvoltage.
Table 4 presents discrepancies affecting all seven months’ average maximum active power. These include the number of breakdowns and their duration, duration of load shedding hours, and a total generation lost hours due to non-availability of supply. In February 2019, the average active power was maximum due to fewer breakdowns, load shedding hours, and generation lost hours.
Other discrepancies that affected the plant’s performance were grid undervoltage and grid overvoltage. The month of November 2018 faced non-availability of power supply for two days due to 11 kV line R-phase LA burst.
Feeder breakdown occurred due to malfunction operation of protective relays, which are needed to detect the phase fault of the feeder. In addition, weather and equipment failure cause faults, trips, and interruptions resulting in feeder breakdown.
The cloudy weather and technical issues such as faults, equipment failure, and protection challenges cause insufficient power generation from conventional generators to meet the electricity demand. Hence, load shedding is required.
To avoid the loss of power generation in the grid connected SPV plant, an effective battery storage system can be an alternative solution. This solution can provide the extra energy needed during the peak energy consumption periods and fulfill the consumers’ demands during grid failure and when renewable energy (RE) sources go offline.
Figure 5 represents the maximum and minimum voltage per unit (pu) of the 11 kV line for the months’ September 2018 to March 2019 with the permissible limit of voltage variations for the distribution system, i.e., (11 kV ± 10%).
From Figure 5, it is observed that the voltage never crosses the upper voltage limit, but for three months, the lower voltage limit constraint was violated. The lower voltage constraint violation is due to the agricultural pumps, three-phase induction motor drives drawing a lagging reactive power resulting in a lower power factor. This can be avoided by penetrating more reactive power into the grid with the help of capacitors.
It is suggested that introducing time-of-day metering for the farmers with the maximum incentive during solar power generation hours helps shift the agricultural water pump demand during the solar generation hours. It also reduces the burden of distribution substation during evening hours (5:00 p.m. to 7 p.m.).
Figure 6 shows solar generation and AG consumption on 24 December 2018 for 24 h. Here, during peak hours of Solar PV generation, the AG feeder is not dependent on the grid power supply. However, the AG feeder is taking power from the grid during off-peak hours, as depicted in Figure 6.
The excess PV power is fed back to the grid. When there is no PV generation and before the evening peak starts (5 p.m. to 7 p.m.), AG feeders are supplied by grid, and during peak evening and at night (7 p.m. to 12 midnight), the demand of AG feeder is deficient.
This paper suggests four essential performance parameters of solar power plants; PV Penetration, CUF, and two proposed terms, PV Contribution and Grid Dependency. To supply reliable daytime electricity to farmers via a separate feeder that is the AG feeder, it is now essential to understand the ‘Grid dependency’ of Agricultural Consumers.
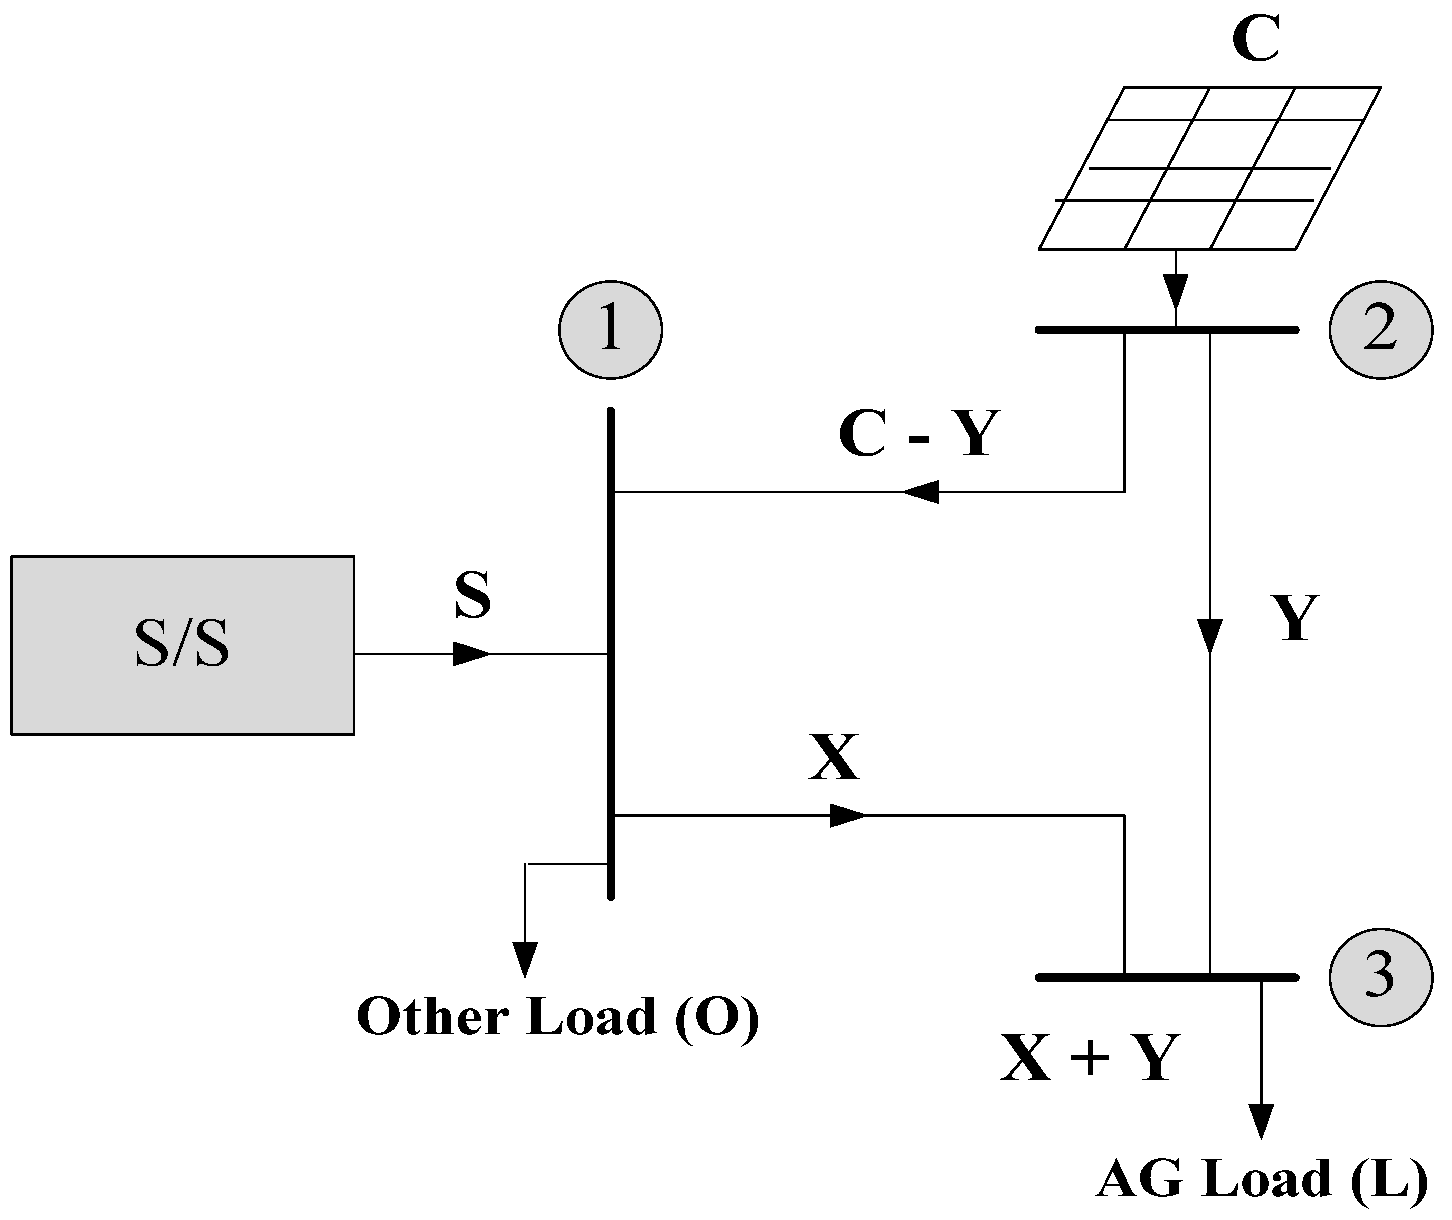
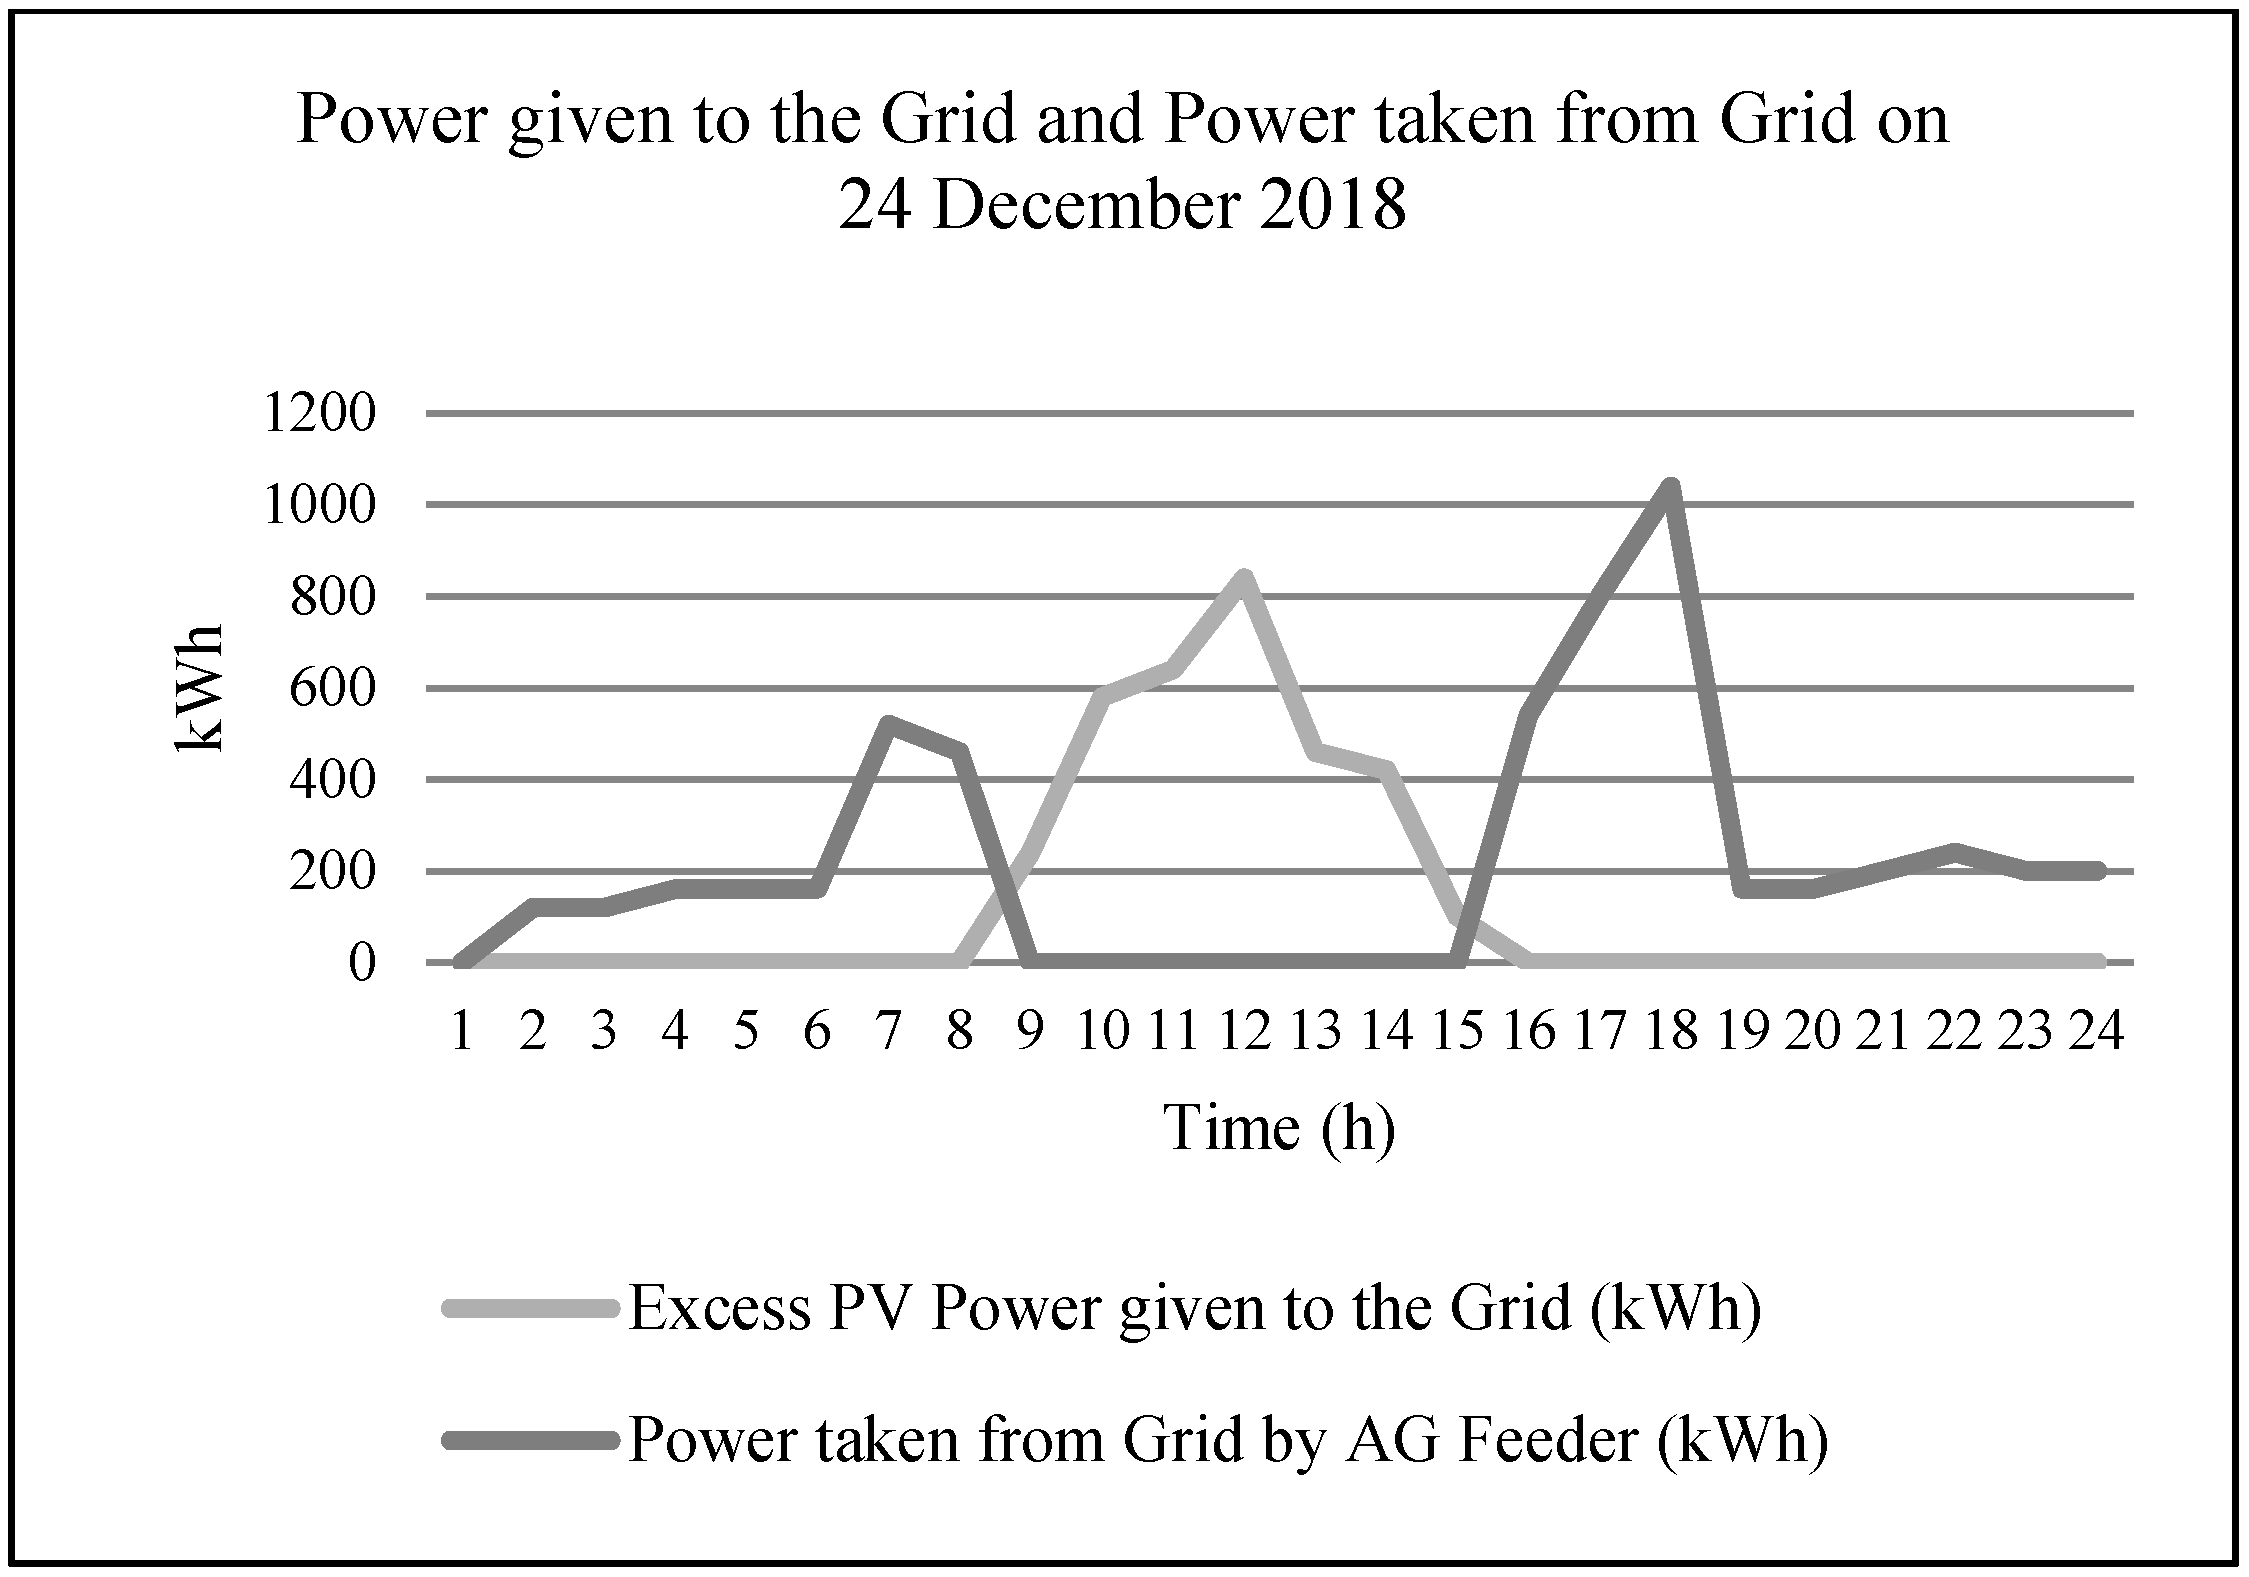
  • Grid Dependency: Grid Dependency is the ratio of power taken from grid by AG load to the total power consumed by AG load.
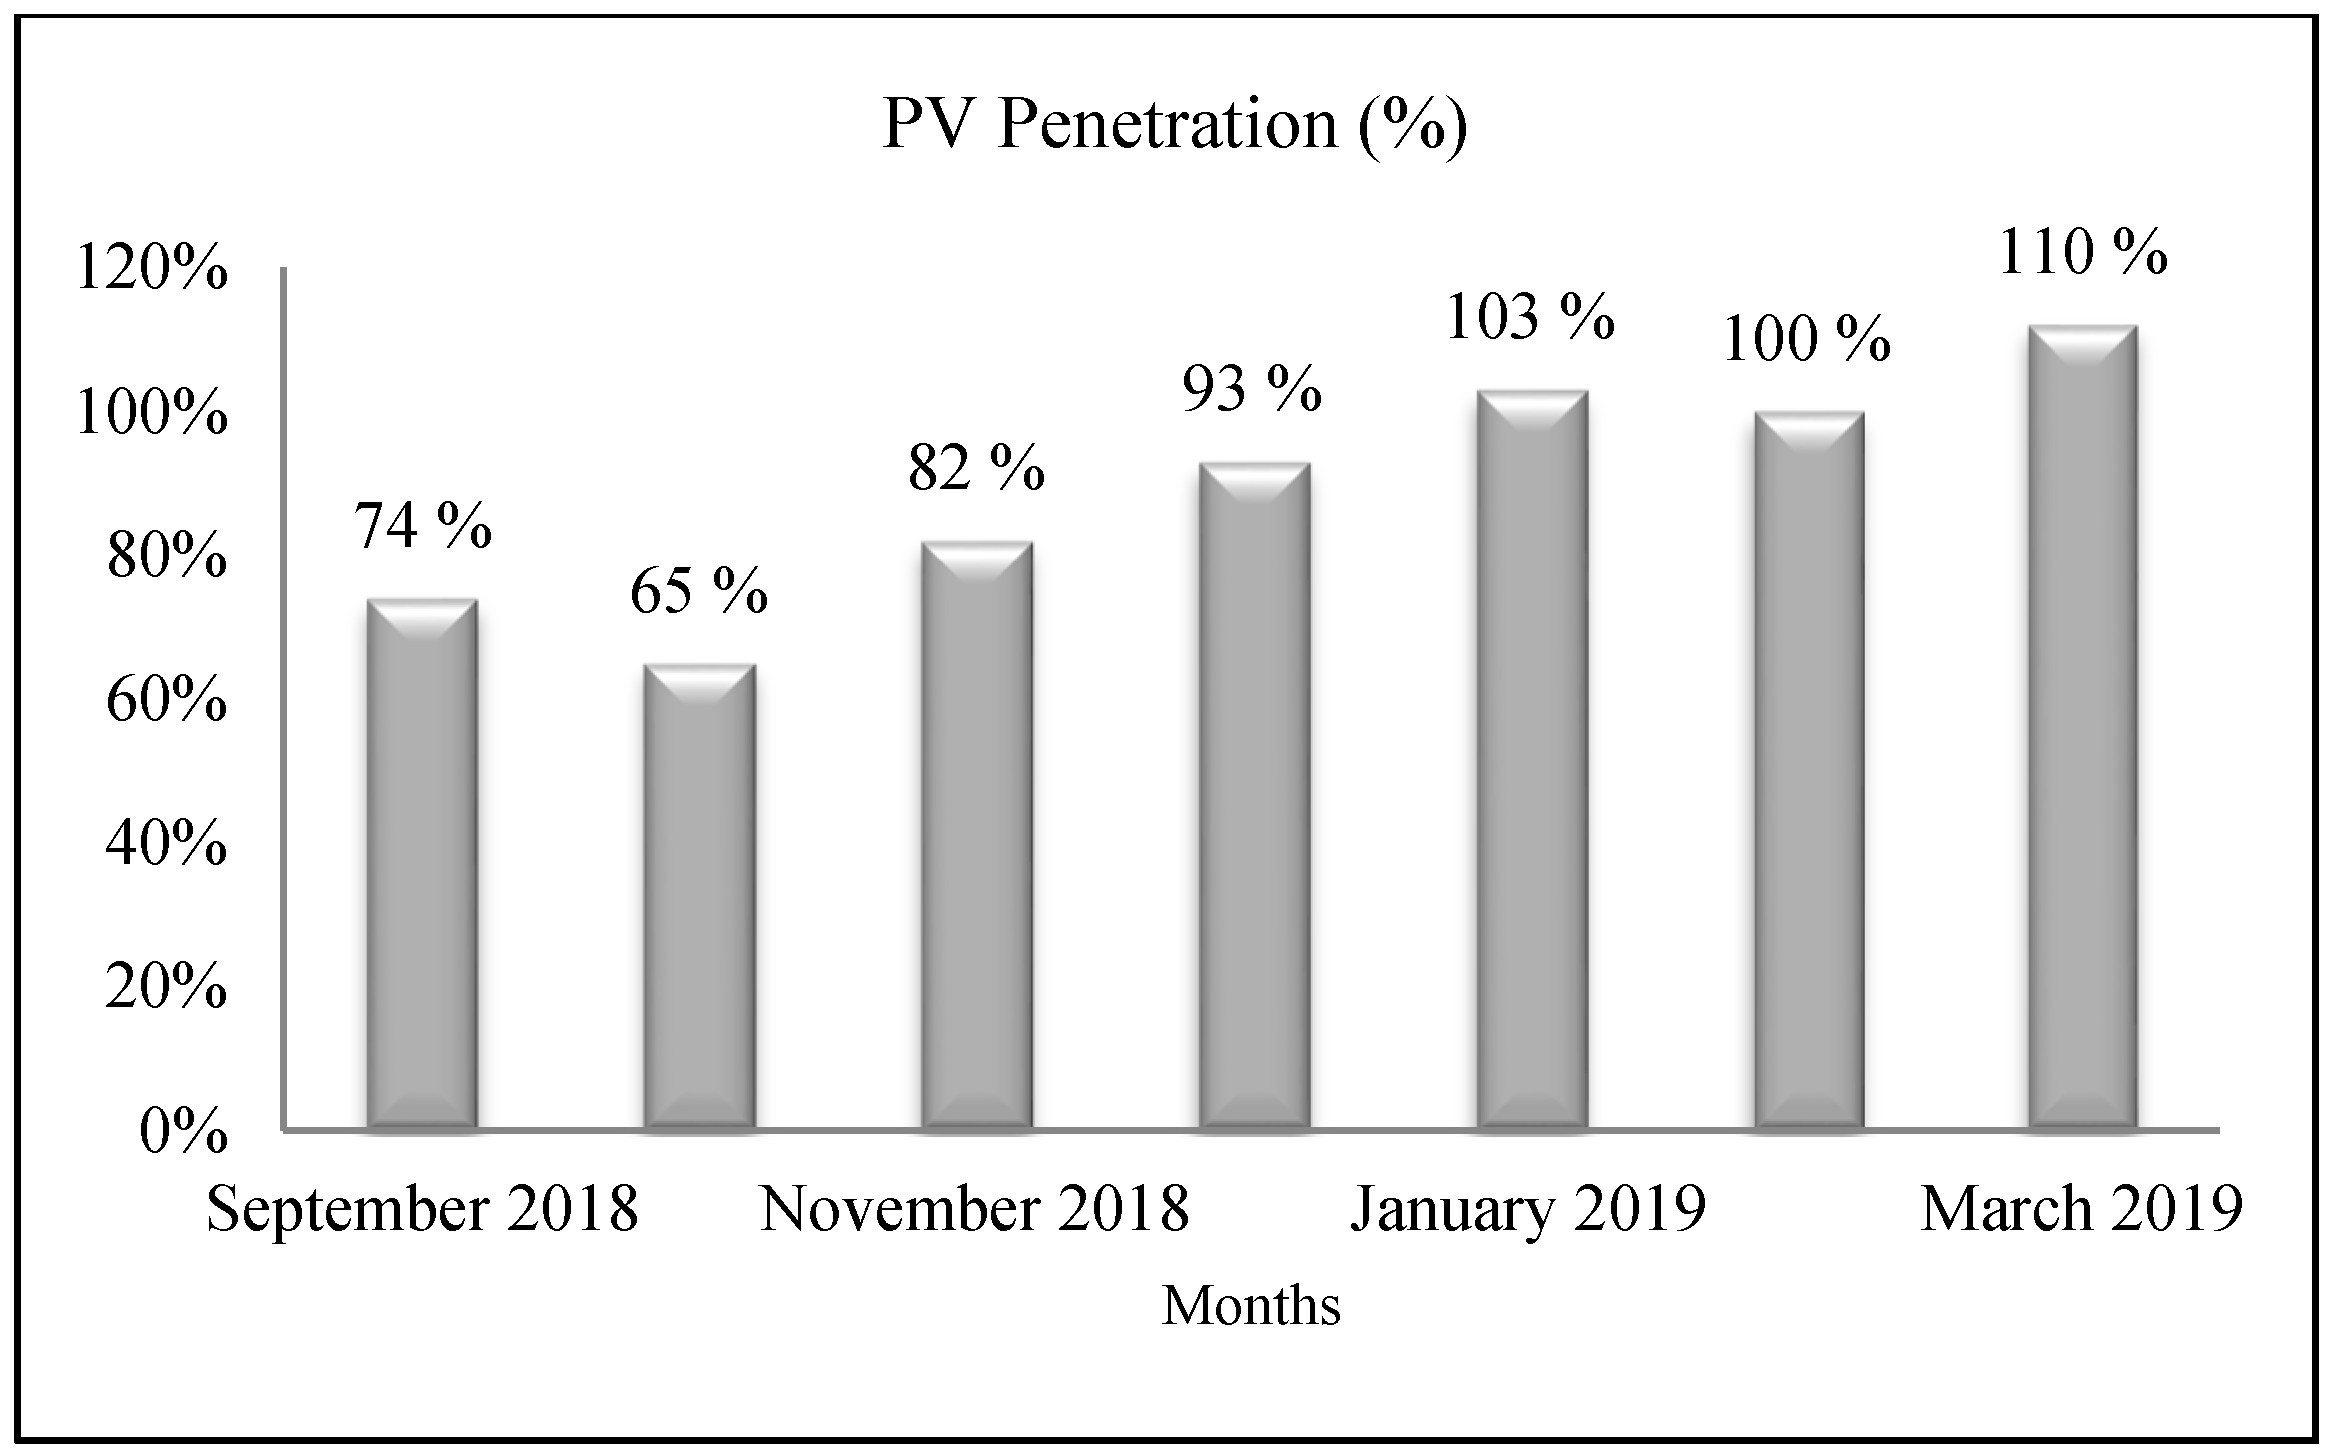
  • PV Penetration: PV Penetration is the ratio of peak PV capacity to the peak load on the feeder.
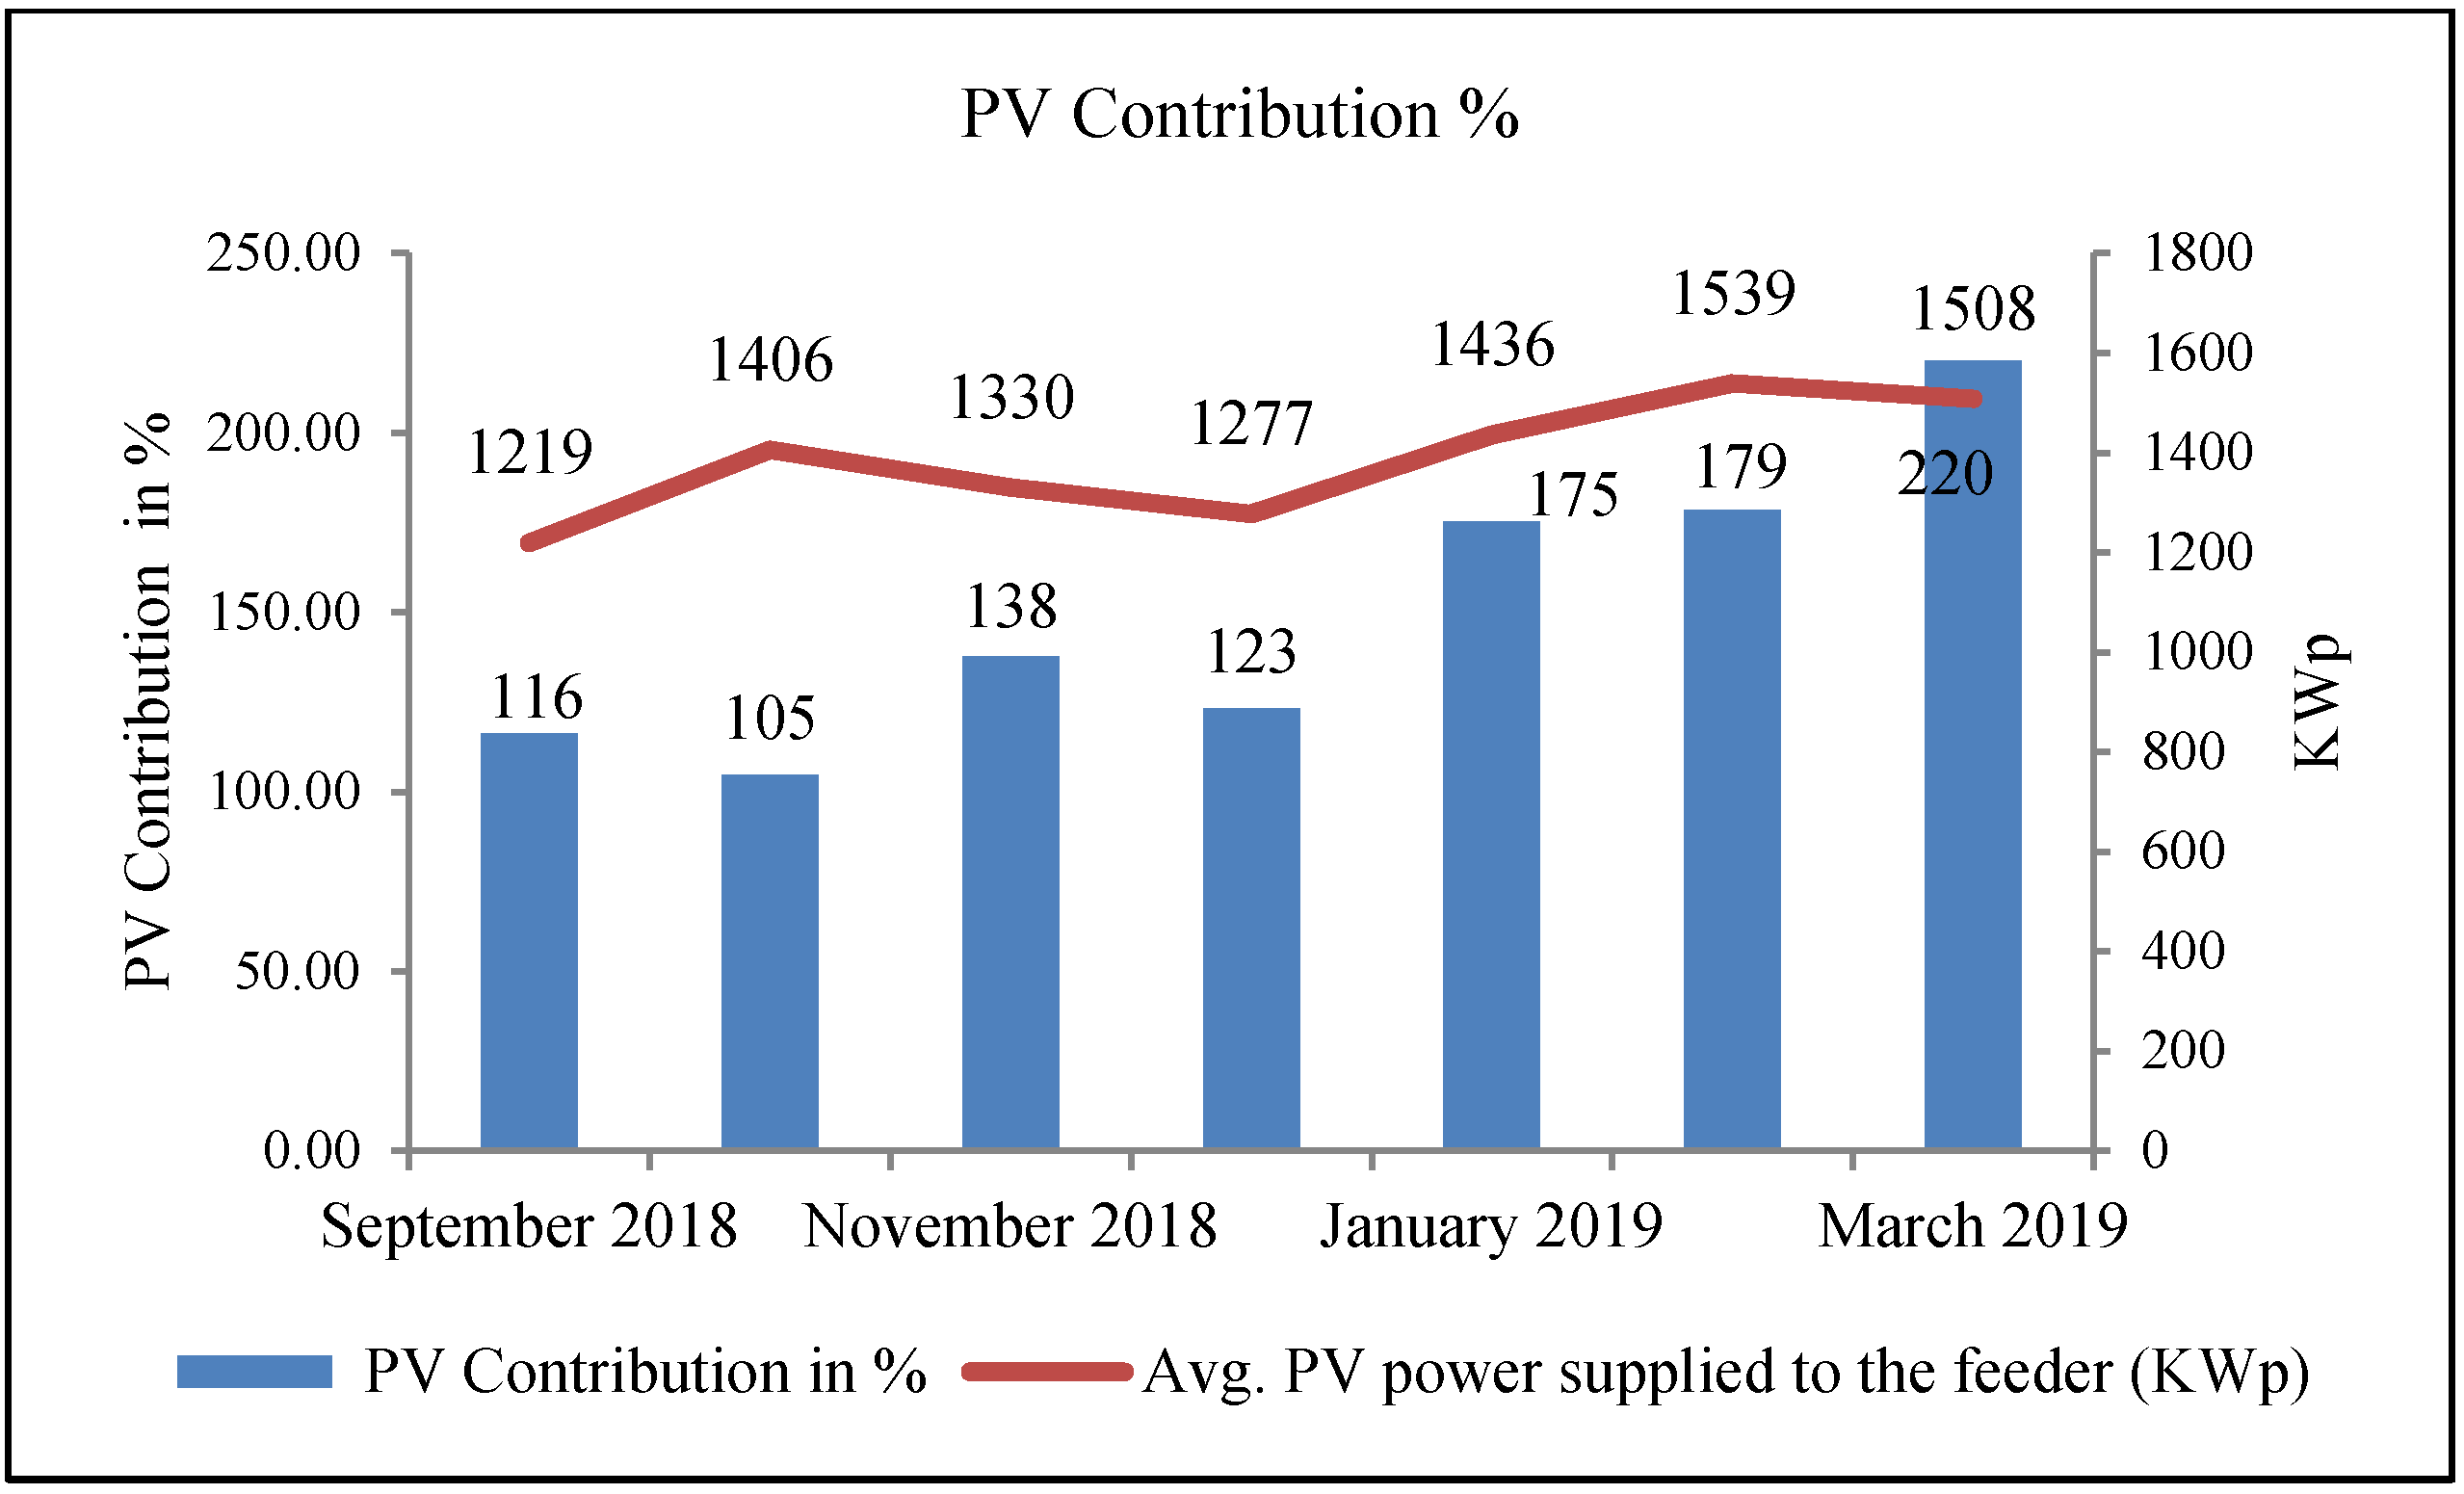
  • PV Contribution: PV Contribution is the ratio of total PV power supplied to the feeder to the total load demand on the feeder.
  • CUF: Capacity Utilization Factor (CUF) is the ratio of total export to the installed capacity of the plant.
Figure 7 represents the Power Flow of AG feeder from the Grid distribution system and solar panel.
As depicted in Figure 7, consider a solar generated power as ‘C’ supplied to the AG load (L). The AG load’s power received from the SPV power plant is ‘Y’. During off-peak hours power provided to the AG load by the grid is ‘X’. Hence, the total power received by the AG load throughout the day will become ‘X + Y’. Surplus power fed back to the grid becomes ‘C–Y’. Considering this power flow for the AG feeder from the grid and the SPV power plant, the following terms have been presented.
As per the proposed term Grid dependency;
G r i d D e p e n d e n c y i n a D a y = ( P o w e r t a k e n f r o m G r i d b y A G L o a d i n a D a y T o t a l P o w e r C o n s u m e d b y A G L o a d i n a D a y )
From Figure 7, Grid Dependency can be expressed as;
Grid   Dependency = X X + Y = X L
As per the proposed term PV Contribution;
P V C o n t r i b u t i o n = T o t a l P V p o w e r s u p p l i e d t o t h e f e e d e r T o t a l l o a d d e m a n d o n t h e f e e d e r
From Figure 7, PV Contribution can be written as;
PV   Contribution = Y X + Y = Y L
Therefore, from (2) and (4),
Grid Dependency + PV Contribution = Power supplied to the AG load.
That is, X X + Y + Y X + Y = 1.
Hence, it is inferred that the proposed terms Grid Dependency and PV Contribution are interdependent. Correlation cannot be exhibited for other performance parameters, PV penetration and CUF.
On 24 December 2018, the amount of power given to the grid and taken from the grid is shown in Figure 8. It is noted that no power is taken from the grid during day hours (PV generation hours) as the demand of AG consumers is completely fulfilled by the Solar PV plant.

4.1. Grid Dependency

It is essential to know about the AG feeder dependency on the grid if the solar PV plant supplies power to the AG Feeder for 10 h per day. This will reveal the AG feeder independence from the Grid power supply. Hence, this new term has been introduced here, which exposes the Grid dependency of the AG feeder.
Grid Dependency is defined as the ratio of power taken from the grid in a day/month/year to the total energy consumed by the load in a day/month/year.
G r i d D e p e n d e n c y i n a D a y = ( P o w e r t a k e n f r o m G r i d b y A G L o a d i n a D a y T o t a l P o w e r C o n s u m e d b y A G L o a d i n a D a y )
As of 24 December 2018, the Grid Dependency was;
Grid Dependency (%) = (2400 kWh/10,520 kWh) × 100
Grid Dependency (%) = 22.81%
where, 2400 kWh is the power taken from the grid by AG consumers, and 10,520 kWh is the total power consumed by AG feeder throughout the day.
Therefore, on 24 December 2018, it can be concluded that the load was almost 77% independent of the Grid power supply.
Table 5 shows the Grid Dependency for the months November 2018 to March 2019 as per the data availability. By observing the Grid Dependency of the five months from Table 5, it can be noted that almost every month AG feeders’ Grid dependency is below 50%, which happens because of the maximum power supplied by the Solar Power Plant to the load.

4.2. PV Penetration

The available literature has suggested several definitions of Photovoltaic Distributed Generators (PVDG) penetration limits. It differs broadly among researchers; some have considered it the ratio of houses with PV systems to the total houses in the area under study [27]. Some researchers have tried to outline it with the transformer capacity [14], while others have evaluated it as the ratio of installed PV peak capacity to the maximum load on the feeder [5,28].
The maximum load on the feeder against peak PV capacity is the best-suited definition used for the current study because it has more decisive significance for both the power flows and the voltage profiles of the network. Therefore, PV penetration can be defined concerning peak PV capacity and Peak load on the feeder as (6);
P V P e n e t r a t i o n = ( P e a k P V C a p a c i t y P e a k L o a d o n t h e F e e d e r )
From Figure 9, it is clear that the 65% penetration was recorded in October 2018 owing to the maximum load on the transformer where three feeders are connected (one AG Feeder and two Gaothan Feeders).
After October 2018, PV penetration increased as summer approached (till March 2019). The highest penetration was recorded in March 2019, which was 110%. Some of the literature stated that the penetration level can be achieved up to 110% if photovoltaic distributed generators (PVDGs) are uniformly distributed over shorter lengths [14,29].

4.3. PV Contribution

PV penetration explained in the previous subsection ‘B’ may mislead readers while analyzing the collected data from the solar power plant. To clarify this, compare the bar chart of the PV penetration shown in Figure 7 and cumulative month-wise solar generation is illustrated in Figure 2. On comparing, it is observed that the solar generation was less in December 2018 than November 2018; however, for the same month (December 2018) PV penetration is more than November 2018. This is because the load consumption was also more in December 2018 than November 2018, even though the solar generation was more in November 2018 than December 2018. Therefore, a new term, ‘PV Contribution’ is suggested to avoid this misconception and analyze the data more aptly [30], which is more relevant for the data analysis.
The term PV Contribution is defined as;
P V C o n t r i b u t i o n = T o t a l P V p o w e r s u p p l i e d t o t h e f e e d e r T o t a l l o a d d e m a n d o n t h e f e e d e r
The plot of PV Contribution shown in Figure 10 relates the plot of solar power generation in Figure 3 and the average maximum active power in Figure 4 based on solar power generation and AG consumption in December 2018.
In September 2018, the average PV power supplied to the feeder was the lowest 1219 KWp, and in December 2018 it was 1277 KWp; however, the average load demand on the feeder was more in September 2018 which was 1048 KW, and it was less in December 2018 that is 1037 KW than September 2018.
Hence, this variation can be seen in terms of the PV contribution of the respective months in Figure 10. Furthermore, in October 2018 average PV power supplied to the feeder was more, 1406 KWp. On the other hand, the average load demand on the feeder was also more, 1344 KW. Thus, leading towards the lowest PV Contribution as depicted in Figure 10.
If the contribution factor is less than 100%, then grid power is taken during the daytime for feeding the agricultural pumps.
However, suppose the contribution factor is more than 100%. In that case, it represents that the total agricultural load is supplied by solar PV, and excess PV power generated is supplied to the Gaothan feeder.

4.4. Capacity Utilization Factor

The worldwide standard for measuring a solar plant’s performance is the performance ratio (P.R.). However, most project developers, investors in India use the CUF as the standard for measuring the performance of a plant.
It is the ratio of actual output from a solar plant over the year/month/day to the maximum possible output for a year/month/day under ideal conditions [31]. CUF is usually referred to in percentage, as mentioned in (8).
C U F = ( T o t a l E x p o r t i n a D a y 24 × I n s t a l l e d C a p a c i t y o f t h e P l a n t )  
Usually, 15% to 25% CUF is expected from various SPV power plants using thin film or crystalline PV modules and up to 35% CUF is expected based on concentrated PV (CPV) [32].
The plant’s CUF for September 2018 to March 2019 is depicted in Figure 11. From the plot, it can be inferred that the plant was better utilized in March 2019 (20%), and less utilization can be observed in September 2018 (10%). CUF represents solar power generation concerning the capacity of the plant. CUF has no relation with the load on the feeder, whereas PV penetration shows the relationship between load and installed capacity (Peak PV Capacity) of the plant.
PV Contribution term signifies the load shared by the solar PV system following the actual load. Hence, it is not unfair to say that the term PV contribution reveals the direct contribution of PV generation to the current load on the feeder. In December 2018, generation and the load were lower than November 2018, as depicted in Figure 3. Therefore, CUF is less in December 2018 than November 2018, as CUF is based on solar power exported considering the peak PV capacity of the plant.

5. Conclusions

To explore the performance of solar energy in the agricultural sector, a case study of an AG feeder connected 2 MW SPV system installed at Manjarda, Yavatmal, Maharashtra, India, has been presented. Graphical analysis by considering the expected and actual solar power generation, month wise cumulative solar energy generation and consumption, the power given to the grid and taken from the grid has been carried out to examine the plant behavior. Such analysis is essential to take necessary actions while supplying power to the agricultural feeder during the winter and summer. Furthermore, two vital factors are verified: PV penetration and CUF to validate the SPV system performance. CUF of the 2 MW SPV Manjarda power plant is calculated which is within the range of 10% to 20%. From the parameters mentioned above, the PV penetration and CUF depict the plant’s overall performance and are higher during the months January 2019 to March 2019. The New terms Grid Dependency and PV Contribution are proposed in this paper and are found to be more relevant and convenient while analyzing the data collected from the SPV power plant. The suggested parameter Grid Dependency has disclosed the AG feeder independence from the Grid power supply. It is inferred from the analysis that the AG feeder dependency on the Grid power supply is below 50%, which is a good indication of superior SPV plant performance.
The proposed term PV Contribution clarifies the SPV system behavior more precisely. This term directly relates to the day-wise or month-wise collected solar power generation and load demand data. To increase the SPV penetration to the grid, grid availability needs to be enhanced, and capacitors should be connected at the agricultural pumps (load points) to provide the reactive power support locally, so the lower voltage constraint will not be violated. In conclusion, the SPV power plant connected AG feeder in the LV network has been found to be capable of providing power supply to agricultural consumers during the daytime, which may lead to proper load management by making AG feeder nearly Grid independent.

Author Contributions

Conceptualization, N.P. and R.M.; methodology, N.P.; software, N.P. and R.M.; validation, N.P., R.M. and A.M.; formal analysis, N.P. and A.M.; investigation, N.P.; resources, N.P.; data curation, N.P.; writing—original draft preparation, N.P.; writing—review and editing, N.P. and R.M.; supervision, R.M.; project administration, N.P. and R.M. All authors have read and agreed to the published version of the manuscript.

Funding

This research received no external funding.

Institutional Review Board Statement

Not applicable.

Informed Consent Statement

Not applicable.

Data Availability Statement

This data is not taken from public domain data sets.

Acknowledgments

The authors are grateful to DyEE of Yavatmal (Rural), Maharashtra, India, and Manjarda Solar Power Plant authorities for providing the necessary information for this research. They are also thankful to the academic institute Y.C.C.E. Nagpur authorities for granting permission for the same.

Conflicts of Interest

The authors declare no conflict of interest.

References

  1. Anas, R.; Agrawal, S.; Jain, A. Powering Agriculture in India: Strategies to Boost Components A & C under PM-KUSUM Scheme; Council on Energy, Environment and Water (CEEW): New Delhi, India, 2021. [Google Scholar]
  2. Patel, R.B.; Patel, R.D. Smart Energy Management for the Grid Connected Solar Agricultural Prosumers and Consumers; Metering India—Leema: New Delhi, India, 2019. [Google Scholar]
  3. Moharil, R.M.; Kulkarni, P.S. A case study of solar photovoltaic power system at Sagardeep Island India. Renew. Sustain. Energy Rev. 2009, 13, 673–681. [Google Scholar] [CrossRef]
  4. Eltawil, M.A.; Zhao, Z. Grid-connected photovoltaic power systems: Technical and potential problems—A review. Renew. Sustain. Energy Rev. 2010, 14, 112–129. [Google Scholar] [CrossRef]
  5. Coddington, M.H.; Baca, D.; Kroposki, B.D.; Basso, T. Deploying high penetration photovoltaic systems–A case study. In Proceedings of the 2011 37th IEEE Photovoltaic Specialists Conference, Seattle, WA, USA, 19–24 June 2011; pp. 002594–002599. [Google Scholar]
  6. Khare, V.; Nema, S.; Baredar, P. Status of solar wind renewable energy in India. Renew. Sustain. Energy Rev. 2013, 27, 1–10. [Google Scholar] [CrossRef] [Green Version]
  7. Kordkheili, R.; Bak-Jensen, B.; Pillai, J.R.; Mahat, P. Determining maximum photovoltaic penetration in a distribution grid considering grid operation limits. In Proceedings of the 2014 IEEE PES General Meeting|Conference & Exposition, National Harbor, MD, USA, 27–31 July 2014. [Google Scholar]
  8. Chidurala, A.; Saha, T.; Mithulananthan, N. Field investigation of voltage quality issues in distribution network with PV penetration. In Proceedings of the 2015 IEEE PES Asia-Pacific Power and Energy Engineering Conference (APPEEC), Brisbane, Australia, 15–18 November 2015. [Google Scholar]
  9. Lolla, S.; Roy, S.; Chowdhury, S. Wind and Solar Energy Resources in India. Energy Procedia 2015, 76, 187–192. [Google Scholar] [CrossRef] [Green Version]
  10. Karimi, M.; Mokhlis, H.; Naidu, K.; Uddin, S.; Bakar, A.H. Photovoltaic penetration issues and impacts in distribution network–A review. Renew. Sustain. Energy Rev. 2016, 53, 594–605. [Google Scholar] [CrossRef]
  11. Uzum, B.; Onen, A.; Hasanien, H.M.; Muyeen, S.M. Rooftop Solar PV Penetration Impacts on Distribution Network and Further Growth Factors—A Comprehensive Review. Electronics 2021, 10, 55. [Google Scholar] [CrossRef]
  12. Sarraf, A.; Agarwal, S.; Sharma, D. Performance of 1 MW photovoltaic system in Rajasthan: A case study. In Proceedings of the 2016 IEEE 7th Power India International Conference (PIICON), Bikaner, India, 25–27 November 2016. [Google Scholar]
  13. Sreedevi, J.; Ashwin, N.; Naini Raju, M. A study on grid connected PV system. In Proceedings of the 2016 National Power Systems Conference (NPSC), Bhubaneswar, India, 19–21 December 2016. [Google Scholar]
  14. Aziz, T.; Ketjoy, N. PV penetration limits in low voltage networks and voltage variations. IEEE Access 2017, 5, 16784–16792. [Google Scholar] [CrossRef]
  15. Badulescu, N.; Triștiu, I. Integration of photovoltaics in a sustainable irrigation system for agricultural purposes. In Proceedings of the 2017 International Conference on ENERGY and ENVIRONMENT (CIEM), Bucharest, Romania, 19–20 October 2017; pp. 36–40. [Google Scholar]
  16. Maisanam, A.; Biswas, A.; Sharma, K. Solar power potential of North-east India–A case study for Silchar. AIP Conf. Proc. 2018, 1952, 020002. [Google Scholar]
  17. Chathurangi, D.; Jayatunga, U.; Rathnayake, M.; Perera, S. Potential power quality impacts on LV distribution networks with high penetration levels of solar PV. In Proceedings of the 2018 18th International Conference on Harmonics and Quality of Power (ICHQP), Ljubljana, Slovenia, 13–16 May 2018. [Google Scholar]
  18. Oliveira, R.; Amaral, F.; Oliveira, F. Solar generation impact on voltage of rural power distribution networks: A case study. In Proceedings of the 2018 Simposio Brasileiro de Sistemas Eletricos (SBSE), Niteroi, Brazil, 12–16 May 2018. [Google Scholar]
  19. Hasarmani, T.; Holmukhe, R.; Tamke, S. Performance analysis of grid interfaced photovoltaic systems for reliable agri-microgrids using PVsyst. In Proceedings of the 2019 International Conference on Information and Communications Technology (ICOIACT), Yogyakarta, Indonesia, 24–25 July 2019; pp. 894–898. [Google Scholar]
  20. Alboaouh, K.A.; Salman Mohagheghi, S. Impact of rooftop Photovoltaics on the distribution system. J. Renew. Energy 2020, 2020, 4831434. [Google Scholar] [CrossRef]
  21. Akshay Urja, A. Bi-Monthly Newsletter of the Ministry of New and Renewable Energy, Government of India. August 2018; Volume 12, pp. 1–52. Available online: https://mnre.gov.in/img/documents/uploads/670406a017f54c9386fcde911ee5abe6.pdf (accessed on 4 December 2021).
  22. Mahanta, K.; Burman1, D.; Sarangi1, S.; Mandal1, U.; Maji1, B.; Mandal, S.; Digar, S.; Mainuddin, M. Drip Irrigation for Reducing Soil Salinity and Increasing Cropping Intensity: Case Studies in Indian Sundarbans. J. Indian Soc. Coast. Agric. Res. 2019, 37, 64–71. [Google Scholar]
  23. Ministry of New and Renewable Energy. ‘Vikaspedia’ Online Information Guide Launched by the Government of India. PM KUSUM Scheme; MNRE: New Delhi, India, 2019. Available online: https://vikaspedia.in/energy/policy-support/renewable-energy-1/solar-energy/pm-kusum-scheme (accessed on 10 May 2021).
  24. Best Practices on e-Platform of CEA; MSEDCL: Mumbai, India, 2012; Available online: https://cea.nic.in/wp-content/uploads/2020/04/mah.pdf (accessed on 18 May 2021).
  25. Central Electricity Authority (Technical Standards for Connectivity to the Grid) Amendment Regulations. 2013. Available online: https://cea.nic.in/wp-content/uploads/2020/02/grid_connectivity_12112013.pdf (accessed on 10 May 2021).
  26. Moharil, R.; Kulkarni, P. Reliability analysis of solar photovoltaic system using hourly mean solar radiation data. Sol. Energy 2010, 84, 691–702. [Google Scholar] [CrossRef]
  27. Verschueren, T.; Mets, K.; Meersman, B.; Strobbe, M.; Evelder, C.; Vandevelde, L. Assessment and mitigation of voltage violations by solar panels in a residential distribution grid. In Proceedings of the 2011 IEEE International Conference on Smart Grid Communications (SmartGridComm), Brussels, Belgium, 17–20 October 2011. [Google Scholar]
  28. Ellis, A. Grid Operations and High Penetration PV; National Renewable Energy Laboratory (NREL): Golden, CO, USA; U.S. Department of Energy: Washington, DC, USA, 2010. Available online: https://www1.eere.energy.gov/solar/pdfs/2010ulw_ellis.pdf (accessed on 30 November 2021).
  29. Impact of Photovoltaic Generation on Power Quality in Urban Areas with High PV Population (Results from Monitoring Campaigns). 2008. Available online: http://www.pvupscale.org/IMG/pdf/WP4_D4-3_public_v1c.pdf (accessed on 5 December 2021).
  30. Padole, N.; Moharil, R.; Munshi, A. Solar Photovoltaic (SPV) Power Plant Connected Agricultural Feeder Performance Analysis. In Proceedings of the 2021 International Conference on Electrical, Computer, Communications and Mechatronics Engineering (ICECCME), Mauritius, Mauritius, 7–8 October 2021; pp. 1–7. [Google Scholar]
  31. Shiva Kumar, B.; Sudhakar, K. Performance evaluation of 10 MW grid connected solar photovoltaic power plant in India. Energy Rep. 2015, 1, 184–192. [Google Scholar] [CrossRef] [Green Version]
  32. Central Electricity Regulatory Commission. Performance of Solar Power Plants in India; Central Electricity Regulatory Commission: New Delhi, India, 2011. Available online: https://cercind.gov.in/2011/Whats-New/PERFORMANCE%20OF%20SOLAR%20POWER%20PLANTS.pdf (accessed on 30 November 2021).
Figure 1. Single line diagram of 33 kV/11 kV Kolambi Substation and Solar Power Plant at village Manjarda.
Energies 15 00075 g001
Figure 2. (a) Actual versus Expected Solar power generation of February 2019. (b) Actual versus Expected Solar power generation of December 2018.
Energies 15 00075 g002
Figure 3. Comparison of cumulative solar generation versus cumulative AG consumption with cumulative units exported (kWh).
Energies 15 00075 g003
Figure 4. Hourly maximum active power averaged over the month.
Energies 15 00075 g004
Figure 5. 11 kV Line voltage variation (pu) for different months at Manjarda.
Energies 15 00075 g005
Figure 6. Solar Generation and AG Consumption in a day.
Energies 15 00075 g006
Figure 7. Power Flow for AG Feeder from Grid Distribution System and Solar Panel.
Energies 15 00075 g007
Figure 8. Power fed to the grid and power taken from grid.
Energies 15 00075 g008
Figure 9. PV Penetration (%) of the months from September 2018 to March 2019.
Energies 15 00075 g009
Figure 10. PV Contribution of the Months.
Energies 15 00075 g010
Figure 11. Month wise CUF.
Energies 15 00075 g011
Table 1. Site Credentials.
Project2 MW (2.23 MWp) Grid Connected SPV Power Plant
LocationVillage: Manjarda
District: Yavatmal
State, CountryMaharashtra, India
Geographical Location20°15′38″ N, 78°15′21″ E
Capacity (AC/DC)2 MW/2.23 MWp
The technology of PV ModulesPoly Crystalline
Table 2. Technical Description.
PV-Modules270 Wp
InvertersTmeic 1000 KW, PVL-L1000E-1 N
Inverter
Transformer
2.1 MVA
11 kV/2 × 380 V
Auxiliary TransformerMelcon, 40 kVA, 380/415 V
Table 3. Feeder Details.
11 kV Akola Bazar AG
Sub-Station33 kV Kolambi
Feeder 11 kV Akola AG (205)
Length of Feeder95.8 km
No of Consumer1277
Peak Load189 AMP
Akola Bazar Gaothan
Sub-Station33 kV Kolambi
Feeder11 kV Akola AG (202)
Length of Feeder61.2 km
No of Consumer2902
Peak Load90 AMP
11 kV Kolambi Gaothan
Sub-Station 33 kV Kolambi
Feeder11 kV Kolambi Gaothan (201)
Length of Feeder17.5 km
No of Consumer985
Peak Load38 AMP
Table 4. Breakdown, load shedding, and a generation lost hours of seven months.
MonthsDiscrepancies
Total No. of Breakdown of FeederTotal Duration of Breakdowns (h)Total Duration of Load Shedding (h)Total Generation Lost Hours due to Non-Availability of Supply (h)
September 201812631:10:00146:50:00200:10:00
October 201818937:13:00124:00:00161:13:00
November 201811426:53:0026:50:0053:43:00
December 20188621:26:0063:37:0085:03:00
January 20199013:45:0050:26:0064:11:00
February 20199317:06:0026:04:0043:10:00
March 201914331:29:000:00:0031:29:00
Table 5. Grid Dependency (%) of AG Feeder in a Month.
DateNovember 2018December 2018January 2019February 2019March 2019
129.317.9919.4730.5325.68
218.287.4521.5728.3531.49
315.986.6824.6430.7428.57
44.548.8426.4422.3613.04
59.219.2825.3524.7224.74
617.749.0016.1326.3931.02
717.6013.9726.4821.7232.80
822.4514.1432.8313.2932.81
923.337.7928.9526.8729.67
1014.461.4733.9618.7532.37
1115.456.6721.8329.3231.02
1215.708.3325.7831.1032.49
1314.024.8531.9731.0529.67
1415.8910.7516.8931.8432.81
1510.787.7330.2935.8729.11
1613.46022.5833.9640.00
1715.2221.5339.3331.1118.33
1816.2839.5931.2134.5623.03
1918.0348.0948.6034.0527.71
206.4540.9425.1828.6917.33
2114.1336.6727.0726.7019.39
22034.9326.0724.5123.57
232.7422.1327.7816.6313.85
2415.1422.8129.5446.0720.53
258.7624.1533.3342.6026.23
2612.8021.0730.6947.3621.31
278.9325.4230.2648.6718.61
288.1229.3932.0245.4218.31
296.6221.8424.55 21.21
3011.4637.8232.58 21.43
31 27.4531.64 27.42
Publisher’s Note: MDPI stays neutral with regard to jurisdictional claims in published maps and institutional affiliations.

