Article

Numerical Analysis of a Residential Energy System That Integrates Hybrid Solar Modules (PVT) with a Heat Pump

1
Department of Mechanical Engineering, Eindhoven University of Technology (TUE), Den Dolech 2, 5612AZ Eindhoven, The Netherlands
2
Solar Energy Application Centre (SEAC) Part of Netherlands Organisation for Applied Scientific Research (TNO), High Tech Campus 21, 5656AE Eindhoven, The Netherlands
*
Author to whom correspondence should be addressed.
Energies 2022, 15(1), 96; https://doi.org/10.3390/en15010096
Submission received: 12 November 2021 / Revised: 15 December 2021 / Accepted: 17 December 2021 / Published: 23 December 2021

Abstract

:
Photovoltaic-thermal (PVT) collectors are hybrid solar collectors that convert solar and ambient energy into thermal and electrical energy. Integrated PVT-HP, in which PVT collectors are combined with a heat pump, offers an efficient and renewable option to replace conventional fossil fuel-based energy systems in residential buildings. Currently, system concepts in which the selection, design and control of the components are aligned towards the system performance are lacking. The development of a system model enables the comparison of a variety of system parameters and system designs, informed decision making based on the energetic performance and the market diffusion of PVT-HP systems. This contribution presents a simulation model of a PVT-HP system. By means of numerical simulations, with simulation program TRNSYS, the energetic performance of a PVT-HP system and the system components are investigated. It is shown that the PVT-HP can cover the annual energy demand of a residential building. The corresponding Seasonal Performance Factor (SPF) is equal to 3.6. Furthermore, the effect of varying weather conditions, occupancy and building orientations on the performance of the reference system is analyzed. The SPF for the investigated scenarios varies between 3.0 and 3.9. Lastly, two system parameters, the PVT collector area, and the PVT collector type are varied as an initial step in the optimization of the system performance. To sum up, the presented PVT-HP model is suitable for dynamic system simulation and the exploration of the system concepts. The simulation study shows that a PVT-HP system can cover the annual energy demand of a residential building. Lastly, parametric variations showcase the optimization potential of PVT-HP systems.

1. Introduction

Climate change, with all the associated negative consequences, is the main driving force behind the global transition from fossil fuels to renewable energy sources. Globally, buildings generate nearly 40% of the annual global greenhouse gas emissions [1]. In the Netherlands, 13% of the national CO2 equivalent emissions are from the use of natural gas in the built environment [2]. The majority of the eight million households are connected to the natural gas infrastructure and use natural gas for space heating, the generation of domestic hot water and to a lesser extent for cooking. Most of the natural gas is recovered from the Groningen gas fields, which in the past decade has led to increasingly frequent and significant earthquakes in the Northern Province of Groningen. The adverse impact of the use of natural gas has made the Dutch government decide that by 2050 the built environment should be free of natural gas. In addition, as of July 2018, new buildings are in general no longer allowed to use natural gas [3]. The building sector in the Netherlands is thus standing on the threshold of a major transformation of its energy paradigm.
Typically, a distinction is made between three main alternative directions for replacing natural gas as the main energy source in the built environment. The first option is to replace natural gas with green gas, such as biogas and hydrogen. Hereto, albeit to some extent modified, existing gas infrastructure can be used. The second option is to connect a building to a heat grid. A heat grid is used to supply heat, for instance, waste heat from industrial processes, directly to a building. The third option is to use electricity to drive heat pumps for heating purposes.
All-electric systems are particularly interesting in newly built dwellings or well-insulated buildings which allow an efficient operation of a heat pump. In general, the heat pump draws energy from the air or from the ground. Refs. [4,5] have performed simulation studies on air- and ground-source heat pumps. A less common but promising alternative is to use a hybrid solar collector, also known as PVT collectors, as the main energy source for heat pumps. PVT collectors generate both thermal and electrical energy, using solar energy and ambient energy. Previous research has shown that PVT can improve the system performance of ground source heat pump systems. For instance, Bertram et al. investigated the performance of unglazed PVT collectors as an additional heat source in a heat pump system with a borehole heat exchanger [6]. Sakellariou modeled a PVT based solar assisted ground source heat pump system and performed a sensitivity analysis on six parameters on the energy conversion side of the system [7]. However, ground source systems impose requirements on the ground characteristics and are rather expensive as a consequence of the drillings costs and the ground installation. Other research has pointed towards the potential of using PVT collectors as the primary energy source of the heat pump [8]. Several scholars have investigated the performance of PVT-HP systems in utility buildings. Vallati et al. investigated, by means of MATLAB simulations, the performance of PVT-HP systems for small offices located in three different European Cities. The research concluded that there is a good potential for supporting heat pump based PVT heating systems [9].
In the light of the quest for an alternative to natural gas as the primary energy source in the built environment, together with the fact that PVT-HP systems are a promising alternative, the Solar Energy Application Centre (SEAC) initiated the PVT inSHaPe project. In this project, a broad consortium of partners aims to design, realize, and validate several PVT-HP systems. Despite the potential of this concept, knowledge on the integration of the system components is missing. Hereto, a simulation model is constructed and used to analyze and optimize the performance of PVT-HP systems and ultimately to compare the system performance with alternative systems and promote the market diffusion of PVT-HP systems.
In the next section (Section 2) the PVT-HP system and the system model (Section 3) are described. In Section 4, the method of analysis of the system performance is elaborated upon, including the key performance indicators. This is followed by an overview of the simulation cases (Section 5). The simulation results are discussed in Section 6. Finally, Section 7 presents the main implications of this work and discusses directions for future research.

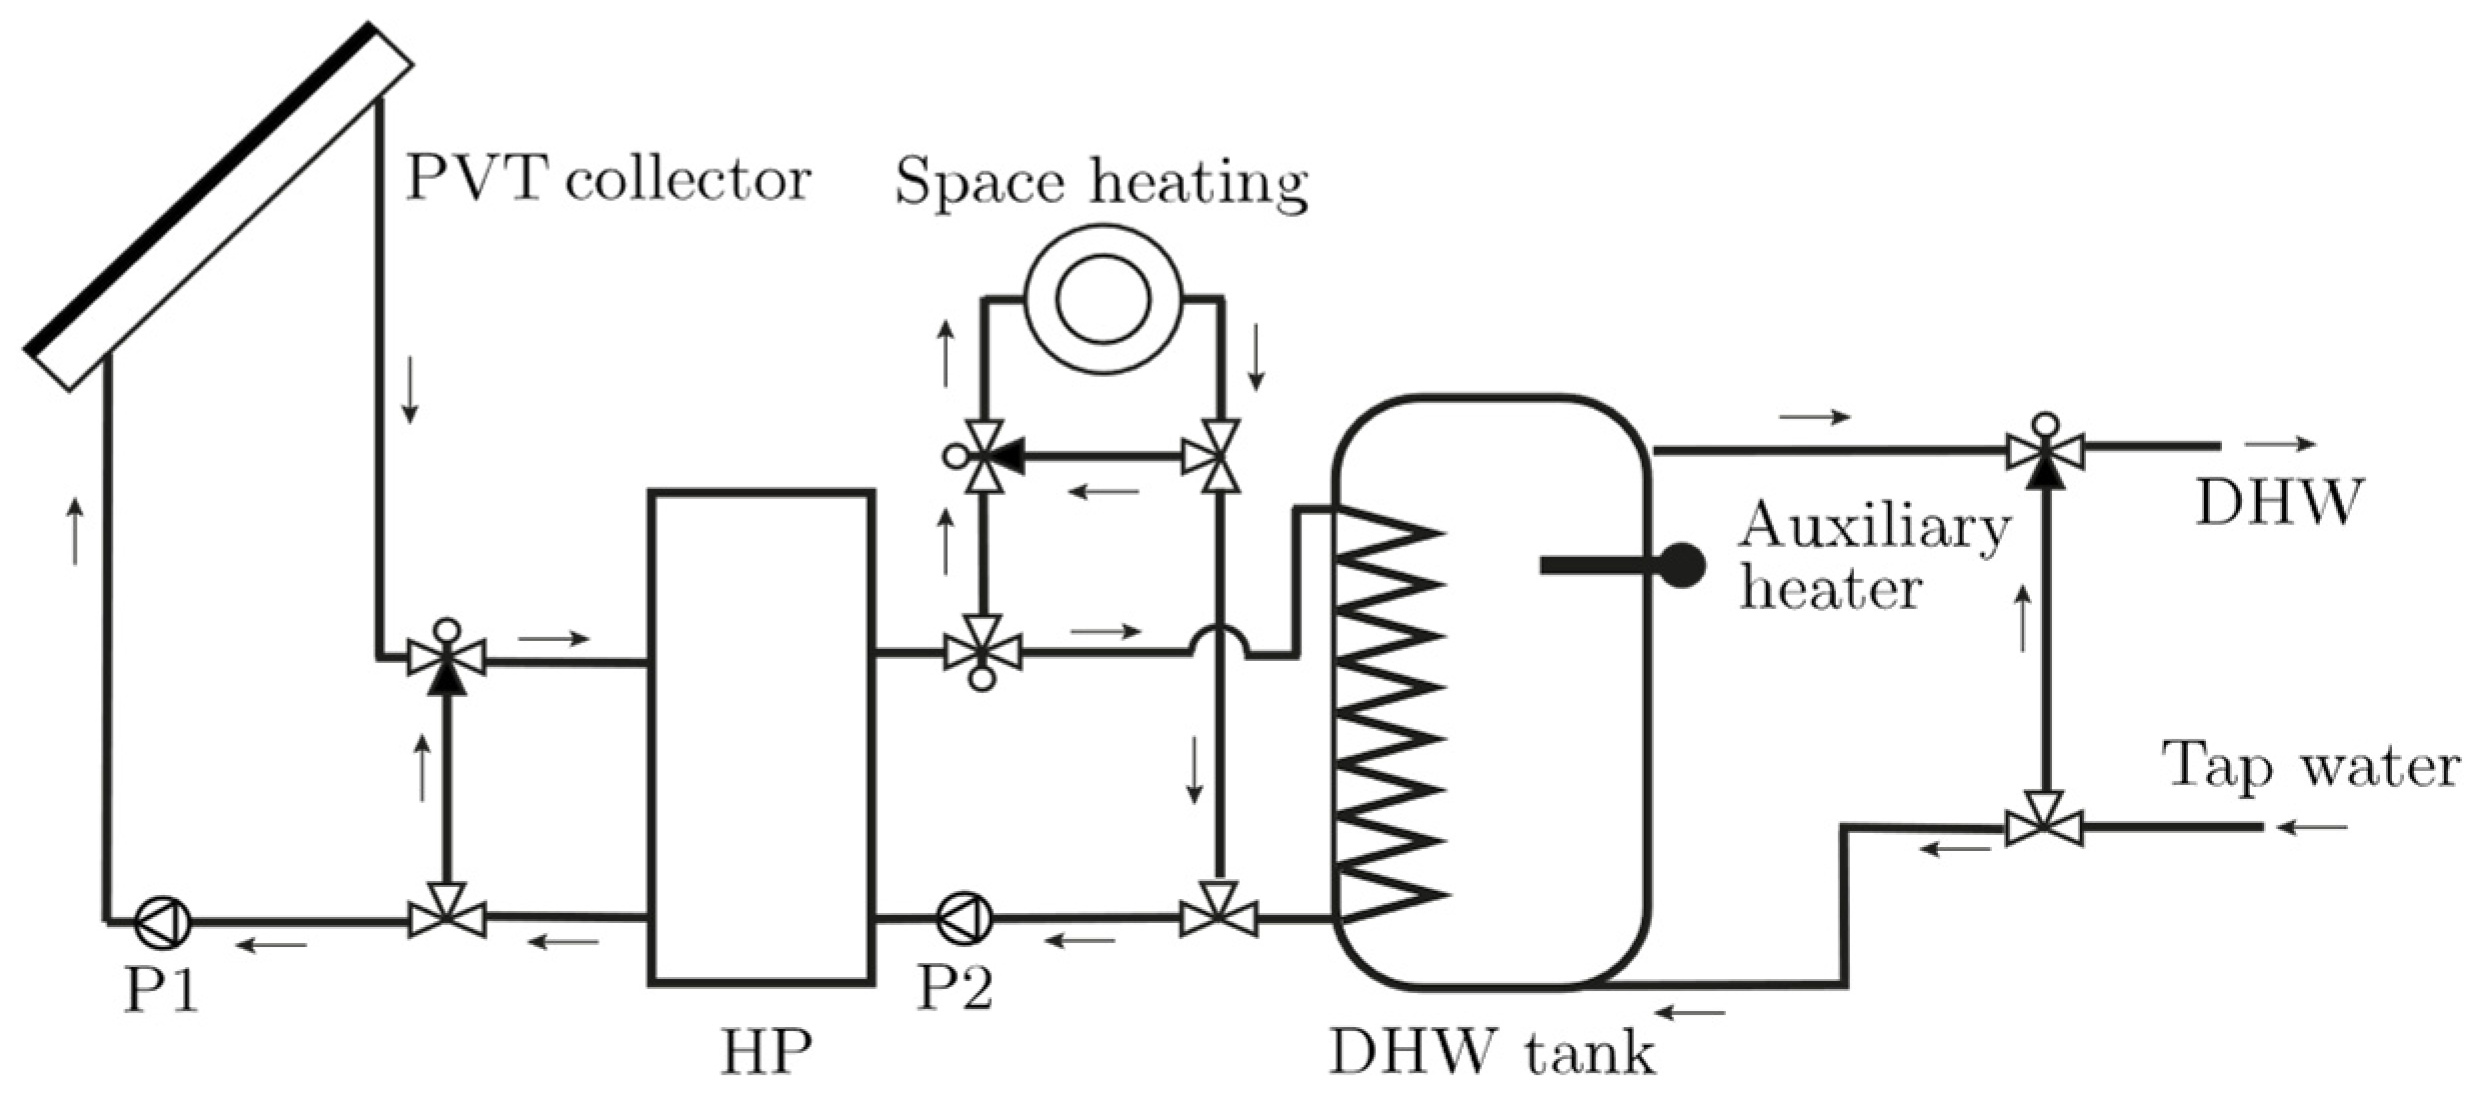
2. System Description

Figure 1 illustrates the hydraulic system design. The PVT collectors can collect solar irradiation, but they can also act as a heat exchanger and collect heat from the surrounding air. The thermal energy collected by the PVT collectors flows to a glycol-water mixture. Then, a pump drives the heated fluid to the source side of the heat pump. The heat pump extracts energy from the fluid after which the process described above is repeated in case there is a demand signal, and the operating limits of the system are not violated. The temperature of the fluid supplied to the heat pump is restricted to a specific maximum temperature. To prevent overheating, the source-side loop holds a bypass valve. In case the fluid temperature approaches the threshold, the heated fluid from the PVT collectors is mixed with the cold fluid that returns from the heat pump.
The heat pump extracts energy that is collected by the PVT collectors and supplies it, at a proper temperature level, to the fluid (water) in the load-side loop. In doing so, the heat pump consumes a small amount of electricity, about a quarter compared with the thermal energy output. The heated fluid is either supplied to the space heating system of the building or used to charge the DHW tank. In case there is a demand for DHW, water is extracted from the top of the tank. Tap water enters at bottom of the tank to replenish the tapped DHW. The draw-off loop includes a bypass valve. The bypass valve opens if the temperature of the fluid that leaves the tank is higher than the required DHW temperature.
Although not included in the hydraulic scheme of the PVT-HP system, the HP has an internal electrical backup heater. In case the heat pump is not able to cover the space heating demand, this backup heater switches on and thereby prevents uncomfortable conditions in the building. For similar reasons, the DHW tank also holds a backup heater to ensure that the DHW demand is met when the HP is not able to do so. Finally, the entire fluid volume in the DHW tank is heated once every week to a temperature of at least 60 °C to prevent legionella growth in the tank.

3. Simulation Models, Boundary Conditions and System Design

3.1. Simulation Models and Parameters

The behavior of the PVT-HP system is simulated with the use of TRNSYS 17 [10]. Table 1 lists the simulation models, available in TRNSYS, of the main system components. Below the characteristics of the system components are discussed in more detail.

3.2. Boundary Conditions

3.2.1. Weather Data

The Central European climate conditions in De Bilt, a municipality found in the center of the Netherlands, serve as a reference. Typical Meteorological Year 2 (TMY2) climate data is obtained from the METEONORM database [14]. This climate data closely matches the long-term average climate conditions for the location under consideration. The time resolution of the climate dataset is one hour. The adopted timestep is one minute which means the simulation model uses interpolated climate data. Table 2 lists the weather characteristics of the Central European climate in De Bilt.
The sensitivity of the system performance towards the climate conditions is investigated. Hereto, eight alternative weather scenarios are investigated. A distinction is made between four different locations spread over the Netherlands. In addition, both historical and forecasted climate data are considered. The former refers to TMY2 climate data, the latter refers to climate data according to the IPCC B1 scenario [15].

3.2.2. Building

The PVT-HP system performance is assessed against a well-insulated terraced house, which is illustrated in Figure 2.
The interior building plot area is equal to 40.8 m². The total interior volume of the three building floors is equal to 330 m³. The ground and the first floor are equipped with a floor heating system, which results in a heated floor area of 91.6 m². The third floor, the attic, is a passive zone that is not actively heated. Table 3 contains the key geometrical characteristics of the reference building.
The building is well-insulated and represents a newly built house. The adopted R- and U-values, listed in Table 4, are in line with the minimum required values by the Building Decree in the Netherlands [16].
Figure 3 is a schematic of the construction of the floor heating system which is installed on both the ground and first floor. The top floor layer is a 0.11 m thick cement screed layer with pipes at a depth of s = 0.07 m. The pipes have an outer diameter of D = 0.015 m, a wall thickness of 0.002 m and a wall conductivity of 0.35 W m−1 K−1. The pipe spacing is T = 0.12 m.
The building is not actively cooled. However, external shading devices must reduce overheating that results from solar gains. The shading devices are activated if the Global Horizontal Irradiation (GHI) is higher than 300 W m−2. If activated, the shading device is deactivated, or opened, in case the GHI drops below 50 W m−2. The minimum time the shading device is activated is set to 2 h to prevent frequent opening and closing of the shading devices.
Infiltration and ventilation ensure acceptable air quality in the building. The adopted infiltration rate at the ground and first floor is equal to 0.2 Air Exchanges per Hour (ACH). The infiltration rate at the attic is 0.3 ACH. The adopted ventilation rate is equal to 40 m³ h−1. In case two occupants are present, the ventilation rate corresponds with 0.7 ACH. The ventilation rate scales down to 0.2 ACH in case no occupants are present. The ventilation system includes a heat recovery device with an assumed effectiveness of 70%. To prevent overheating, the heat recovery device is bypassed in case the ambient temperature is higher than 22 °C.

3.2.3. Occupancy

Occupancy has a significant impact on the domestic energy demand [17]. Therefore, different occupancy scenarios are considered. A distinction is made in the number of occupancies, the occupancy profile, and the occupancy preferences.
The study considers a two- and a four-person household. Next to that, three different occupancy profiles are taken into account, which is referred to as the reference (REF), mostly at home (MH) and the mostly away (MA) profile (Appendix A). The temperature settings for the different occupancy scenarios are listed in Table 5.
The occupancy profiles contribute to internal heat gains. For practical reasons, a distinction is made between the metabolic heat gain, the heat gain from lighting equipment and the heat gain for appliances. Table 6 lists the maximum specific heat gains from appliances.
In case no occupants are present, the standby load for the ground and first floor is 100 W and 50 W, respectively. The specific heat gains from appliances are calculated by multiplying the maximum value with the occupancy factor, which is defined as the ratio between the number of occupants present at the building zone and the maximum number of occupants (Appendix A).
The installed capacity of lighting equipment is equal to 3 W m−2. The lights on the ground floor are on between 4 and 12 PM and when occupants are present; on the first floor, lights are on between 6:30 AM and 9 AM and if occupants are present. The sensible metabolic heat gain from occupants present on the ground floor is 75 W. Due to the lower activity level, the sensible metabolic heat gain from occupants present on the first floor is 60 W. The internal gains are transferred to the building via different heat transfer processes. The internal heat gains from lighting equipment are transferred through convection, while 70% of the metabolic heat gains are transferred through convection and the remainder through radiative processes. Lastly, the internal heat gains from appliances are distributed evenly among convective and radiative heat transfer processes.

3.2.4. Domestic Hot Water Profile

DHWcalc, a software tool, is used to generate domestic hot water profiles [18]. DHWcalc distributes DHW draw-offs over the year by statistical means. Hereto, different so-called draw-off categories are defined of which the characteristics are listed in Table 7. The daily equivalent draw-off volume, at a temperature of 60 °C, is 40 L per occupant. Under the assumption of a tap water temperature of 10 °C, this corresponds with a daily energy demand for DHW of 2.3 kWh per occupant. For a four-person household, this implies that the daily DHW demand is thus equal to 160 L at a temperature of 60 °C, which corresponds to 9.3 kWh.

3.3. System Design

3.3.1. PVT Collector

In this study, three different PVT collectors from three different manufacturers are considered. The three manufacturers are all involved in the PVT inSHaPe project and made their products available for testing. In the outdoor SolarBEAT test facility located at the Eindhoven University of Technology, the PVT collectors are tested and characterized under quasi-dynamic conditions. The experimental characterization is described in detail by Psimmenoy [19]. The experimental results are reflected in the adopted parameters of the PVT model. The latter consists of separate models for the PV panel (Type 835) and for the thermal collector (Type 832) are used to model these PVT collectors. The models of the PV panel and the thermal collector are linked via a thermal network that connects the cell temperature of the PV panel to the temperature of the thermal collector, which is assumed to be equal to the fluid temperature. The electrical and thermal model and the link between these models is described in detail by Jonas et al. [11]. The electrical and thermal performance characteristics are listed in Table 8 and Table 9.

3.3.2. Heat Pump

The heat pump is, together with the PVT modules, the key part of the system. A brine/water heat pump—type Vitocal 300-G, BW(S) 301.B06—manufactured by Viessmann is adopted in this study. The rated operating conditions and the corresponding performance characteristics are shown in Table 10.
The minimum flow rate at the respective source and load side are 860 kg h−1 and 520 kg h−1. In addition, the heat pump is bound to operating temperature limits. The respective minimum and maximum operating limits for the temperature of the glycol-water mixture entering at the source side of the heat pump are −10 and 30 °C. At the load side, the maximum allowed water temperature is 65 °C. Figure 4 illustrates the COP as a function of the fluid inlet temperatures at the source and load side of the heat pump. Refer to Section 4.3 for the definition of the COP. The performance data inside the red rectangle is obtained through linear interpolation of catalog data provided by the HP manufacturer. To use the catalog data in the numerical study, however, performance data outside the range of operating conditions for which the manufacturer specified performance data is required. For one, because the DHW and hence the fluid in the DHW tank must be heated up to at least 60 °C. Consequently, the performance data outside the red rectangle is obtained via linear extrapolation of performance data provided by the manufacturer. Finally, it should be noted that the performance data is normalized with respect to the rated conditions such that it can be used to model an HP with a different rated capacity than for which the performance data, listed in Table 10, was retrieved.

3.3.3. Domestic Hot Water Storage Tank

Figure 5 is a schematic representation of the DHW tank. In addition, Table 11 lists the geometrical features. The DHW tank is connected to the heat pump via a helical tube heat exchanger. A backup heater is installed to ensure a sufficiently high temperature in the upper region of the tank and serves as a backup in case the heat pump cannot meet the DHW demand. The regulation of the backup heater is carried out by a temperature controller, which is installed at a relative height of 0.90. If the backup heater is previously turned off, the heater stays off until the temperature at the controller drops below 50 °C. Conversely, if the heater is previously turned on, it stays on until the temperature at the controller reaches 55 °C. The heat loss capacity rate from the storage to the environment is assumed to be 1 W K−1. Under the assumption that the environmental temperature, e.g., the air temperature in the attic, is 15 °C and the average fluid temperature is 55 °C, the corresponding annual heat loss is in the order of 350 kWh. Lastly, it is noted that the tank losses are assumed to be a factor 1.3 higher for the DHW tank with a volume of 250 L (four-person household).

3.3.4. Secondary System Components

The PVT-HP system includes two electrical backup heaters. The internal heater of the heat pump serves as a backup to prevent uncomfortable conditions in the building. The backup heater in the DHW tank ensures a sufficiently high DHW temperature. The capacity of both backup heaters is 3 kW.
The system includes two pumps. The first pump is installed in the source side loop and has a rated flow rate of 75 kg h−1 m−2, which is based on the specifications according to the PVT manufacturer and meets the HP requirements. The second pump is installed in the load side loop and the flow rate is set such that the temperature difference over the load side connections of the heat pump is equal to 7 °C if the heat pump is operating under the rated conditions. For a rated HP capacity of 4 kW, the corresponding load side mass flow rate is equal to 690 kg h−1. Lastly, the electricity consumption of both pumps is assumed to be constant and equal to 25 W. The standby electricity consumption is considered to be negligible. The same applies to the energy transfer between the pumps and the fluid.
Pipes are used to transport the fluids in the PVT-HP system. The temperature difference between the air surrounding the pipes and the fluid inside the pipes leads, in general, to energy losses and in exceptional cases to energy gains. To avoid transmission losses, the pipes are insulated and a heat transfer coefficient of 0.5 W m−2 K−1 is assumed. For practical reasons, the model contains four pipes that are connected to the four connections of the heat pump. The equivalent pipe length which is exposed to losses is 5 m for all pipes. For the pipes in the source side loop, the surrounding air temperature is assumed to be the annual average air temperature, which is 9.5 °C for de Bilt. The surrounding air temperature for the pipes located in the load side loop is 15 °C which is assumed to approximate the annual average air temperature in the attic, where the DHW tank is located.
Finally, the efficiency of the inverter is 95%. The energy consumption of all controllers in the system is assumed to be constant and equal to 5 W.

3.3.5. System Dimensioning

The key system dimensions are the PVT collector area, the heat pump capacity, and the volume of the DHW tank. The heat pump capacity is selected based on the peak demand for space heating. The selection of the heat pump capacity based on the peak demand for DHW would namely not be cost effective as the capital expenditures increase significantly with higher heat pump capacities. Instead, a DHW tank is used to be able to cover the gap between the peak demand for DHW and the maximum heat pump capacity.
The peak demand for space heating is calculated with a static maximum heat loss calculation in which the static heat demand of the building is calculated under rather extreme conditions. TRNSYS is used to perform this calculation for the set of conditions listed below:
  • Ambient air temperature: T a m b = 10 °C
  • Boundary temperature of the partition walls between adjacent building: T b d r y = 15   °C
  • Infiltration rate: 0.5 ACH
  • Setpoint temperature: 21 °C
The corresponding peak demand for space heating is calculated to be 3.5 kW. In line with this value, a heat pump with a rated capacity of 4 kW is selected. The corresponding rated source and load side temperature are 0 and 35 °C, respectively. In turn, the capacity of the HP is the determining factor in the dimensioning of the PVT collector area. The PVT collector must have enough capacity to act as a source for the heat pump. However, the capacity, or thermal yield, from the PVT collector is the result of an interplay between the collector characteristics, the environmental conditions, the heat pump characteristics, and the control strategy. Together with the fact that the PVT collector is responsible for a significant share of the investment costs, this makes it an interesting design parameter. For this reason, the effect of the PVT collector area on the system performance is investigated in the parametric analysis. In the reference case, an area of 6 m2 per kW installed HP capacity is adopted. The DHW storage volume is selected based on the household consumption and the behavior of the occupants. In line with values found in the literature, the storage volume for the two-person household is 175 L and the storage volume for the four-person household is 250 L [21].

3.3.6. System Control

The control strategy is a decisive factor for the system’s performance. In this study, a straightforward control strategy is adopted. The air temperature in the ground and first floor, which are equipped with a floor heating system, are monitored to determine whether there is a space heating demand. The fluid temperature in the DHW tank is monitored for two reasons: to determine whether or not the tank must be charged and to fulfill the legionella prevention function. On top of that, the operating limits of the heat pumps are protected and, if necessary, the backup heaters are activated to be able to cover the demand when the heat pump is not able to do so. A distinction is made between eight different operating modes which are listed in Table 12.
Mode 1 is the standby mode in which the system is turned off and does not supply thermal energy. In case the sensor in the DHW tank signals that the temperature in the DHW tank drops below T L = 45   °C, a signal is sent to the controller. If possible, i.e., the operating limits of the HP are not violated, the system is operated in Mode 2 and the tank is charged. As shown in Figure 6, the charging stops when the upper temperature limit T H = 55   °C is reached. Once a week, the upper temperature limit is increased to T H , l e g = 63 °C to eliminate, and prevent the growth, of the legionella bacteria in the DHW tank.
In Mode 3 up to Mode 5 thermal energy is supplied to the floor heating system of one or both floors. A two-stage room thermostat monitors the temperature on the ground and first floor. Figure 7 is a control schematic of the two-stage room thermostats. The first stage of the thermostat turns on when the air temperature drops below the lower threshold. In general, the charging of the DHW tank (Mode 2) has priority over the supply of space heating (Mode 3 up to and Mode 5). Hence, in case the system runs in Mode 2, and the DHW tank is charged, and the first stage of one or both of the room thermostats is activated, the system will remain to be operated in Mode 2. However, if the air temperature in the building continues to drop and the lack of space heating threatens to lead to uncomfortable conditions, the second stage of the room thermostat is activated. If the latter is true and the second stage of a room thermostat is activated, the space heating (Mode 3 up to and Mode 5) has priority on the charging of the DHW tank (Mode 2). Finally, in case there is a space heating demand, the second stage of one or both thermostats is activated and the operating conditions at the HP pump are outside the operating limits, the internal backup heater of the HP turns on and supplies space heating to the building (Mode 6 up to and Mode 8).

4. Key Performance Indicators and Method of Analysis

The focus of the performance analysis lies with the energetic performance. Figure 8 Illustrates relevant energy flows to and from and inside the system [22].

4.1. Seasonal Performance Factor

The Seasonal Performance Factor (SPF) is a dimensionless measure of the energy efficiency of the PVT-HP system. The SPF is the ratio of the useful thermal energy output of the system to the electrical energy input to the system:
S P F s y s = ( Q ˙ S H + Q ˙ D H W ) · d t P s y s · d t  
where Q ˙ S H and Q ˙ D H W the respective space heating and domestic hot water demand. P s y s is the electrical energy input to the system which consists of multiple contributions:
P s y s = P H P + P a u x + P p u m p s + P c n t r l  
where P H P and P c n t r l the electricity demand from the HP and the controllers, respectively. The electricity demand of the pumps, P p u m p s , has separate contributions from both pumps in the system:
P p u m p s = P p u m p s , S S + P p u m p s , L S  
The same holds for the electricity demand of the backup heaters in the HP and the DHW tank:
P a u x = P a u x , S H + P a u x , D H W
A more detailed insight in the system performance is obtained through the definition of the SPF for the generation of domestic hot water and the SPF for space heating:
S P F i = Q ˙ i · d t P e l , i · d t  
where the subscript i is replaced with DHW in the former case and with SH in the latter. Finally, the corresponding electricity consumption is given by the following equation:
P e l , i = { P H P + P a u x , i + P p u m p s   Q ˙ i > 0 0 Q ˙ i 0  

4.2. On-Site Energy Fraction and On-Site Energy Matching

The On-site Energy Fraction (OEF) and On-site Energy Matching (OEM) are measures of the respective self-sufficiency and self-consumption of the PVT-HP system. The OEF stands for the fraction of electrical energy demand that is covered by on-site generated electricity from PV panels. The OEF is calculated using the following equation:
O E F =   M I N [ P P V T ; P s y s ] · d t t 1 t 2 P s y s · d t   .
From the supply perspective, the OEM represents the fraction of the on-site generated electricity that is used directly on-site:
O E M = M I N [ P P V T ; P s y s ] · d t   P P V T · d t   .

4.3. Performance Indicators of the Key System Components

4.3.1. PVT Collectors

Next to the thermal and electrical yield, the fluid temperatures of the PVT collectors are analyzed. The weighted inlet and outlet fluid temperatures, T ¯ P V T , i n and T ¯ P V T , o u t , are calculated using the thermal yield from the PVT modules,   Q ˙ P V T , as weighing factor:
T ¯ P V T , i n = Q ˙ P V T · T P V T , i n · d t Q ˙ P V T · d t .
The difference between the fluid outlet temperature and the environmental air temperature provides an insight into the extent to which the PVT collectors capture and collect energy from sunlight or, in other words, in the contribution of the energy captured in the environmental air to the thermal yield.

4.3.2. Heat Pump

The energetic performance of the heat pump is assessed by the Coefficient of Performance:
C O P = Q ˙ H P , o u t P H P ,
where Q ˙ H P , o u t the thermal output from the heat pump that is delivered to the fluid stream at the load, or condenser, side. P H P is the electrical energy input to the heat pump. Under rated conditions, the COP of the heat pump is equal to 4.6 (Table 10). The COP, however, depends on the operating conditions and is preferably as high as possible. The investigate the effect of the operating conditions, such as the fluid temperature from the PVT collector, on the heat pump performance over a specific period, the so-called Seasonal Coefficient of Performance (SCOP) is defined:
S C O P = Q ˙ H P , o u t · d t P H P · d t .
Note that the term ‘seasonal’ might be considered misleading since the adopted integration periods are months.
The effect of the operating conditions on the heat pump performance is analyzed through the—weighted—inlet fluid temperatures of the heat pump. The weighted inlet fluid temperature at the source side, or evaporator side, of the heat pump, is defined as follows:
T ¯ H P , S S , i n = Q ˙ H P , o u t   · T H P , S S , i n · d t Q ˙ H P , o u t · d t .
After replacing the inlet source side temperature T H P , S S , i n with the inlet load side temperature T H P , L S , i n , the weighted inlet temperature at the load side is calculated in the same way.
As explained before, the heat pump performance data provided by the heat pump manufacturer is extended for a wider range of operating temperatures through linear extrapolation. The extension of the performance data, however, is considered as one of the dominant sources of uncertainty in the simulation results. This uncertainty grows when the operating conditions are further away from the range of operating conditions for which manufacturer data is available. To get an insight into the operating conditions under which the heat pump operates, a heat map is generated in which the operating hours are plotted against the weighted fluid temperatures. Lastly, the on/off cycles of the heat pump are monitored. On/off cycling namely leads to wear of the heat pump and must thus be minimized to extend the lifetime of the heat pump.

4.3.3. Comfort in the Building

The PVT-HP system is designed to maintain comfortable conditions in the building. To ensure that this requirement is met, the indoor air temperatures are monitored and compared with the setpoint temperatures. In addition, the floor surface temperatures at the ground and first floor, which are both equipped with a floor heating system, are monitored. The maximum allowed floor surface temperature is 29 °C due to medical and comfort reasons [23].

5. Simulation Cases

5.1. Reference Case

The system behavior is simulated for the period of one year at a timestep of one minute. Table 13 contains the key features of the reference system design and the corresponding boundary conditions.

5.2. Scenario Analysis

Next to the reference case, multiple scenarios are defined in which the effect of both varying boundary conditions and system parameters is investigated. Firstly, the climatic conditions are varied. Four different locations, spread throughout the country, are considered. On top of the location, a distinction is made between the current climate, which is based on climate datasets, and a future scenario. Secondly, six different occupancy scenarios are considered. ‘The difference between the occupancy scenarios is reflected in the—three different—occupancy profiles and in the distinction between a two- and four-person household. Thirdly, the orientation of the building is varied, which affects the space heating demand and, in turn, the system’s performance. Lastly, the effect of two system parameters: the PVT collector type and the PVT collector area on the system’s performance is analyzed. With the reference case as the starting point, the Dimark collector is replaced with the ExaSun and with the SolarTech collector. The same reasoning holds with respect to the PVT collector area, of the Dimark collector, which is varied between 5 and 35 m² with increments of 5 m².

6. Simulation Results

6.1. Reference Case

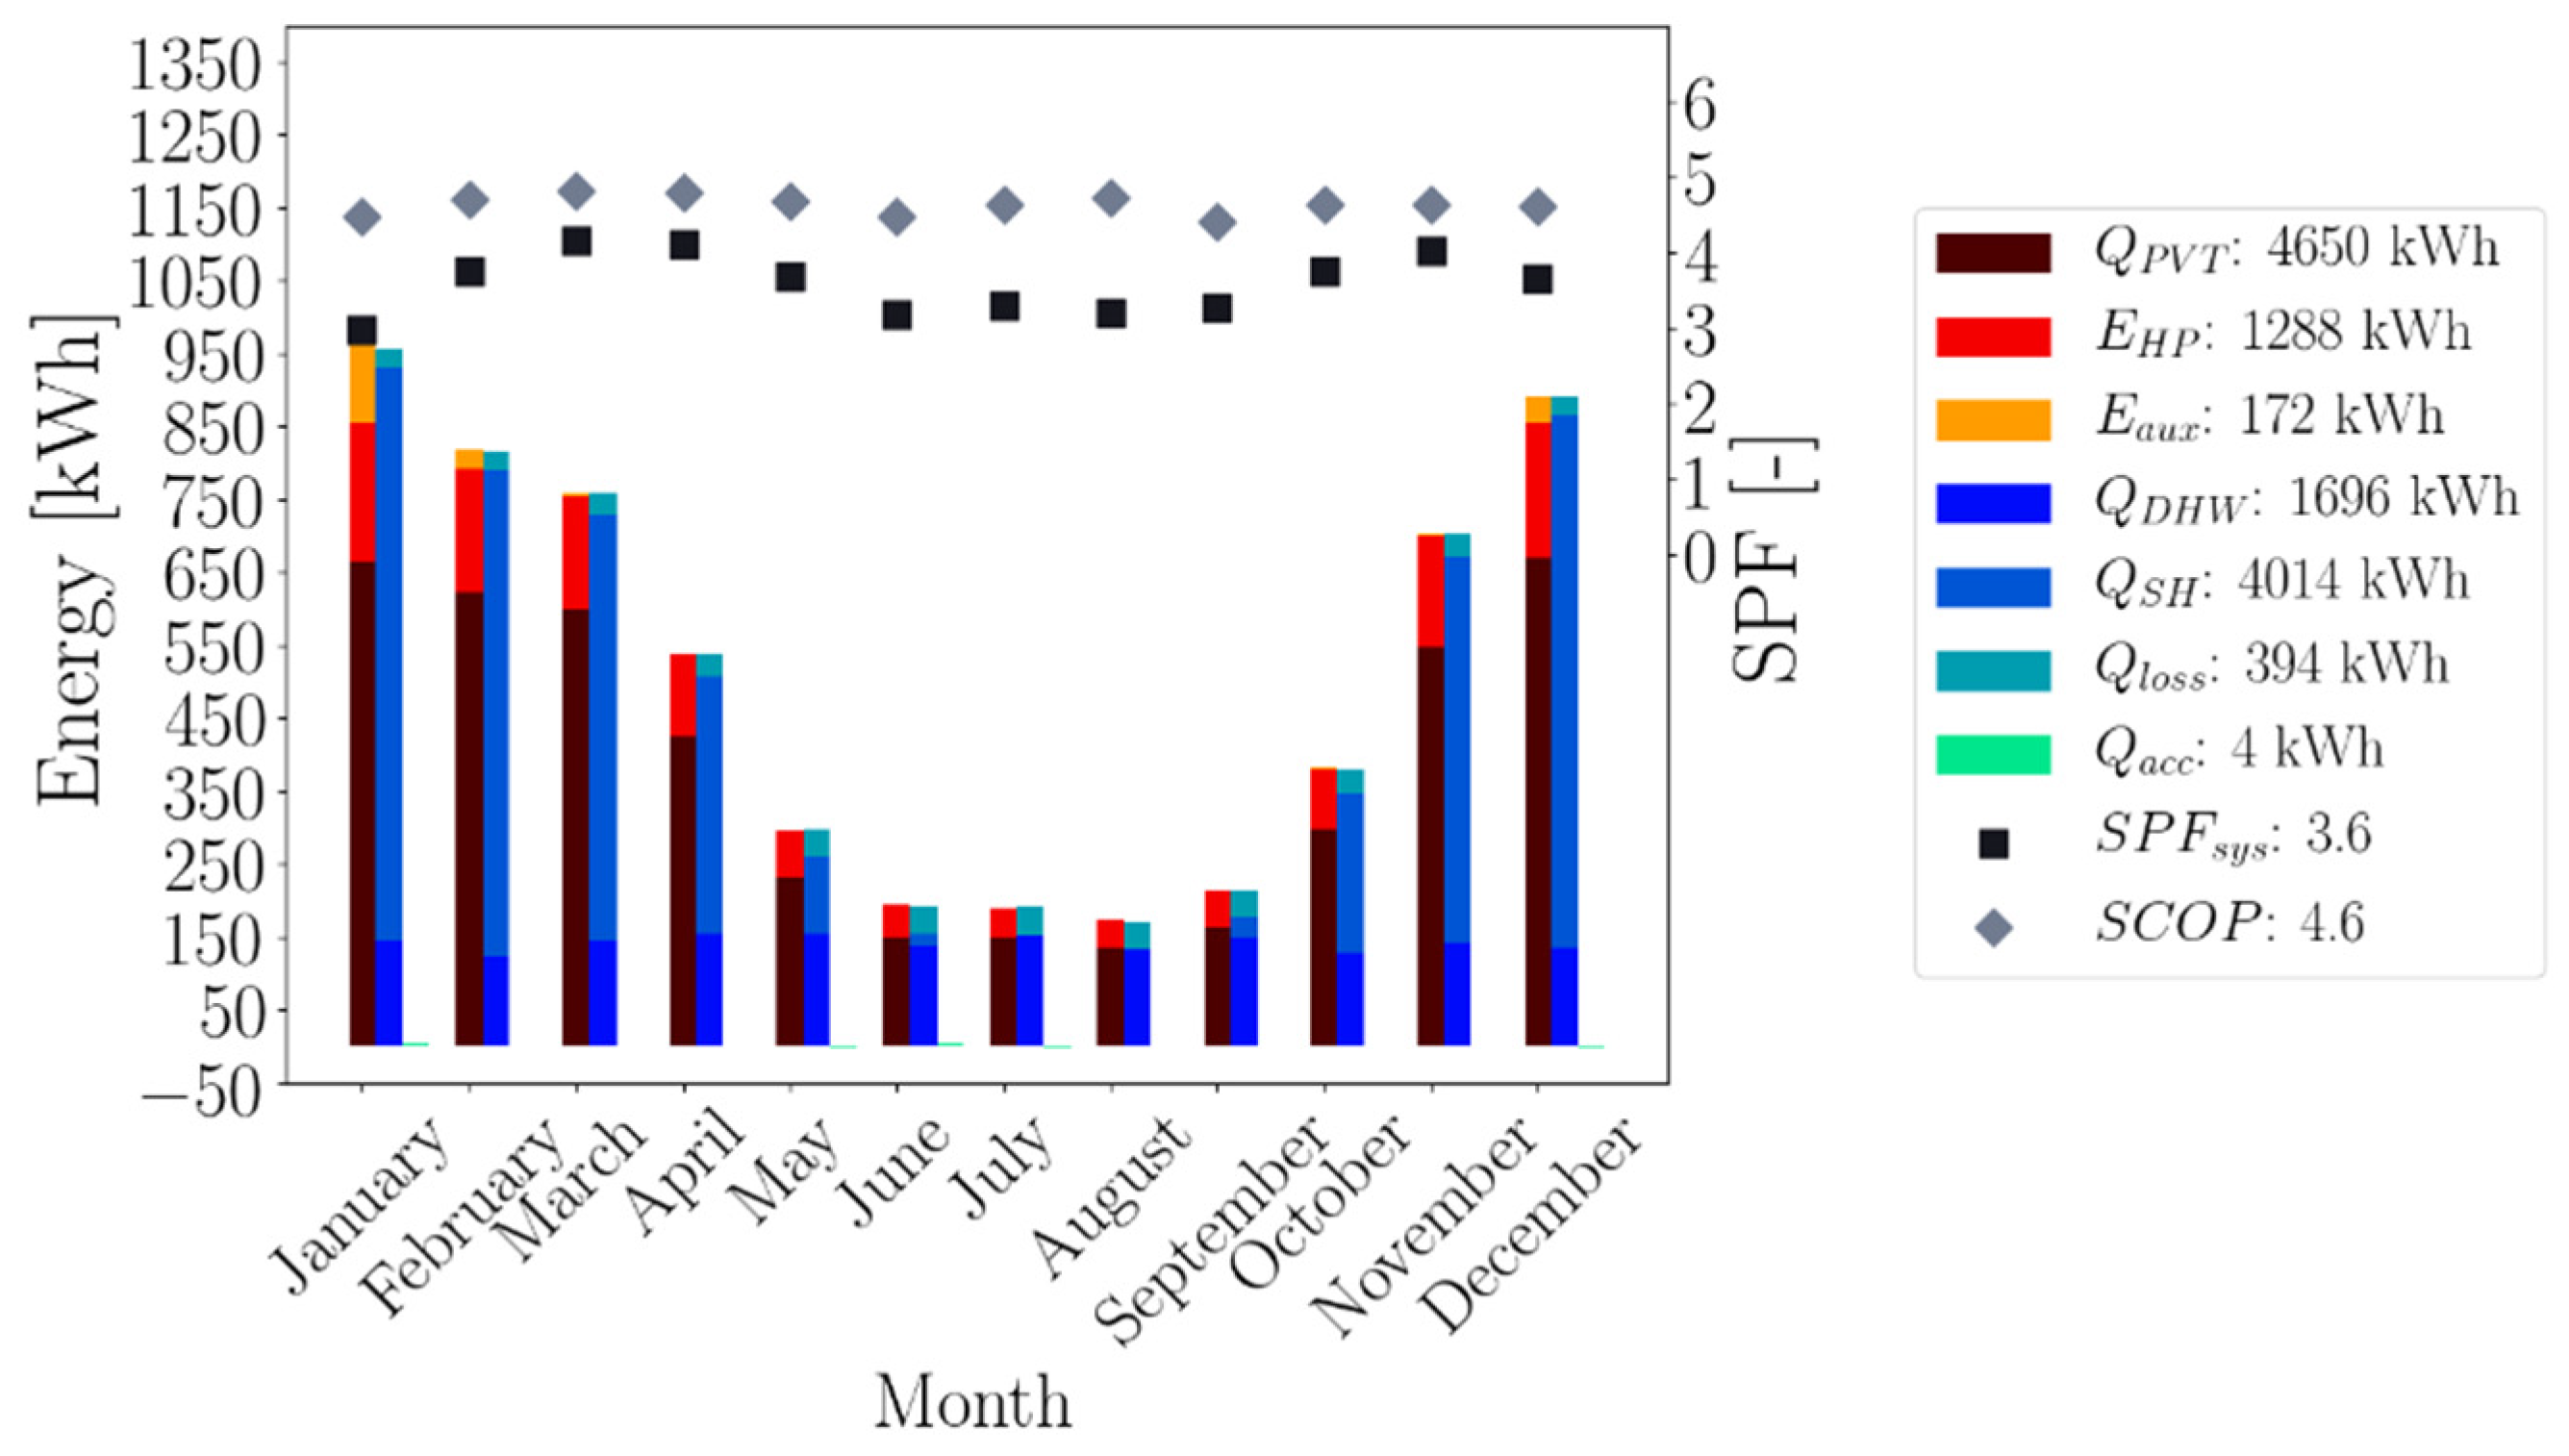
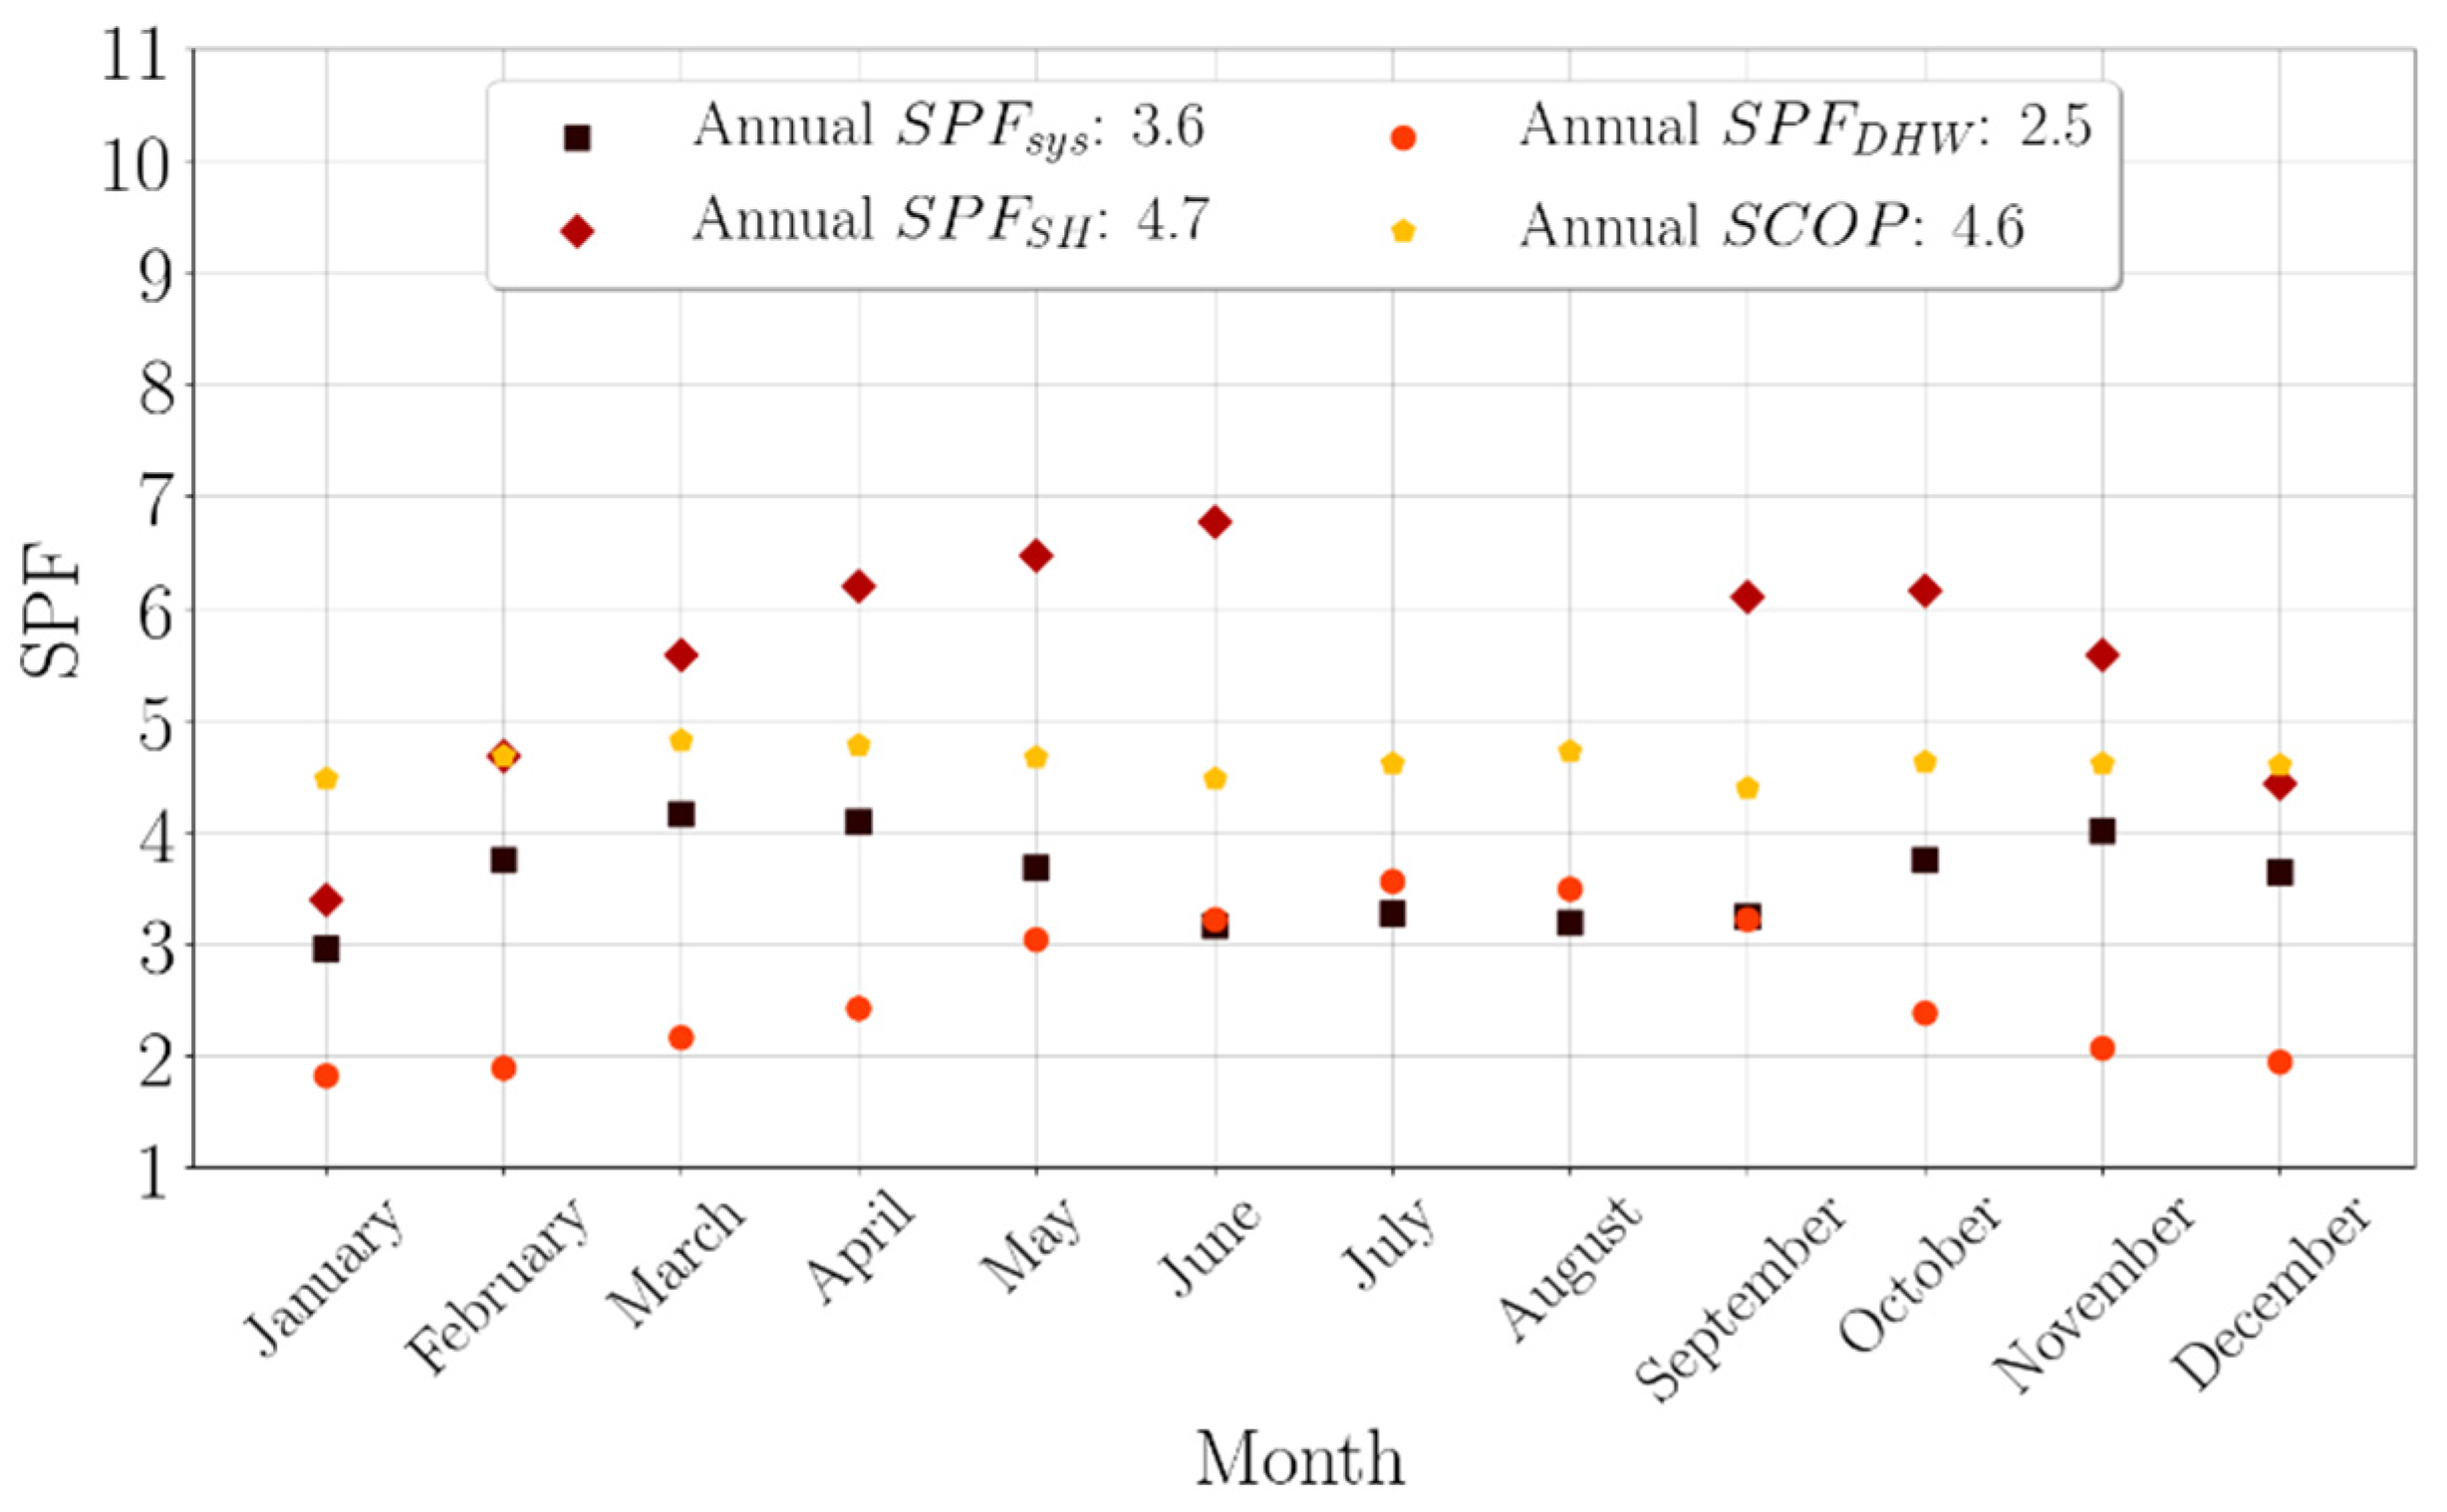
6.1.1. System Performance

Figure 9 is an overview of the annual energetic performance of the PVT-HP system for the reference case. The energy balance is satisfied as the mismatch between the supply and demand is equal to 2 kWh, which corresponds with 0.1%. On an annual basis, the respective S C O P and the S P F are 4.0 and 3.6. Figure 10 shows the monthly values for the S C O P and the S P F s y s . The SPF of the system, S P F s y s , is a combination of the S P F that includes the supply of domestic hot water, S P F D H W , and the S P F for space heating, S P F S H . The S P F for the supply of domestic hot water increases in the course of the year and reaches a maximum value of 3.5 in the month of July. Subsequently, the S P F D H W gradually declines again, until it reaches the minimum value of 2.0 in December.
An analysis of the monthly average fluid temperatures in the DHW tank shows that the supply temperature from the DHW tank to the heat pump is approximately constant throughout the year. In contrast, the supply temperature from the PVT collectors is relatively high in the summer season due to high air temperatures and irradiation levels compared with the winter period. As a result, the heat pump operation is more efficient in the summer period, which in turn leads to an increase in the SCOP and the S P F D H W . A similar declaration can be made with respect to the development of the S P F S H throughout the year. Note that the energy demand of the internal backup heater of the heat pump explains the break in the trend for S P F S H in January.
The performance factors for space heating are higher than for the supply of domestic hot water. This is a consequence of the fact that the heat pump operation is more efficient for the lower load side fluid temperatures required for space heating than for DHW. Weighted with their respective contributions of space heating and domestic hot water to the total energy supply, the S P F S H and S P F D H W add up to the performance factor of the system. In the winter, the contribution of space heating demand is relatively high. In contrast, the contribution of the space heating demand is nil in the summer which results in a S P F s y s close to S P F D H W . The S P F s y s is slightly lower as S P F D H W because it includes the energy demand of the system controllers. Lastly, it is noted that the SCOP follows a similar pattern of the S P F s y s , it is, however, slightly higher as it does not include system losses such as thermal losses from the DHW tank.
Figure 11 is an overview of the net annual electricity flows between the system, the building, and the grid. The annual energy demand of the PVT-HP system is 1.6 MWh. The heat pump is responsible for 81.4% of the system’s electricity demand. The electricity demand of the electrical backup heaters accounts for 10.9% of the system’s electricity demand. The domestic electricity demand, for appliances and lighting equipment, is 2.1 MWh. The electricity generation from the PVT collectors is 2.7 MWh, which is equal to the system’s electricity demand and about half of the domestic electricity demand. However, due to the mismatch between supply and demand, electricity is used as a buffer.

6.1.2. System Operation and Control

Figure 12 shows, for each month of the year, the part of the month that the system is operated in a specific operation mode. On an annual basis, the system is in standby mode (mode 1) 82% of the time. In addition, the system is generating domestic hot water 7% of the time, which roughly corresponds with a daily average of 1.5 h. The remainder of the time, of which during 5% of the time the backup heater is activated, space heating is provided to the building via the floor heating system.
The daily DHW demand is constant. The operation time for DHW charging, however, is higher in the winter period compared to the summer period. This is explained by the fact that the system operates more efficiently, for reasons explained before, in the summer period. Therefore, the heat pump must be activated for a prolonged period in the winter. Lastly, note that the higher setpoint temperature at the ground floor results in higher activation times of the floor heating system compared with the first floor.
Figure 13 shows the fraction of the month that the boundaries of the working envelope of the heat pump do not prohibit the activation of the system. The minimum temperature threshold at the source side of the heat pump is the main bottleneck for the activation of the system. In January and February, the minimum source side threshold is violated 10% of the time. In line with Figure 12, the internal backup heater is, therefore, necessary to ensure comfortable conditions in the building in these months.
Figure 14 shows the monthly number of operating hours and on/off cycles. The operating hours and on/off cycles are highest in the winter when there is both a demand for space heating and for domestic hot water. The number of on/off cycles, however, is relatively high in the summer when the system is almost exclusively activated to generate DHW. This is a result of the relatively small dead band of 10 °C that is adopted in the DHW charging control strategy. The second reason is that the average tank temperature is used as input to the control strategy. The average tank temperature, however, is a numerical artifact. Based on the above, and to reduce the number of on/off cycles, it is recommended to increase the dead band and replace the average tank temperature with the temperature at a specific location in the top region of the tank.
Figure 15 is a heat map of the operating temperatures of the heat pump. Out of the total number of operating hours, the heat pump is operated approximately 60% of the time at source side temperatures between −10 and 10 °C and at load side temperatures between 20 and 30 °C. The fact that the system is operating a handful of hours at load side temperatures higher than 60 °C indicates that the system is fulfilling the legionella prevention function.
According to Figure 15, the heat pump is operated for more than 70% of the time under operating conditions for which the data was obtained through extrapolation data provided by the manufacturer of the heat pump. As the simulation results are heavily dependent on the extrapolated performance data of the heat pump, it is recommended to verify the performance data under the corresponding operating conditions.
Figure 16 demonstrates that for 96% of the time of the running hours, the heat pump is operated at source side fluid temperatures below the ambient temperature. In the comparison with an alternative air source heat pump system, this is an interesting observation. One of the potential benefits of using a PVT collector is that next to environmental energy in the air, irradiation can be collected. In turn, the use of solar irradiation can lead to higher fluid temperatures at the source side of the heat pump, resulting in a more efficient operation of the heat pump, and thus to a lower—electrical—energy demand. From the observation above, it can be concluded that the current system design leaves room for improvement in terms of capturing and using solar irradiation as an energy source for the heat pump. In this light, a more advanced control strategy and improvements in the heat transfer between the different constituents of the PVT collector are promising directions for future research.
Figure 17 shows the weighted inlet fluid temperatures at the source and load side of the heat pump. The weighted inlet fluid temperature at the source side rises during the summer. This can be explained by the higher irradiation levels and ambient air temperatures in the summer compared to the winter.

6.1.3. DHW Storage Tank

The energy balance of the DHW storage tank is met. On average, the daily energetic draw-off from the DHW tank is equal to 4.6 kWh corresponding with 1696 kWh on an annual basis. The contribution of the backup heater is 15 kWh, which corresponds with less than 1% of the total DHW demand and with 8.1% of the total electricity demand from the backup heaters. In contrast, about 2015 kWh are supplied by the heat pump on an annual basis. The difference between the supply and demand is explained by the annual tank losses, 331 kWh, and the accumulation of energy, 4 kWh.
Figure 18 gives the monthly mean fluid temperatures at three distinct locations which are evenly distributed over the storage tank height. The monthly average temperature at the center and upper region of the—stratified—storage tank ranges between 49 and 56 °C. The temperature at the bottom region of the tank is significantly lower, with a steady monthly average temperature of 20 °C. Finally, note that this observation substantiates the claim made before that the supply temperature from the storage tank to the heat pump is approximately constant throughout the year.

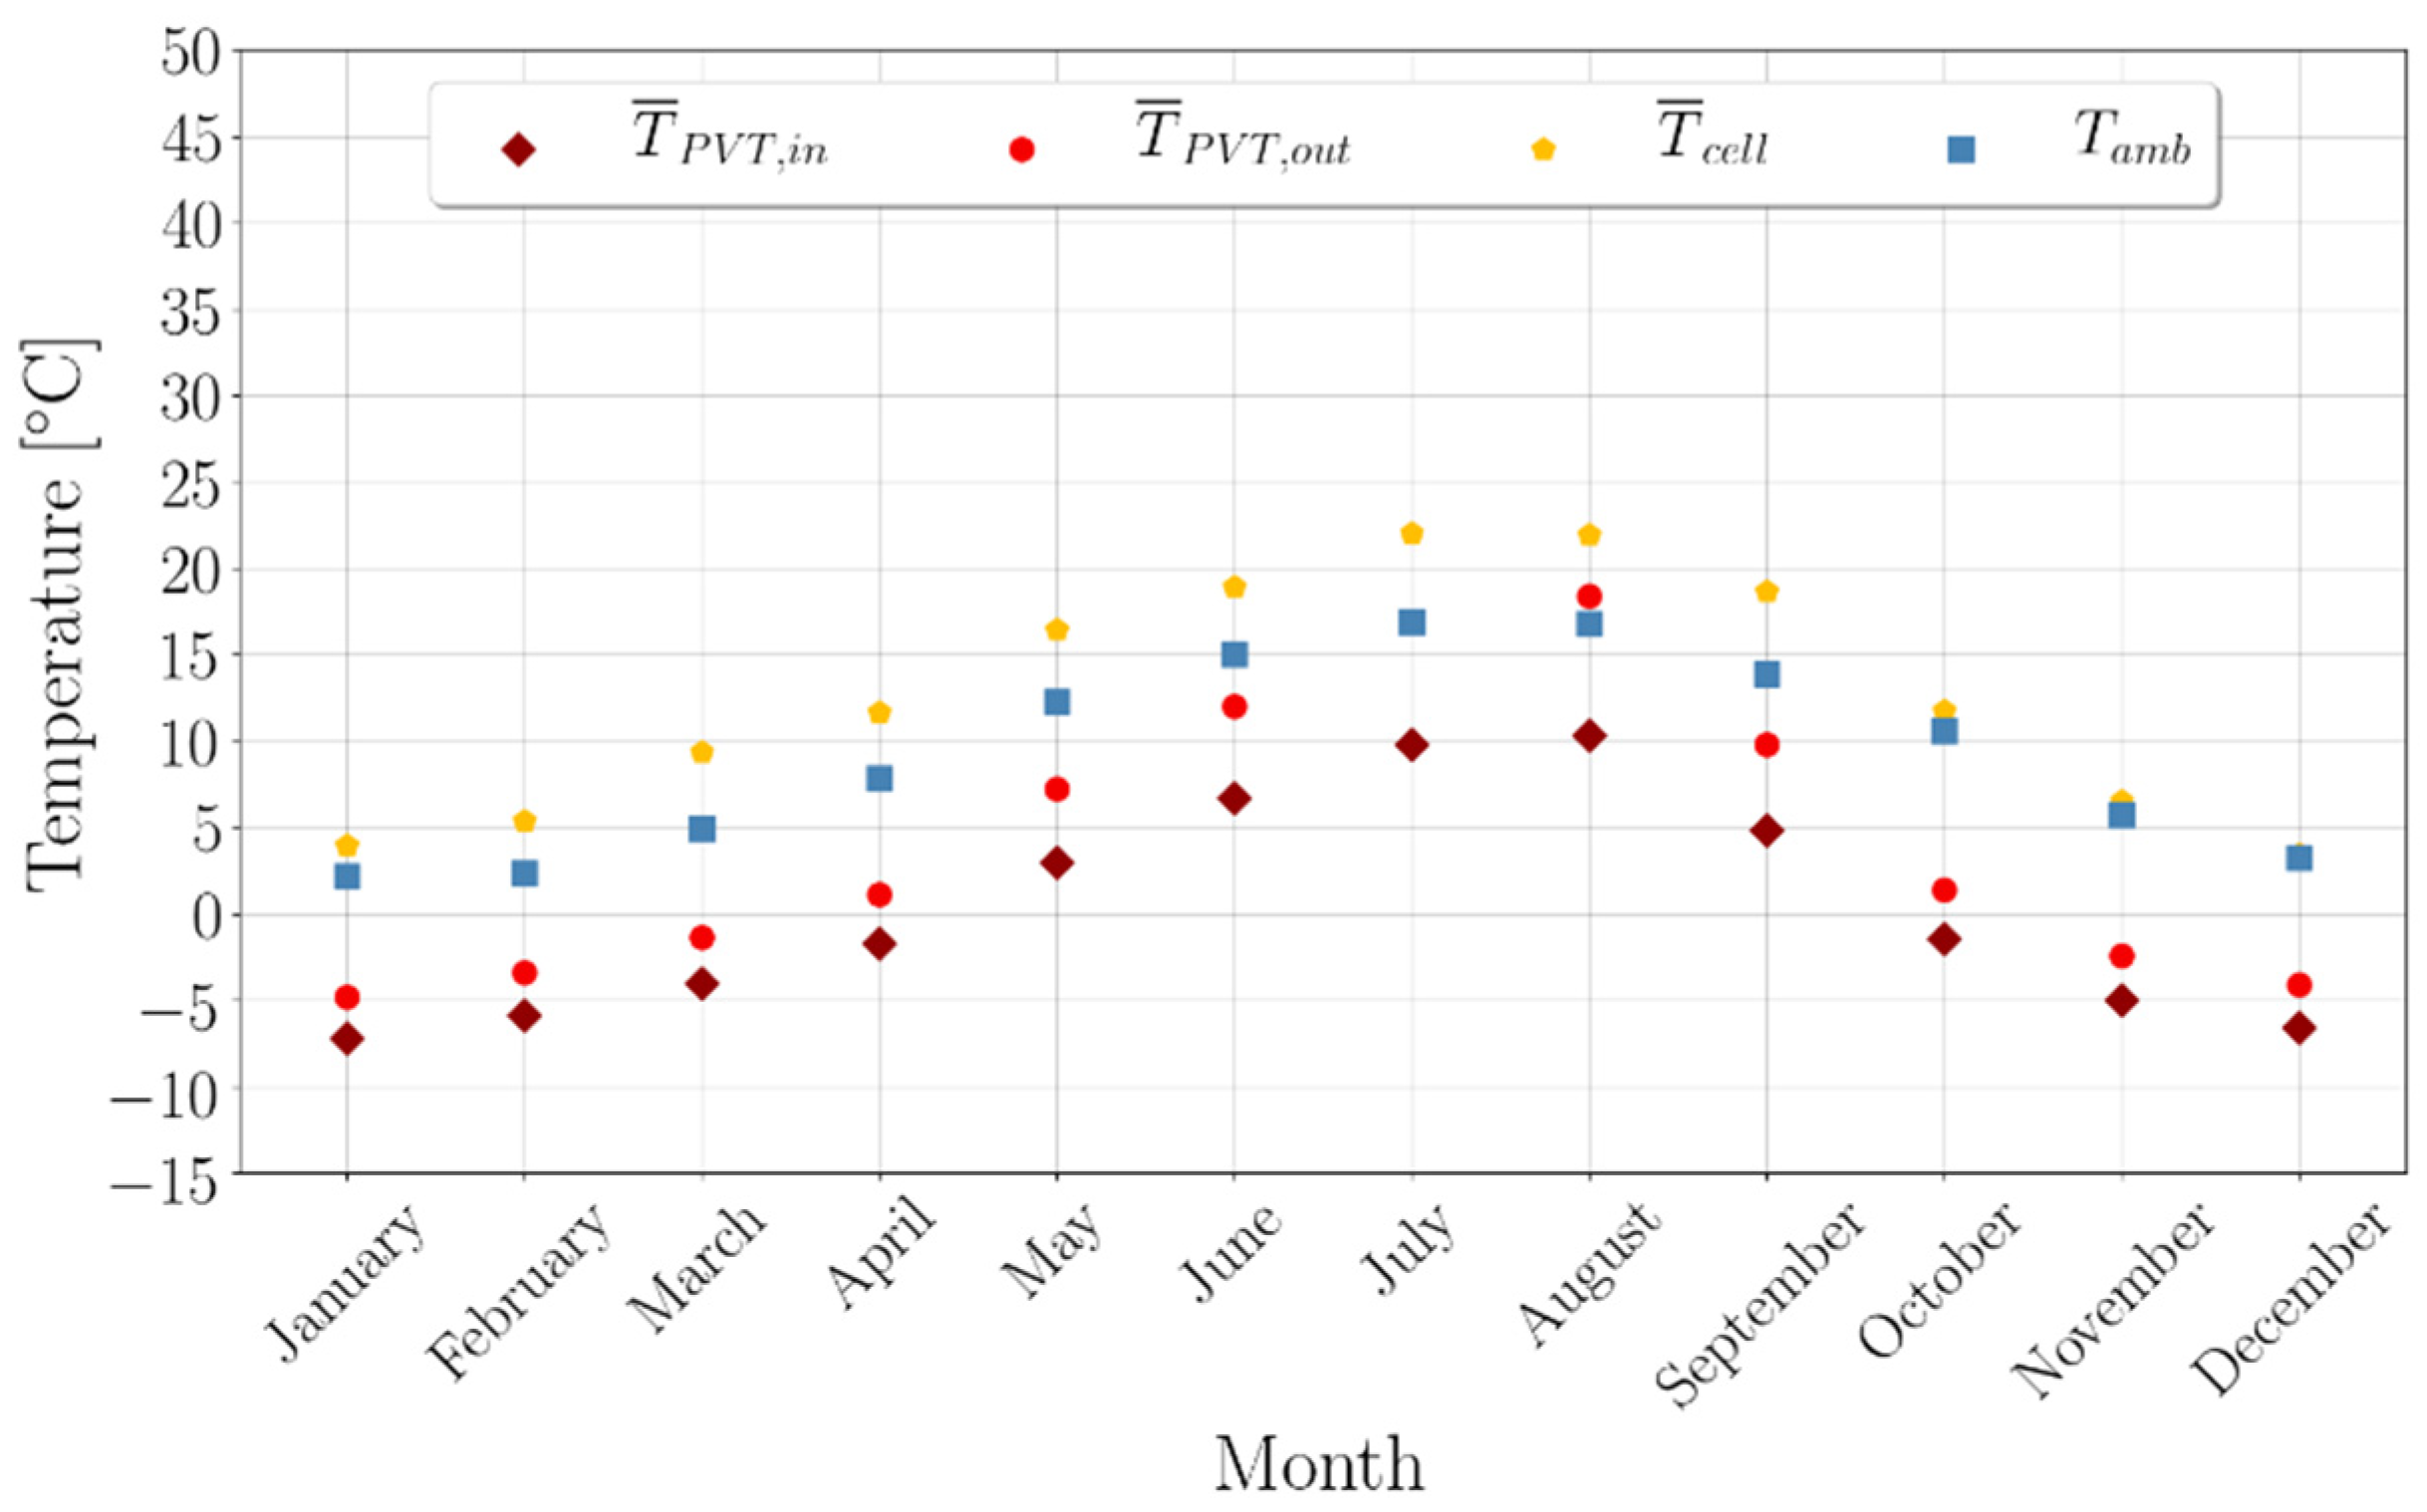
6.1.4. PVT Collector Performance

Figure 19 shows the monthly thermal and electrical yield from the PVT collectors. The annual electrical yield is 2.7 MWh, which corresponds with a specific yield of 180 kWh m−2. The monthly electrical yield reaches a maximum in the summer, which is the season with the highest irradiation level. In contrast, the opposite is true for the thermal yield. The thermal yield namely follows the demand which, due to the space heating demand, reaches a maximum in the winter. On an annual basis, the resulting thermal yield from the PVT collectors is 4.7 MWh, which corresponds with a specific yield of 310 kWh m−2.
Figure 20 is an overview of the weighted operating temperatures related to the performance of the PVT collectors. The figure shows that except for August, the weighted monthly fluid outlet temperature, T ¯ P V T , o u t , is lower than the ambient temperature, which implies that the environmental energy is not exploited to its full potential. In the winter months, the demand is the highest while the system operates under the most adverse conditions with respect to air temperatures and irradiation levels. This is reflected by the relatively low fluid temperatures and the low temperature difference between the inlet and outlet. The temperatures rise towards the summer when the air temperatures and the irradiation levels are higher. The maximum temperatures are reached in August, which is the only month for which it can be concluded that a significant share of the irradiation is captured and used by the system. More advanced—flow—control strategies are believed to lead to an increase in the exploitation of environmental resources. In the light of the above, this is especially relevant for the winter months, when the demand is the highest. In addition, an optimal PVT design must be found with respect to heat gains (winter) and losses (summer) from and to the environment.
Figure 21 shows the hourly profile of the fluid temperature at the inlet and outlet of the PVT collector. Note that the fluid temperatures are higher in the summer period due to elevated ambient temperature and the increased solar gains.

6.1.5. On-site Energy Fraction and On-site Energy Matching

Figure 22 shows the monthly On-site Energy Fraction (OEF) and the On-site Energy Matching (OEM). Hereto, a distinction is made between two variants. The general variants include both the domestic electricity demand and the system’s electricity demand. The second variant, O E M s y s and O E F s y s , merely include the system’s electricity demand. On an annual basis, 34.0% of the electricity demand is generated on-site and 24.9% of the electricity generation from the PVT collectors can be used directly on-site. The development of the OEM throughout the year is opposite to the development of the OEF. The OEF increases towards the summer as there are more sunshine hours and the irradiation level is higher compared to the winter. The OEM, however, reaches a minimum in August as it follows the demand, which is the lowest during the summer due to the absence of the space heating demand.
From the system’s perspective, 15.1% of the system’s electricity demand is generated on-site and 11.1% of the electricity generated by PVT collectors is supplied directly to the system components such as the heat pump. The development of the O E F s y s differs from the general OEF, which also includes the domestic electricity demand. The latter namely increases towards the summer, whereas the O E F s y s decreases which imply that relatively less energy is generated on-site in the summer. From this observation, it can be concluded that the system is not exploiting the sunlight to its full potential in the summer. In order to increase the self-efficacy of the system it is recommended to further investigate the correlation between the activation of the system, for DHW charging, and the—forecasted—irradiation level.

6.1.6. Indoor Conditions in the Building

Figure 23 shows the daily average air temperature in the different building zones. In addition, it contains the daily average ambient air temperature. The air temperature at the ground and first floor fluctuate around the setpoint temperature. There are two periods, at the end of January and at the end of December when there is a slight drop in the air temperature at both zones. The figure shows that these periods coincide with a drop in the ambient air temperature, with temperatures going down to −10 and −5 °C in January and December, respectively. During these periods the capacity of the PVT collectors as an energy source is insufficient and the internal backup heater of the heat pump is activated to ensure comfortable conditions in the building. Finally, it is noted that the daily average floor surface temperature at the ground and first floor, which are both equipped with a floor heating system, meet the comfort requirements, and does not exceed 29 °C.

6.2. Scenario Analysis

The system robustness against the weather conditions, occupancy, and building orientation are investigated. In addition, two system parameters: the PVT collector type and the PVT collector area, of the Dimark collector, are varied.

6.2.1. Climate Conditions

Figure 24 illustrates the effect of the climate conditions on the seasonal performance factor and the space heating demand. Note that the corresponding domestic hot water demand, for the two-person household, is 1695 kWh. The SPF values range between 3.6 and 3.9. Moreover, the general trend for the SPF is that it decreases with higher space heating demand. Under unfavorable climate conditions, such as low air temperatures, the space heating demand is typically higher. On top of that, the auxiliary demand increases which result in lower SPF values.

6.2.2. Occupancy Profiles

Figure 25 shows the SPF for six different occupancy scenarios. A distinction is made between the number of occupants, either two or four, and the presence of the occupants throughout the day. The latter is encompassed by three occupancy profiles: Reference, Mostly at Home, and the Mostly Away profile. The SPF ranges between 3.3 and 3.65. The SPF for the four person households is lower than the SPF for the two person households. This is explained by the higher contribution of domestic hot water to the total—thermal—energy demand: 12 GJ versus 6 GJ. Additionally, note that the space heating demand is higher for the two-person household. This is explained by the lower internal heat gains for the two-person households. For both household compositions, the space heating demand is the highest for the Mostly at Home scenario and the lowest for the Mostly Away scenario. For one, due to the difference in setpoint temperatures, which are the most stringent for the Mostly at Home scenario.

6.2.3. Building Orientation

Figure 26 shows the effect of the building orientation on the seasonal performance factor and the space heating demand. The energy demand for space heating is similar and varies no more than 5%. As expected, the highest SPF value is found for the south orientation in which the collector array is facing the equator and the PVT collectors are receiving more sunlight compared to other orientations. In turn, this leads to an improved heat pump performance and to a higher SPF value. For similar reasons, the lowest SPF value, 3.0, is found for the North orientation.

6.2.4. PVT Collector Area

Figure 27 illustrated the effect of the PVT collector area on the SPF and the auxiliary energy demand of the system. For the reference situation, the PVT collector area is varied between 5 and 35 m2 by increments of 5 m2. Starting at an SPF value of 2.5 for a collector area of 5 m2 the SPF increases with the collector area until it approaches an asymptotic value of approximately 4.2 for collector areas greater than 30 m2. In contrast, the auxiliary energy demand is 730 kWh in case the collector area is 5 m2 and rapidly decreases to values close to 100 kWh for collector areas larger than 20 m2.
A more efficient operation, and a lower auxiliary energy demand, results in lower electricity costs. On the other hand, this goes together with larger collector areas which imply higher investment costs. A recommendation for follow-up is the optimization of the collector area in the light of, among others, the corresponding financial implications.

6.2.5. PVT Collector Type

The effect of the PVT collector type on the system performance is investigated by replacing the PVT collector manufactured with the PVT collectors manufactured by SolarTech and ExaSun in the reference design. The adopted collector area is 25 m2, which is based on the manufacturer’s specifications for the alternative collector types. Table 14 summarizes the simulation results. In terms of the energetic performance, the PVT collector manufactured outperforms the other two collector types for the current system design. The thermal yield from the Dimark collector is 19% and 39% higher than from the SolarTech and ExaSun collectors, respectively. An analysis of the simulation results shows that the difference in thermal yield is mainly a result of the reduced ability of these collectors to capture and collect energy from the environmental air, which is also resembled by the collector parameters listed in Table 9. Therefore, the capacity of the SolarTech and ExaSun collectors is more often insufficient which results in higher auxiliary energy demand and thus in a lower SPF value. Additional research is necessary to verify to which extent the system performance can be improved by increasing the collector area.

7. Conclusions and Recommendations

Aside from the obvious reasons, such as climate change, earthquakes due to the exploration of the gas fields in the northern provinces of The Netherlands, means that there is an urgent need for a renewable and sustainable alternative to natural gas as an energy source. A promising alternative to the traditional natural gas based residential energy system is a PVT-HP system which includes hybrid (PVT) collectors and heat pump technologies. This article contributes to the exploration of this novel concept by presenting the results of a numerical study on a PVT-HP system. A numerical model, using the TRNSYS simulation tool, of a serial connected PVT-HP system for a newly built terraced house located in the Netherlands is constructed and the—energetic—performance is simulated. The seasonal performance factor is equal to 3.6. The robustness against varying boundary conditions is also investigated. The SPF values range between 3.0 and 3.9 for varying climate conditions, occupancy scenarios, and building orientations. Lastly, the PVT collector type and PVT collector area are varied. The results suggest that there is room for improvement in the system performance and that an optimum, including financial and environmental performance, remains to be found.

Author Contributions

Supervision, C.R. and C.d.K.; Writing—original draft, L.R. All authors have read and agreed to the published version of the manuscript.

Funding

This project was carried out in the PVT inSHaPe Project. This project, with project number TEUE116189, was supported by the Topsector Energy Subsidy from the Dutch Ministry of Economic Affairs.

Institutional Review Board Statement

Not applicable.

Informed Consent Statement

Not applicable.

Acknowledgments

This project was carried in under the PVT inSHaPe Project. This project, with project number TEUE116189, was supported by the Topsector Energy Subsidy from the Dutch Ministry of Economic Affairs [24]. The funding source was not involved in the study design; in the collection, analysis, and interpretation of data; in the writing of the report; and in the decision to submit the article for publication. The authors are grateful for this support and thank the project partners and the students of the Eindhoven University of Technology who participated in the project, Tahir, H., Azalia Sanjaya, Z. and Psimmenoy, M., for their support and cooperation.

Conflicts of Interest

The authors declare no conflict of interest.

Appendix A. Occupancy Profiles

Figure A1. Occupancy profiles.
Energies 15 00096 g0a1aEnergies 15 00096 g0a1b

References

  1. United Nations Environment; Global Alliance for Buildings and Construction and the International Energy Agency (IEA). Global Status Report 2017. Available online: https://globalabc.org/resources/publications/2017-global-status-report-buildings-and-construction (accessed on 10 March 2019).
  2. Central Bureau of Statistics (CBS). Greenhouse Gas Emissions 3 Percent Down in 2019. 2020. Available online: https://www.rvo.nl/onderwerpen/duurzaam-ondernemen/gebouwen/wetten-en-regels/nieuwbouw/energieprestatie-beng/ontwikkelingen#:~:text=De%20Wet%20Voortgang%20Energietransitie%20(wet,Lees%20meer%20over%20aardgasvrij (accessed on 19 January 2020).
  3. Rijksdienst voor Ondernemend Nederland (RVO). Ontwikkelingen BENG. Available online: https://www.rvo.nl/onderwerpen/duurzaam-ondernemen/gebouwen/wetten-en-regels/nieuwbouw/energieprestatie-beng/ontwikkelingen (accessed on 2 April 2020).
  4. Jonas, D.; Frey, G.; Theis, D. Simulation and performance analysis of combined parallel solar thermaland ground or air source heat pump systems. Sol. Energy 2017, 150, 500–511. [Google Scholar] [CrossRef]
  5. Emmi, G.; Zarrella, A.; De Carli, M. A heat pump coupled with photovoltaic thermal hybrid solar collectors: A case study of a multi-source energy system. Energy Convers. Manag. 2017, 151, 386–399. [Google Scholar] [CrossRef]
  6. Bertram, E.; Glembin, J.; Rockendorf, G. Unglazed PVT collectors as addtional heat source in heat pump systems with borehold heat exchanger. Energy Procedia 2012, 30, 414–423. [Google Scholar] [CrossRef] [Green Version]
  7. Sakellariou, E.; Wright, A.; Axaopoulos, P.; Oyinlola, M. PVT based solar assisted ground source heat pump system: Modelling approach and sensitivity analyses. Sol. Energy 2019, 193, 37–50. [Google Scholar] [CrossRef]
  8. Solar Energy Application Centre (SEAC). Openbaar Eindrapport Project “WenSDak”—Esthetisch Gebouwgeïntegreerd zonneWarmte en Stroomdak; SEAC: Eindhoven, The Netherlands, 2017. [Google Scholar]
  9. Vallati, A.; Oclon, P.; Colucci, C.; Mauri, L.; de Lieto Vollaro, R.; Taler, J. Energy analysis of a thermal system composed by a heat pump. Energy 2019, 174, 91–96. [Google Scholar] [CrossRef]
  10. Thermal Energy System Specialists, LLC. TRNSYS17; Thermal Energy System Specialists, LLC: Madison, WI, USA, 2017; Available online: http://www.trnsys.com/ (accessed on 20 April 2020).
  11. Jonas, D.; Lämmle, M.; Theis, D.; Schneider, S.; Frey, G. Performance modeling of PVT collectors: Implementation, validation and parameter identification approach using TRNSYS. Sol. Energy 2019, 193, 51–64. [Google Scholar] [CrossRef]
  12. Haller, M.; Perers, B.; Bale, C.; Paavilainen, J.; Dalibard, A.; Fischer, S.; Bertram, E. TRNSYS Type 832 v5.00 “Dynamic Collector Model by Bengt Perers" Updated Input-Output Reference. 2012. Available online: https://backend.orbit.dtu.dk/ws/files/51568914/121113_Collector%20Model%20Type%20832v500%20-%20Input-Output%20Reference.pdf (accessed on 1 June 2020).
  13. Drück, H. Multiport Store—Model for TRNSYS Type 340 Version 1.99F. 2006. Available online: https://www.trnsys.de/download/en/ts_type_340_en.pdf (accessed on 1 June 2020).
  14. V Meteotest AG. Meteonorm; Meteotest AG: Bern, Switzerland, 2020; Available online: https://meteonorm.com/en/ (accessed on 23 January 2020).
  15. Interngovernmental Panel on Climate Change (IPCC). Special Report on Emissions Scenarios. 2000. Available online: https://www.ipcc.ch/site/assets/uploads/2018/03/emissions_scenarios-1.pdf (accessed on 23 January 2020).
  16. Ministerie van Binnenlandse Zaken en Koninkrijksrelaties. Bouwbesluit 2012 (Vanaf 01-07-2019). Available online: https://www.onlinebouwbesluit.nl/ (accessed on 5 January 2020).
  17. Bedir, M. Occupant Behavior and Energy Consumption in Dwellings: An Analysis of Behavioral Models and Actual Energy Consumption in the Dutch Housing Stock. 2017. Available online: https://journals.open.tudelft.nl/abe/article/view/1876 (accessed on 5 January 2020).
  18. Jordan, U.; Vajen, K. DHWcalc: Program to generate domestic hot water profiles with statistical means for used defined conditions. In Proceedings of the ISES 2005 Solar World Congress, Orlando, FL, USA, 8–12 August 2005. [Google Scholar]
  19. Psimmenoy, M. Performance Analysis of a PVT with a Heat Pump System under Outdoor Testing and Numerical Modelling. 2019. Available online: https://research.tue.nl/en/studentTheses/performance-analysis-of-a-pvt-combined-with-heat-pump-system-usin (accessed on 20 June 2019).
  20. Viessmann Nederland B.V. Ground-Water Heat Pump Vitocal 300-G. Available online: https://www.viessmann.nl/nl/eengezinswoning/warmtepompen/brine-waterwarmtepompen/vitocal-300g.html (accessed on 10 September 2020).
  21. ISSO. ISSO-Publicatie 72 Ontwerpen van Individuele en Kleine Elektrische Warmtepompsystemen voor Woningen; ISSO: Haarlem, The Netherlands, 2017; Available online: https://www.wasco.nl/content/isso-72 (accessed on 17 December 2021).
  22. Heimrath, R.; Haller, M. The Reference Heating System—The Template Solar System of Task 32. 2007. Available online: https://www.iea-shc.org/data/sites/1/publications/task32-Reference_Heating_System.pdf (accessed on 5 July 2020).
  23. Vakblad Warmtepompen. Basiseigenschappen en Voordelen van Vloerverwarming. Available online: http://locatherm.nl/informatie-vloerwarming/ (accessed on 21 October 2021).
  24. Rijksdienst voor Ondernemend Nederland (RVO). PVT Integrated Solar Heat Pump Systems. Available online: https://www.rvo.nl/subsidies-regelingen/projecten/pvt-integrated-solar-heat-pump-systems (accessed on 17 January 2020).
Figure 1. Hydraulic scheme of the PVT-HP system.
Energies 15 00096 g001
Figure 2. Sketch of the single-family terraced building.
Energies 15 00096 g002
Figure 3. Illustration of a section of the underfloor heating system.
Energies 15 00096 g003
Figure 4. Fluid inlet temperatures versus the COP of the Vitocal 300-G heat pump, manufactured by Viessmann. The red rectangle indicates the temperatures limits between which data is specified by the manufacturer [20].
Energies 15 00096 g004
Figure 5. Schematic of the domestic hot wat water storage tank.
Energies 15 00096 g005
Figure 6. Control schematic of the temperature controller in the DHW tank.
Energies 15 00096 g006
Figure 7. Control schematic of the two-stage room thermostats.
Energies 15 00096 g007
Figure 8. PVT-HP reference system configuration implemented in the Template Solar System of IEA SHC Task 32.
Energies 15 00096 g008
Figure 9. Monthly seasonal performance factor (SPF), seasonal coefficient of performance (SCOP) of the heat pump and the system’s energy balance.
Energies 15 00096 g009
Figure 10. Performance factors and seasonal performance factors of the system.
Energies 15 00096 g010
Figure 11. Annual electrical energy balance of the system and the household.
Energies 15 00096 g011
Figure 12. Monthly distribution of the system’s operating modes. FHS: Floor heating system, GF: ground floor and FF: first floor.
Energies 15 00096 g012
Figure 13. Monthly working envelope control signals of the heat pump.
Energies 15 00096 g013
Figure 14. Monthly number of operating hours and on/off cycles for the heat pump.
Energies 15 00096 g014
Figure 15. Heat map of the operating temperature at which the heat pump is operated throughout the year.
Energies 15 00096 g015
Figure 16. Ambient air temperature versus the inlet fluid temperature at the inlet the source side of the heat pump.
Energies 15 00096 g016
Figure 17. Monthly weighted inlet fluid temperatures at the source and load side of the heat pump.
Energies 15 00096 g017
Figure 18. Monthly mean fluid temperature at distinct locations inside the domestic hot water storage tank.
Energies 15 00096 g018
Figure 19. Monthly—thermal and electrical—yield from the PVT collectors.
Energies 15 00096 g019
Figure 20. Monthly operating and weighted operating temperatures related to the performance of the PVT collectors. The cell temperature of the PV panel, T ¯ c e l l is included for reference purposes.
Energies 15 00096 g020
Figure 21. Hourly profile of the PVT fluid inlet and outlet temperature.
Energies 15 00096 g021
Figure 22. Monthly and annual On-site Energy Fraction (OEF) and On-site Energy Matching (OEM). A distinction is made between the OEF and OEM including and excluding (system) the domestic electricity demand.
Energies 15 00096 g022
Figure 23. Daily average air temperature in the building together with the environmental air temperature and the Running Mean Outdoor Temperature (RMOT).
Energies 15 00096 g023
Figure 24. Seasonal Performance Factor (SPF) versus the space heating demand for different climate conditions. With exception of the climate conditions, the cases are identical to the reference case.
Energies 15 00096 g024
Figure 25. SPF versus the space heating demand for different number of occupants, two or four, and three different occupancy profiles: Reference (REF), Mostly at Home (MH), and Mostly Away (MA). Note that the corresponding DHW demand for a respective two and four-person household are 6 and 12 GJ.
Energies 15 00096 g025
Figure 26. SPF versus the space heating demand for different building orientations. The orientations are shown in the figure refer to the direction that the back side of the building, and thus the PVT collectors, are facing.
Energies 15 00096 g026
Figure 27. SPF and the auxiliary energy demand for different collector areas (Dimark Solar). The SPF is indicated by the blue dots, the auxiliary energy demand by the green squares.
Energies 15 00096 g027
Table 1. Simulation models of the main system components.
System ComponentSimulation ModelSystem ComponentSimulation Model
PVT collectorType 835 [11]
Type 832 [12]
Flow divertersType 647
Heat pumpType 927Flow mixersType 649
DHW tankType 340 [13]Differential controllersType 2
BuildingType 56Internal backup heater HPType 659
PumpsType 114Ground temperatureType 77
PipesType 31Controller for bypass valvesType 953
Thermostat controllersType 698
Table 2. Climate characteristics of the reference location.
SymbolValueCharacteristic
L A T 52.10Latitude [°]
L O N G 5.18Longitude [°]
A L T 40Altitude [m]
T a v g 9.5Annual average temperature [°C]
T m i n −11.7Annual minimum temperature [°C]
T m a x 30.9Annual maximum temperature [°C]
I G H I 968Global horizontal irradiation [kWh/m²]
I B E A M 382Beam irradiation [kWh/m²]
I D I R E C T 586Diffuse irradiation [kWh/m²]
R H 79.8Annual average relative humidity [%]
W S 3.3Annual average windspeed [m/s]
Table 3. Geometrical characteristics of the reference building.
Area
Front façade (% windows)29.6 (16%)
Back façade (% windows)29.6 (34%)
Side façade 63.9
Front side roof (% windows)24.3 (5%)
Back side roof38.3
Volume
Ground floor118.4
First floor118.4
Attic93.5
Angle of Inclination
Front side roof65°
Back side roof35°
Table 4. Construction of the building elements.
Building ElementR-Value [m² K W−1]
(U-Value [W m−2 K−1])
External wall4.5
Ground floor3.5
Interior floor3.0
Roof6.0
Partition walls3.0
Window: glazing(1.2)
Window: frame(3.0)
Table 5. Heating setpoint temperatures adopted in the numerical study. Between brackets the setpoint temperature adopted during the night (midnight until 7 AM).
Building Zone
Occupancy ProfileGround FloorFirst Floor
Reference20 (18) °C18 °C
Mostly away19 (17) °C17 °C
Mostly at home21 (19) °C19 °C
Table 6. The annual average specific, per m² usable area, electricity demand from appliances for different occupancy scenarios. Values are in W/m².
Number of Occupants
Occupancy ProfileBuilding Zone24
ReferenceGround floor
First floor
7.1
2.3
10.7
5.0
Mostly at homeGround floor
First floor
6.3
4.0
9.0
5.9
Mostly awayGround floor
First floor
5.2
2.3
10.0
3.9
Table 7. Flow characteristics of the three domestic hot water draw-off categories.
Category →
Characteristics ↓
123
Mean flow rate in l h−1300220180
Standard deviation of the flow rate in l h−1 604545
Average duration of draw-off in min821
Relative part in %503020
Table 8. Electrical model parameters for the different PVT collectors. Adopted values from [19]. Values for a , b and c are supplied by the manufacturer of the PV-panels.
Manufacturer
ParameterDimark Solar (DS)SolarTech (ST)ExaSun (XS)Parameter Description
η e l , r e f 0.1830.1530.202The electrical efficiency under Standard Test Conditions (STC)
T c e l l , r e f 252525The cell temperature under Standard Test Conditions (STC) °C
b 0 0.070.1250.139Constant for the Incidence Angle Modifier (IAM)
a −0.00019−0.00019−0.00019Parameter in the correction factor for irradiance losses [m² W−1]
b −0.047−0.047−0.047Parameter in the correction factor for irradiance losses
c −1.4−1.4−1.4Parameter in the correction factor for irradiance losses
β −0.38−0.38−0.38Temperature coefficient [%/K]
Table 9. Thermal model parameters for the different PVT collectors. Adopted values from [19].
Manufacturer
ParameterDimark Solar (DS)SolarTech (ST)ExaSun (XS)Parameter Description
η 0 0.470.200.09Zero-loss efficiency of the PVT collector
K d 111The Incidence Angle Modifier for beam irradiance
a 1 12.13.51.9Heat loss coefficient [W m−2 K−1]
a 2 000Temperature dependence of the heat losses [W m−2 K−2]
a 3 1.2500.14Wind speed dependence of the heat losses [J m−3 K−1]
a 4 000Long wavelength dependence of the heat losses
a 5 17,17364554640Effective thermal capacitance of the PVT collector [J m−2 K−1]
a 6 0.0290.0160.007Wind dependence of the zero-loss efficiency s m−1]
U c e l l f l u i d 40615Heat transfer coefficient between the PV panel and the collector fluid
Table 10. Rated operating conditions and performance characteristics of the heat pump. Values are adopted from [20].
Performance Characteristic/Operating ConditionValue
Rated source side (evaporator) temperature0 °C
Rated load side (condenser) temperature35 °C
Rated capacity5.7 kW
Rated power1.2 kW
Rated coefficient of performance (COP)4.6
Table 11. Geometrical features of the DHW tank.
ParameterValueParameter Description
H t a n k 1.3 mInternal height of the DHW tank
D t a n k 0.41 mInternal diameter of the DHW tank
V t a n k 175 L/250 LInternal volume of the DHW tank (two-/four-person household)
V H E X 5 LInternal volume of the heat exchanger
Z D H W , i n 0Rel. height of the tap water inlet
Z D H W , o u t 1Rel. height of the DHW outlet
Z h e x , i n 0.60Rel. height of the heat exchanger inlet
Z h e x , o u t 0.05Rel. height of the heat exchanger outlet
Z a u x 0.70Rel. position pf the backup heater
Z T S , a u x 0.90Rel. position of the controller for the backup heater
Table 12. Operating modes of the PVT-HP system.
ModeHeat SourceHeat Load
1StandbyStandby
2PVT-HPDHW tank
3PVT-HPFHS: ground floor
4PVT-HPFHS: first floor
5PVT-HPFHS: both floors
6Internal backup heater HPFHS: ground floor
7Internal backup heater HPFHS: first floor
8Internal backup heater HPFHS: both floors
Table 13. Key features of the designed PVT-HP system and the boundary conditions of the reference case.
PVT-HP System DesignBoundary Conditions
System typeSerial PVT-HP systemBuilding typeNewly built terraced house
PVT collectors15 m2—Dimark SolarSpace heating demand15 GJ
Heat pumpCapacity: 4.0; COP: 4.6 (B0/W35)DHW demand6 GJ
DHW tank175 LLocationDe Bilt, the Netherlands
Table 14. System performance for the different PVT collectors manufactured by Dimark Solar, SolarTech and ExaSun. The collector area is 25 m².
Manufacturer
Dimark SolarSolarTechExaSun
SPF4.02.82.2
E a u x [kWh]1155371072
Q P V T [kWh]485340943493
E P V T [kWh]445337185058
Publisher’s Note: MDPI stays neutral with regard to jurisdictional claims in published maps and institutional affiliations.

