Article

Laboratory Study of the Influence of Fluid Rheology on the Characteristics of Created Hydraulic Fracture

1
Center for Petroleum Science and Engineering, Skolkovo Institute of Science and Technology, Bolshoy Boulevard 30, Bld. 1, 121205 Moscow, Russia
2
Department of Technology of Chemicals Substances for the Oil and Gas Industry, National University of Oil and Gas (Gubkin University), Leninsky Prospekt 65, 119991 Moscow, Russia
*
Author to whom correspondence should be addressed.
Energies 2022, 15(11), 3858; https://doi.org/10.3390/en15113858
Submission received: 30 March 2022 / Revised: 18 May 2022 / Accepted: 22 May 2022 / Published: 24 May 2022

Abstract

:
In the last decade, the negative impact of hydraulic fracturing fluids on the reservoir properties has been noted, which has led to the new trend of improving characteristics and developing new hydraulic fracturing fluids. As an alternative option to the traditionally used cross-linked fluids based on guar solution, in our laboratory we have tested fluids having a branched spatial structure, which allowed them to hold and transport proppants, despite the low viscosity of this kind of fluids (100–200 mPa·s measured at 100 s−1). Existing theoretical models of hydraulic fracture (HF) propagation have some limitations in predicting the influence of fracturing fluids on reservoir properties. Unfortunately, in situ experiments in the target reservoir are difficult and expensive. Thus, laboratory experiments can be considered as a reasonable alternative for testing new fluids, since they can provide comprehensive information about the properties of the created HF before the application of a new hydraulic fracturing technique in the field conditions. This paper presents the results of an experimental study of hydraulic fracturing of granite samples in laboratory conditions. The injection of water- and oil-based unconventional fracturing fluids was performed to study the influence of fluid rheology on the dynamics of the hydraulic fracture propagation process and parameters of the created HF. We have found that the fracturing fluid viscosity affects the parameters of the created HF, such as aperture, propagation velocity, breakdown pressure, and HF surface tortuosity. The obtained relationships can be taken into account for Hydraulic Fracture modelling, which may increase the efficiency of the hydraulic fracturing in the field conditions.

1. Introduction

Hydraulic fracturing is one of the most effective treatments to create a cracks’ network and improve formation permeability. Currently, this technique is widely used in different fields. For example, the application of hydraulic fracturing allows us to achieve economically productive quantities of energy in the Enhanced Geothermal System [1]. Hydraulic fracturing can also increase hydrocarbon productivity for various unconventional types of rock formations [2]. The main agent or force in the fracturing process is the selected fluid and its composition. Nevertheless, the injected fluid composition can significantly influence properties of water-sensitive reservoirs, especially those with a high content of expandable clay [3]. Unfortunately, existing theoretical models of HF propagation have some limitations regarding prediction of the influence of fluids on reservoir properties, and in situ experiments in the target reservoir are difficult and expensive. Thus, laboratory experiments are a reasonable alternative, which could provide comprehensive information about the dynamics and properties of created HF before the field application of a certain hydraulic fracturing technique [4].
Importantly, each unconventional reservoir is unique and has its own permeability properties, composition, and formation pressure, which require an individual design of the hydraulic fracturing procedure. For example, multistage hydraulic fracturing technology, which is widely used for the development of the American Bakken formation, is not applicable for the Bazhenov formation [5], owing to the fact that water-based fluids can cause a number of negative consequences, such as PV clogging, clay destabilization and emulsion formation, and changes in wettability. These agents are considered as typical for traditional formations, however, it could be critical for the Bazhenov formation due to extremely low pore-permeability properties of the formation matrix [5].
For the last decade, a diverse number of fracturing fluids have been developed and applied. The most commonly used fracturing fluids are water-based, such as slickwater and gel- and polymer-based fluids because of their low price and easy manufacturing. For a successful and efficient hydraulic fracturing process, the choice of fluid is based on the following key parameters: compatibility of the injected fluid with the rocks and fluid of the target formation, the ability to create fluid pressure sufficient to form the well-connected network of cracks (fractures), as well as easy removal of the working fluid after the fracturing [6]. In some cases, after the fracturing operation, it can also be problematic to obtain a flow from the hydrocarbon reservoir because of the existence of an almost impermeable zone within the rock. Such a filter-cake effect can be caused by incomplete destruction of chemical bonds of the viscoelastic system after hydraulic fracturing and can require injection of high-quality breakers [7]. In addition, the fracturing fluid must be viscous and elastic enough to hold and transport the proppant well within the created HF, which is the basis of their sand-carrying and sand-holding ability [8]. In addition, multistage hydraulic fracturing requires a large volume of high-quality water, which makes it ecologically consuming and impractical [9]. Flowback fluid cannot be simply re-used, because it contains a high level of contamination, including heavy metals, therefore fracturing fluid requires considerable cleaning and treatment [10].
A reasonable solution to the described problems would be to modify existing fracturing agents. A number of new waterless fracturing technologies, such as liquefied petroleum gas (LPG) fracturing, nitrogen foam fracturing on hydrocarbon base, CO2 foam fracturing [11], liquid/supercritical CO2 fracturing, gas fracturing and cryogenic fracturing using fluid N2 [12] were developed. Additional data can be found in the reviews [13,14,15,16].
Before industrial application of new fluids in the field conditions, the testing of fluids in laboratory conditions could be useful [17]. Existing works are mainly focused on the laboratory hydraulic fracturing experiments with promising waterless fracturing fluids such as liquefied and supercritical gases. In case of Liquid nitrogen (LN2) injection, thermal stress plays a significant role in reducing a fracture initiation and propagation pressure by generating enormously high-tensile hoop stress and causing extensive rock damage [18,19]. Injection of supercritical carbon dioxide (CO2) demonstrates a strong thermal gradient, generating local tensile stress in the rocks surrounding a borehole [20].
In addition, waterless fracturing technologies have been actively considered due to concerns arising from the heavy use of water. Alternative fracturing fluid as Liquid nitrogen can be directly obtained by separating and compressing nitrogen gas from the air, minimizing the cost for fluid transportation. Based on the results of experimental investigation, cryogenic fracturing using liquid nitrogen is demonstrated as a formation-damage-free stimulation technology that can effectively generate fractures in shale and sandstone reservoir rocks [21]. The authors of [22] provide a state-of-the-art review on several non-aqueous fracturing techniques focusing on the mechanism, merits and drawbacks, modeling, experiments, and field studies.
Despite all the advantages of waterless hydraulic fracturing with liquefied gas injection, this technique mainly induced complex fractures [23]. The fracture surface roughness is an essential characteristic of the hydraulic fracturing process and has not been fully explored. The surface asperities play a significant role in proppant flow and settlement, fluid leak-off, and fracture tip movement. It has been shown that the transport and distribution of proppant particles within tortuous fractures can be problematic [24]. The results of the study [25] indicate that the rock fabric and the heterogeneity of the rock matrix are significant factors influencing the initiation and propagation of the fracture.
In the current study, we investigated the influence of unconventional fracturing fluids’ rheology on the fracture propagation parameters. These fluids are based on viscoelastic surfactants (VES) [26,27,28,29,30,31,32,33] and synthetic polymers such as polyacrylamide (PAA) [34,35,36]. Additionally, in the current laboratory study we injected gelled oil-based system, prepared by the method described in [37].
In our research, we studied the dynamics of created hydraulic fracturing as well as the parameters of fractures and topography of created surfaces. During our experiments, we have found that the unconventional fracturing fluid viscosity influences the number of formed fracture parameters, such as aperture, the propagation velocity, breakdown pressure, and finally tortuosity. The obtained correlations can be taken into account for the Hydraulic Fracture modelling, which may increase the efficiency of the hydraulic fracturing in the field.

2. Materials and Methods

2.1. Material Description

In the presented study, we investigated the influence of fluids with different properties on the parameters of created fractures. For experimental modeling we decided to choose a homogeneous rock material with a low permeability, close to the permeability of unconventional reservoirs, high values of modulus and strength. We chose Pokostovsky granite as a modelling material and, first of all, we measured the geomechanical parameters (Young’s modulus, compression and tensile strength, etc.) listed in Table 1. In addition, before the tests, we determined the granite permeability by nitrogen gas (DarcyPress setup). We have found that the obtained characteristics are close to those of unconventional reservoir materials, therefore we decided that granite may satisfy the goal of the study.
Granite blocks were collected from the Pokostovsky quarry (Ukraine) (Figure 1) and were then used as the material for laboratory experimental modeling for hydraulic fracturing tests.
Pokostovsky granite is a homogeneous light-gray igneous rock with a medium-grained structure (Figure 2). Some parts of this rock can also contain 50–60 mm associations of black minerals—schliers. The mineral composition was determined by X-ray powder diffraction (XRD) analysis, which was specially made for the Pokostovsky granite specimen: Quartz—42.9%, Oligoclase—31.8%, Microcline—20%, Biotite—5.3%.
For our tests, we prepared cylindrical samples of the Pokostovsky granite: 100 mm in diameter and 108–111 mm in length (Table 2). Then, the end surfaces of the specimens were ground using a diamond grinding disc to a maximum flatness deviation of no more than 0.03 mm. To simulate a horizontal wellbore (cased well and open-hole sections), a hole with a diameter of 8 mm was drilled from the top to the specimen’s center. A metal tube of 6.35 mm diameter was glued into this hole (cased well section), with a section that was 10 mm long in the central part of the cylinder left open (open-hole section).

2.2. Experimental Setup

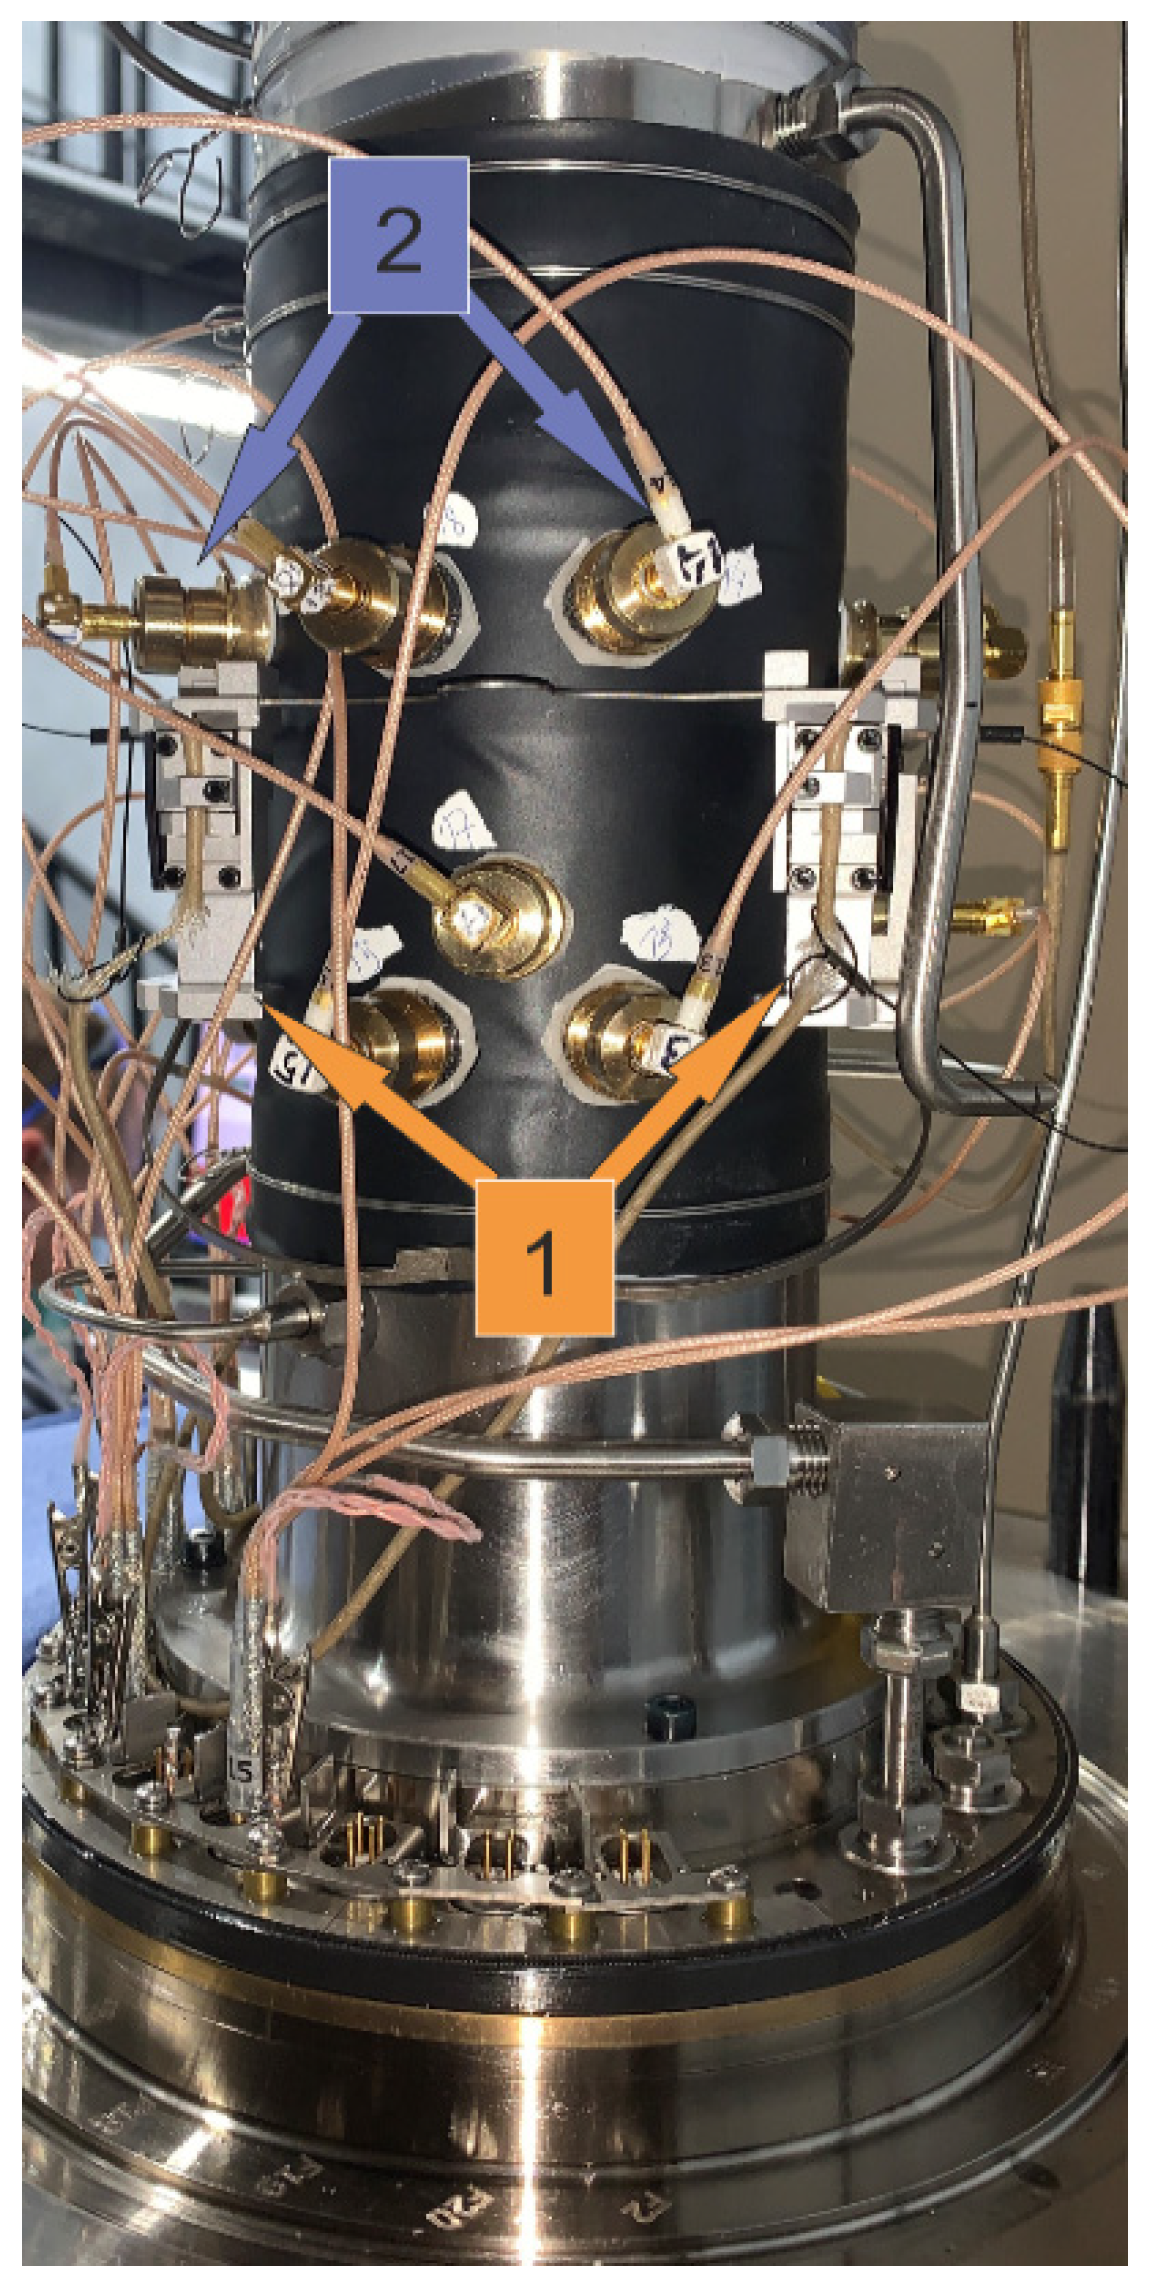
The tests were carried out on a pseudo-triaxial hydraulic fracturing apparatus that was manufactured by the Material Testing Systems Corporation (MTS-815), which is described in detail in the article [25]. During the laboratory experiment, the process of fracture propagation was monitored by several independent systems, such as Acoustic Emission (AE), a set of extensometers directly measuring axial deformation of sample, and sensors that registered pressure and volume of the fluid injected into the fracture (Figure 3). The high-precision Extensometer consists of two pairs of pins (Extensometers A and B), which were installed symmetrically directly on the sample’s lateral surface. In addition, there is a sensor measuring the piston displacement, which controls the sample extension in the vertical direction. We made all hydraulic fracturing tests with constant stresses applied to the sample, therefore, in the current configuration, vertical extension is related to fracture opening and fluid filling.
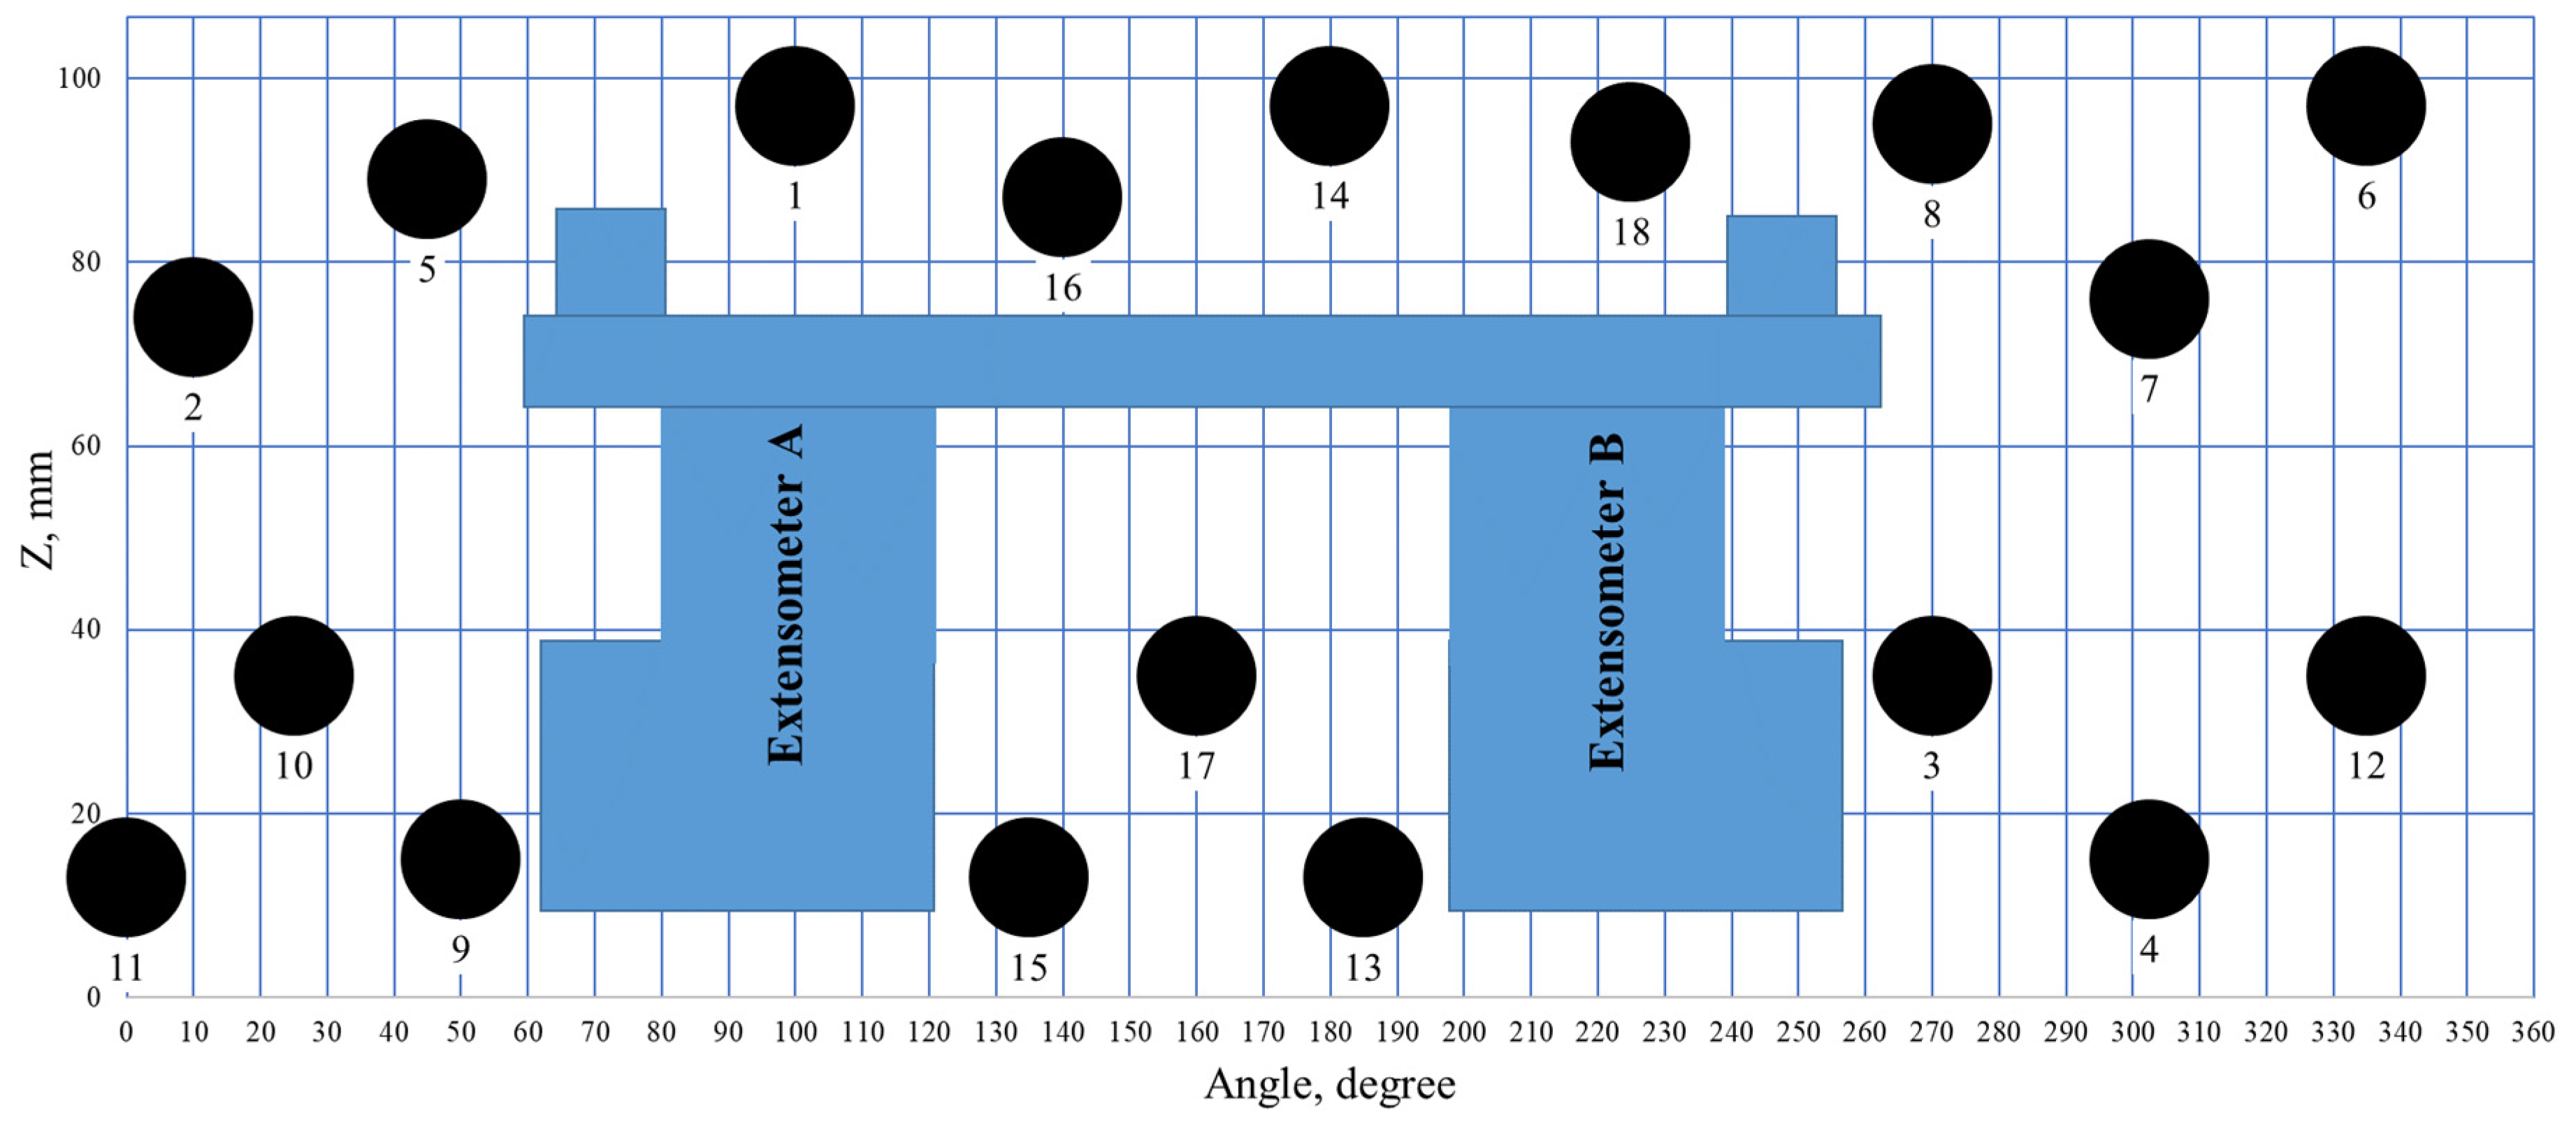
The simplified scheme of locations of the Extensometer (blue figure) and 18 single-component piezoelectric AE sensors (black circles) for granite samples are shown in Figure 4.
The sample loading procedure was based on experimental approaches presented in previous publications of [25,38,39]. The sketch of the cylindrical sample loading is shown in Figure 5. At the beginning, a confining pressure was applied to the cylindrical sample until the maximal principal stress had been reached, thereafter, the vertical component of applied stress was reduced, providing vertical orientation of the minimal principal stresses σ 3 . Once the desired stress state was achieved, the system was left to stabilize before the fluid injection. After approximately 20 min, the fluid was injected into the open section of the borehole at a constant injection rate of 5 mL/min. This injection rate was chosen for our experiments on the base of previous laboratory studies [25,40].
It should be noticed that the well is drilled in the direction of minimal principal stresses to simulate a horizontal wellbore in the field ( σ h ) . In the described configuration of the sample loading, it is possible to study the relationship of the hydraulic fracture surface topography with the viscosity of the injected fluid, which could be included in modeling of the fluid flow in the hydraulic fracture.

2.3. Fracturing Fluids

In our experiments, we used different types of non-Newtonian fluids for hydraulic fracturing on water and oil basis. The fluids were provided by the department of the international scientific center “Rational development of liquid hydrocarbon planet’s reserves” at the National University of Oil and Gas “Gubkin University” within the World-class science center (WCSC) collaboration. The injection rate for the presented experiments was constant and equal to 5 mL/min.
Water-based fluids are represented by two compositions in Table 3. One of them is a non-polymer composition and the other is a liquid based on a synthetic polymer.
Compositions of diesel-fuel-based fluids are listed in Table 4. Himeko N gelling agent is a mixture of organic orthophosphoric esters. Himeko N activator is a micellar solution of iron sulfate. The complex also includes a destructor.
Diesel fuel was taken as the hydrocarbon basis for the preparation of the oil-based fluids. Compositions are listed in Table 4. Himeko N gelling agent is a mixture of organic orthophosphoric esters. Himeko N activator is a micellar solution of iron sulfate. The complex also includes a destructor. In this study, the destructor additive was not used due to the short time of the experiment.
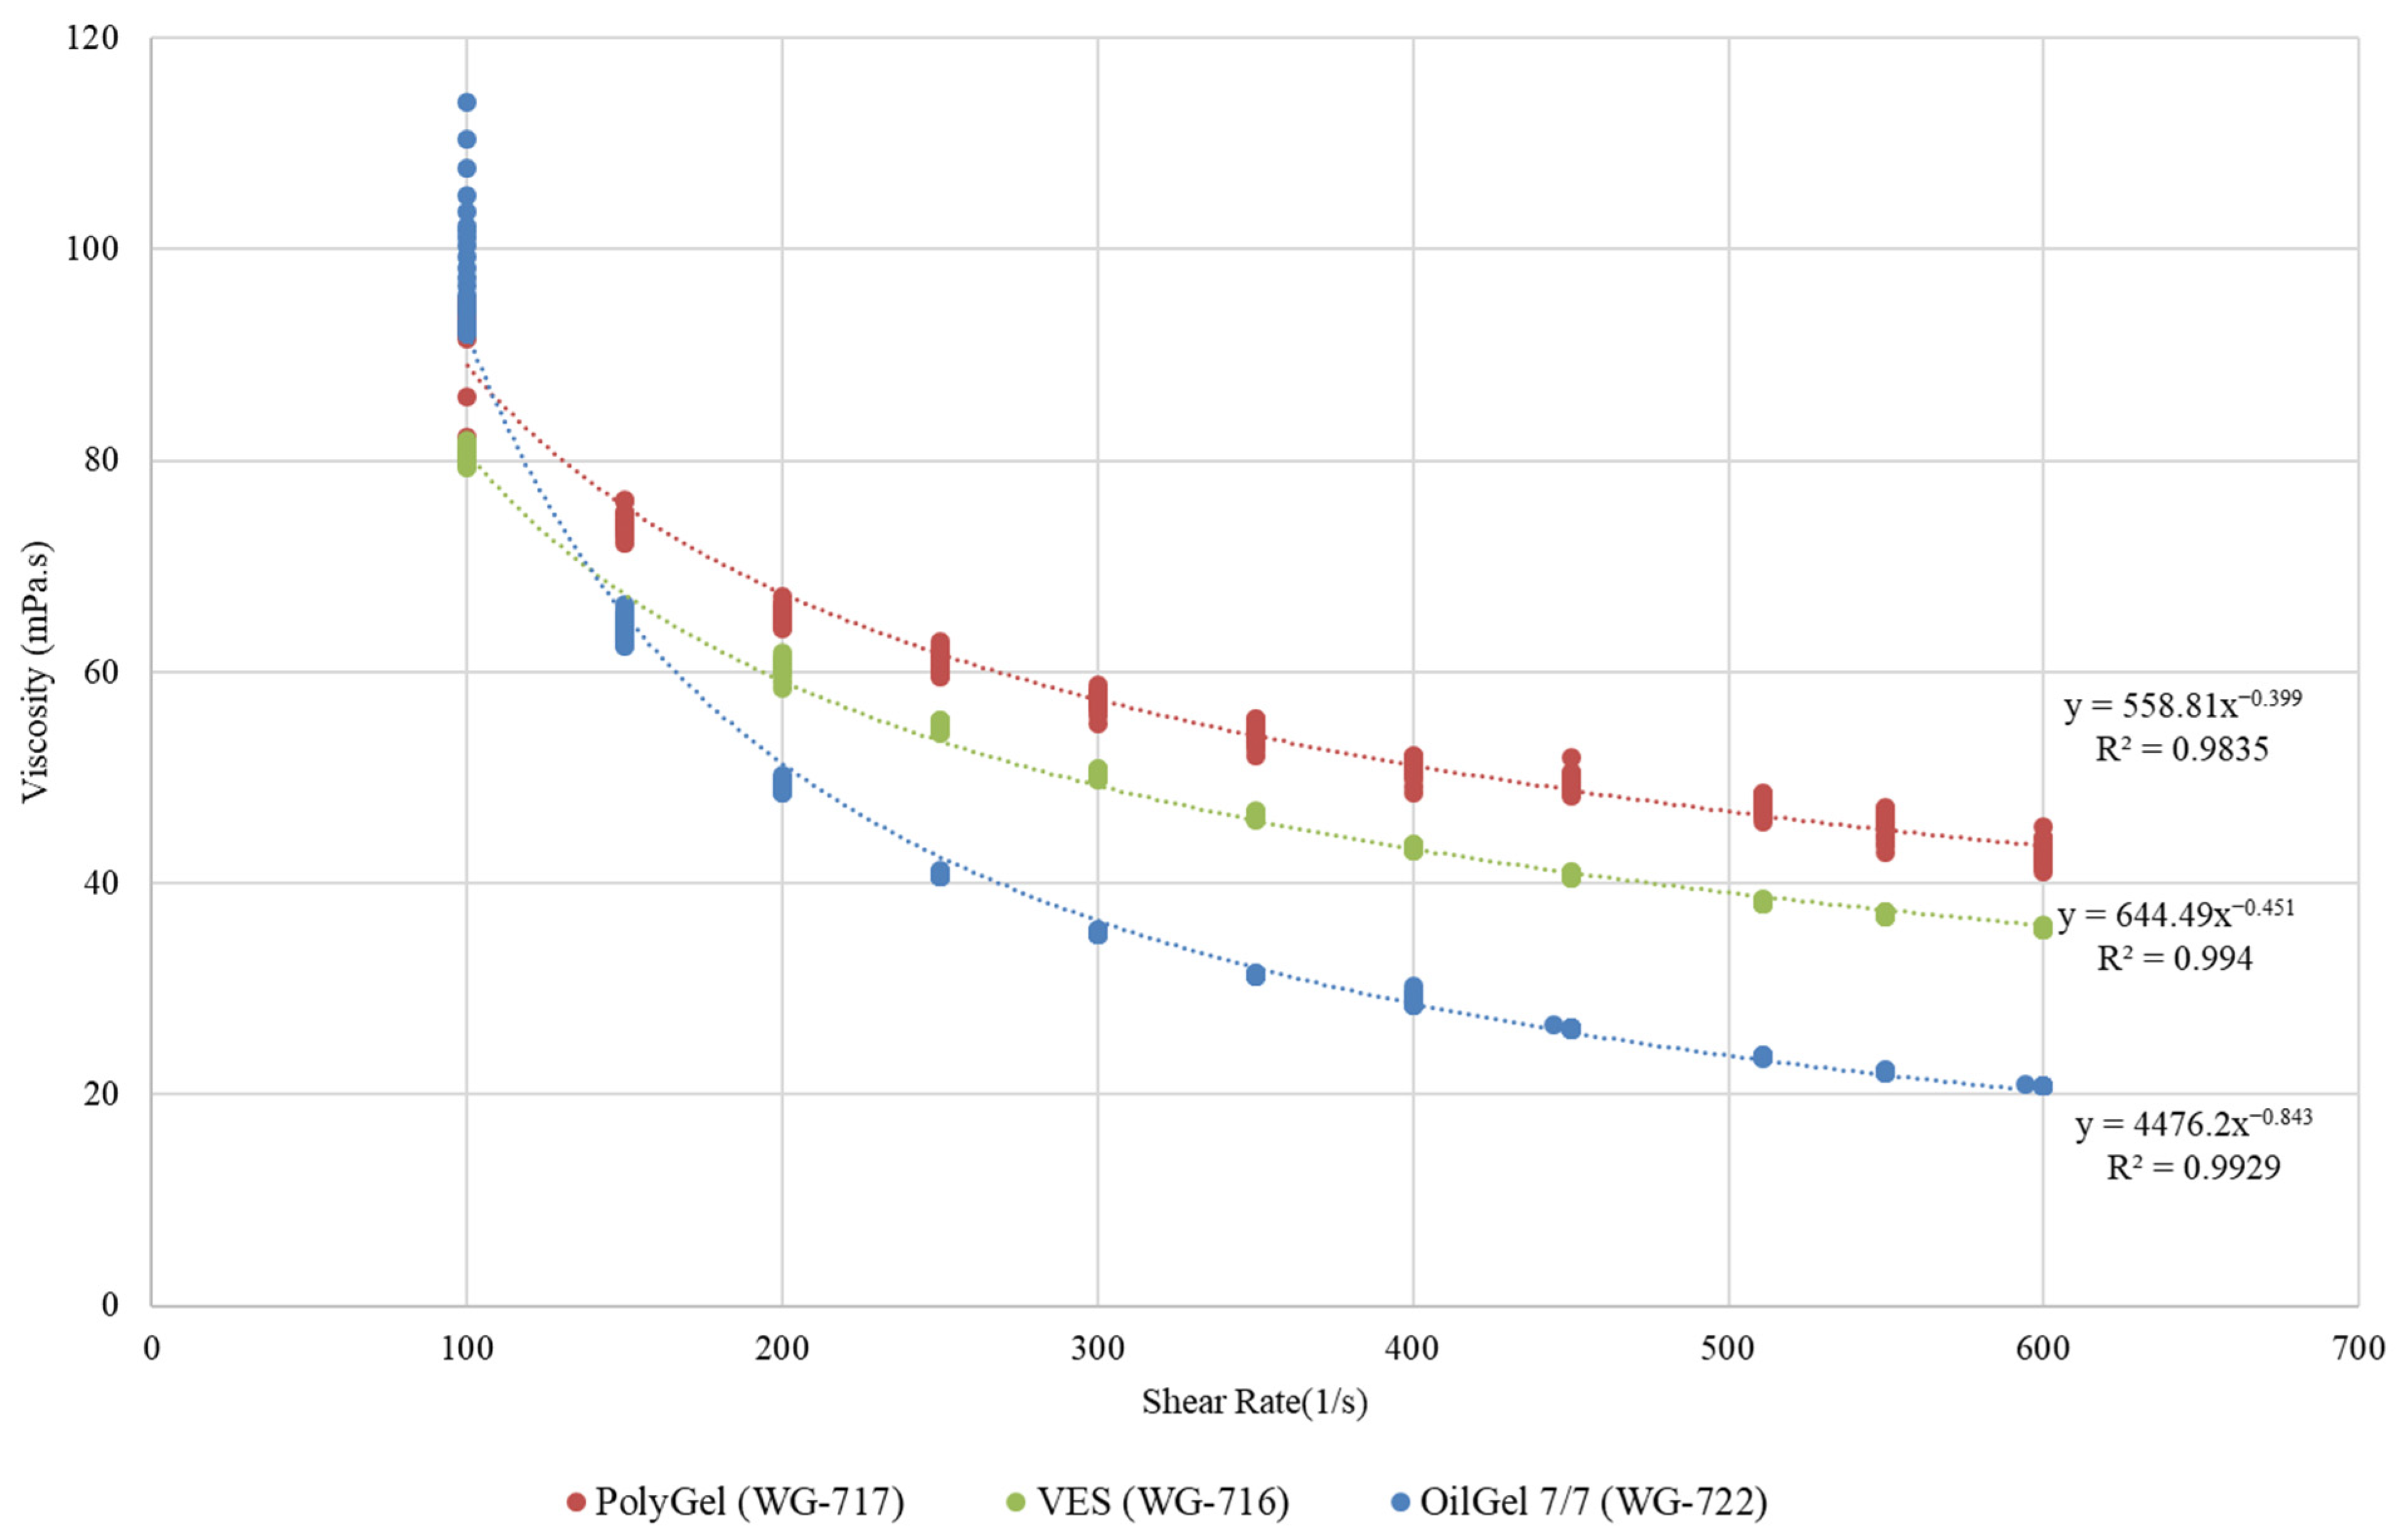
The rheology of the non-Newtonian fluids are shown in several figures (Figure 6, Figure 7 and Figure 8). The viscosities of all three fluids declined with increasing shear stress. They are approximated by the power trend lines. The OilGel 7/7 viscosity decreased most rapidly, while the PolyGel viscosity showed the smallest decrease (Figure 6). Studies of rheological parameters were carried out on a rotational viscometer Grace M5600 with cell/bob combination R1/B5.
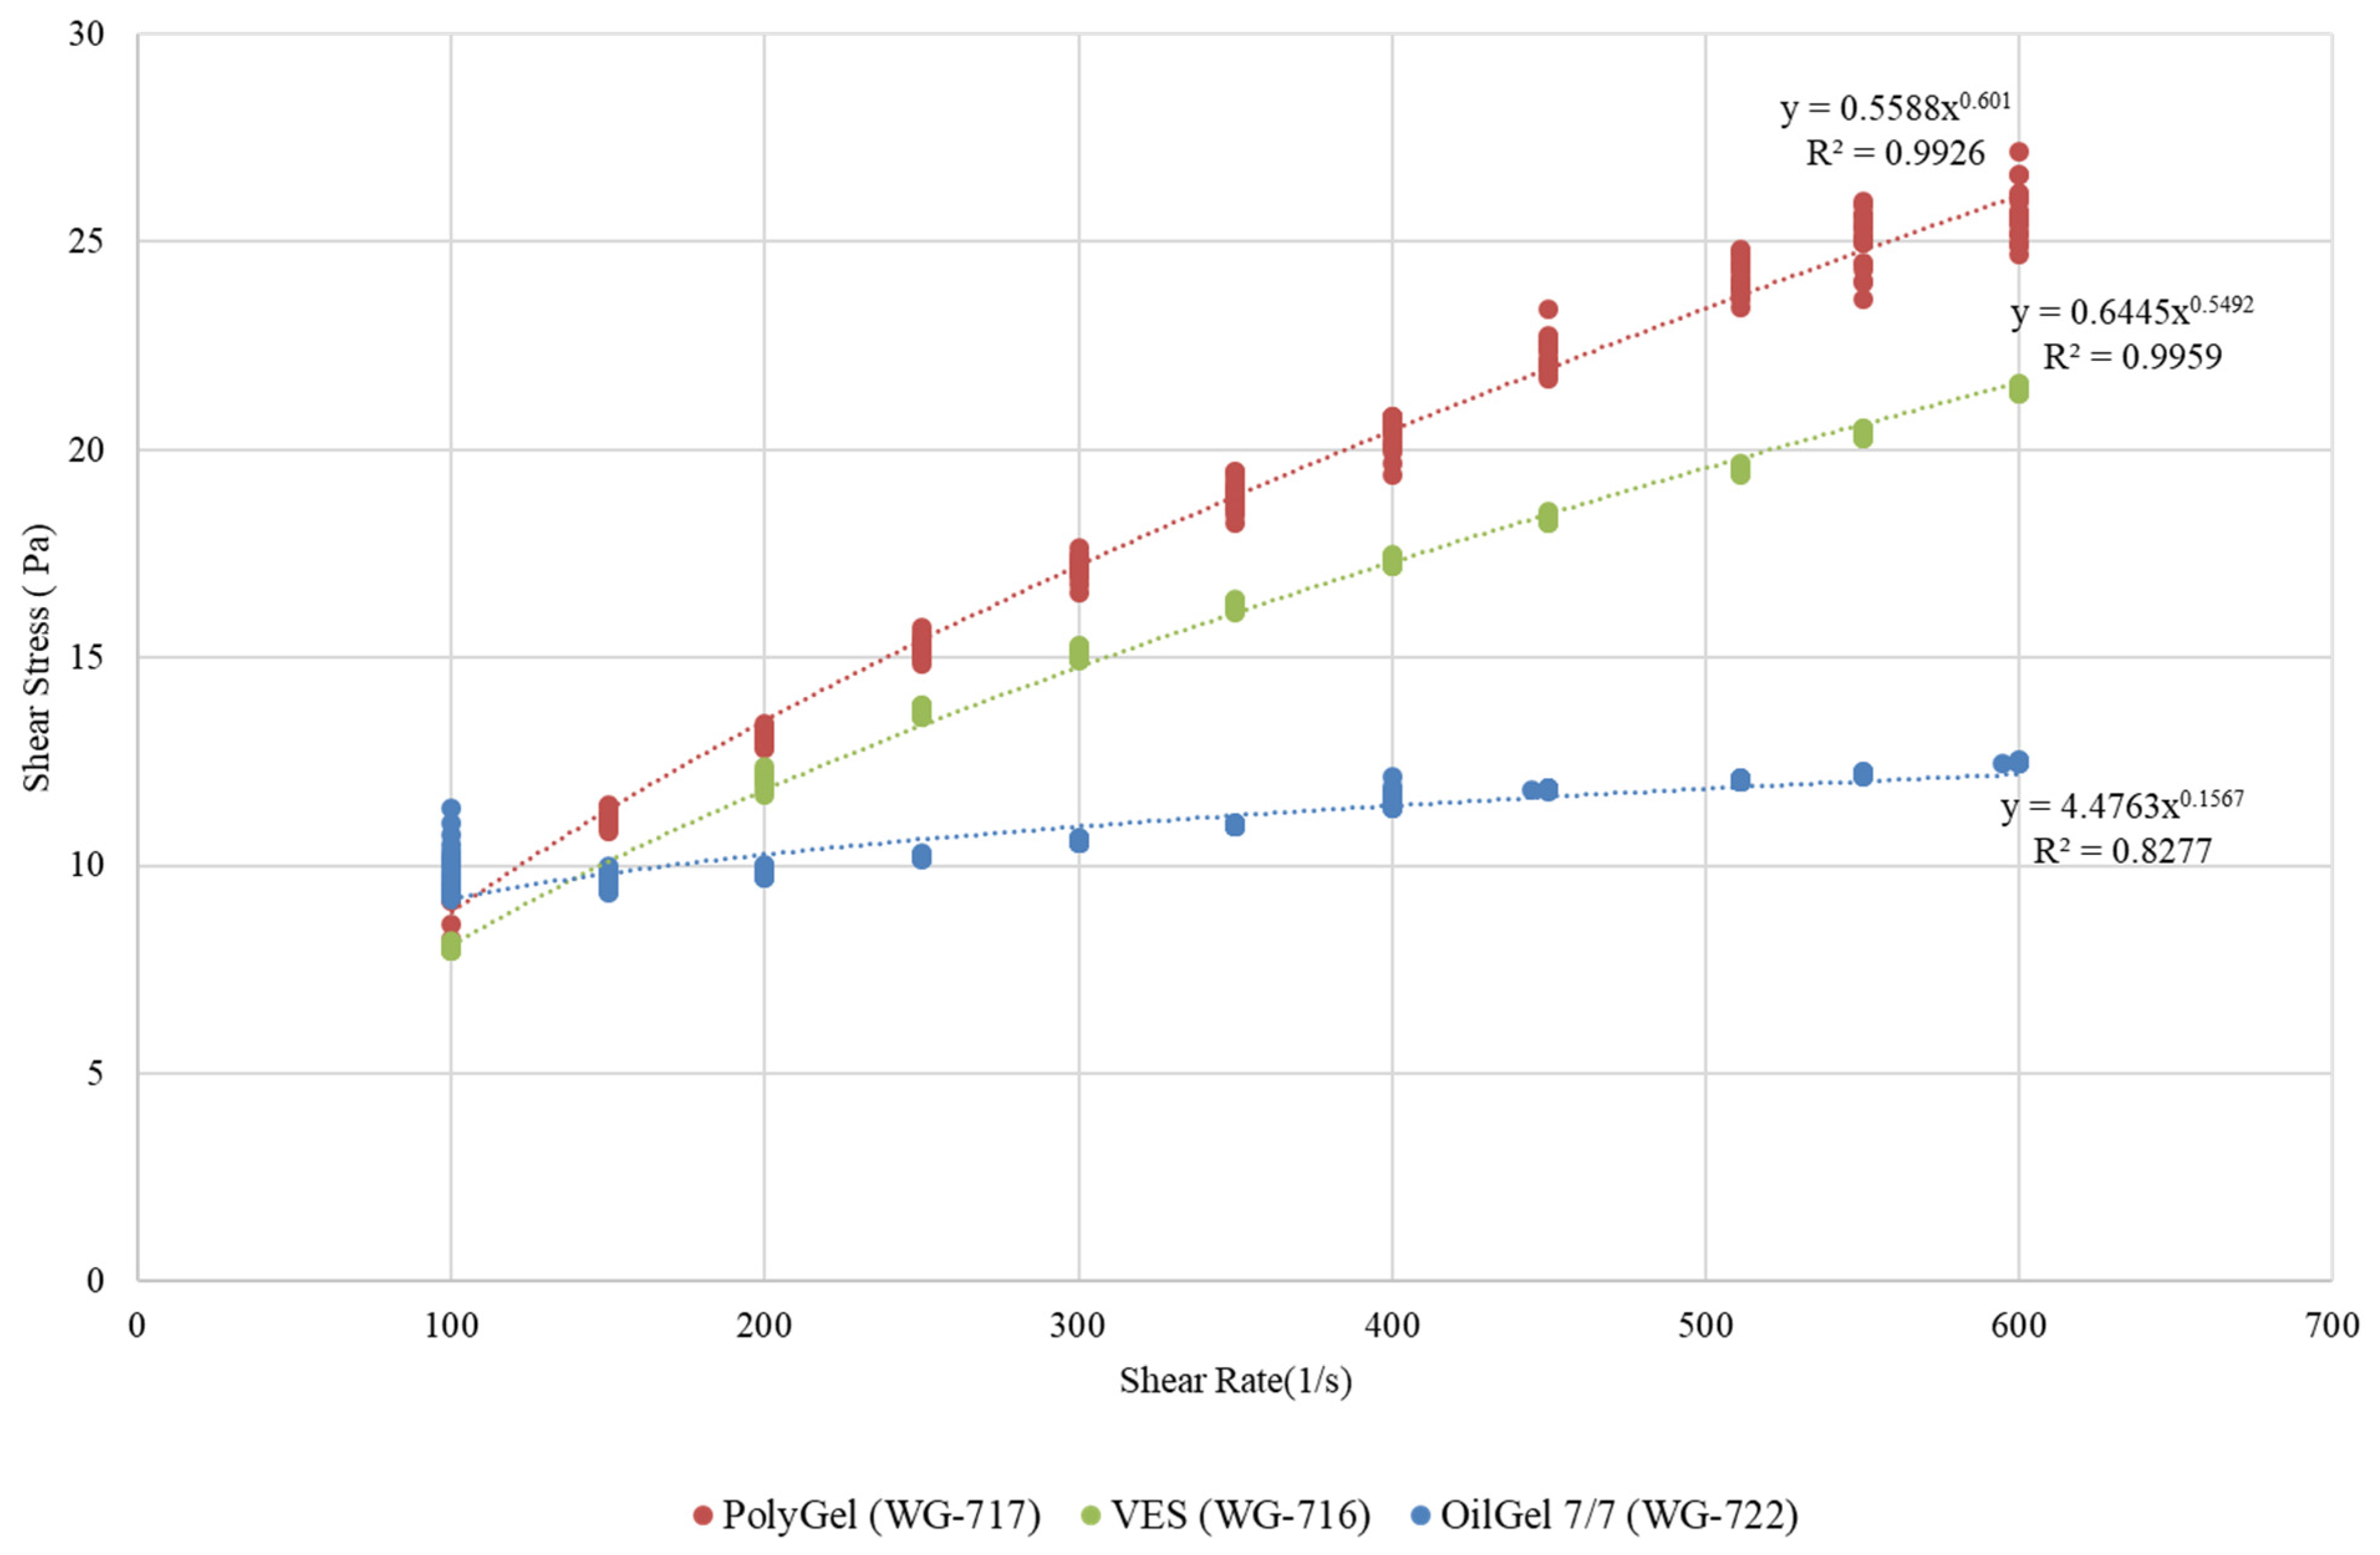
Shear stress increased with the shear rate, most significantly for PolyGel, followed by VES and OilGel 7/7. The increase of shear rate of OilGel 7/7 was insignificant (Figure 7).
The most viscous of the listed fluids is OilGel 40/40 (Figure 8). The left plot showed a decline in viscosity with increasing shear rate with good power approximation, while shear stress did not significantly depend on shear rate (the red linear trend is theoretical) because of its structural features.

3. Results

3.1. Injection of the Non-Polymer Composition Based on Ampholyte Surfactant (NEFTENOL-VES)

  • Sample WG-716
For this experiment, viscoelastic surfactant fluid was used. The fracturing fluid composition is presented in Table 3.
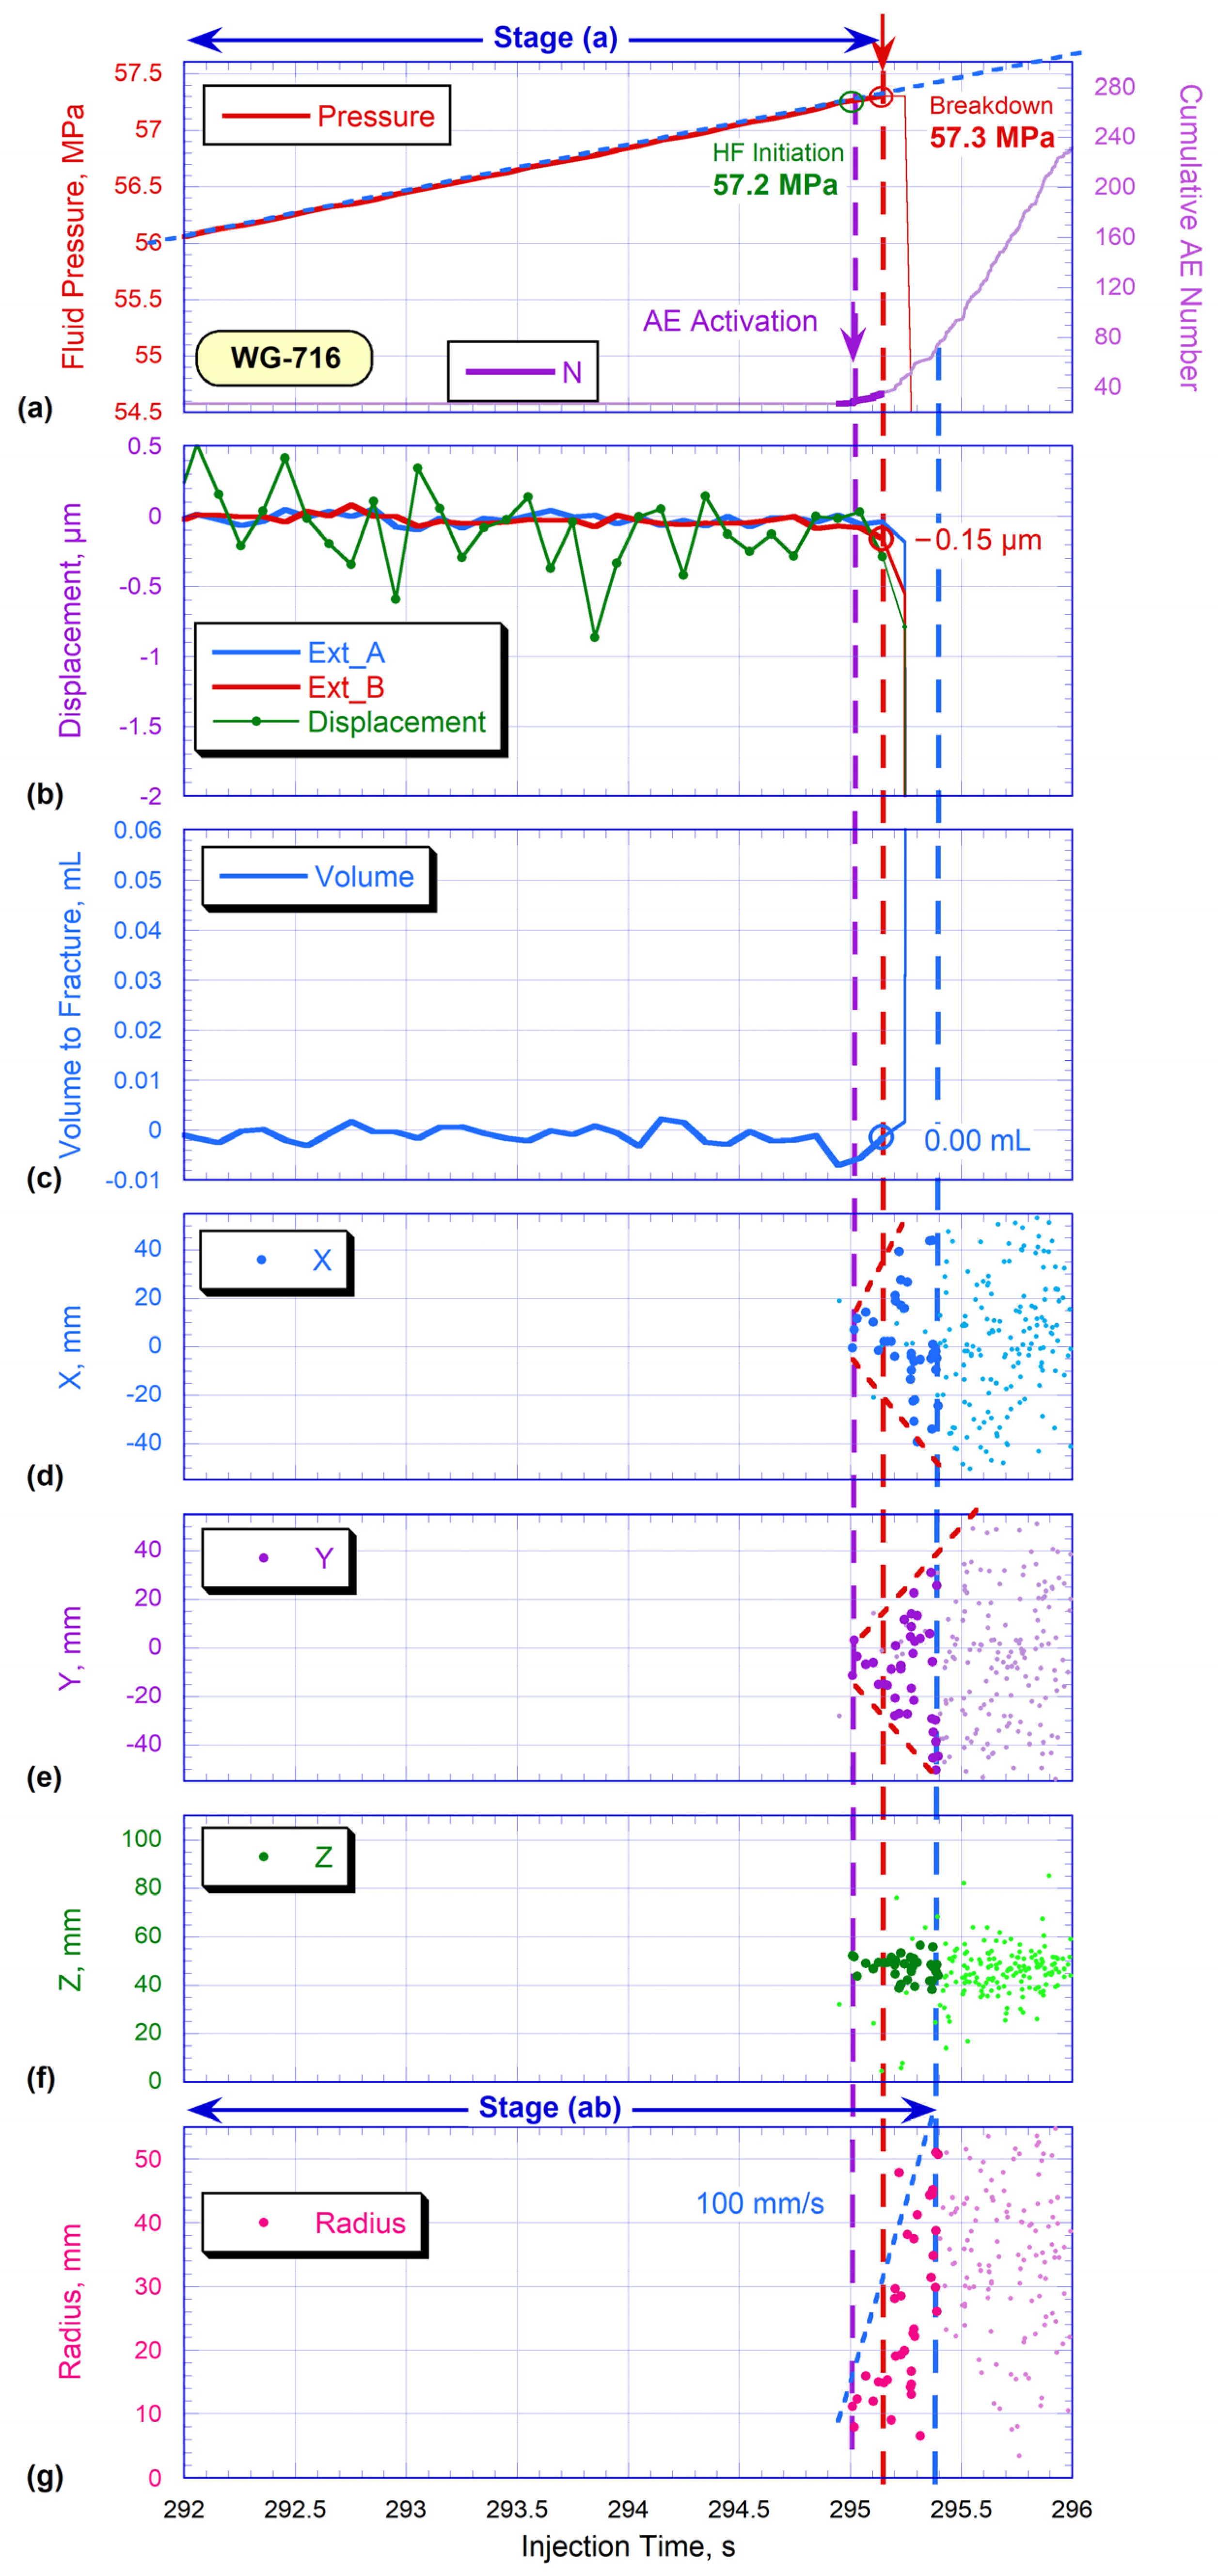
Furthermore, the hydraulic fracturing process was divided into stages. Stage (a) describes the fracture initiation and propagation until the pressure reached the maximum value. Stage (b) ends when the hydraulic fracture reached the surface of the cylindrical sample (blue dashed line) based on AE analysis. Stage (c) demonstrates the process of fracture closure, which is initiated by increasing Sigma3 until it approaches Sigma2 value. Detailed figures, describing parameters recorded during the hydraulic fracture propagation in WG-716 sample, comprising the initiation, growth and fracture closure, are provided below (Figure 9).
The upper figure (Figure 9a) describes the propagation of the hydraulic fracture until the moment when the maximum value of the fluid pressure in the fracture reached 57.3 MPa. It was registered at the moment of 295.15 s and highlighted with a red dashed line (Figure 9a, red). After the peak value, a rapid pressure drop in the well is observed. Approximately at the moment of 295 s, we observed the beginning of an increase in the cumulative number of acoustic events (Figure 9a, purple), and the pressure value there was 52.2 MPa. This moment (a green dashed line on the graph) happened 0.15 s before the maximum breakdown pressure. The results of the measurements of piston position indicating the sample extension in the vertical direction, which is related to fracture opening in the current configuration, is shown in Figure 9b, green. It appears to be noisier than the high-precision extensometers, installed directly on the lateral sample surface symmetrically to the sample axis. Extensometer B was able to measure the extension of the sample of around 0.15 microns (Figure 9b, red curve) at the moment of wellbore pressure breakdown.
The fluid volume, filling in the hydraulic fracture, is shown in Figure 9c. This parameter was calculated by subtraction of the linear trend of the pressure curve, provided in the first figure (Figure 9a, red) from the calculated volume of the fluid injected into the well. Details of this parameter calculation were presented in Ref. [25]. At the moment of maximum fluid pressure, we were unable to record the fluid volume injected into the hydraulic fracture, above the noise level.
The coordinates’ distribution of located events presented in Figure 9d,e demonstrates that the fracture propagated almost symmetrically in the X and Y planes. The distribution of AE events in a vertical projection shows their localization at the level of the open-hole section (50 mm from the base) (Figure 9f). The last plot (Figure 9g) reveals the variation of distances between located acoustic events and the wellbore (the specimen center). The distribution shows propagation of the cluster of AE events in time towards sample surface (along the sample radius) and the linear trend indicates the moment of hydraulic fracture exit on the cylindrical surface. The rate of AE signals propagation, which can be assumed to be equal to the velocity of fracture propagation, is approximately 100 mm/s.
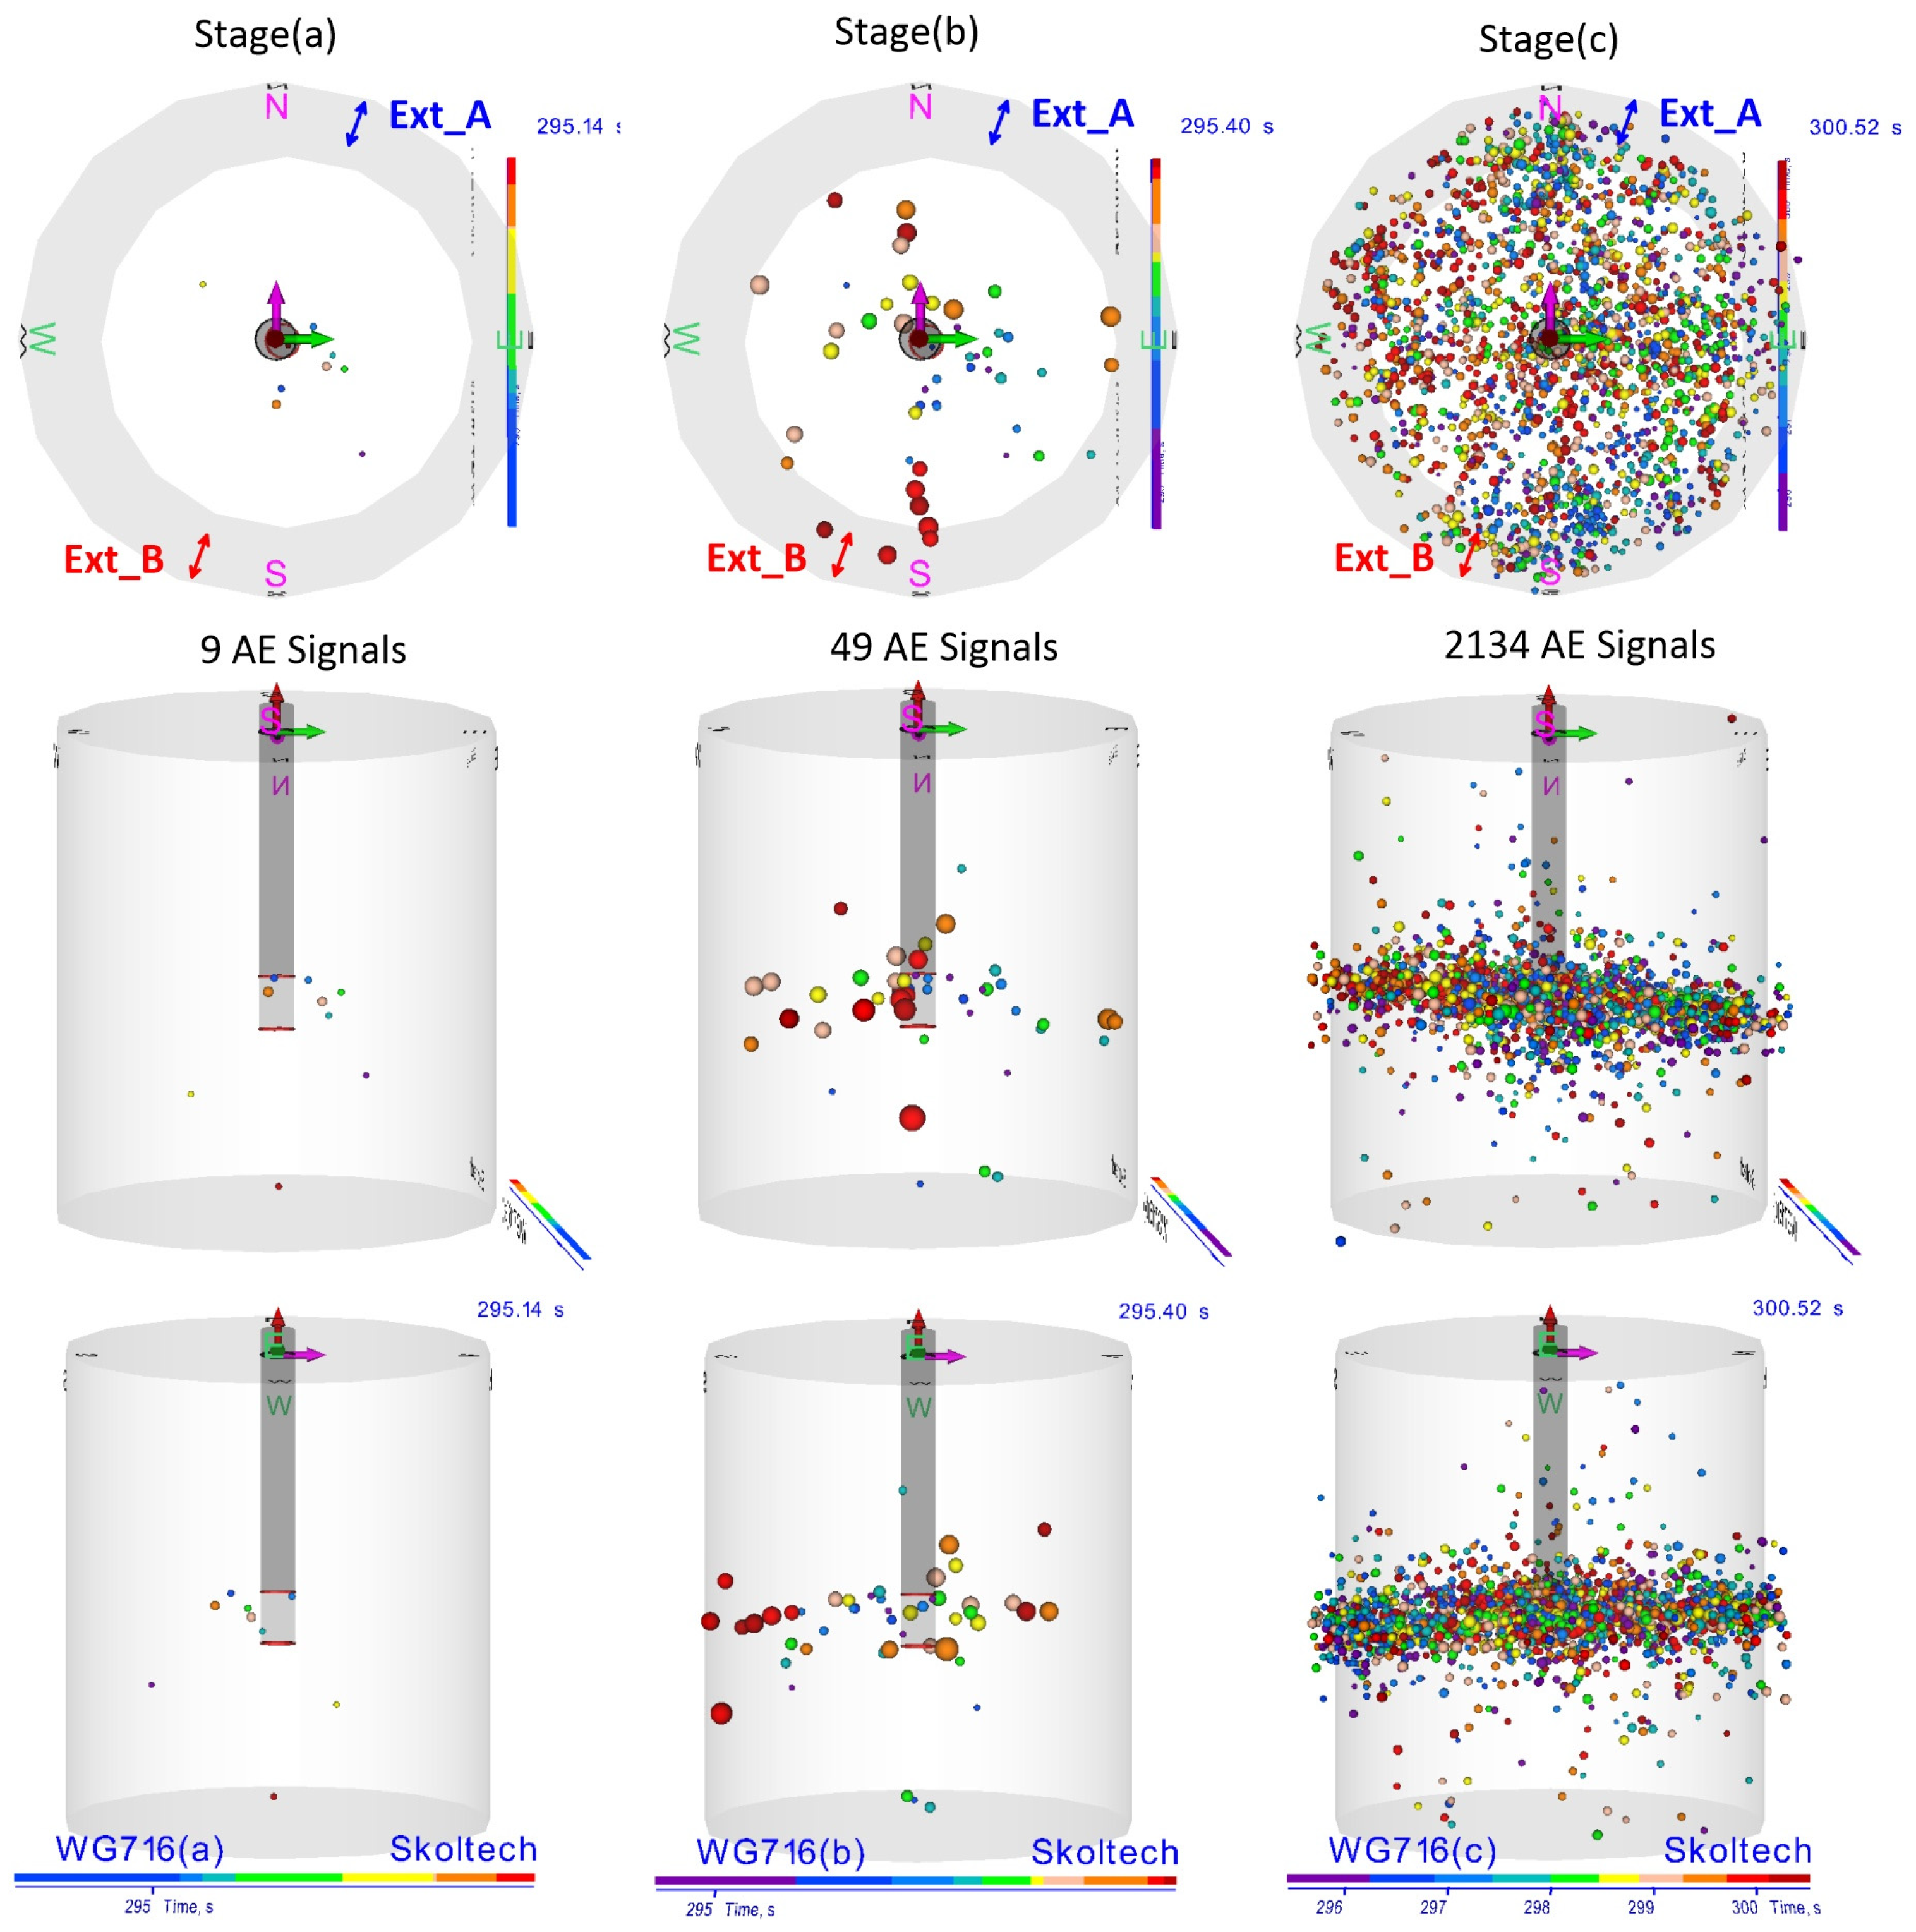
In Figure 10, three orthogonal projections of located AE signals are presented. The time of the experiment within the corresponding stage is shown with the color of AE dots from the corresponding palette, and the AE signal relative amplitude is shown with the circle size. The top view of the located AE events coordinates displays the change of the fracture propagation pattern. During stage (a), before the wellbore pressure breakdown, only several single acoustic events are observed in the south-east (S-E) sector. During stage (b), we recorded an increase of acoustic events number, and almost uniform spreading in the cross-section of the sample (in a horizontal plane). The fracture closure stage (c) demonstrates the total scattering of AE events across the whole cross-section.
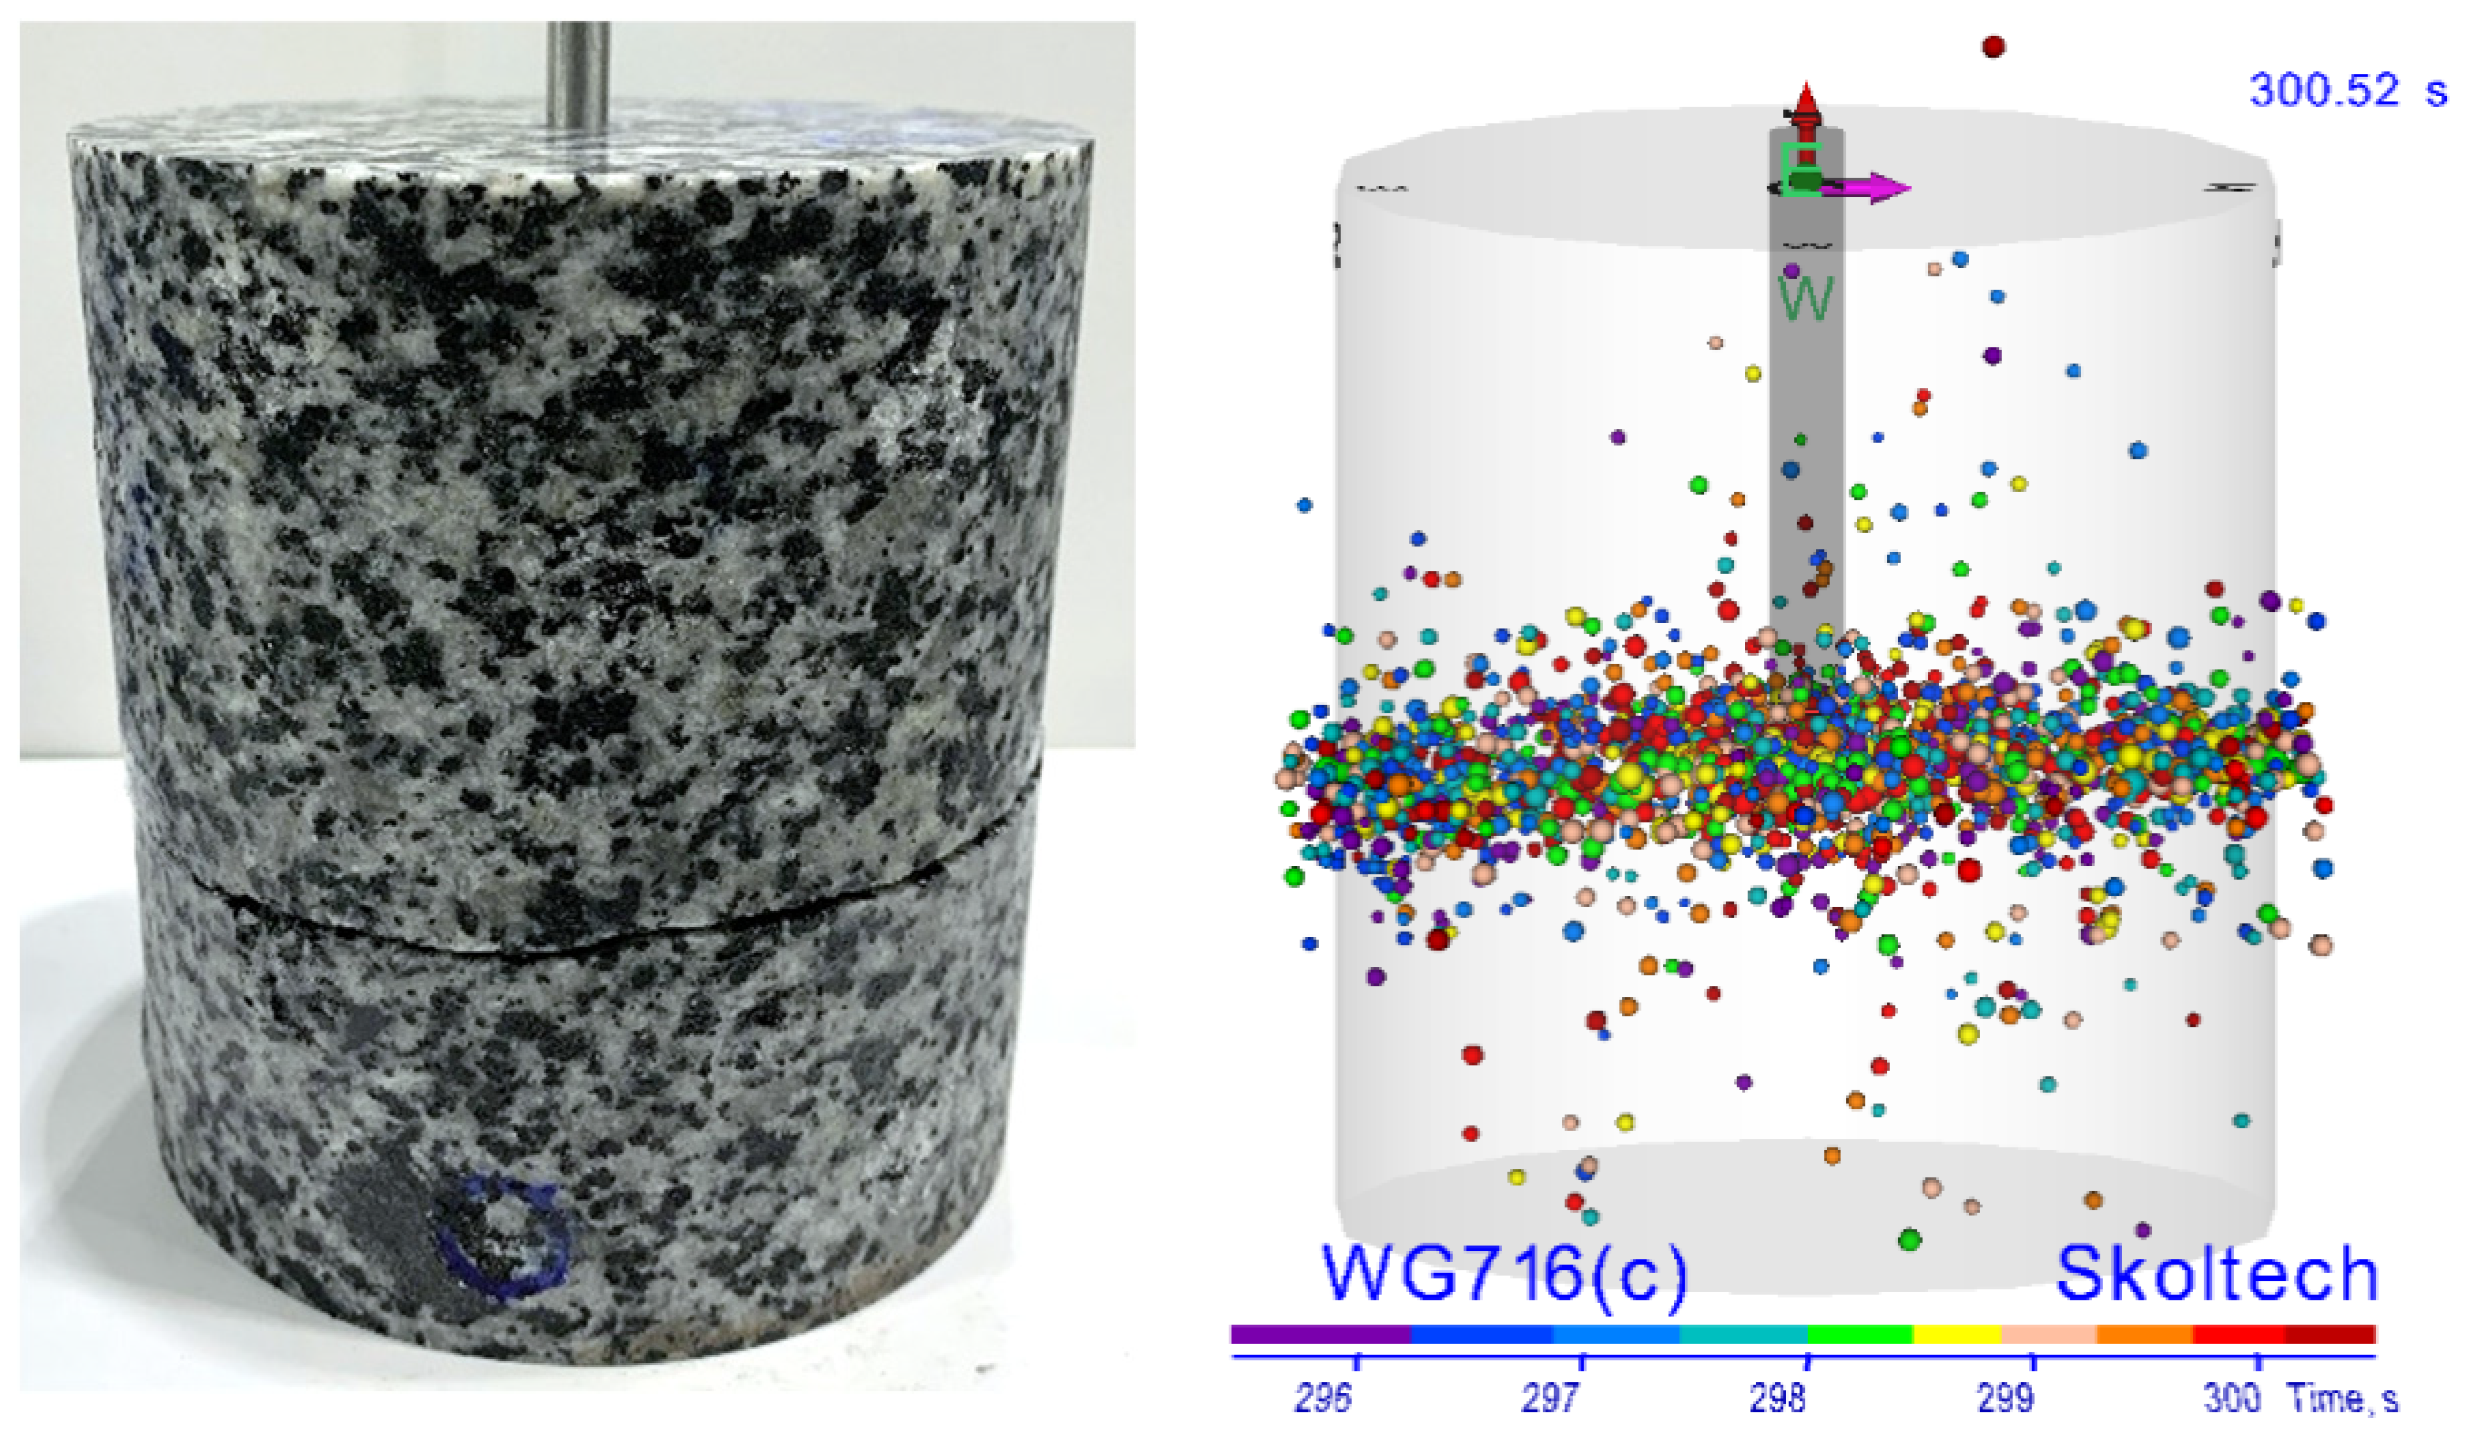
The side view depicted in Figure 10 confirms almost symmetrical HF propagation in the horizontal direction since AE events were located at both sides of the wellbore, approximately at the position of the open-hole section. At the last stage, AE events were located within a small-angle sector and were well-aligned with the formed fracture (Figure 11).

3.2. Injection of the Water-Based Synthetic Polymer Solution (PolyGel)

  • Sample WG-717
For this experiment, the fluid based on synthetic polymer (Table 3) was used.
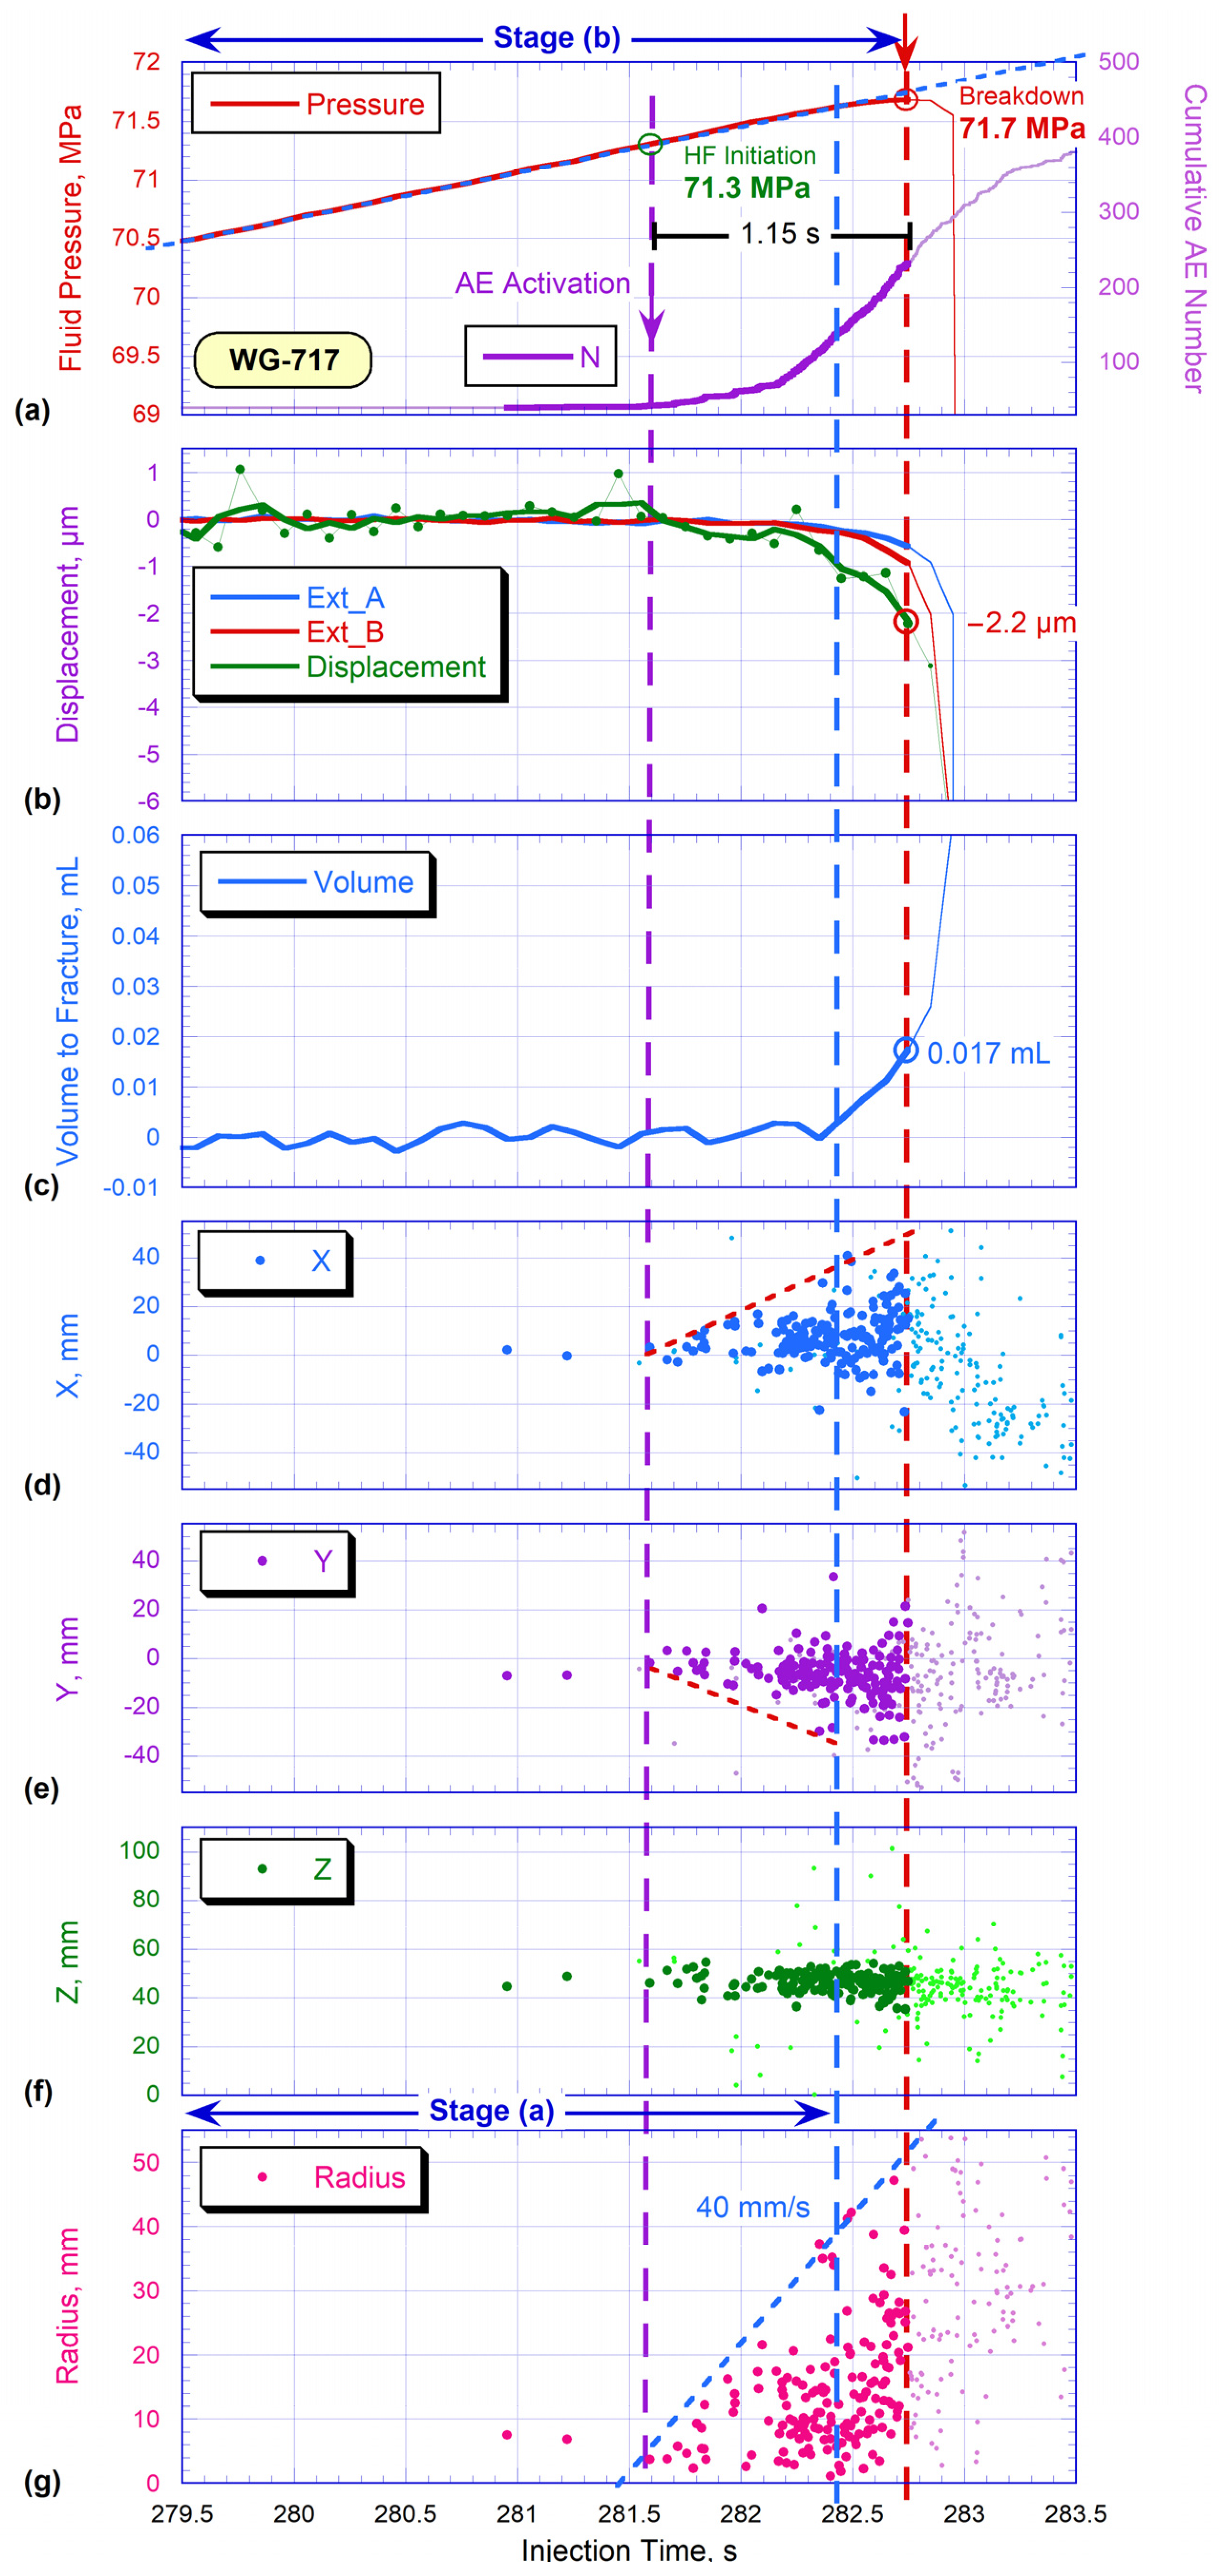
The hydraulic fracturing process was also divided into stages. Stage (a) is completed when the injected fluid started to penetrate the hydraulic fracture (vertical blue dashed line). Stage (b) ends at the moment of the maximum injection pressure, or at the breakdown moment. Stage (c) is fracture closure. The figure describing the hydraulic fracture propagation parameters recorded for WG-717 sample are provided below (Figure 12).
The upper figure shows the fluid pressure in the fracture (Figure 12a, red), and the curve’s maximum at 71.7 MPa, registered at the moment of 282.73 s, is marked by a red vertical dashed line. Approximately at the moment of 281.58 s, we observed the AE activation (Figure 12a, purple). This moment (green dashed line) happened 1.15 s before the maximum breakdown pressure, when the fluid pressure was 71.3 MPa. It should be noted that the time interval from the fracture initiation (AE activation point) to the maximum fluid pressure in this experiment is much longer than in the previous one (it was recorded for only 0.15 s for the WG-716). The sensor measuring the piston position (Figure 12b, green) indicated a more significant/substantive increase of the sample size in the vertical direction (of around—2.2 microns) than in the previous test. At the moment of the maximum fluid pressure, we recorded the fluid volume injected into the hydraulic fracture of around 0.017 mL (Figure 12c).
The coordinates’ distribution of located AE events presented in Figure 12d,e shows that during this test the hydraulic fracture propagated asymmetrically; unidirectional growth in the number of acoustic events in the X and Y planes predominates. The position of localized AE signals in the vertical direction was approximately at the level of the open-hole section (48 mm from the base) (Figure 12f). Importantly, in contrast to the WG-716 sample, when the HF reached the surface after the breakdown moment, for this experiment WG-717, it happened almost at the time of the maximum pressure. According to Figure 12g, calculated fracture propagation velocity was about 40 mm/s.
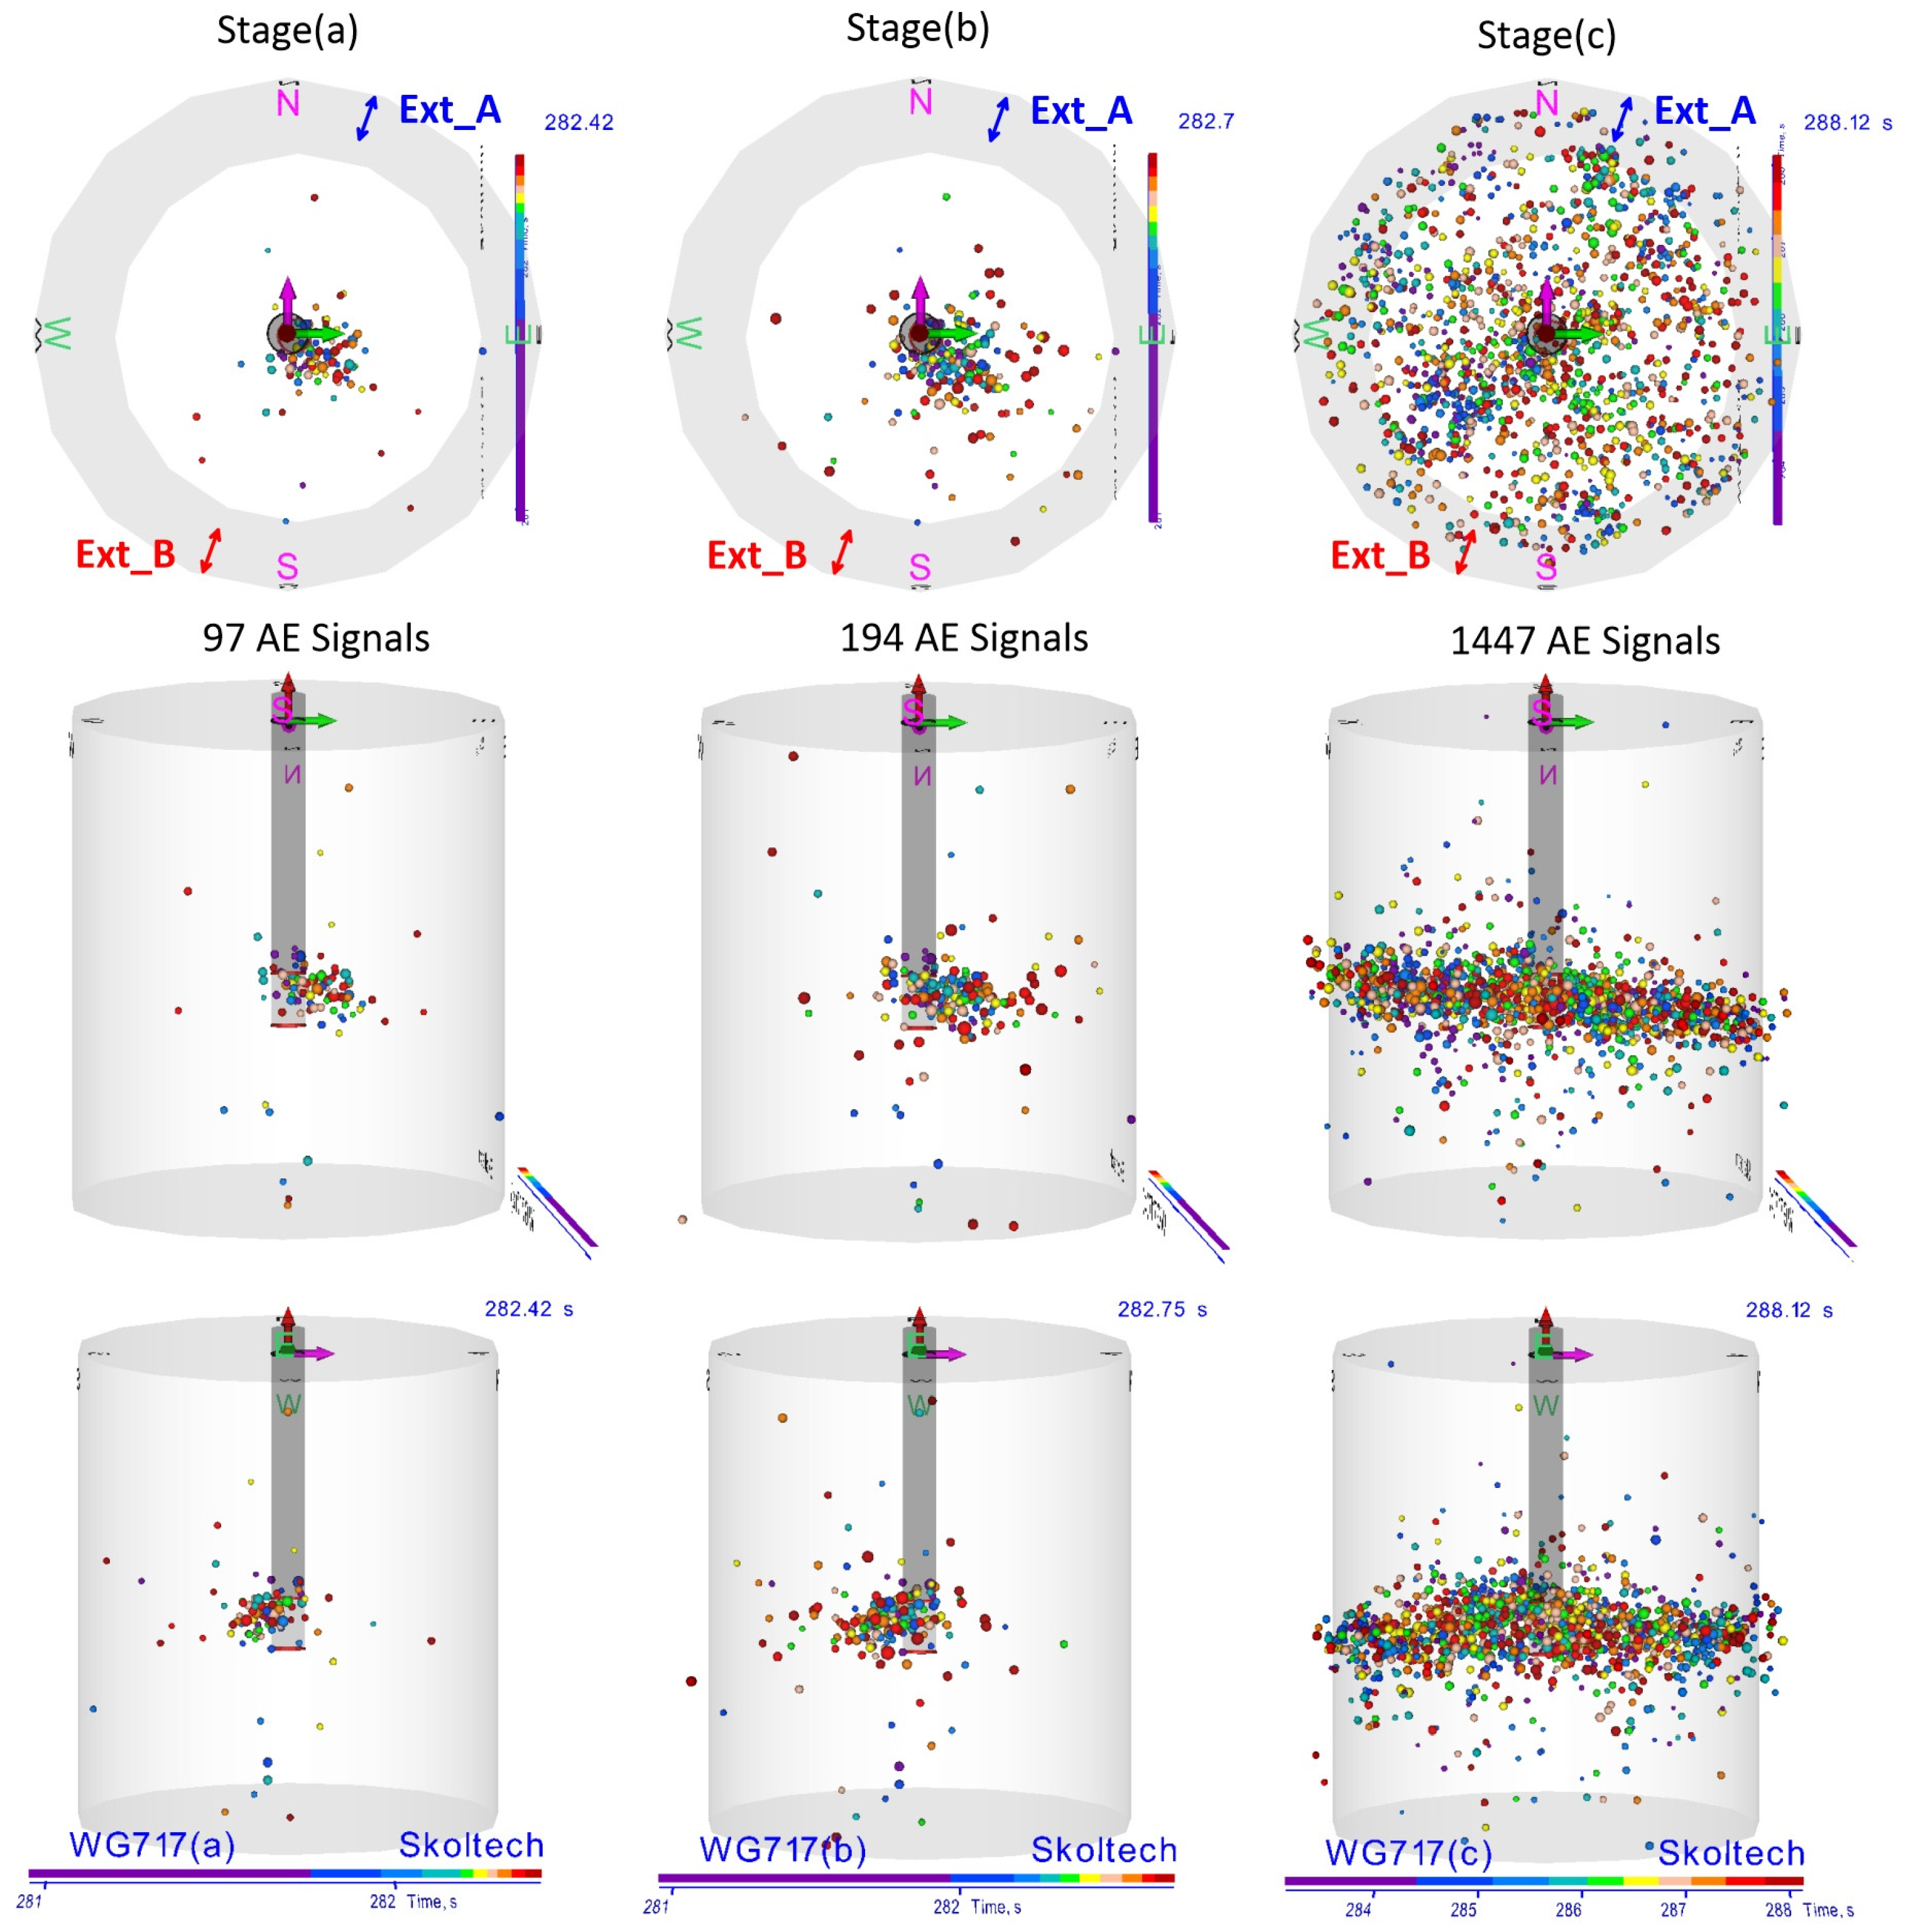
Three orthogonal projections of the located AE signals are shown in Figure 13. In stage (a), namely at the moment when fluid started entering the HF, there is a slight accumulation of acoustic events in the south-east (S-E) direction from the well. At stage (b), at the moment of wellbore pressure breakdown, a larger number of acoustic events are located, which occupied 1 3 of the cross-sectional area of the sample. The predominant direction of crack propagation is also south-east (S-E). Stage (c) shows the process of fracture closure, AE events are recorded over the entire cross-sectional area.
The side view projections presented in Figure 13 confirm the almost unidirectional (south-east) development of the hydraulic fracture in the horizontal direction during the first two stages. Only at the last stage of the process were the AE events located on both sides of the wellbore, slightly inclined in southern projection, approximately at the level of the open-hole section. The localization of AE events is well comparable to the real fracture.

3.3. Injection of Diesel Fuel-Based Fracturing Fluid with Gelling Complex Grade “N” (OilGel 40/40; OilGel 7/7)

  • Sample WG-721
For this experiment, viscous waterless OilGel 40/40 fluid (Table 4) was used. The HF process was also divided into stages. Stage (a) describes the fracture initiation and propagation until the beginning of fluid penetration into the fracture, indicated by a curve of fluid volume in Figure 14c (blue dashed line). Stage (b) finishes at the maximum pressure value (red dashed line). Stage (c) demonstrates the process of fracture closure. Detailed figures describing hydraulic fracture propagation in WG-721 sample are provided below (Figure 14).
The upper figure demonstrates the hydraulic fracture pressure curve. Its maximum value reached 39.9 MPa at the moment of 302.60 s (Figure 14a, red). Approximately at the moment of 299.10 s we observed the initiation of the increase of the cumulative number of acoustic events (Figure 14a, purple). This moment (purple dashed line) happened 3.50 s before the breakdown pressure. It is important to notice that fracture propagation was significantly asymmetrical (Figure 14e). In addition to the analysis of AE spatial distribution, it was also confirmed by independent measurements of sample deformations done by two extensometers symmetrically installed on the opposite points on the cylindrical specimen surface. Extensometer_A (Figure 14b, green) indicated an increase in the size of the sample of only around 0.2 microns, while at the same time Extensometer_B (Figure 14b, red) measured a significantly larger deformation of about 4.0 microns. The sensor of the loading piston displacement (Figure 14b, blue) allowed to measure a value of around 2.0 microns, which is close to the average between two extensometers.
Fluid started penetrating the hydraulic fracture at approximately 301.60 s (Figure 14c). Note that it is a couple seconds later than the HF was initiated. At the moment of maximum fluid pressure (302.60 s), we recorded the fluid volume injected into the hydraulic fracture, which is about 0.026 ml.
The coordinates’ distribution of the located AE events (Figure 14d,e) shows that the fracture propagates significantly asymmetrically (horizontal red dashed lines). Unidirectional HF growth predominated in the X and Y planes (Figure 14d,e), and was confirmed by AE events distributions. In the vertical direction, AE signals demonstrated their localization approximately at the level of the open-hole section (47 mm from the base) (Figure 14f). The hydraulic fracture propagation velocity for this experiment was 15 mm/s (Figure 14g).
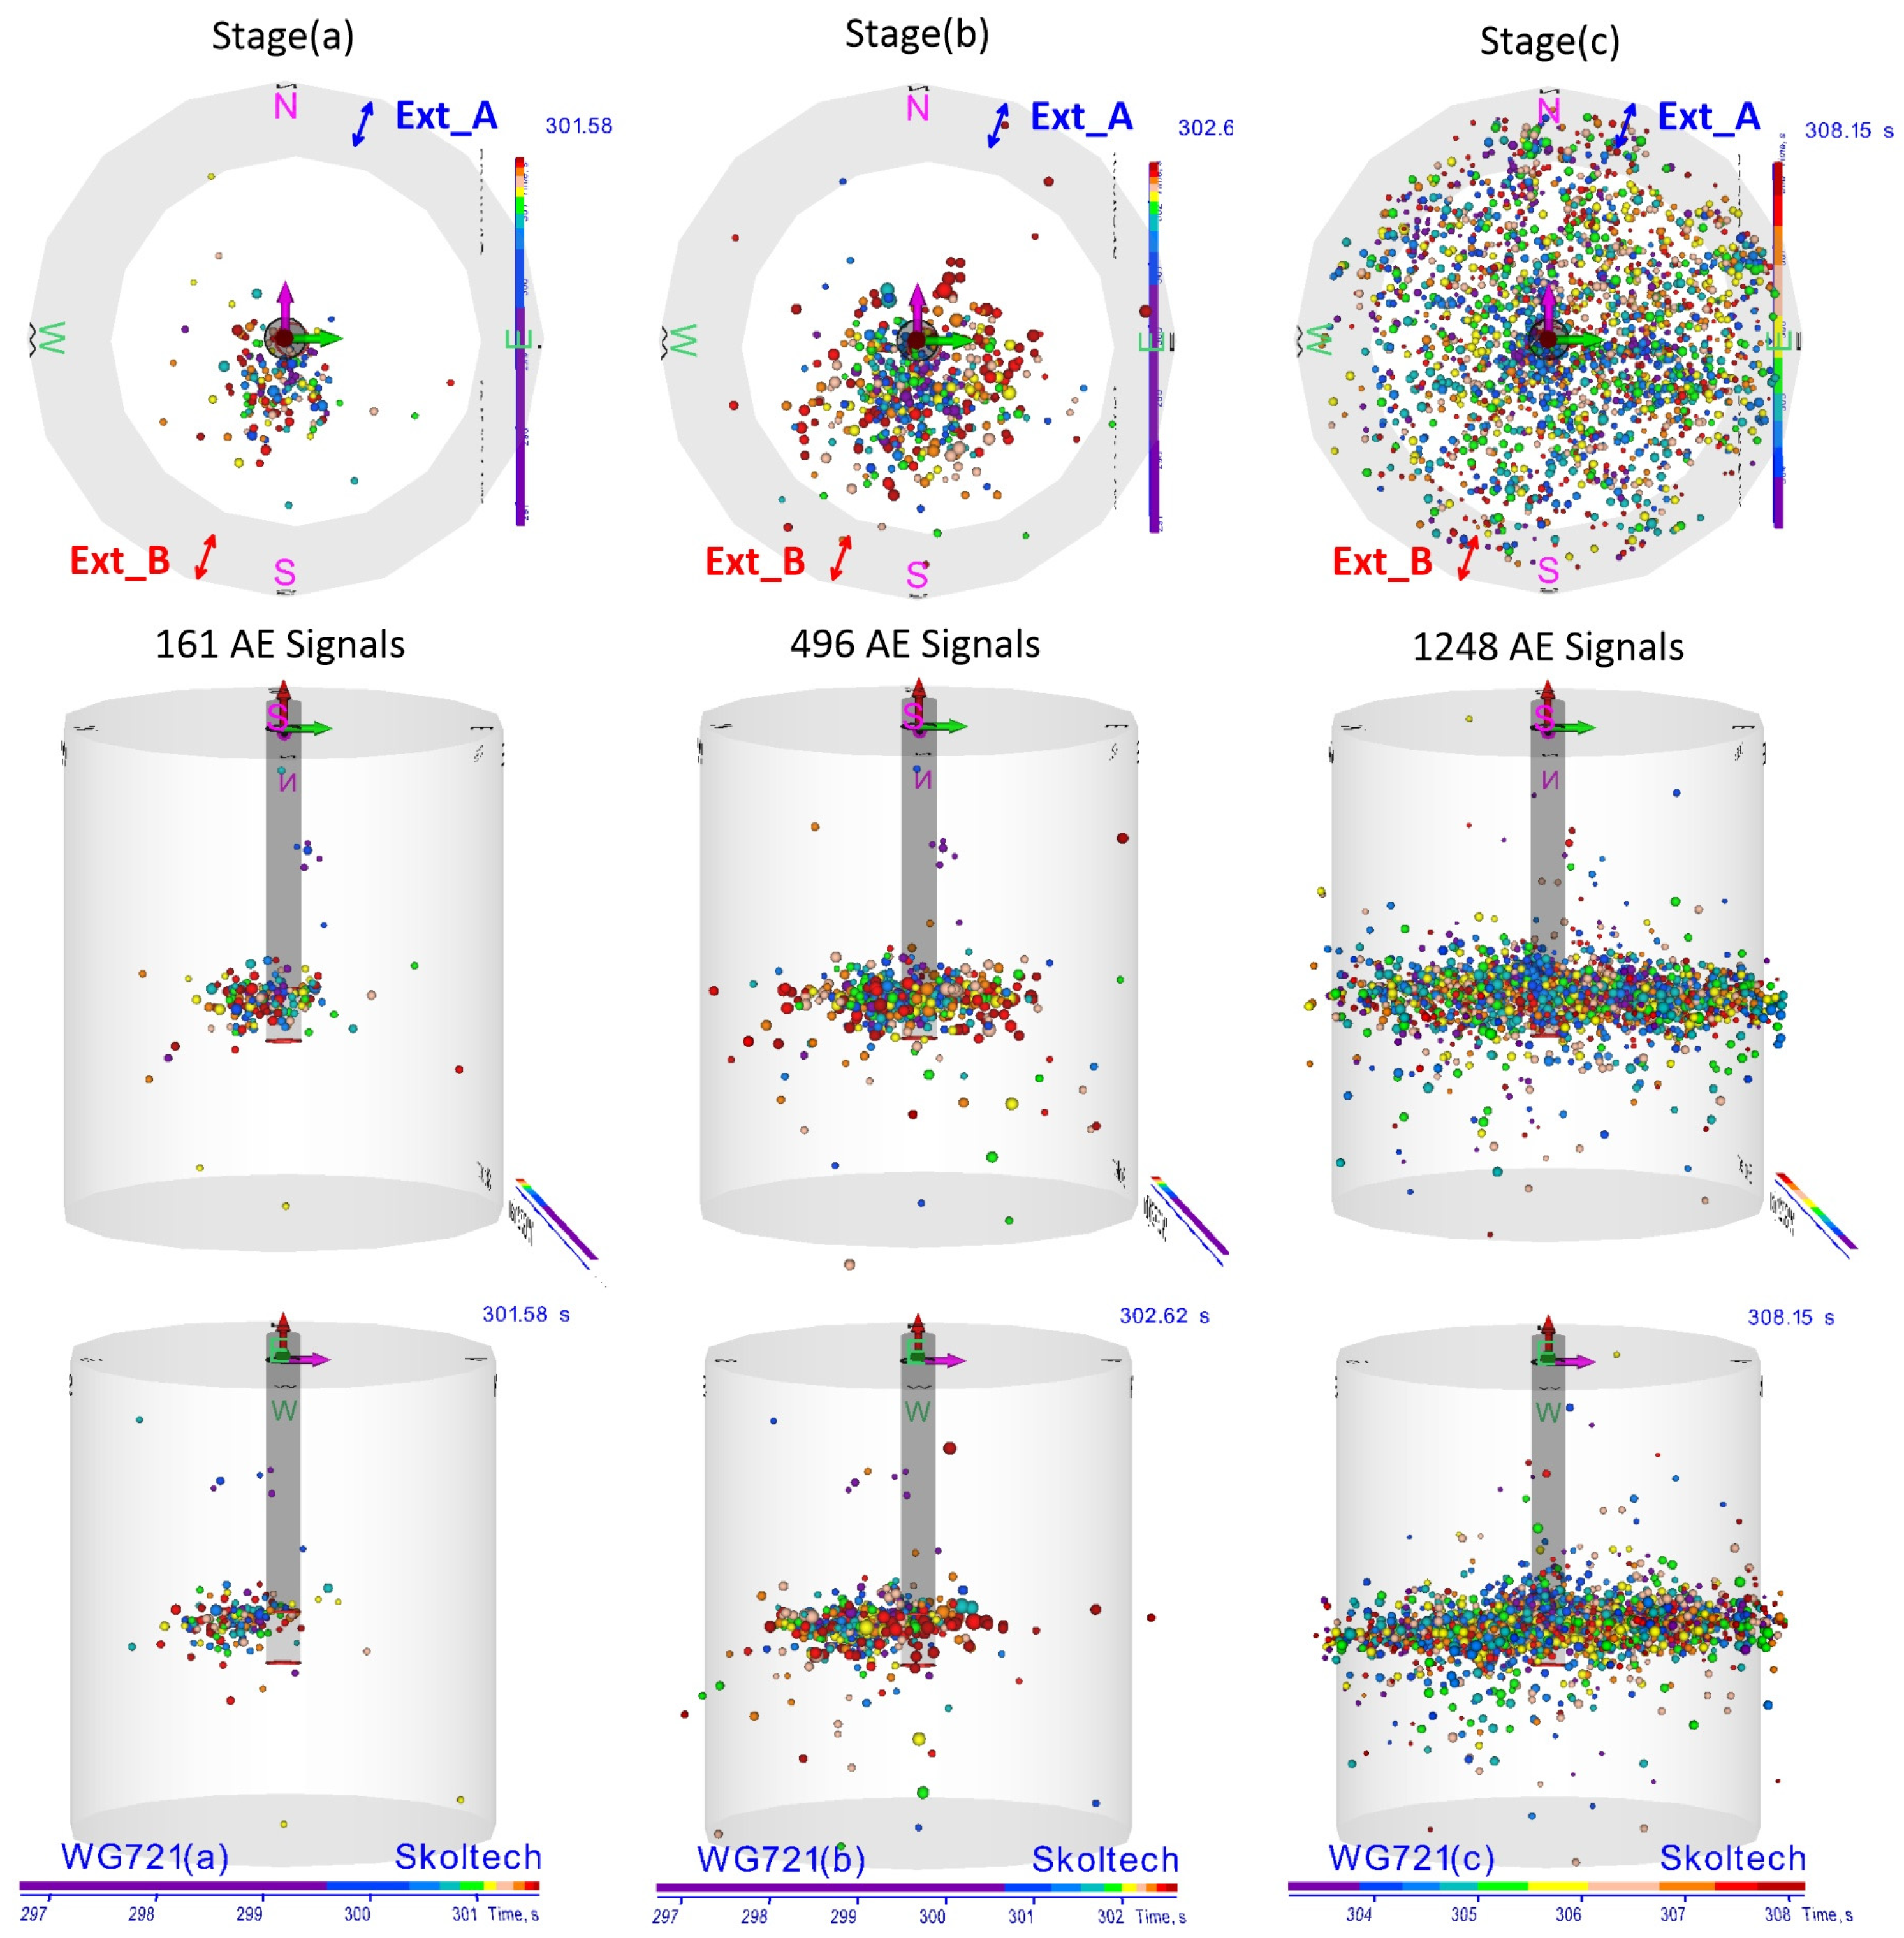
Figure 15 shows three orthogonal projections of the positions of the located AE signals. The top view of the coordinates of the located AE events displays the fracture propagation relative to the wellbore. The experiment is characterized by an almost radial crack opening, shifted in the southern (S) direction. At stage (a), there is an almost unidirectional acoustic events accumulation with a predominance of their number in the southern (S) orientation from the well. This fracture opening direction closely corresponds to the results of dominating Extensometer_B measurements (Figure 14b, red). At stage (b), the shift of the located signals cloud in the south-west (SW) direction is more confident and only several events were observed in the northern (N) direction. In addition, asymmetrical fracture growth was confirmed by extensometers: the southern Ext_B determined 4.0 microns vertical disclosure and the northern Ext_A showed only 0.2 microns. Despite the unidirectional fracture growth and opening, it has an almost radial pancake-like shape, shifted from the center of the sample. Stage (c) shows the process of fracture closure, AE events are recorded over the entire cross-sectional area.
The side view presented in Figure 15 also confirms the predominately south-west (SW) hydraulic fracturing propagation in the horizontal direction. Only at the last stage (c) were the AE events located on both sides of the well at the level of the open-hole section. The localization of AE events provides good representation of the formed fracture.
  • Sample WG-722
For this experiment, low viscous OilGel 7/7 fluid (Table 4) was used. The hydraulic fracturing process was also divided into the same stages as in the previous test (WG-721). Detailed figures describing hydraulic fracture propagation in WG-722 sample are provided below (Figure 16).
The upper plot shows the fluid pressure in the fracture (Figure 16a, red). At the moment of 219.60 s, the breakdown pressure of 39.23 MPa was registered. Soon after the peak value, a rapid drop in pressure in the wellbore was observed (Figure 16a, red). Approximately at the moment of 218.00 s, we noticed the initiation of AE activity (Figure 16a, purple). This moment (purple dashed line) happened approximately 1.50 s before the breakdown pressure was reached. This interval was shorter than in the previous experiment (WG-721). Extensometer_B allowed to measure the increase in the size of the sample of around 0.9 microns at the moment of fluid pressure breakdown (Figure 16b, red).
Fluid began to enter the fracture starting from the 219th s of the experiment (Figure 16c). This moment is indicated by a blue arrow and a vertical dashed blue line. The obtained results show that fluid started entering the fracture approximately 1 s after the initiation of the HF, marked by a vertical red dashed line. At the moment of breakdown pressure (219.60 s), we recorded the fluid volume injected into the hydraulic fracture approximately equal to 0.01 mL.
The coordinates’ distribution of the located events (Figure 16d,e) shows that the fracture propagated more or less symmetrically. In the X and Y planes, acoustic events were oriented almost uniformly in two directions (horizontal red dashed lines). The positions of AE signals in the vertical direction demonstrate their localization in the upper part of the open-hole section (approximately at 57 mm from the base) (Figure 16f). The last plot (Figure 16g) demonstrates the speed of AE cloud propagation, which turned out to be about 20 mm/s.
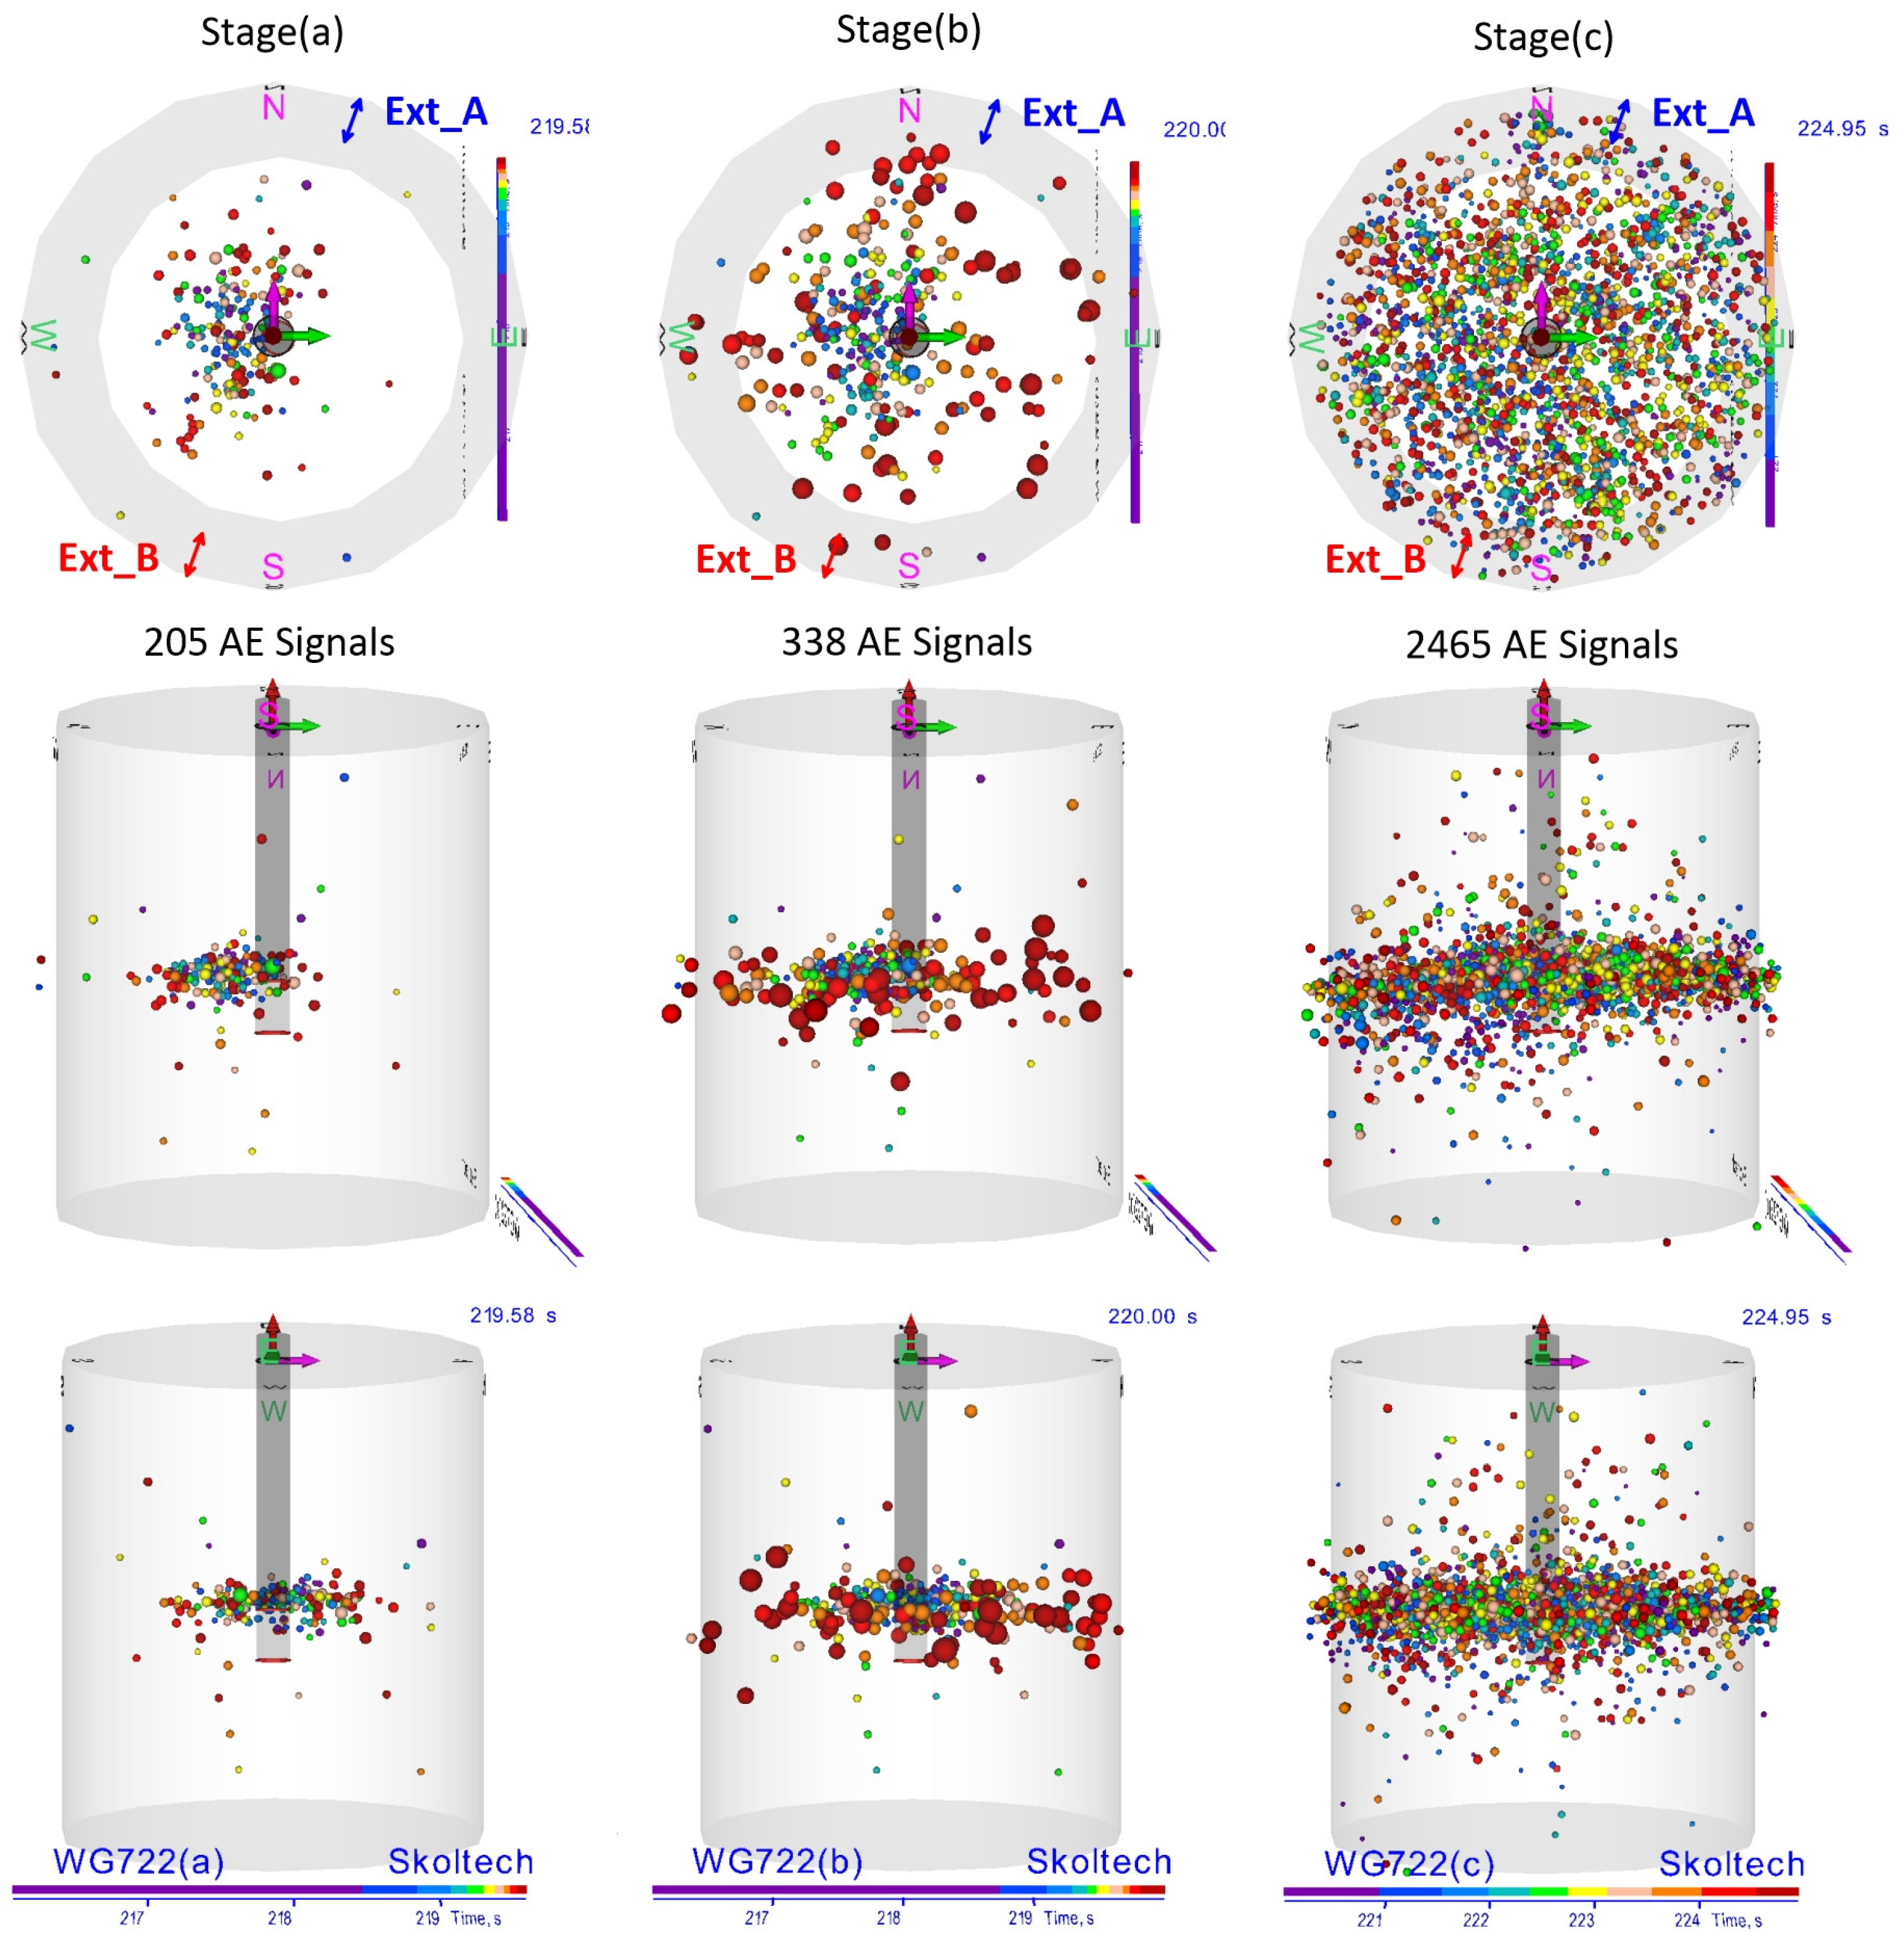
Figure 17 shows three orthogonal projections of the positions of the located AE signals. This experiment is characterized by a relatively symmetrical radial crack opening, slightly shifted from the sample center at the initial stage (a), towards the east (E) and south-east (S-E) directions. At stage (b), the symmetry of the cloud of located acoustic signals is observed. Stage (c) shows the process of fracture closure, AE events are recorded over the entire cross-sectional area.
The side view shown in Figure 17 confirms the horizontal fracturing development in the initial stage, propagating mostly in the western direction of the sample. However, already at the second stage of the process, AE events were located on both sides of the well in the upper part of the open-hole section. The location of AE events correlates well with the actual fracture.
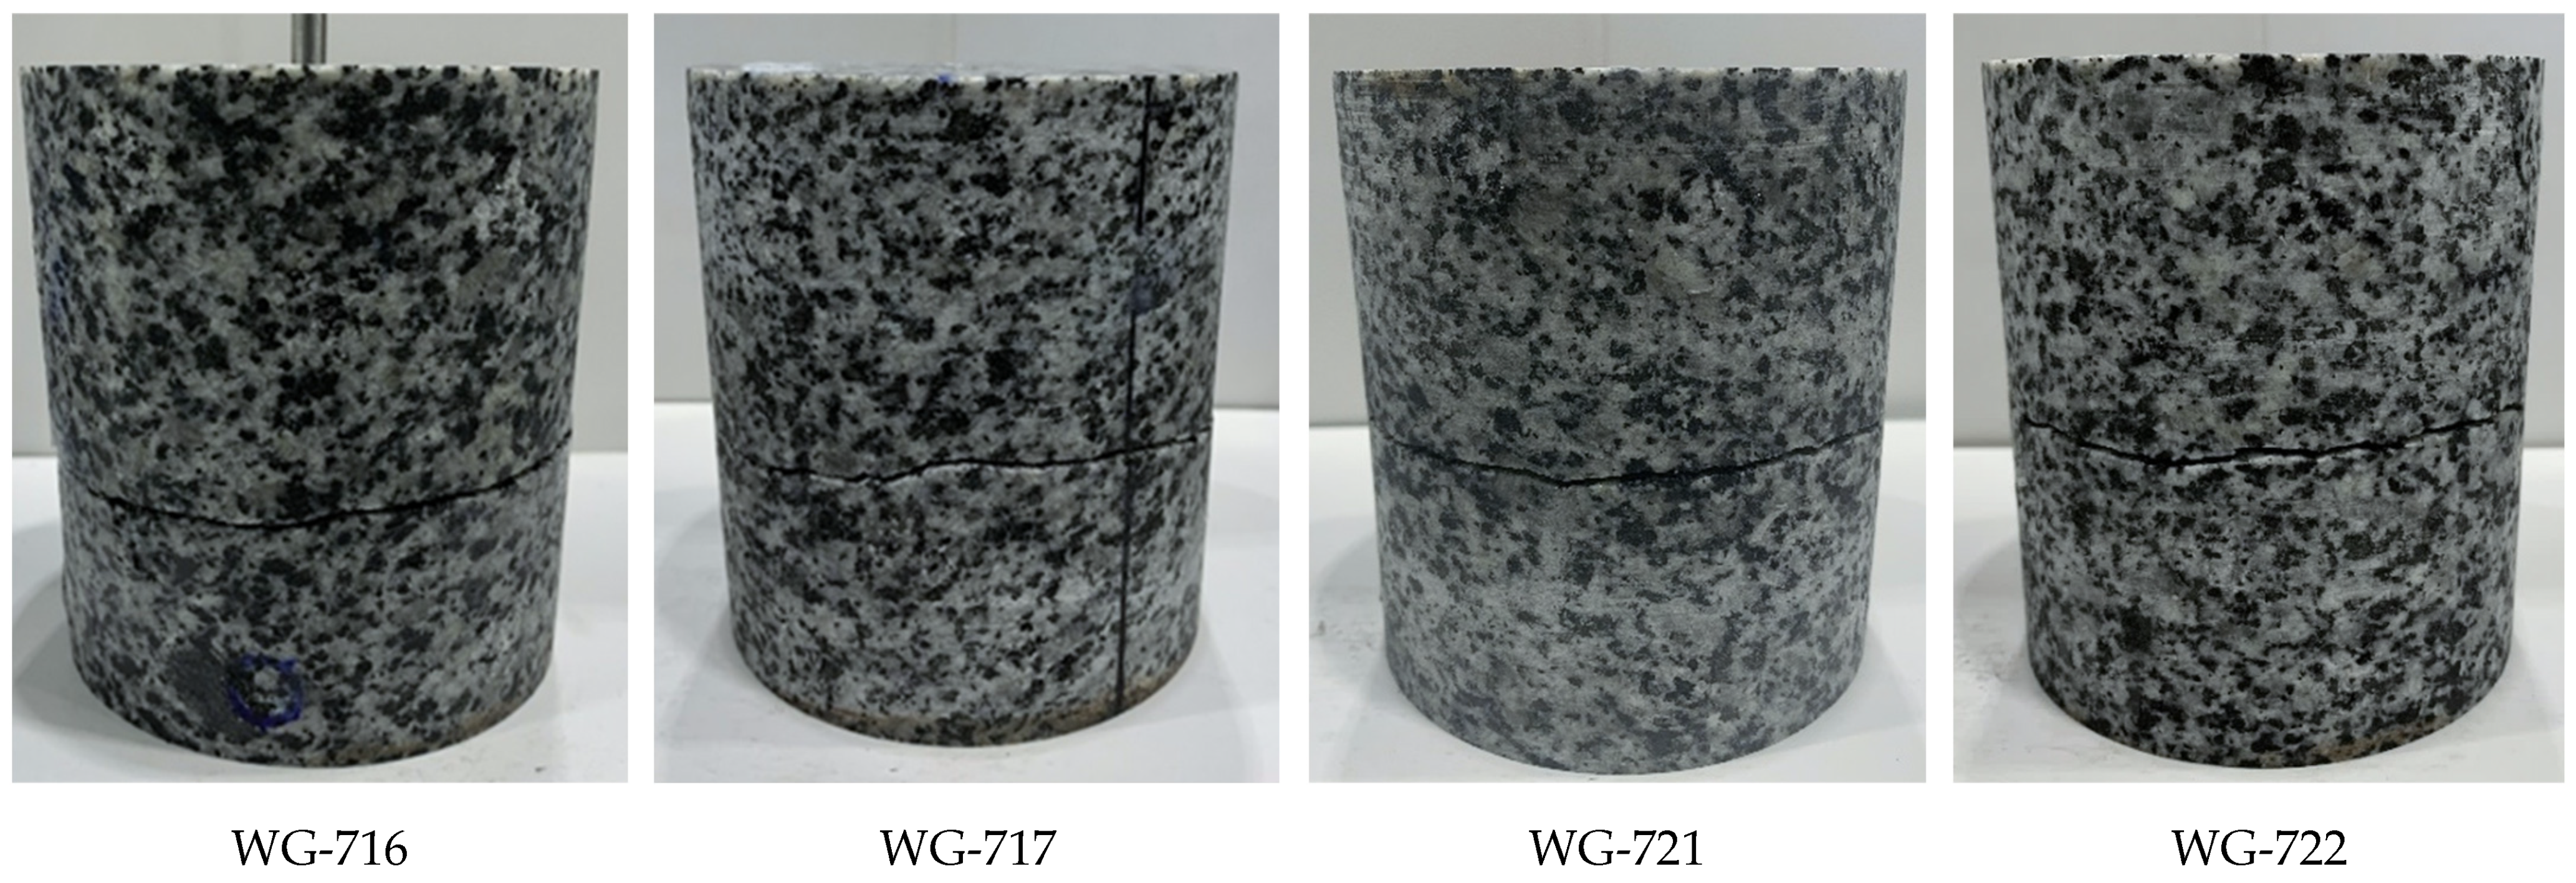
The photos of granite specimens with formed horizontal fractures are presented in Figure 18.

4. Discussion

We present the results of our laboratory study of the hydraulic fracturing dynamics in low permeability granite samples with the analysis of hydraulic fracture characteristics measured during the test and post-test analysis of the created fracture topography. It has been found that the hydraulic fracturing behavior during the injection of two water-based fluids with relatively similar viscosity (non-polymer fluid (VES) ~81 cP and PolyGel fluid ~95 cP) varies significantly.
In the case of viscoelastic surfactant fluid injection (WG-716 sample), the initiation of AE had been observed 0.15 s before the maximum pressure was reached. At the moment of breakdown, only 9 AE signals were registered. It should be noted that the HF tip reached the surface of the sample after the breakdown point. The AE signal cloud propagation velocity, which corresponds to the HF propagation velocity, was approximately 100 mm/s. The value of the axial deformation of the WG-716 sample and the volume of fluid injected into the fracture were insignificant (Table 5). This fracture behavior is typical for low-viscosity fluids such as water [42]. Presumably, the viscoelastic surfactant fluid had sufficient mobility and began to fill in the hydraulic fracture at the first moment of its initiation, which led to a pressure drop in the well.
In the case of injection of PolyGel fluid (WG-717 sample), the hydraulic fracture behaved quite differently. The AE initiation had been detected more than 1 s earlier than the maximum pressure in the well was reached, and significantly earlier than in the WG-716 test. The acoustics in this experiment was much more active, namely 97 signals were recorded at the time of maximum pressure. Importantly, the moment of HF reaching the surface practically coincided with the maximum pressure. The AE signal cloud propagation velocity was approximately 40 mm/s. The fracture opening (about 2.2 µm), which was determined using the axial displacement sensor, is also significantly larger in case of PolyGel than in case of VES injection. These observations are in good agreement with the conceptual model proposed in [42], indicating that PolyGel fluid composition behaves like a higher viscosity fluid in comparison with VES fluid, causing slower propagation of HF with a larger aperture. Due to the small opening of the fracture tip, PolyGel fluid did not completely fill in the formed crack (the volumes of different fluids recorded at the moments of maximum fluid pressures are presented in Table 5). Analysis of experimental results led to the assumption that in the case of PolyGel injection, at first the dry microcracks were formed (Figure 12, green dashed vertical line), and approximately 1 s later, fluid started penetrating them (Figure 12, blue dashed vertical line). In case of VES fluid injection, the appearance of new cracks and their filling with the fluid happened almost simultaneously (Figure 9).
The comparison of experimental results using the injection of diesel-fuel-based fluids with different viscosities (114 cP and 1728 cP) also shows a significant variation. The fracturing agent was chosen to be of the same components with different concentrations in order to gain notable differences in fluids viscosity.
For the high viscous oil-based hydraulic fracturing fluid (sample WG-721) we got a 3.5 s time interval from the moment of AE initiation to the point of maximum pressure (39.9 MPa). The fracture opening during this time was 4 µm (according to the values measured by extensometer B, Table 5). However, filling the crack with high viscous fluid took only 1 s (Figure 14). Therefore, there is an assumption that for 2.5 s of the experiment WG-721, a dry crack slowly grew (the propagation velocity of localized events was 15 mm/s) and reached the surface before the breakdown moment. Based on these facts, it can be assumed that there was a gap between the position of a fracture tip and the front of OilGel 40/40, which was unable to fill in all formed microcracks due to high viscosity and poor mobility of the fluid.
In the second experiment (sample WG-722) with the low viscosity oil-based hydraulic fracturing fluid, the AE initiation was registered 1.5 s before the breakdown (39.23 MPa). The opening of the formed fracture at the time of the pressure peak was only 0.9 µm (according to the values measured by extensometer B, Table 5). The filling of the fracture with the fluid took 0.6 s, moreover, the fluid volume injected into the fracture was insignificant. Despite the fact that the time from the crack initiation to the failure was much less than in the previous experiment with the higher viscosity fluid, the lower-viscosity fluid spread and filled the fracture, thereby resulting in its growth at the rate of 20 mm/s (Table 5).
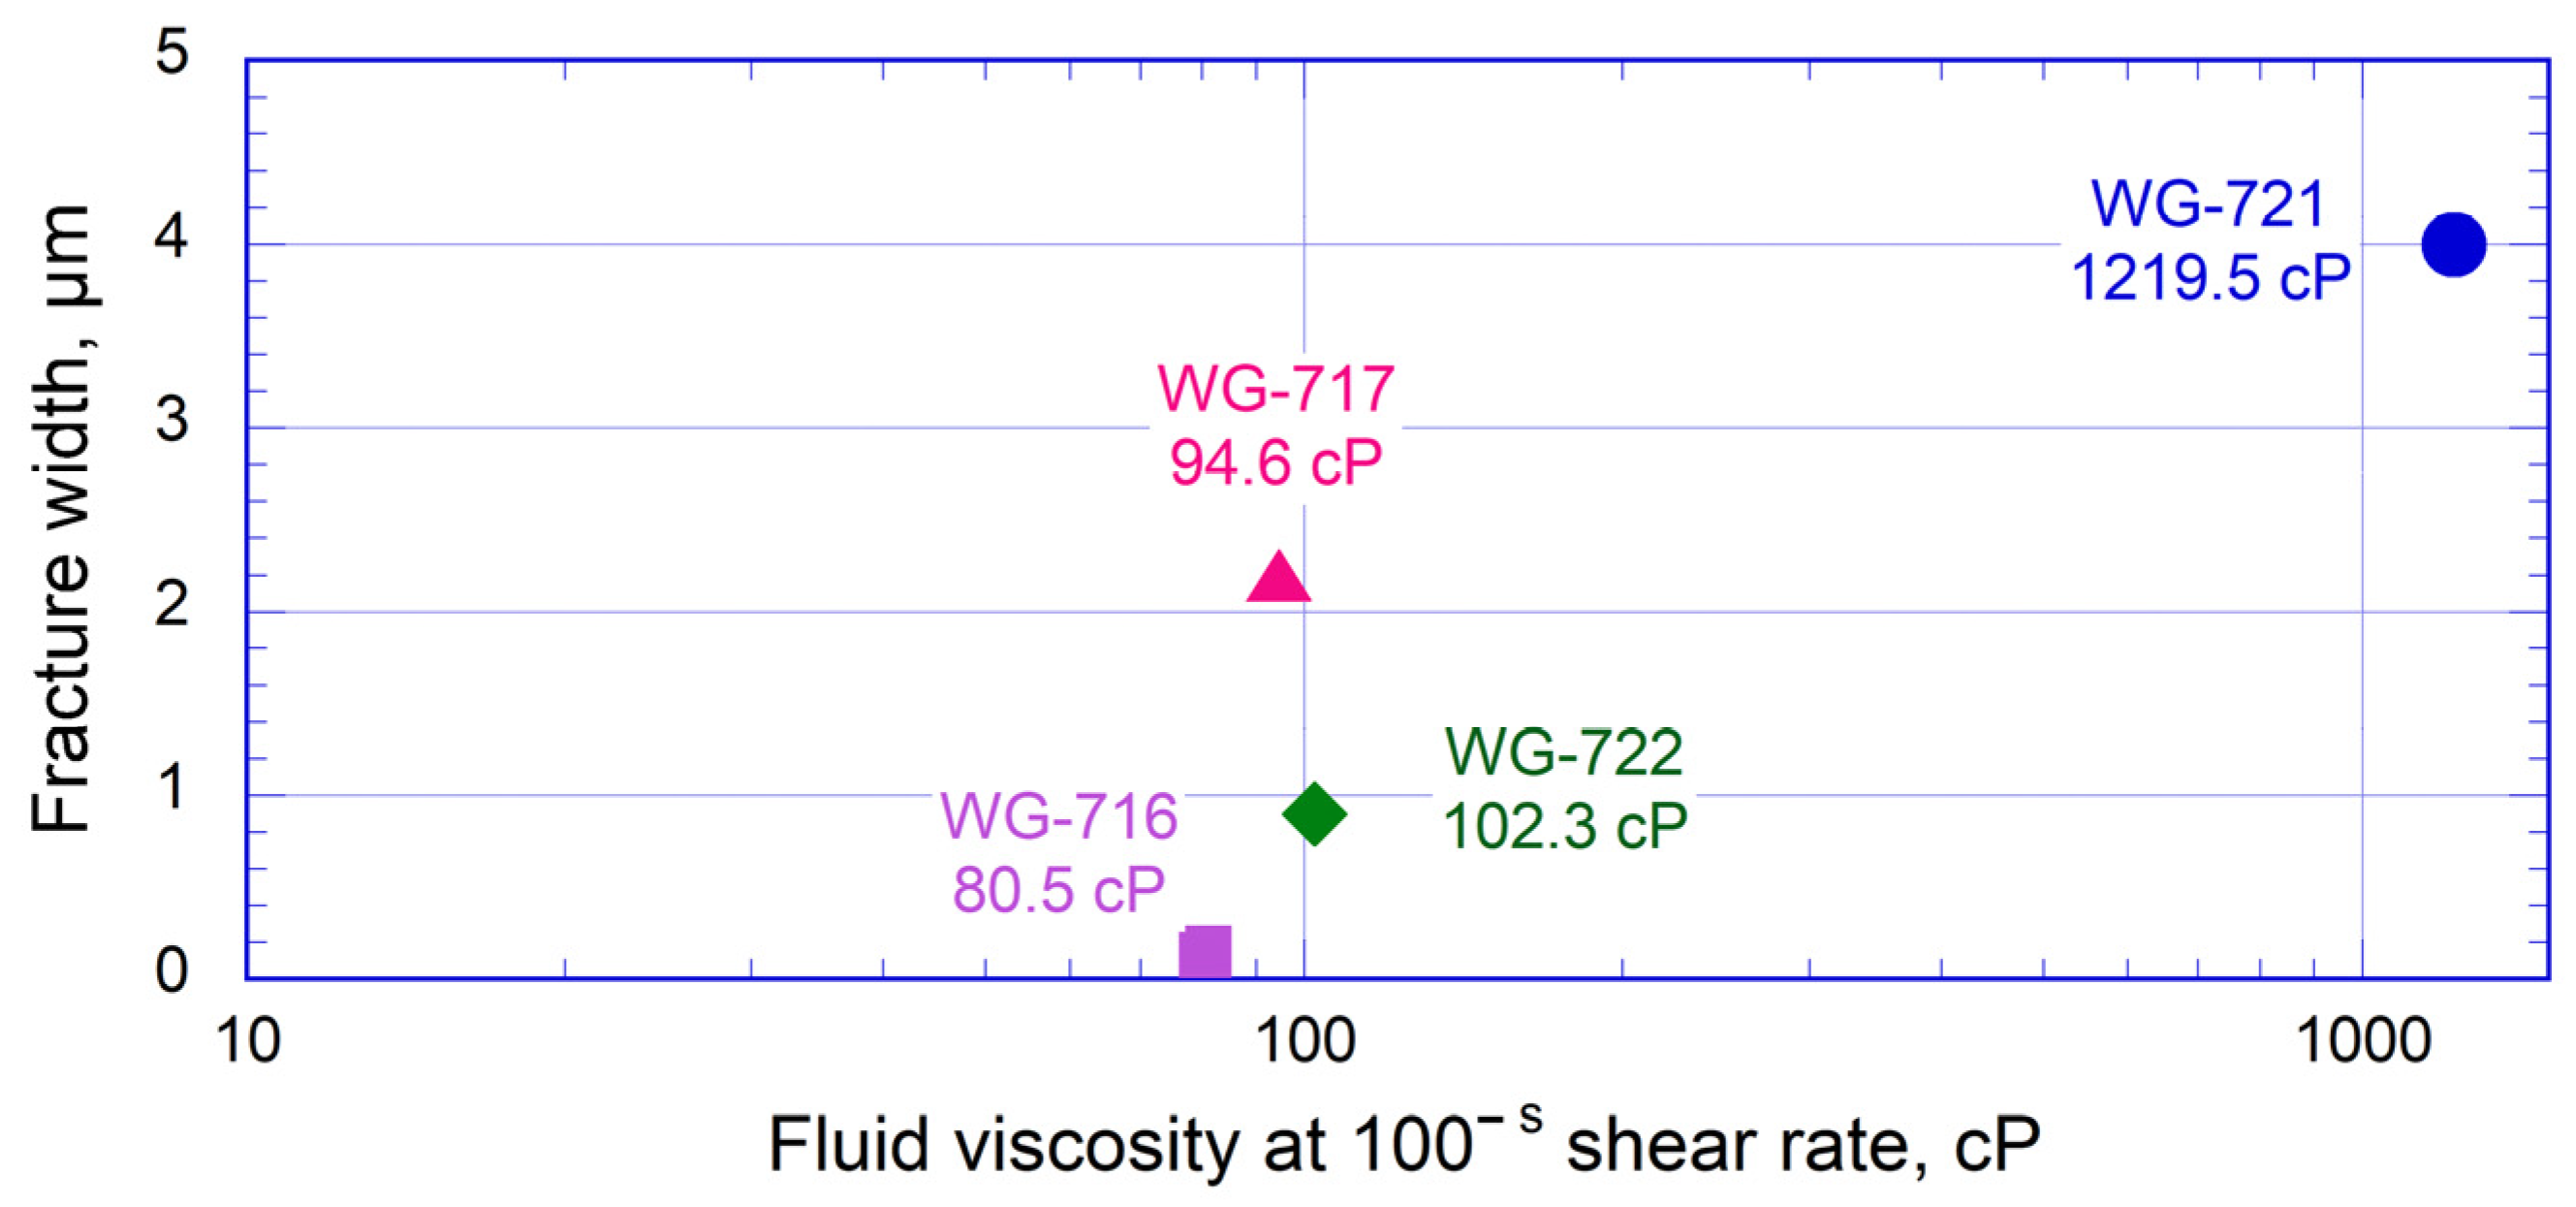
In our study, we demonstrated that the volume of the fluid entering hydraulic fracture depends on the measured fracture width (aperture) and this relationship could be associated with the fluid viscosity (Figure 19). These results are in a good agreement with Ref. [42], indicating a larger HF aperture with higher fluid viscosity. PolyGel (WG-717) demonstrates the behavior of a high viscosity fluid.
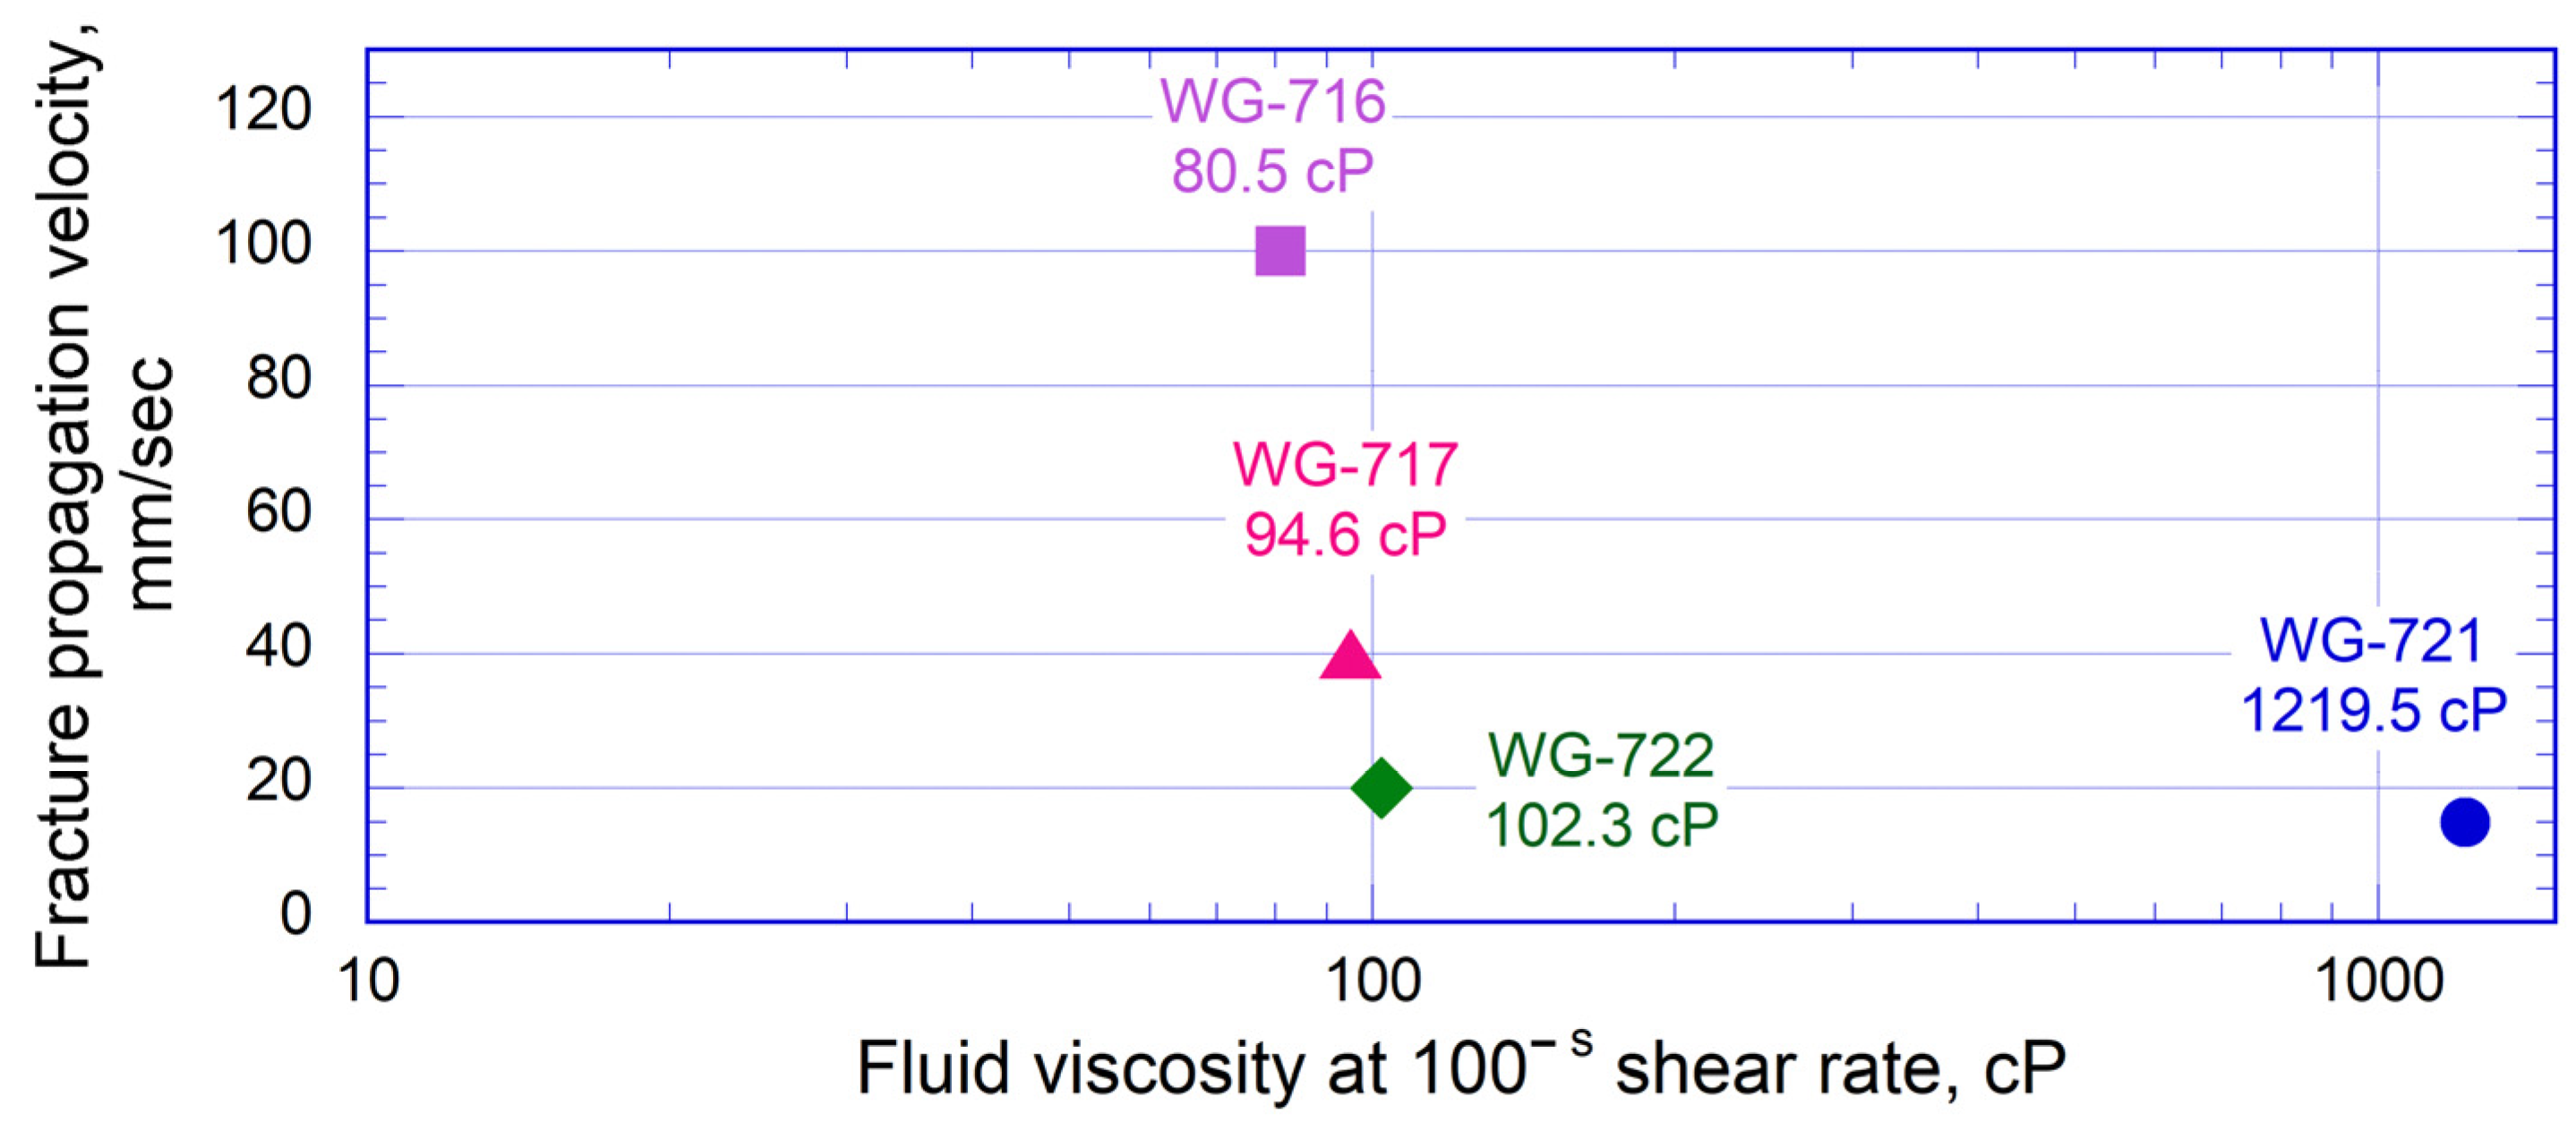
In addition, the dynamics of HF propagation were investigated. We have found that the HF propagation velocity is highly dependent on the injected fluid viscosity. Figure 20 indicates that injection of lower viscosity fluid induces HF propagation with a higher speed. It can be explained by the high mobility of the low-viscous fracturing fluids, and their ability to easily fill in the microcracks in the fracture process zone. The relationship obtained in the laboratory experiments may be considered for the HF modeling in the field conditions, potentially increasing the reliability of the modelling.
Direct measurements of the HF opening and tortuosity of HF surfaces have significant difficulties in the field. However, they are the key parameters for choosing the optimal proppant size, providing successful proppant delivery into the HF. We investigated the relationship between the formed fracture surface parameters and the viscosity of the fracturing fluid.
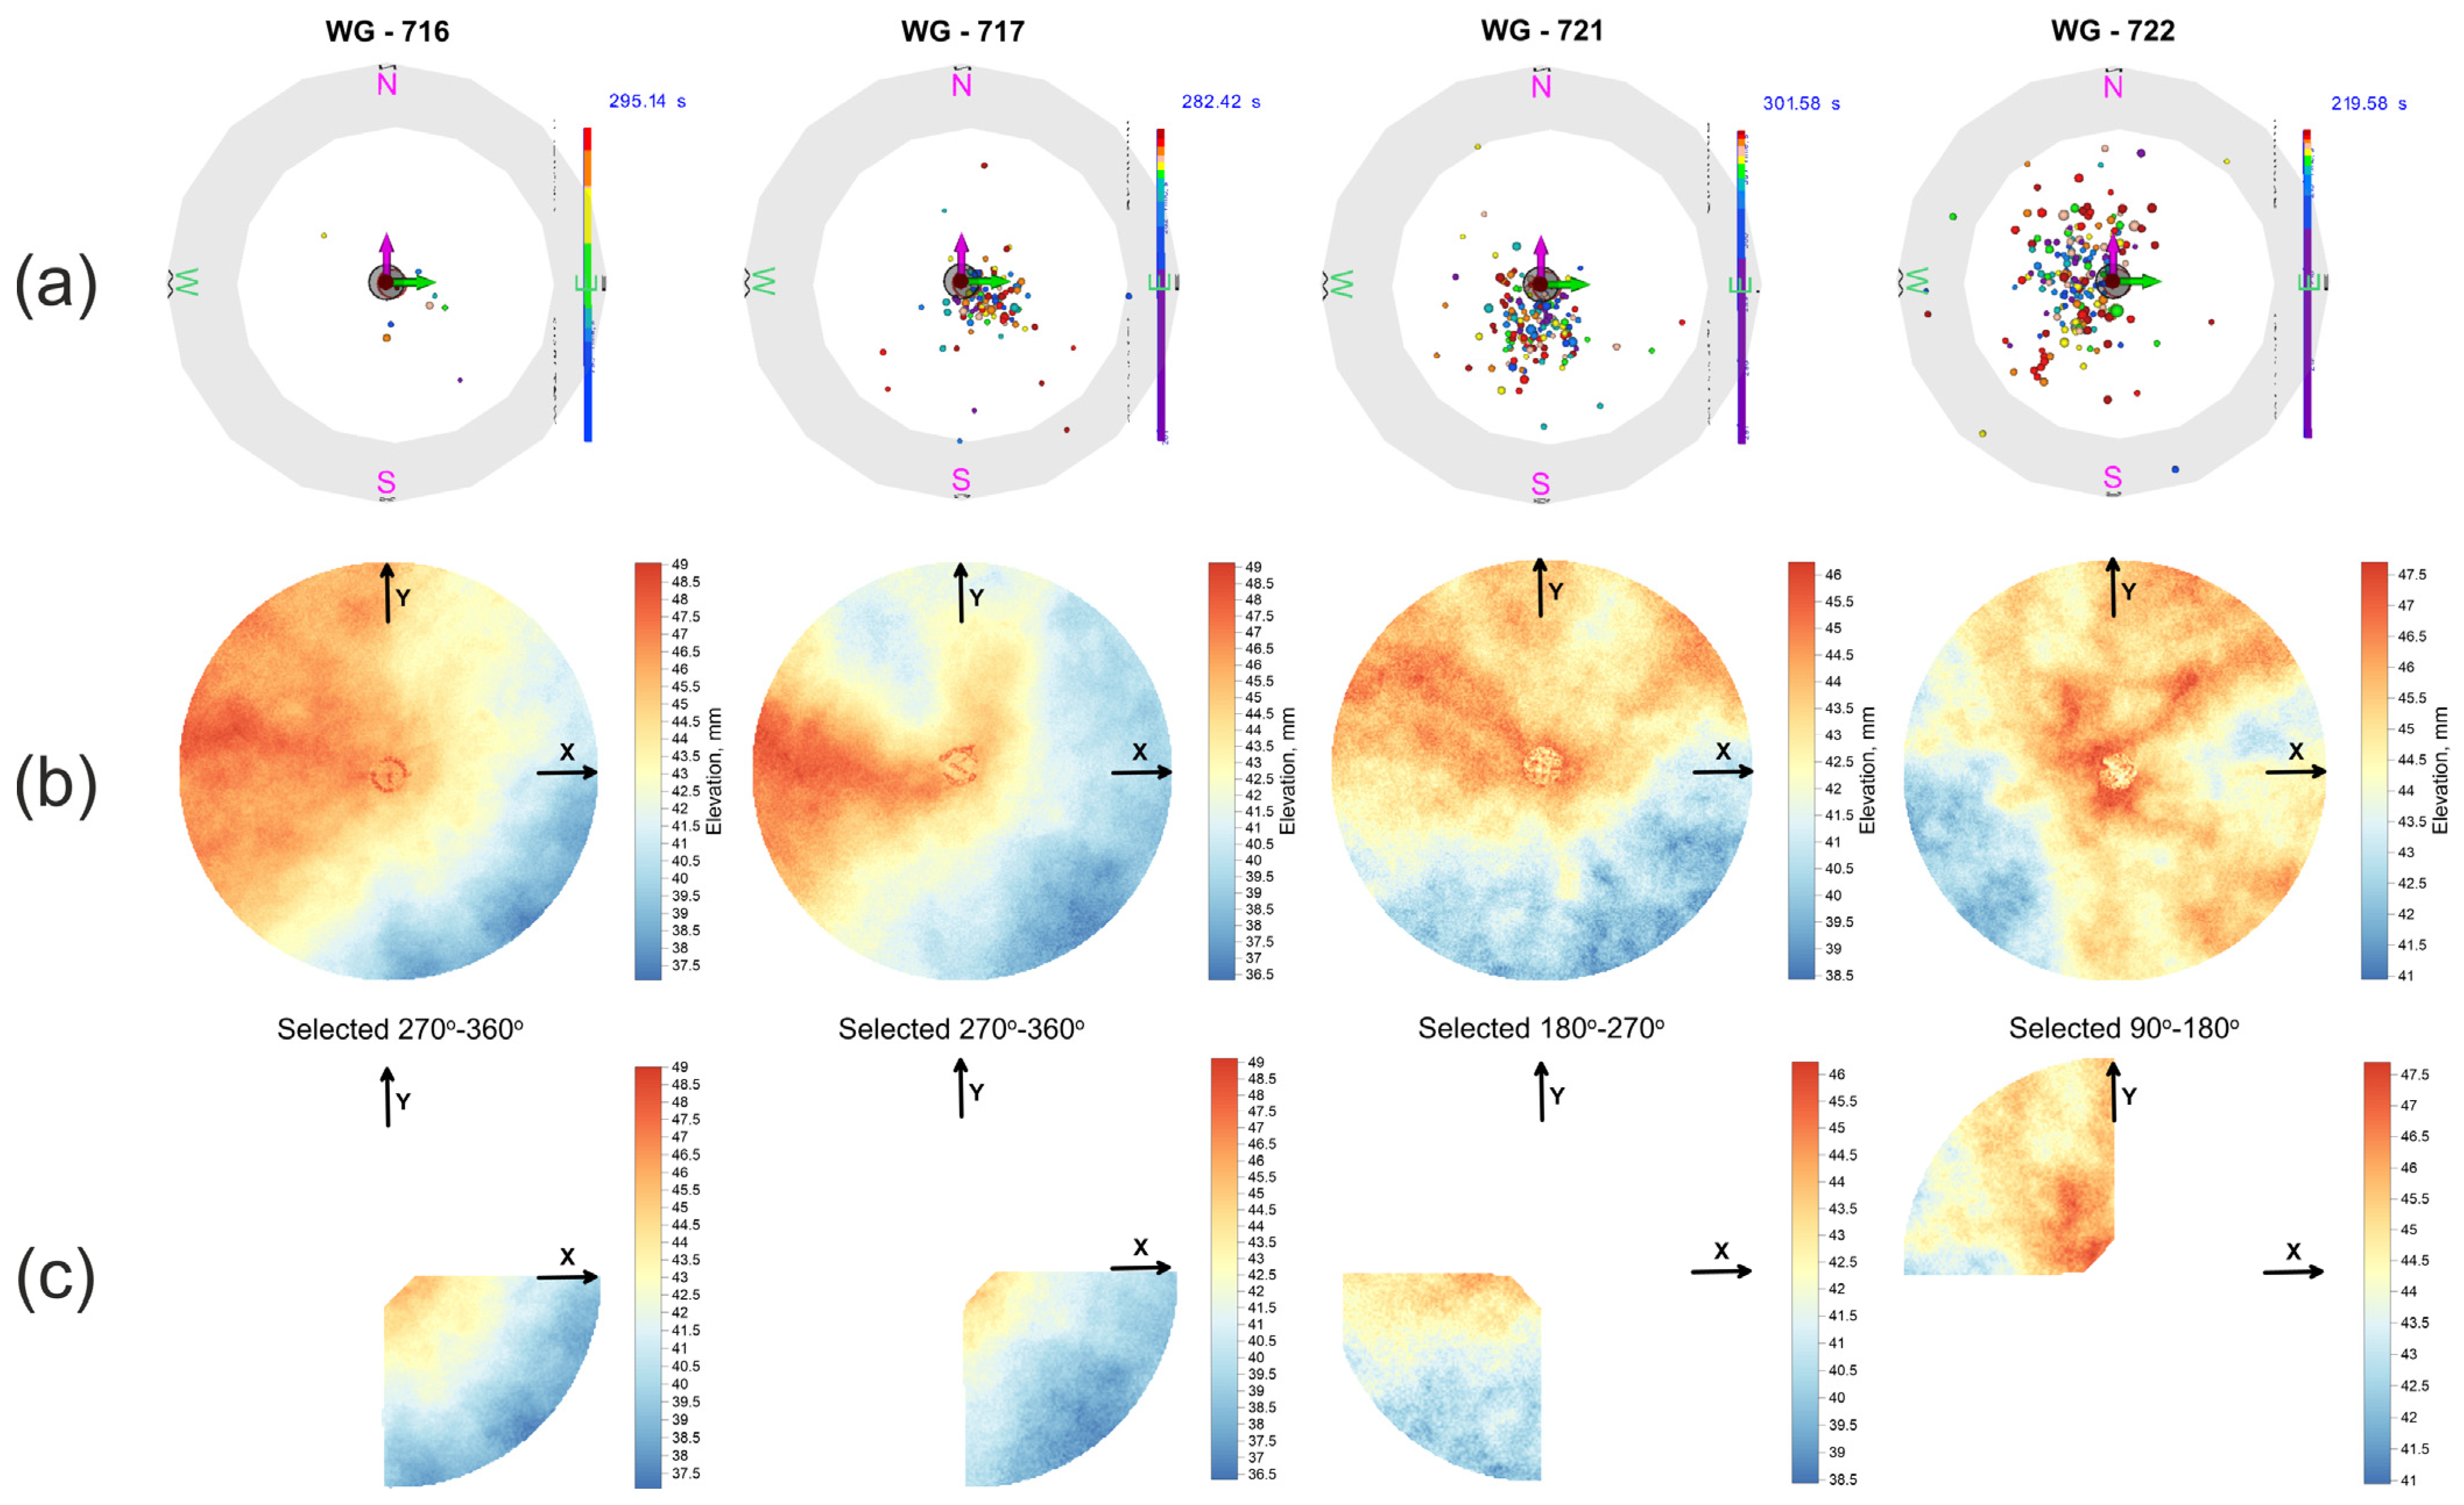
In our study, X-ray tomographic scanning of the fractured samples was performed, allowing us to determine the 3D shape of the fracture surface geometry with the accuracy of 60 µm. The upper row of plots in Figure 21 shows the top-view of AE signals localized during the initial stage of HF propagation, whereas the middle row shows 2D maps of fracture surface topography, plotted on the basis of X-ray analysis of fractured samples. We suppose that after the moment when the HF approached the cylindrical surface of the sample, the fluid should be spreading along the cylindrical surface of the sample below the impermeable jacket, and, most likely, it can change the stress distribution within the sample, influencing the shape of the created fracture. Therefore, we decided to analyze the shape of HF created only before the exit of the HF to the cylindrical surface of the rock, or during the initial stage of HF propagation towards the surface only. The pattern of the HF surface created during the initial stage of HF propagation was estimated on the basis of AE localization presented in Figure 21, the upper row, and the corresponding sector of the HF surface was selected for the roughness analysis, as the lower row of Figure 21 shows.
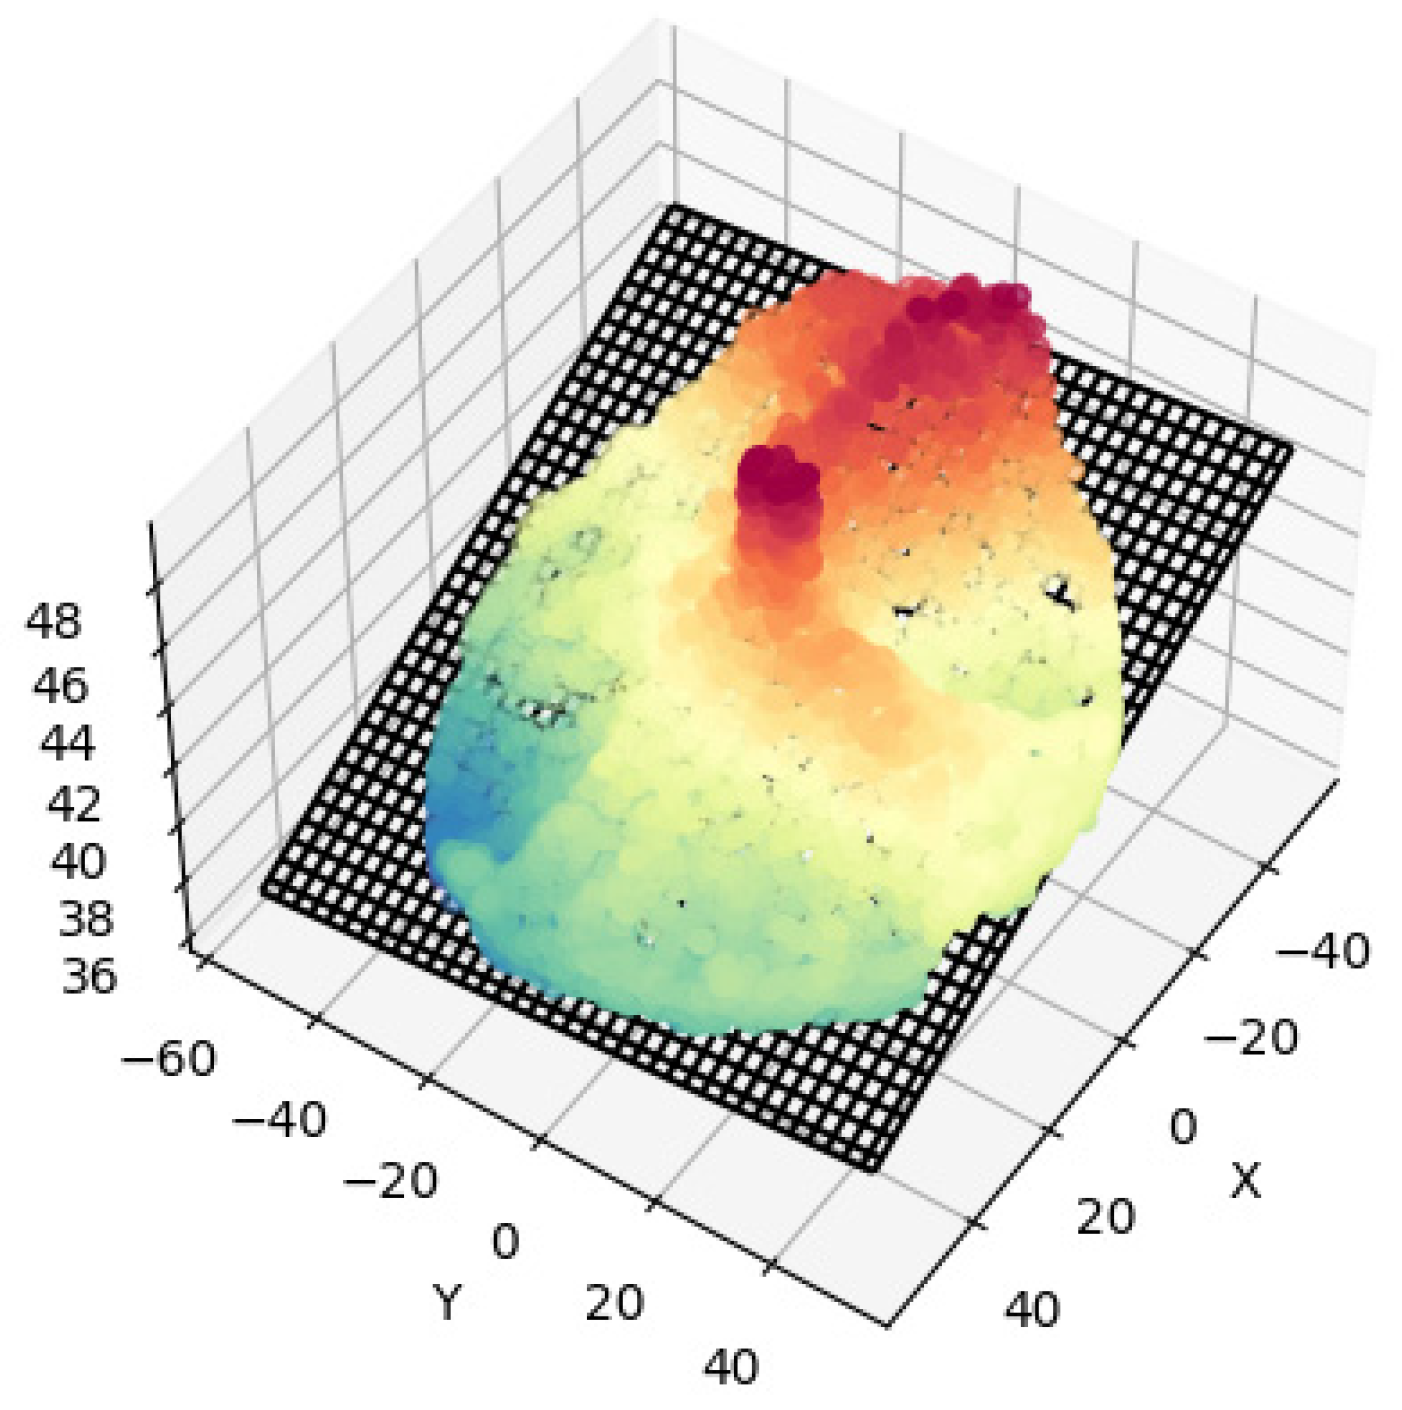
We define the rough fracture surface as an assembly of elements with various asperity heights, slope angles, aspects, and statistical values [43]. We take the sector file (xyz), approximate it with the best-fit plane, and calculate the distance of each element to this best-fit plane (Figure 22). The detailed technique for obtaining a best-fit plane of the 3D point fracture surface is represented in [44].
For this part of the study, we applied statistical expressions directly to the scanned 3D surface data (Equations (1)–(3)). The peak asperity height R p , the average roughness R m , and the root-mean-square roughness R r m s , where z i is the height of the ith point and z a —the mean height of the elevation plane, which is discretized by n points, were obtained (Table 6). The statistical parameters provide a direct comparison between samples, aiding to distinguish the different surface topographies quantitatively [45].
R p = m a x | z i z a | ,
R m = 1 n i = 1 n | z i z a | ,
R r m s = 1 n i = 1 n ( z i z a ) 2 .
The tortuosity is defined as the total fracture length along a pathway divided by the direct length of the two ends in the reference area. In order to measure the total fracture length, the subset of points lying along the steepest line was extracted, and then the sum of 3D distances between adjacent points was obtained. To get the tortuosity value, this sum was divided by the sum of 2D distances between adjacent points of the same subset (Table 6).
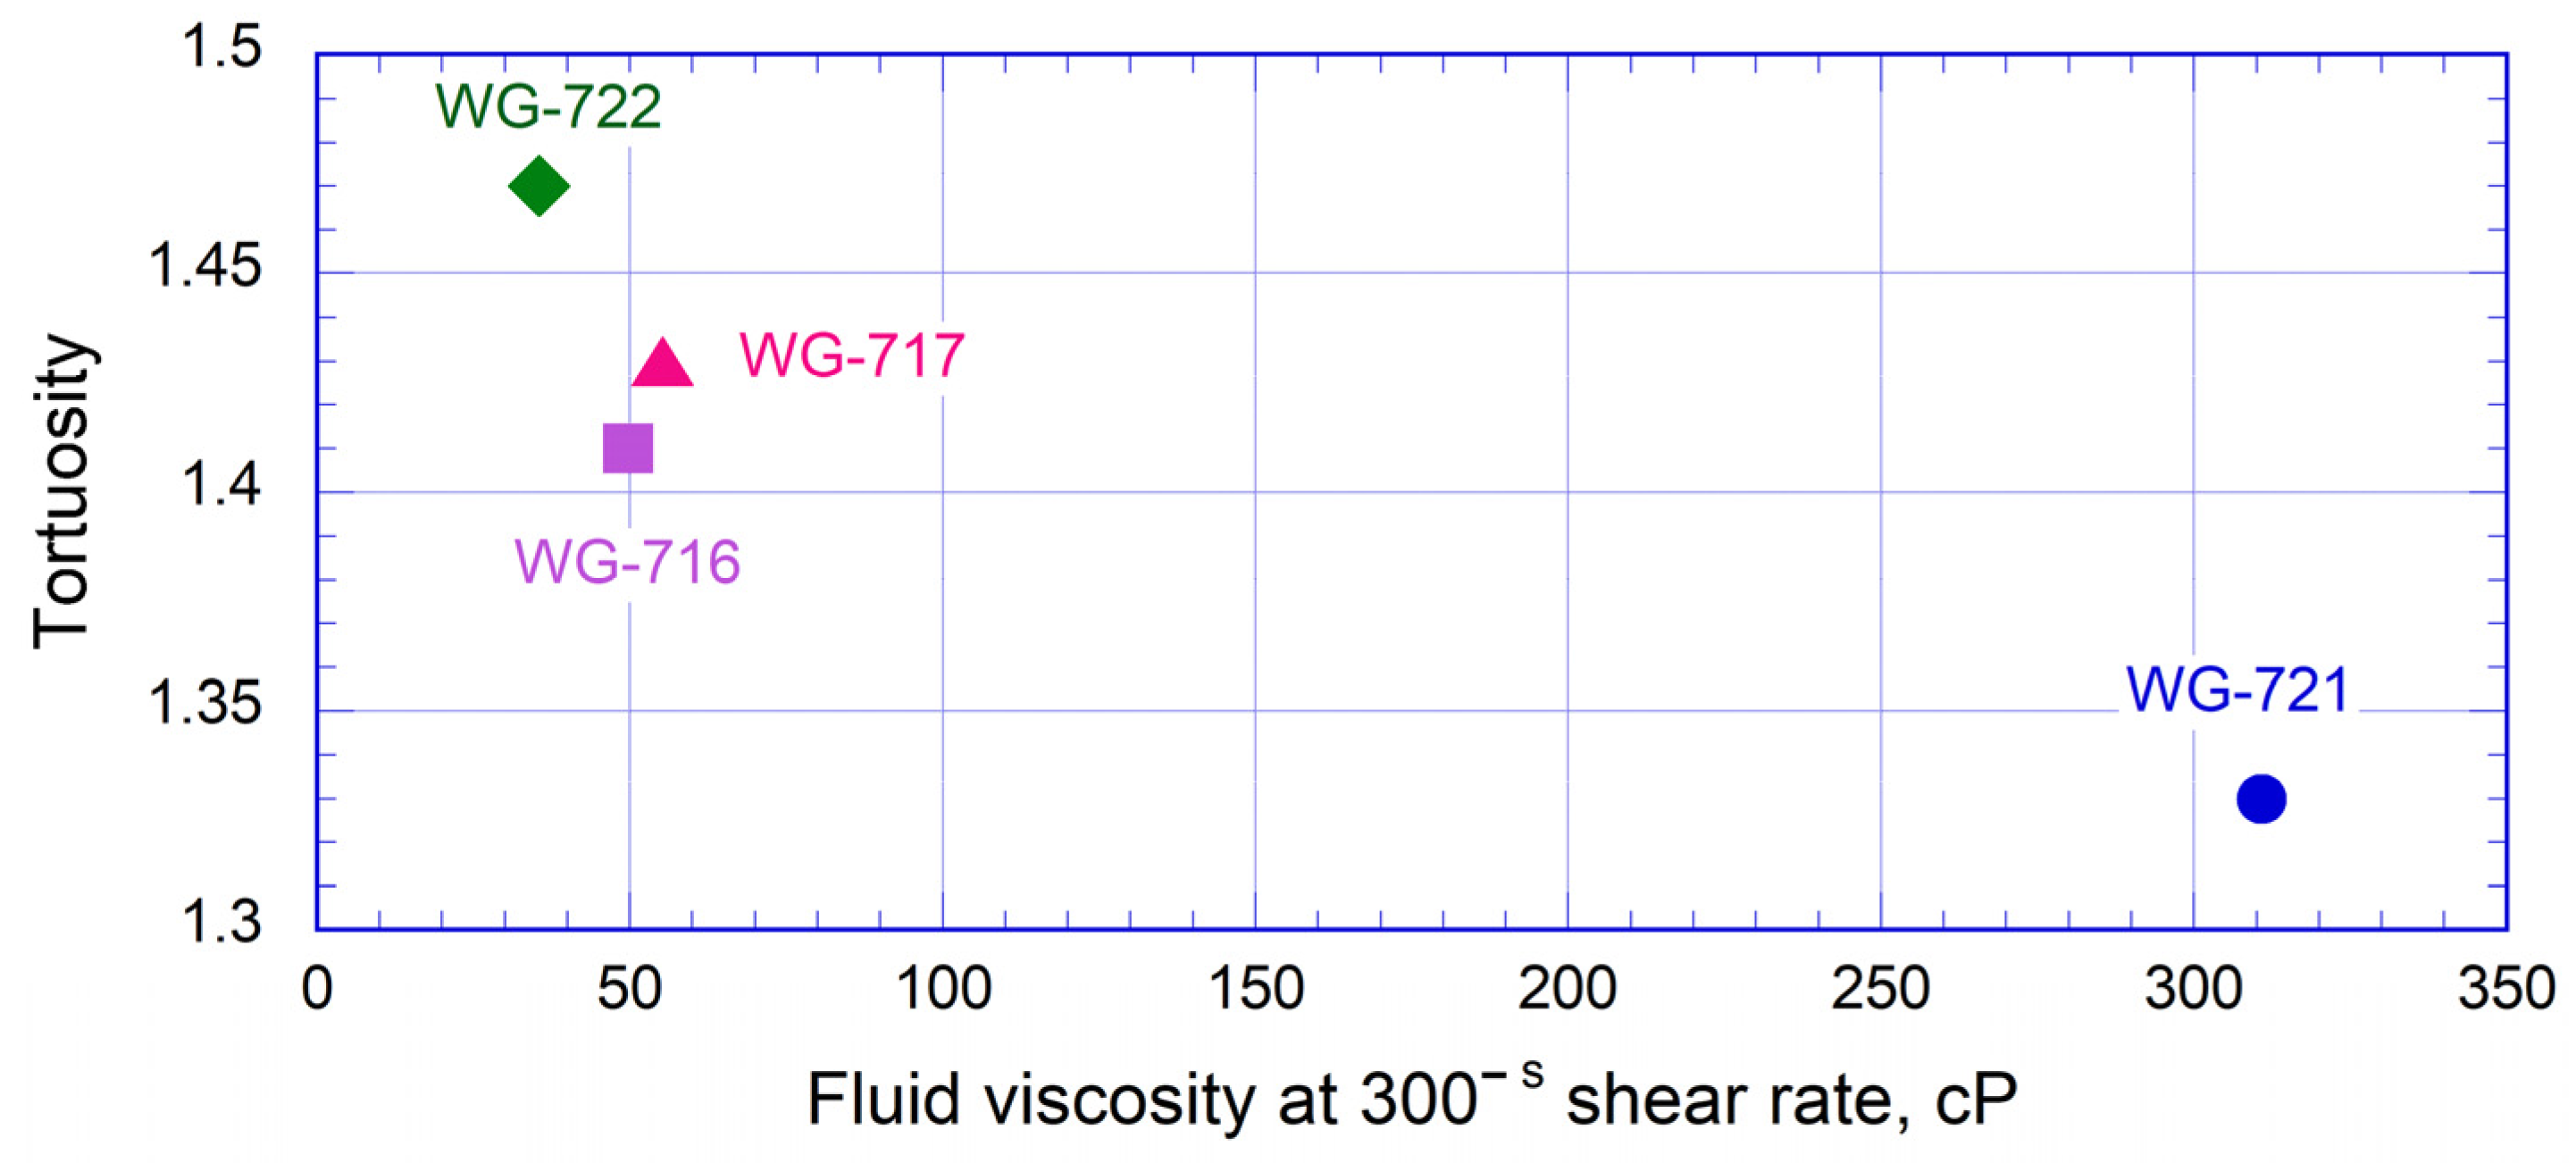
We have found that the shape of the created fracture is dependent on the fracturing fluid viscosity. We observed that the fracture induced with the most viscous fluid had the least tortuous surface (Figure 23). Consequently, the tortuosity decreased with the increase in fracturing fluid viscosity, which is in compliance with Refs. [46,47]. The fracture surface for the WG-722 sample that fractured with the least viscosity fluid has the highest tortuosity magnitude (1.47) and, as a consequence, the most complicated shape of the surface. On the other hand, the fracture surface for the WG-721 specimen has the least tortuosity value (1.33). It can be elucidated by the injection of a high viscosity fluid, creating a smoother surface in comparison with the lower viscosity fluid injection.
The distributions of Probability Density Function versus the height of asperities above the fitted plane are presented in Figure 24. It can be noticed that the Probability Density function can be characterized by the normal Gaussian distribution (best fit Gaussian). Thus, the calculated Rrms roughness can be justified [44] (Figure 24).

5. Conclusions

In this research, we studied hydraulic fractures created in granite samples by the injection of several unconventional fracturing fluids. The main objectives of the study were the investigation of fracture propagation dynamics and direct measurement of several parameters characterizing created fractures, aiming at the application of relationships discovered in laboratory tests for the further modeling. We obtained the following results:
(1)
For our experiments, we used two water-based systems (non-polymer composition (VES), PAA (PolyGel)) and two non-aqueous (OilGel 7/7, OilGel 40/40) fluids for the HF initiation. In contrast to the traditionally used cross-linked liquids based on guar solution, they have a structural difference. It is generally accepted (in Russian service companies) that the fracturing fluid must have a viscosity of at least 350 mPa·s at 100 s−1 for proper proppant retention and transport. The described fluids have a branched spatial structure, which allows to hold and transport the proppant despite their low viscosity (100–200 mPa·s at 100 s−1). Moreover, hydraulic fracturing induced by injection of these systems had not been previously tested in laboratory conditions. The fluids were provided by the department of the international scientific center “Rational development of liquid hydrocarbon planet’s reserves” at the National University of Oil and Gas “Gubkin University”;
(2)
We measured hydraulic fracture opening width and the volume of fluid injected into the fracture at the moment of wellbore pressure breakdown. We have found a good correlation between these parameters and viscosity values. Initially, the results of two tests with water-based fluids were compared. The behavior of the fracture created by injection of the non-polymer composition (VES) demonstrated quick propagation, minor opening, insignificant volume of fluid filling the fracture, and low breakdown pressure. This behavior of hydraulic fracture can characterize the injection of low-viscosity fluids. In case of PolyGel fluid injection, the hydraulic fracture propagated more slowly, the extensometers registered a bigger opening width, and hydraulic fracture occurred at the highest maximum pressure among the tests.
In addition, we have found that the hydraulic fracture behavior during the injection of diesel-fuel-based fluids with different viscosities varies significantly. The test with OilGel 7/7 (102 cP) demonstrated results corresponding to a low viscosity fluid: a minor fracture aperture, an insignificant volume of fluid filling the fracture, lower breakdown pressure, and fast HF propagation velocity. In contrast, the HF induced by OilGel 40/40 (1200 cP) demonstrated the widest fracture aperture, a significant volume of fluid filling the fracture, and the slowest propagation velocity. The peak pressure was higher. Finally, our findings that the higher breakdown pressure value corresponds to the higher viscosity of the injected agent are in a good agreement with the previous publication [42].
(3)
It has also been revealed that the topography of the created fracture surface is related to the viscosity of the fracturing fluid too. We have observed that the fracture induced by the most viscous fluid had the least tortuous surface. Based on the data of our study, the tortuosity decreased with the increase in fracturing fluid viscosity, which is in good agreement with [46,47];
(4)
The observed relationships should be taken into account during modeling of the hydraulic fracture propagation. This may lead to the creation of more realistic models, and as a result, to an increase in the efficiency of the field hydraulic fracturing.

Author Contributions

Conceptualization, methodology, A.S. and S.S.; software, S.S., E.F. and A.S.; validation, S.S., A.S., and M.B.; formal analysis, investigation, A.S., S.S., M.B. and S.B.; data curation, V.S.; writing—original draft preparation, A.S.; writing—review and editing, S.S., M.B, S.B. and E.F.; visualization, A.S., S.S. and E.F.; supervision, project administration, S.S. and L.M. All authors have read and agreed to the published version of the manuscript.

Funding

This work was supported by the Ministry of Science and Higher Education of the Russian Federation under agreement No. 075-10-2022-011 within the framework of the development program for a world-class Research Center.

Institutional Review Board Statement

Not applicable.

Informed Consent Statement

Not applicable.

Data Availability Statement

Not applicable.

Acknowledgments

The authors would like to thank Alexander Burukhin and Andrey Morkovkin for X-ray CT preparation, and Vladimir Efstadiu for sample preparation.

Conflicts of Interest

The authors declare no conflict of interest.

References

  1. Lin, C.; Mao, J.; He, J.; Li, X.; Zhao, J. Propagation characteristics and aperture evolution of hydraulic fractures in heterogeneous granite cores. Arab. J. Geosci. 2019, 12, 684. [Google Scholar] [CrossRef]
  2. Suppachoknirun, T.; Tutuncu, A.N. Hydraulic Fracturing and Production Optimization in Eagle Ford Shale Using Coupled Geomechanics and Fluid Flow Model. Rock Mech. Rock Eng. 2017, 50, 3361–3378. [Google Scholar] [CrossRef]
  3. Mojid, M.R.; Negash, B.M.; Abdulelah, H.; Jufar, S.R.; Adewumi, B.K. A state–of–art review on waterless gas shale fracturing technologies. J. Pet. Sci. Eng. 2021, 196, 108048. [Google Scholar] [CrossRef]
  4. Turuntaev, S.B.; Zenchenko, E.V.; Zenchenko, P.E.; Trimonova, M.A. Hydraulic Crack Growth Dynamics from Ultrasound Transmission Monitoring in Laboratory Experiments. Izv. Phys. Solid Earth 2021, 57, 671–685. [Google Scholar] [CrossRef]
  5. Bukharov, D.F.; Alekseev, Y.V.; Prodan, A.S.; Nenko, A.V. Potential and Possible Technological Solutions for Field Development of Unconventional Reservoirs: Bazhenov Formation. In Proceedings of the SPE Russian Petroleum Technology Conference, Virtual, 26 October 2020. [Google Scholar]
  6. Barati, R.; Liang, J.-T. A review of fracturing fluid systems used for hydraulic fracturing of oil and gas wells. J. Appl. Polym. Sci. 2014, 131, 40735. [Google Scholar] [CrossRef]
  7. Silin, M.A.; Magadova, L.; Malkin, D.; Krisanova, P.K.; Krashevnikova, V. Development of a viscoelastic composition based on surfactants for hydraulic fracturing. Proc. Gubkin Russ. State Univ. Oil Gas 2020, 1, 142–154. [Google Scholar] [CrossRef]
  8. Magadova, L.A.; Silin, M.A.; Gluschenko, V.N. Technological Aspects and Materials for Hydraulic Fracturing; National University of Oil and Gas «Gubkin University»: Moscow, Russia, 2012; ISBN 9785919610755. [Google Scholar]
  9. Zhang, R.; Zheng, X.; Li, S.; Jin, K.; Zheng, H.; Wang, L. Environmentally friendly hydraulic fracturing and water-free fracturing technologies. Int. J. Oil, Gas Coal Technol. 2018, 17, 375–390. [Google Scholar] [CrossRef]
  10. Alharith, A.; Batarseh, S.; San Roman Alerigi, D.; Asiri, W. Overview of Recent Waterless Stimulation Technologies. In Proceedings of the Abu Dhabi International Petroleum Exhibition & Conference, Abu Dhabi, United Arab Emirates, 9 November 2020. [Google Scholar]
  11. Duan, Y.; Xu, Y.; Weng, D.; Lu, Y.; Qiu, X.; Wang, L. Research on Waterless Fracturing Technology in Tight Gas Formation in China. In Proceedings of the International Field Exploration and Development Conference 2019, SSGG; Lin, J., Ed.; Springer: Singapore, 2020; pp. 265–275. [Google Scholar]
  12. Yang, Y.; Liu, S.; Chang, X. Fracture stiffness evaluation with waterless cryogenic treatment and its implication in fluid flowability of treated coals. Int. J. Rock Mech. Min. Sci. 2021, 142, 104727. [Google Scholar] [CrossRef]
  13. Zhang, Z.; Mao, J.; Yang, X.; Zhao, J.; Smith, G.S. Advances in waterless fracturing technologies for unconventional reservoirs. Energy Sources, Part A Recover. Util. Environ. Eff. 2019, 41, 237–251. [Google Scholar] [CrossRef]
  14. Fu, C.; Liu, N. Journal of Natural Gas Science and Engineering Waterless fluids in hydraulic fracturing—A review. J. Nat. Gas Sci. Eng. 2019, 67, 214–224. [Google Scholar] [CrossRef]
  15. Almubarak, M.; Almubarak, T.; Ng, J.H.; Hernandez, J.; Nasr-El-Din, H. Recent Advances in Waterless Fracturing Fluids: A Review. In Proceedings of the Abu Dhabi International Petroleum Exhibition & Conference, Abu Dhabi, United Arab Emirates, 9 November 2020. [Google Scholar]
  16. Gaurina-Međimurec, N.; Brkić, V.; Topolovec, M.; Mijić, P. Fracturing Fluids and Their Application in the Republic of Croatia. Appl. Sci. 2021, 11, 2807. [Google Scholar] [CrossRef]
  17. Deb, P.; Salimzadeh, S.; Vogler, D.; Düber, S.; Clauser, C.; Settgast, R.R. Verification of Coupled Hydraulic Fracturing Simulators Using Laboratory-Scale Experiments. Rock Mech. Rock Eng. 2021, 54, 2881–2902. [Google Scholar] [CrossRef]
  18. Cha, M.; Yin, X.; Kneafsey, T.; Johanson, B.; Alqahtani, N.; Miskimins, J.; Patterson, T.; Wu, Y.S. Cryogenic fracturing for reservoir stimulation–Laboratory studies. J. Pet. Sci. Eng. 2014, 124, 436–450. [Google Scholar] [CrossRef] [Green Version]
  19. Yang, R.; Hong, C.; Huang, Z.; Wen, H.; Li, X.; Huang, P.; Liu, W.; Chen, J. Liquid Nitrogen Fracturing in Boreholes under True Triaxial Stresses: Laboratory Investigation on Fractures Initiation and Morphology. SPE J. 2021, 26, 135–154. [Google Scholar] [CrossRef]
  20. Tao, J.; Meng, S.; Jin, X.; Xu, J.; Yang, Q.; Wang, X.; Liu, H.; Peng, B. Stimulation and Sequestration Mechanism of CO2 Waterless Fracturing for Continental Tight Oil Reservoirs. ACS Omega 2021, 6, 20758–20767. [Google Scholar] [CrossRef]
  21. Wang, L.; Yao, B.; Cha, M.; Alqahtani, N.B.; Patterson, T.W.; Kneafsey, T.J.; Miskimins, J.L.; Yin, X.; Wu, Y.-S. Waterless fracturing technologies for unconventional reservoirs-opportunities for liquid nitrogen. J. Nat. Gas Sci. Eng. 2016, 35, 160–174. [Google Scholar] [CrossRef] [Green Version]
  22. Kalam, S.; Afagwu, C.; Al Jaberi, J.; Siddig, O.M.; Tariq, Z.; Mahmoud, M.; Abdulraheem, A. A review on non-aqueous fracturing techniques in unconventional reservoirs. J. Nat. Gas Sci. Eng. 2021, 95, 104223. [Google Scholar] [CrossRef]
  23. Yang, J.; Lian, H.; Li, L. Fracturing in coals with different fluids: An experimental comparison between water, liquid CO2, and supercritical CO2. Sci. Rep. 2020, 10, 18681. [Google Scholar] [CrossRef]
  24. Abbas, M.; Manouchehr, H.; Dane, K. An experimental investigation into surface roughness of a hydraulic fracture. J. Aust. Pet. Prod. Explor. Assoc. 2018, 58, 728–732. [Google Scholar]
  25. Bobrova, M.; Stanchits, S.; Shevtsova, A.; Filev, E.; Stukachev, V.; Shayahmetov, T. Laboratory Investigation of Hydraulic Fracture Behavior of Unconventional Reservoir Rocks. Geosciences 2021, 11, 292. [Google Scholar] [CrossRef]
  26. Daeffler, C.; Perroni, D.; Makarychev-Mikhailov, S.; Mirakyan, A. Internal Viscoelastic Surfactant Breakers from In-Situ Oligomerization. In Proceedings of the SPE International Conference on Oilfield Chemistry, Galveston, TX, USA, 8 April 2019. [Google Scholar]
  27. Durairaj, R. Rheology-New Concepts, Applications and Methods; InTech: London, UK, 2013; ISBN 978-953-51-0953-2. [Google Scholar]
  28. Al-Muntasheri, G.A. A Critical Review of Hydraulic Fracturing Fluids over the Last Decade. In Proceedings of the SPE Western North American and Rocky Mountain Joint Meeting, Denver, CO, USA, 17 April 2014. [Google Scholar]
  29. Feng, Y.; Zhaolong, G.; Jinlong, Z.; Zhiyu, T. Viscoelastic surfactant fracturing fluid for underground hydraulic fracturing in soft coal seams. J. Pet. Sci. Eng. 2018, 169, 646–653. [Google Scholar] [CrossRef]
  30. Lu, Y.; Yang, F.; Ge, Z.; Wang, Q.; Wang, S. Influence of viscoelastic surfactant fracturing fluid on permeability of coal seams. Fuel 2017, 194, 1–6. [Google Scholar] [CrossRef]
  31. Chieng, Z.H.; Mohyaldinn, M.E.; Hassan, A.M.; Bruining, H. Experimental Investigation and Performance Evaluation of Modified Viscoelastic Surfactant (VES) as a New Thickening Fracturing Fluid. Polymers 2020, 12, 1470. [Google Scholar] [CrossRef]
  32. Yang, C.; Hu, Z.; Song, Z.; Bai, J.; Zhang, Y.; Luo, J.Q.; Du, Y.; Jiang, Q. Self-assembly properties of ultra-long-chain gemini surfactant with high performance in a fracturing fluid application. J. Appl. Polym. Sci. 2017, 134, 44602. [Google Scholar] [CrossRef]
  33. Yang, X.; Mao, J.; Zhang, Z.; Zhang, H.; Yang, B.; Zhao, J. Rheology of Quaternary Ammonium Gemini Surfactant Solutions: Effects of Surfactant Concentration and Counterions. J. Surfactants Deterg. 2018, 21, 467–474. [Google Scholar] [CrossRef]
  34. Yang, Z.; Xu, Y.; Wang, X.; Duan, Y.; Che, M.; Lu, Y. Study and Application of Novel Cellulose Fracturing Fluid in Ordos Basin. In IOP Conference Series: Earth and Environmental Science; IOP Publishing: Bristol, UK, 2018; Volume 170, p. 22145. [Google Scholar]
  35. Li, J.; Tellakula, R.; Rosencrance, S. Cross-Linked Acrylamide Polymer or Copolymer Gel and Breaker Compositions and Methods of Use. International Patent WO2015103203A1, 9 July 2015. [Google Scholar]
  36. Li, Y.; Wang, S.; Guo, J.; Gou, X.; Jiang, Z.; Pan, B. Reduced adsorption of polyacrylamide-based fracturing fluid on shale rock using urea. Energy Sci. Eng. 2018, 6, 749–759. [Google Scholar] [CrossRef]
  37. Horton, R.L.; Land, S. Oil-Based Hydraulic Fracturing Fluids and Breakers and Methods of Preparation and Use. U.S. Patent 2010/0252259 A1, 7 October 2010. [Google Scholar]
  38. Goodfellow, S.D.; Nasseri, M.H.B.; Maxwell, S.C.; Young, R.P. Hydraulic fracture energy budget: Insights from the laboratory. Geophys. Res. Lett. 2015, 42, 3179–3187. [Google Scholar] [CrossRef]
  39. Hu, L.; Ghassemi, A.; Riley, S.; Kahn, D. Lab-Scale Experiments Investigating the Possibility of Bedding Plane Slip Events During Microseismic Monitoring of Hydraulic Fracturing. In Proceedings of the 53rd US Rock Mechanics/Geomechanics Symposium, New York, NY, USA, 23 June 2019; p. ARMA-2019-1870. [Google Scholar]
  40. Stanchits, S.; Surdi, A.; Edelman, E.; Suarez-Rivera, R. Acoustic Emission And Ultrasonic Transmission Monitoring of Hydraulic Fracture Propagation In Heterogeneous Rock Samples. In Proceedings of the 46th U.S. Rock Mechanics/Geomechanics Symposium, Chicago, IL, USA, 24 June 2012; p. ARMA-2012-527. [Google Scholar]
  41. Rivas, E.; Gracie, R. A monolithic coupled hydraulic fracture model with proppant transport. Comput. Methods Appl. Mech. Eng. 2020, 372, 113361. [Google Scholar] [CrossRef]
  42. Stanchits, S.; Burghardt, J.; Surdi, A. Hydraulic Fracturing of Heterogeneous Rock Monitored by Acoustic Emission. Rock Mech. Rock Eng. 2015, 48, 2513–2527. [Google Scholar] [CrossRef]
  43. Yin, Q.; Liu, R.; Jing, H.; Su, H.; Yu, L.; He, L. Experimental Study of Nonlinear Flow Behaviors through Fractured Rock Samples after High-Temperature Exposure. Rock Mech. Rock Eng. 2019, 52, 2963–2983. [Google Scholar] [CrossRef]
  44. Abe, S.; Deckert, H. Roughness of fracture surfaces in numerical models and laboratory experiments. Solid Earth 2021, 12, 2407–2424. [Google Scholar] [CrossRef]
  45. Cheng, C.; Milsch, H. Hydromechanical Investigations on the Self-propping Potential of Fractures in Tight Sandstones. Rock Mech. Rock Eng. 2021, 54, 5407–5432. [Google Scholar] [CrossRef]
  46. Chen, Y.; Nagaya, Y.; Ishida, T. Observations of Fractures Induced by Hydraulic Fracturing in Anisotropic Granite. Rock Mech. Rock Eng. 2015, 48, 1455–1461. [Google Scholar] [CrossRef]
  47. Jia, Y.; Lu, Z.; Liu, H.; Wang, J.; Cheng, Y.; Zhang, X. Fracture Propagation and Morphology Due to Non-Aqueous Fracturing: Competing Roles between Fluid Characteristics and In Situ Stress State. Minerals 2020, 10, 428. [Google Scholar] [CrossRef]
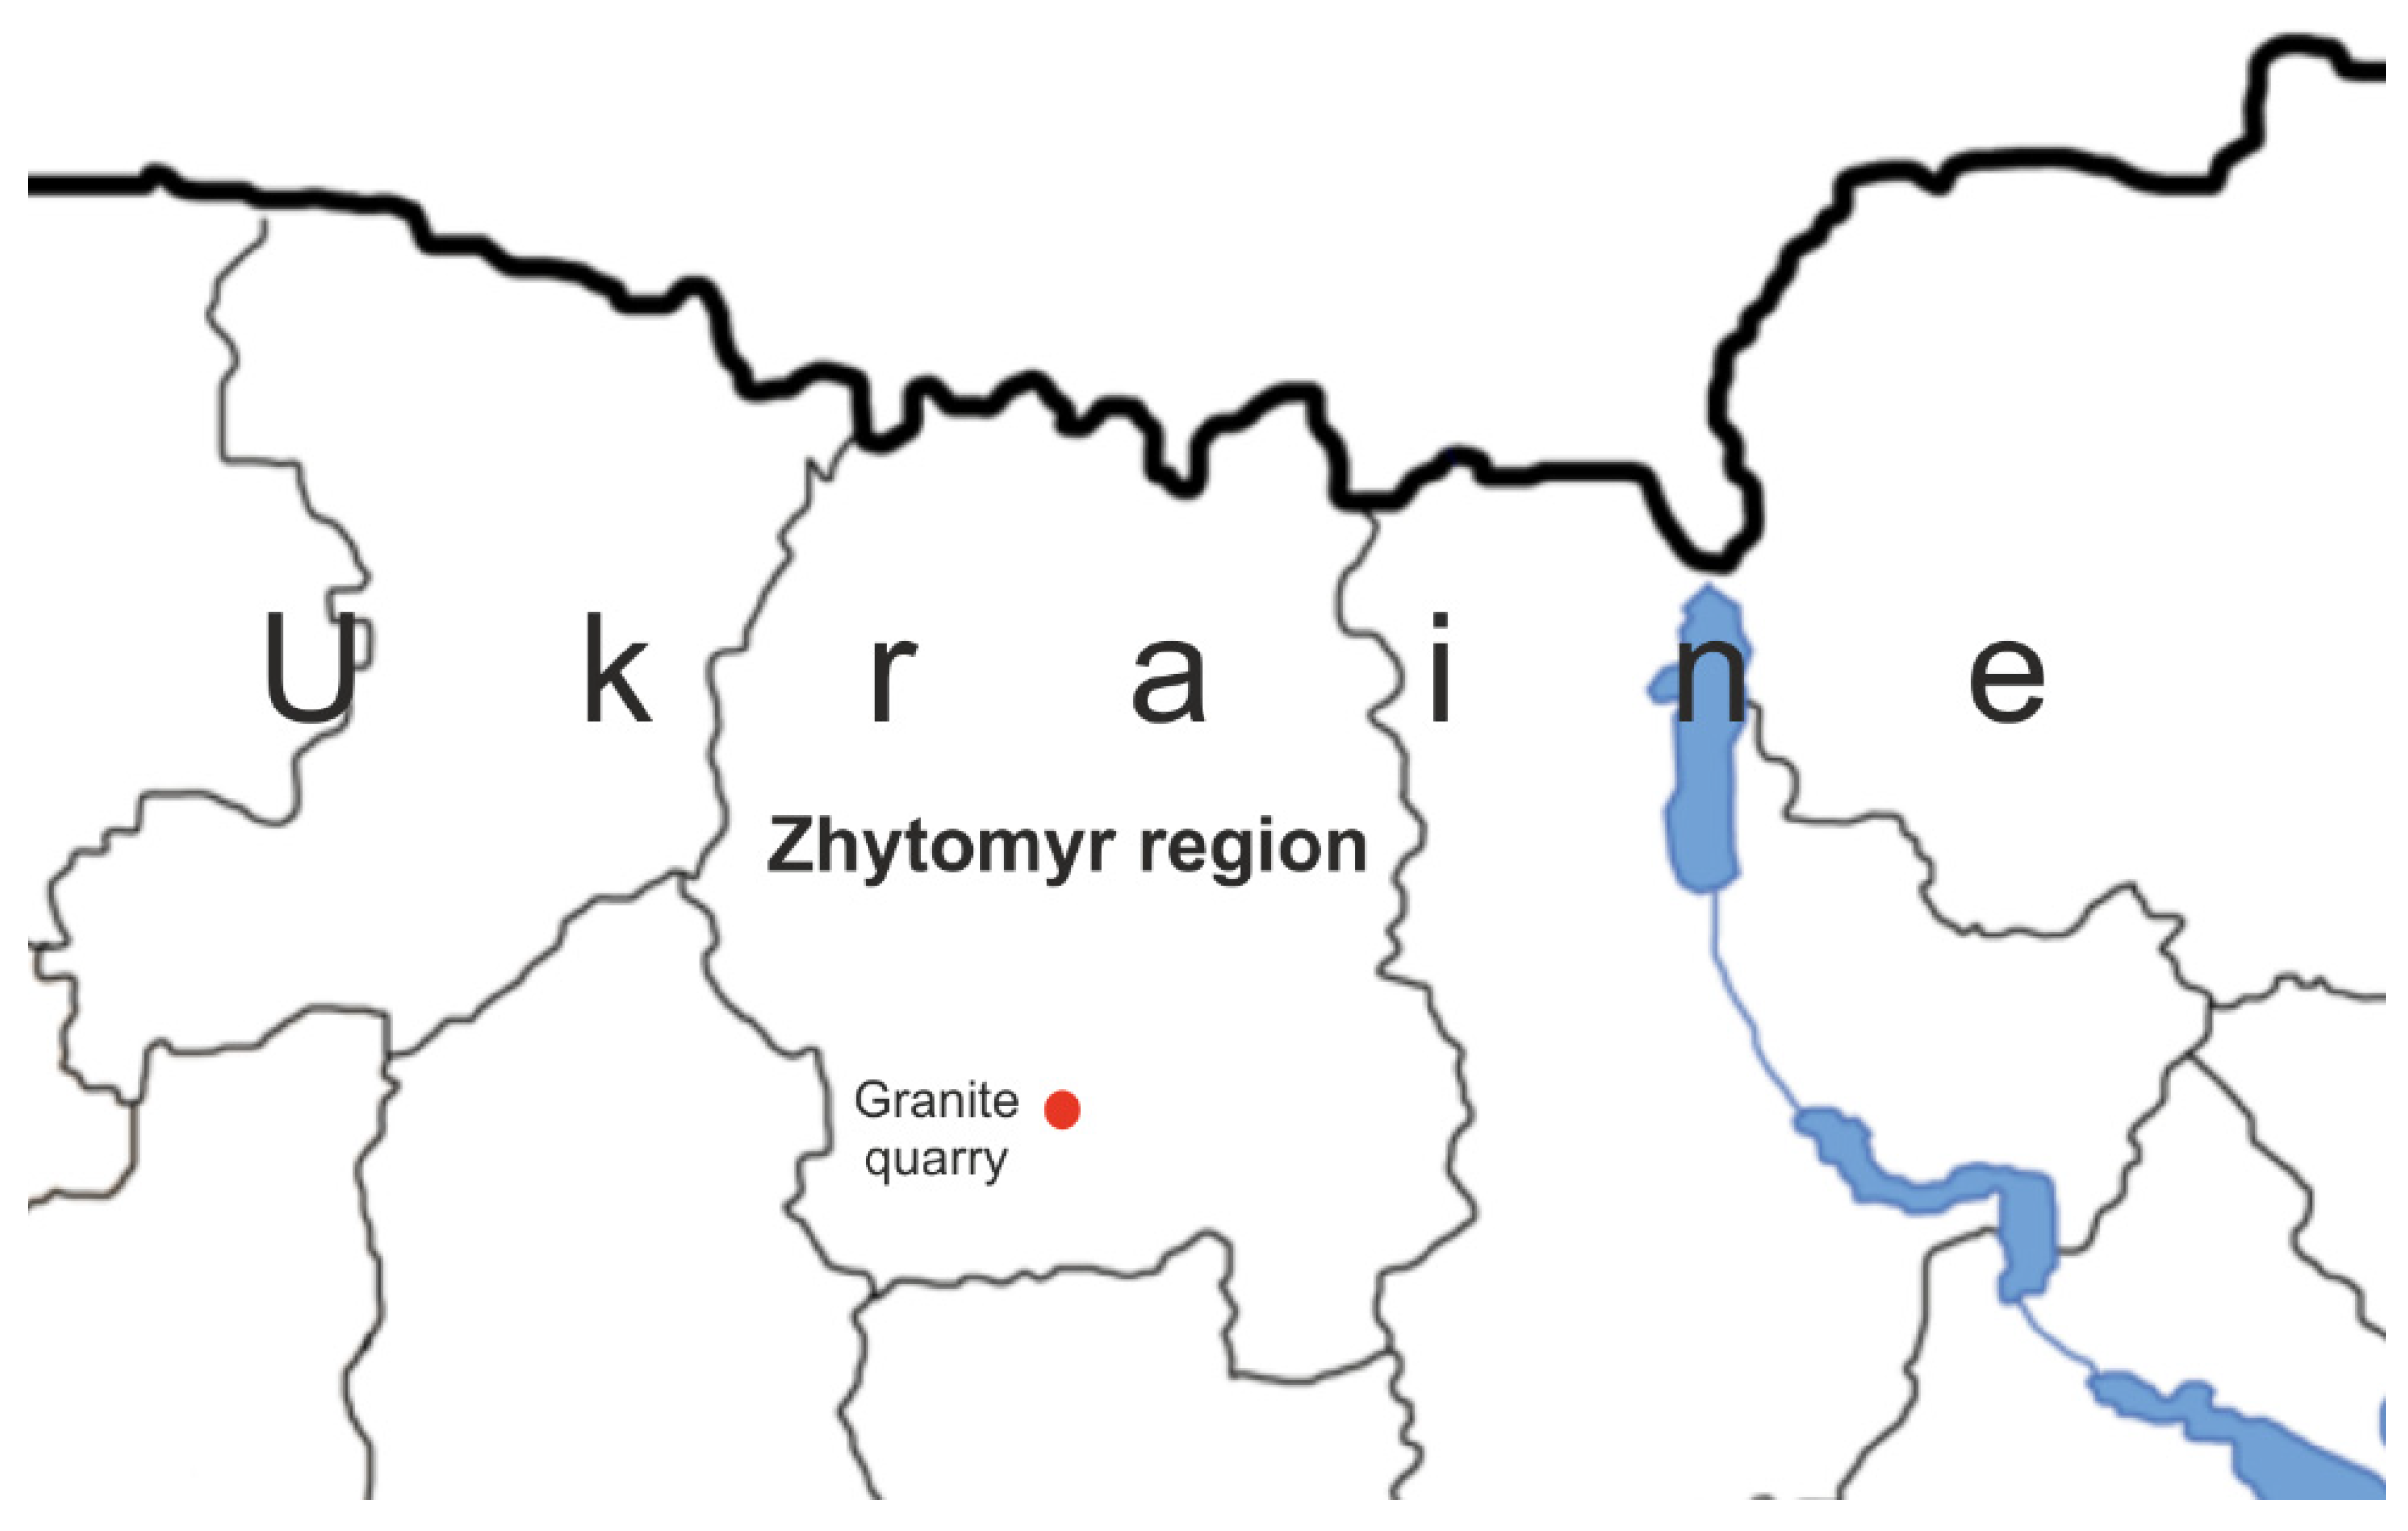
Figure 1. Schematic location of the Pokostovsky quarry (Ukraine).
Energies 15 03858 g001
Figure 2. Cross-section of Pokostovsky granite.
Energies 15 03858 g002
Figure 3. A granite specimen prepared for a test with an extensometer (1) installed, AE sensors (2) glued onto the cylindrical surface.
Energies 15 03858 g003
Figure 4. Projected sample surface with positions of 18 AE sensors and the simplified Extensometer as a function of azimuth and vertical coordinate Z.
Energies 15 03858 g004
Figure 5. Sketch of stresses applied to the cylindrical sample with a vertical well for fluid injection (left) and a scheme of stress state orientation along the horizontal well in a rock mass (right) [41].
Energies 15 03858 g005
Figure 6. Viscosity as the function of shear rate for water-based fluids and low viscose oil-based fluid.
Energies 15 03858 g006
Figure 7. The dependence of shear stress on shear rate for the water-based fluids and the low viscosity oil-based fluid.
Energies 15 03858 g007
Figure 8. Viscosity as the function of shear rate (left) and dependence of shear stress on shear rate (right) for the high viscosity oil-based fluid.
Energies 15 03858 g008
Figure 9. Sample WG-716: (a) fluid pressure (red) and the total number of AE signals located (purple); (b) axial deformations measured by the left (Ext_B, red) and right (Ext_A, blue) extensometers and a curve demonstrating loading piston position (green); (c) the volume of fluid injected into the hydraulic fracture; (d,e) horizontal coordinates of the located AE signals in the X and Y directions, respectively; (f) vertical coordinates of the located AE signals; (g) distribution of the distances between located AE signals and the axis of the sample. All parameters are plotted versus the time of sample testing.
Energies 15 03858 g009
Figure 10. Three orthogonal projections of positions of AE signals in the space of the WG-716 sample.
Energies 15 03858 g010
Figure 11. The specimen WG716 after the experiment (left) and AE event localization (right).
Energies 15 03858 g011
Figure 12. Sample WG-717: (a) fluid pressure (red) and the total number of AE signals located (purple); (b) axial deformation measured by the left (Ext_B, red) and right (Ext_A, blue) extensometers and a curve demonstrating loading piston position (green); (c) the volume of fluid injected into the hydraulic fracture; (d,e) horizontal coordinates of the located AE signals in the X and Y directions, respectively; (f) vertical coordinates of the located AE signals; (g) Distribution of the distances between located AE signals and the axis of the sample. All parameters are plotted versus the time of sample testing.
Energies 15 03858 g012
Figure 13. Three orthogonal projections of positions of AE signals in the space of the WG-717 sample.
Energies 15 03858 g013
Figure 14. Sample WG-721: (a) fluid pressure (red) and the total number of AE signals located (purple); (b) axial deformations measured by the left (Ext_B, red) and right (Ext_a, blue) extensometers and a curve demonstrating loading piston position (green); (c) the volume of fluid injected into the hydraulic fracture; (d,e) horizontal coordinates of the located AE signals in the X and Y directions, respectively; (f) vertical coordinates of the located AE signals; (g) distribution of the distances between located AE signals and the axis of the sample. All parameters are plotted versus the time of sample testing.
Energies 15 03858 g014
Figure 15. Three orthogonal projections of positions of AE signals in the space of the WG-721 sample.
Energies 15 03858 g015
Figure 16. Sample WG-722: (a) fluid pressure (red) and the total number of AE signals located (purple); (b) axial deformations measured by the left (Ext_B, red) and right (Ext_A, blue) extensometers and a curve demonstrating piston position (green); (c) the volume of fluid injected into the hydraulic fracture; (d,e) horizontal coordinates of the located AE signals in the X and Y directions, respectively; (f) vertical coordinates of the located AE signals; (g) distribution of the distances between located AE signals and the axis of the sample. All parameters are plotted versus the time of sample testing.
Energies 15 03858 g016
Figure 17. Three orthogonal projections of positions of AE signals in the space of the WG-722 sample.
Energies 15 03858 g017
Figure 18. The specimens WG716, WG717, WG721, and WG722 after the experiment.
Energies 15 03858 g018
Figure 19. Illustration of the correlation between the fracture width and the fluid viscosity.
Energies 15 03858 g019
Figure 20. The relationship between injected fluid viscosity and fracture propagation velocity.
Energies 15 03858 g020
Figure 21. The top view on: (a) localizations of AE signals recorded during initial stage of HF propagation (b) 2D fracture surface maps of the samples and (c) sectors selected for the analysis of fracture topography.
Energies 15 03858 g021
Figure 22. Illustration of the real fracture surface geometry (colored) and the best-fit plane (black).
Energies 15 03858 g022
Figure 23. Correlation between tortuosity and the fracturing fluid viscosity.
Energies 15 03858 g023
Figure 24. Histograms of asperity height (blue histogram) and Gaussian distribution of asperity heights of the measuring surface (orange line).
Energies 15 03858 g024
Table 1. Physical properties of rock samples.
Average Porosity, %Average Effective N2Permeability, nDYoung’s Modulus E, GPaPoisson’s RatioTensile Strength, MPaComprehensive Strength, MPaCohesion, MPaFriction Angle, Grad°
1.22656.468.790.227.2364.202844.2
Table 2. Geometrical parameters of specimens.
Sample IdDiameter, mmLength, mmWeight, gDensity, g/cm3
WG-71699.31108.242288.442.73
WG-71799.26108.882299.702.73
WG-72199.43109.102304.352.72
WG-72299.61110.842355.622.73
Table 3. The composition of fracturing water-based fluids *.
PAA Suspension (Gelling Agent PolyGel), L/m3Ampholytic Surfactant (NEFTENOL-VES), L/m3Structuring Reagent (R s−1), L/m3Clay Stabilizer, L/m3Demulsifier, L/m3Destructor, kg/m3Sample Id
Liquid based on synthetic polymer8.00--2.002.000.50WG-717
Non-polymer composition (VES)-70.0018.00---WG-716
* Chemical producer: Joint-Stock Company Small Innovative Enterprise of the Gubkin University “Petrohim-Service”.
Table 4. General description of the fracturing fluids composition.
Himeko N Gelling Agent, L/m3Himeko N Activator, L/m3Destructor, kg/m3Sample Id
Low viscous OilGel 7/77.007.00-WG-722
High viscous OilGel 40/4040.0040.00-WG-721
Table 5. Generalized results of geomechanical studies.
Sample IdWG-716WG-717WG-721WG-722
Type of fluidNon-Newtonian
Base of agent/fluidWater-basedOil-based
Fracturing fluidNon-polymer composition (VES)PolyGelOilGel 40/40OilGel 7/7
Injection rate, mL/min5
Sigma 1, MPa3722
Sigma 3, MPa238
Fluid viscosity (100 s−1), cP81951220102
Breakdown pressure, MPa57.3071.7039.9039.23
Fracture aperture, μm0.152.240.9
Fluid volume into the fracture, ml~00.0170.0260.01
HF propagation velocity, mm/s100401520
Time of the fluid filled the fracture before breakdown, s--10.6
Time interval from the AE initiation till the breakdown, s0.151.153.501.50
Table 6. Statistical surface roughness parameters of selected samples (Equations (1)–(3)).
Parameter WG-722WG-716WG-717WG-721
R p mm2.291.942.211.92
R m mm0.620.550.610.65
R r m s mm0.760.670.750.74
Tortuosity-1.471.411.431.33
Fluid viscosity (300 s−1)cP35.5849.7555.19310.81
Publisher’s Note: MDPI stays neutral with regard to jurisdictional claims in published maps and institutional affiliations.