1. Introduction
Hydraulic fracturing is one of the most effective treatments to create a cracks’ network and improve formation permeability. Currently, this technique is widely used in different fields. For example, the application of hydraulic fracturing allows us to achieve economically productive quantities of energy in the Enhanced Geothermal System [
1]. Hydraulic fracturing can also increase hydrocarbon productivity for various unconventional types of rock formations [
2]. The main agent or force in the fracturing process is the selected fluid and its composition. Nevertheless, the injected fluid composition can significantly influence properties of water-sensitive reservoirs, especially those with a high content of expandable clay [
3]. Unfortunately, existing theoretical models of HF propagation have some limitations regarding prediction of the influence of fluids on reservoir properties, and in situ experiments in the target reservoir are difficult and expensive. Thus, laboratory experiments are a reasonable alternative, which could provide comprehensive information about the dynamics and properties of created HF before the field application of a certain hydraulic fracturing technique [
4].
Importantly, each unconventional reservoir is unique and has its own permeability properties, composition, and formation pressure, which require an individual design of the hydraulic fracturing procedure. For example, multistage hydraulic fracturing technology, which is widely used for the development of the American Bakken formation, is not applicable for the Bazhenov formation [
5], owing to the fact that water-based fluids can cause a number of negative consequences, such as PV clogging, clay destabilization and emulsion formation, and changes in wettability. These agents are considered as typical for traditional formations, however, it could be critical for the Bazhenov formation due to extremely low pore-permeability properties of the formation matrix [
5].
For the last decade, a diverse number of fracturing fluids have been developed and applied. The most commonly used fracturing fluids are water-based, such as slickwater and gel- and polymer-based fluids because of their low price and easy manufacturing. For a successful and efficient hydraulic fracturing process, the choice of fluid is based on the following key parameters: compatibility of the injected fluid with the rocks and fluid of the target formation, the ability to create fluid pressure sufficient to form the well-connected network of cracks (fractures), as well as easy removal of the working fluid after the fracturing [
6]. In some cases, after the fracturing operation, it can also be problematic to obtain a flow from the hydrocarbon reservoir because of the existence of an almost impermeable zone within the rock. Such a filter-cake effect can be caused by incomplete destruction of chemical bonds of the viscoelastic system after hydraulic fracturing and can require injection of high-quality breakers [
7]. In addition, the fracturing fluid must be viscous and elastic enough to hold and transport the proppant well within the created HF, which is the basis of their sand-carrying and sand-holding ability [
8]. In addition, multistage hydraulic fracturing requires a large volume of high-quality water, which makes it ecologically consuming and impractical [
9]. Flowback fluid cannot be simply re-used, because it contains a high level of contamination, including heavy metals, therefore fracturing fluid requires considerable cleaning and treatment [
10].
A reasonable solution to the described problems would be to modify existing fracturing agents. A number of new waterless fracturing technologies, such as liquefied petroleum gas (LPG) fracturing, nitrogen foam fracturing on hydrocarbon base, CO
2 foam fracturing [
11], liquid/supercritical CO
2 fracturing, gas fracturing and cryogenic fracturing using fluid N
2 [
12] were developed. Additional data can be found in the reviews [
13,
14,
15,
16].
Before industrial application of new fluids in the field conditions, the testing of fluids in laboratory conditions could be useful [
17]. Existing works are mainly focused on the laboratory hydraulic fracturing experiments with promising waterless fracturing fluids such as liquefied and supercritical gases. In case of Liquid nitrogen (LN
2) injection, thermal stress plays a significant role in reducing a fracture initiation and propagation pressure by generating enormously high-tensile hoop stress and causing extensive rock damage [
18,
19]. Injection of supercritical carbon dioxide (CO
2) demonstrates a strong thermal gradient, generating local tensile stress in the rocks surrounding a borehole [
20].
In addition, waterless fracturing technologies have been actively considered due to concerns arising from the heavy use of water. Alternative fracturing fluid as Liquid nitrogen can be directly obtained by separating and compressing nitrogen gas from the air, minimizing the cost for fluid transportation. Based on the results of experimental investigation, cryogenic fracturing using liquid nitrogen is demonstrated as a formation-damage-free stimulation technology that can effectively generate fractures in shale and sandstone reservoir rocks [
21]. The authors of [
22] provide a state-of-the-art review on several non-aqueous fracturing techniques focusing on the mechanism, merits and drawbacks, modeling, experiments, and field studies.
Despite all the advantages of waterless hydraulic fracturing with liquefied gas injection, this technique mainly induced complex fractures [
23]. The fracture surface roughness is an essential characteristic of the hydraulic fracturing process and has not been fully explored. The surface asperities play a significant role in proppant flow and settlement, fluid leak-off, and fracture tip movement. It has been shown that the transport and distribution of proppant particles within tortuous fractures can be problematic [
24]. The results of the study [
25] indicate that the rock fabric and the heterogeneity of the rock matrix are significant factors influencing the initiation and propagation of the fracture.
In the current study, we investigated the influence of unconventional fracturing fluids’ rheology on the fracture propagation parameters. These fluids are based on viscoelastic surfactants (VES) [
26,
27,
28,
29,
30,
31,
32,
33] and synthetic polymers such as polyacrylamide (PAA) [
34,
35,
36]. Additionally, in the current laboratory study we injected gelled oil-based system, prepared by the method described in [
37].
In our research, we studied the dynamics of created hydraulic fracturing as well as the parameters of fractures and topography of created surfaces. During our experiments, we have found that the unconventional fracturing fluid viscosity influences the number of formed fracture parameters, such as aperture, the propagation velocity, breakdown pressure, and finally tortuosity. The obtained correlations can be taken into account for the Hydraulic Fracture modelling, which may increase the efficiency of the hydraulic fracturing in the field.
4. Discussion
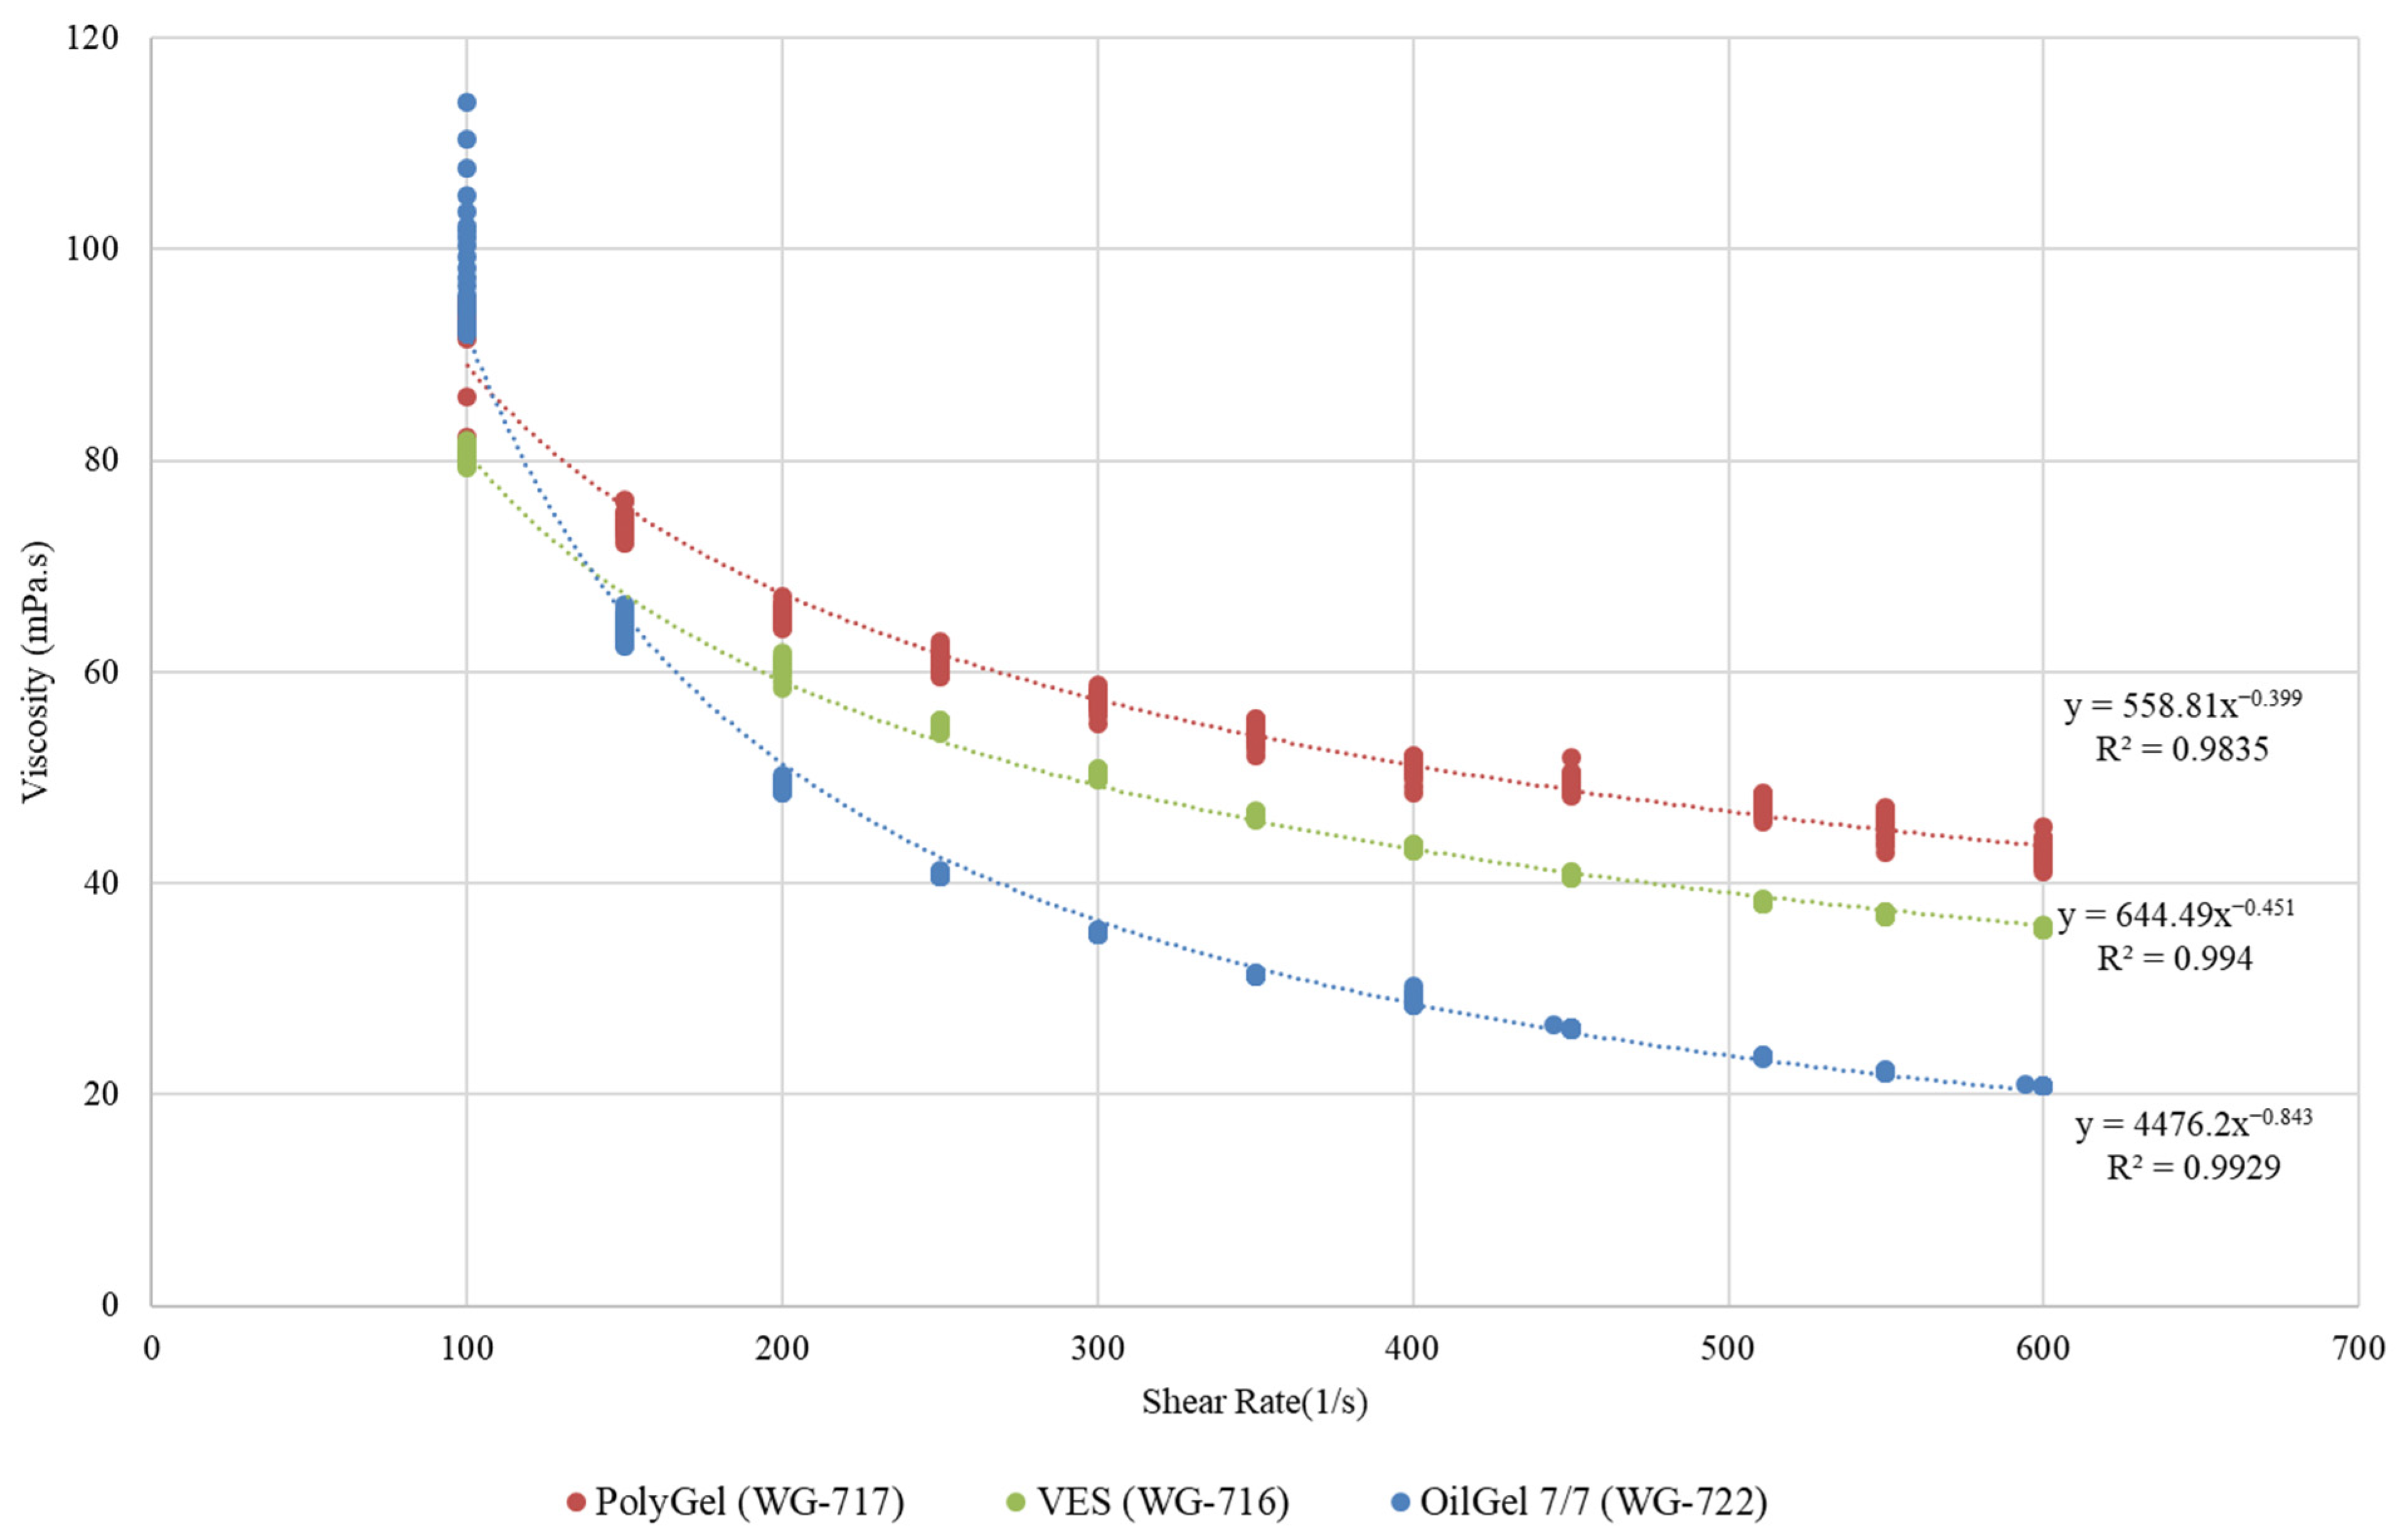
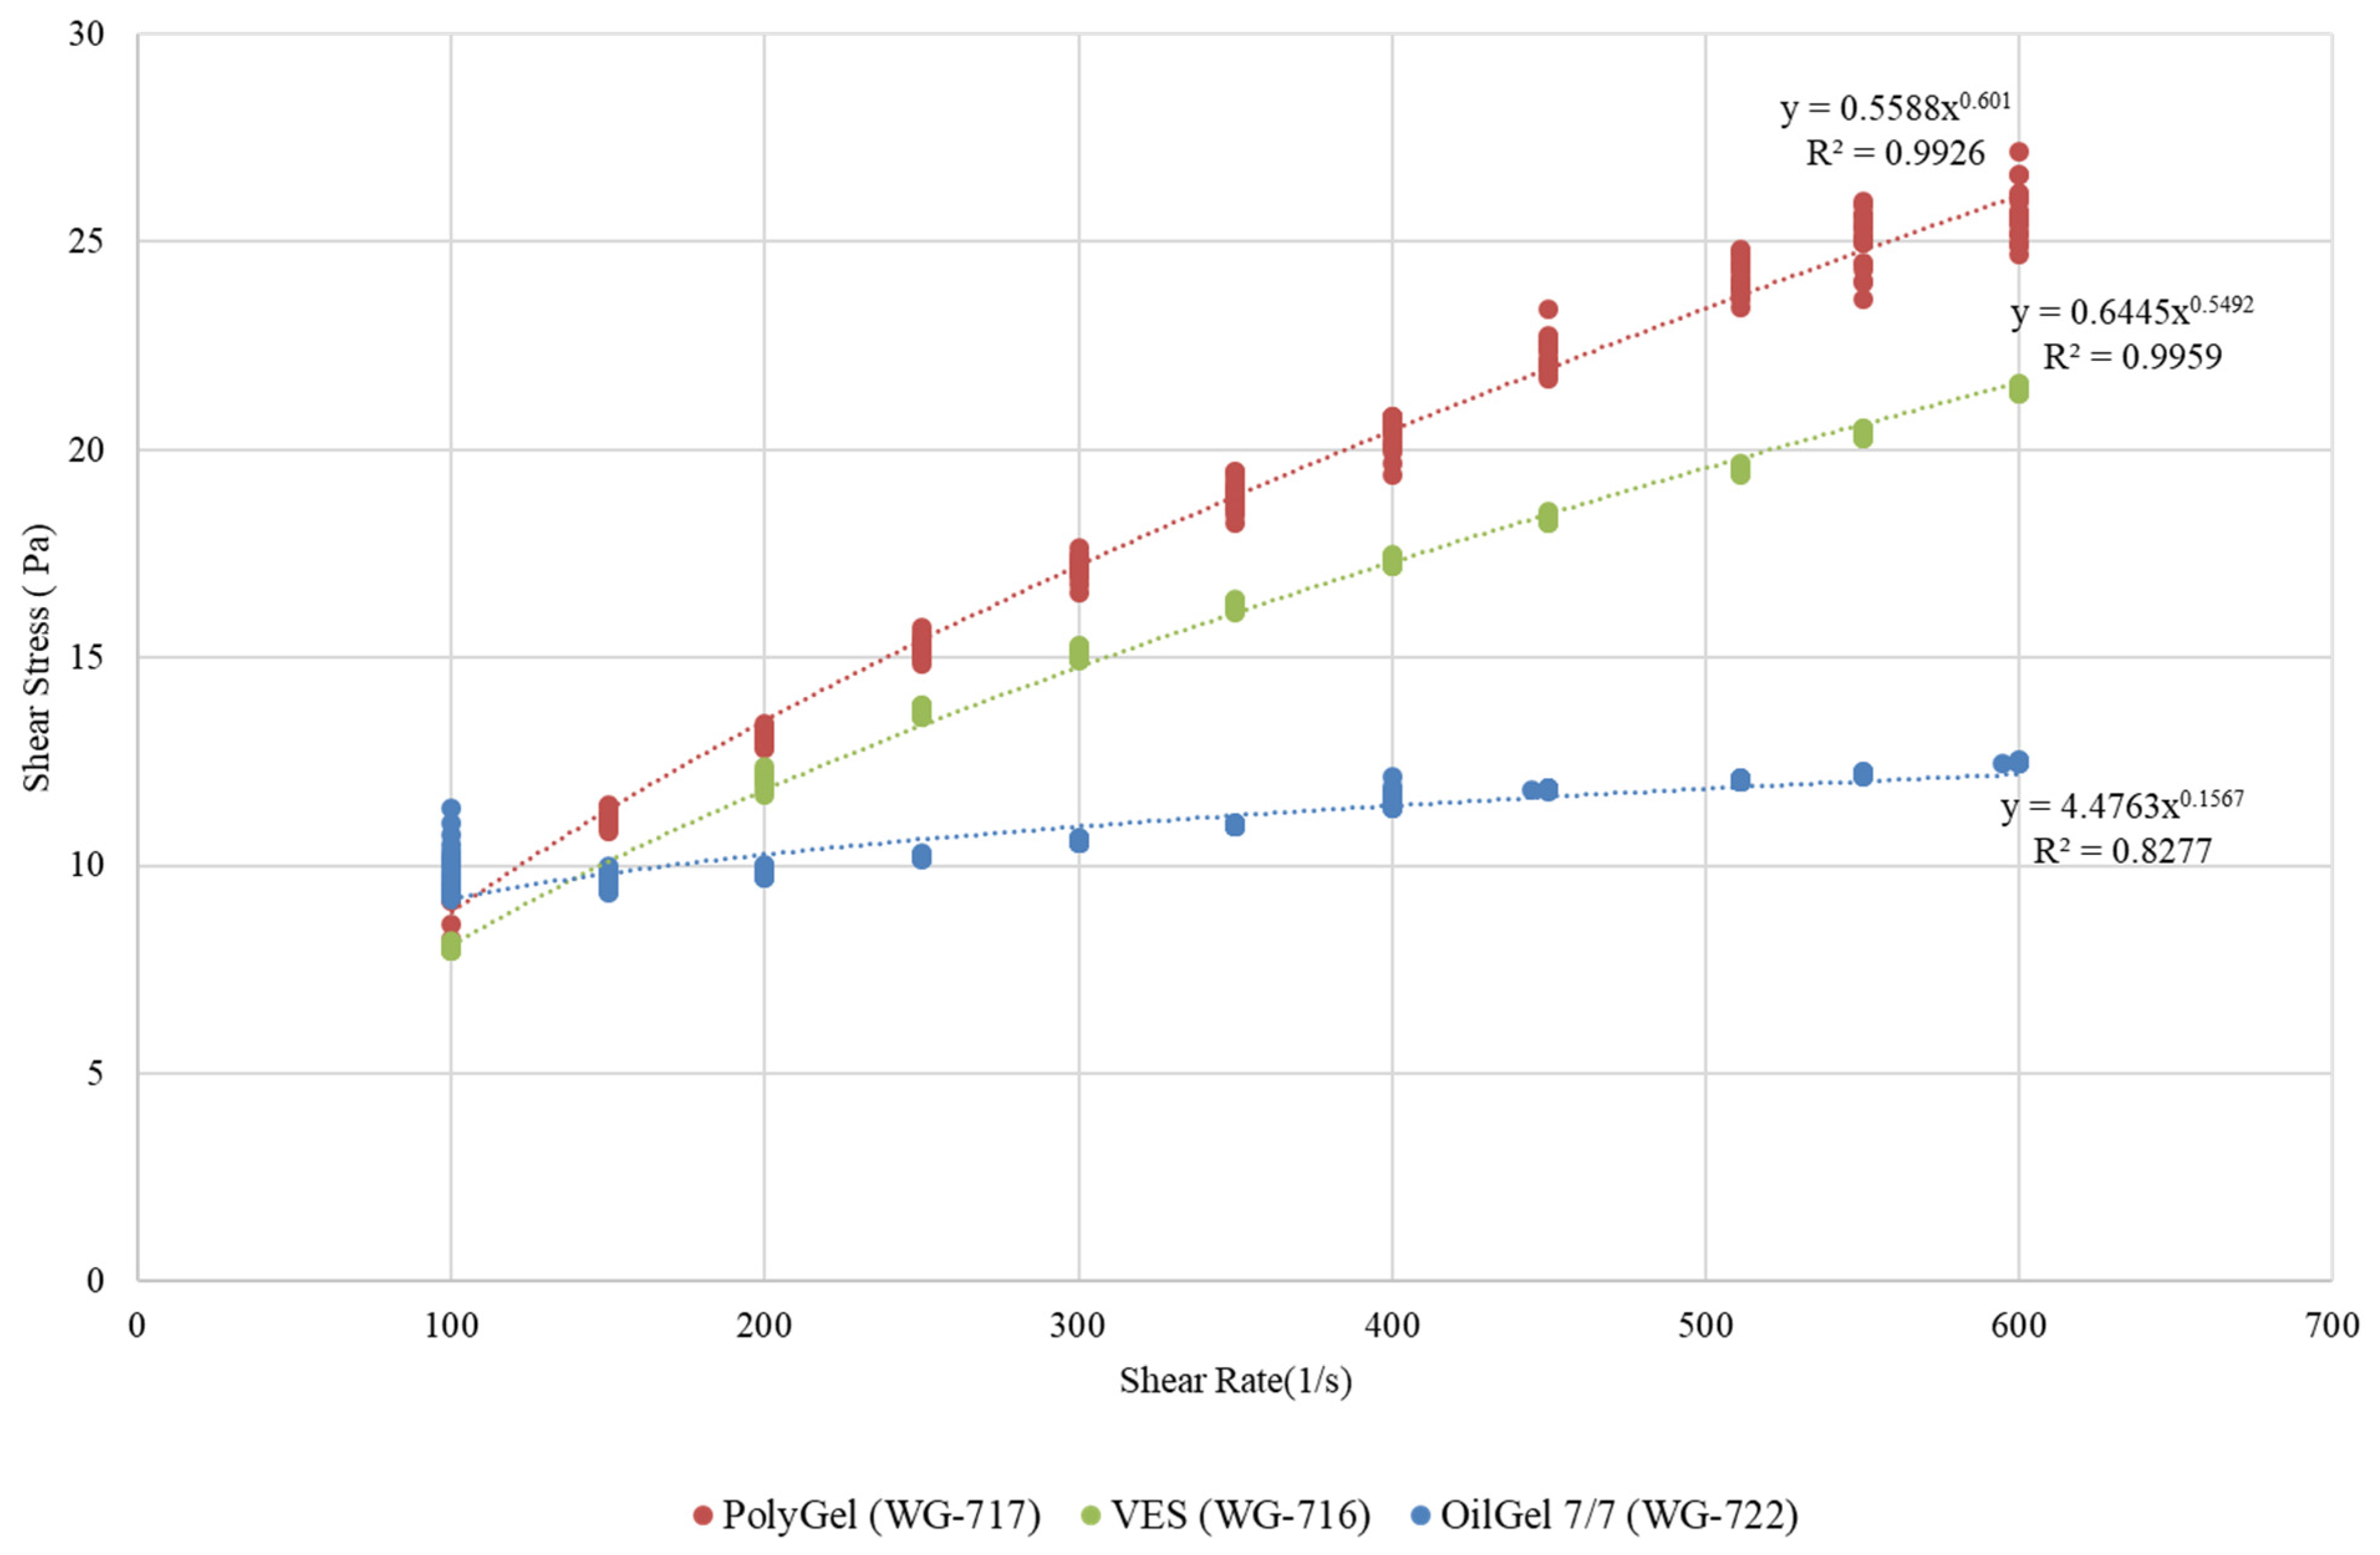
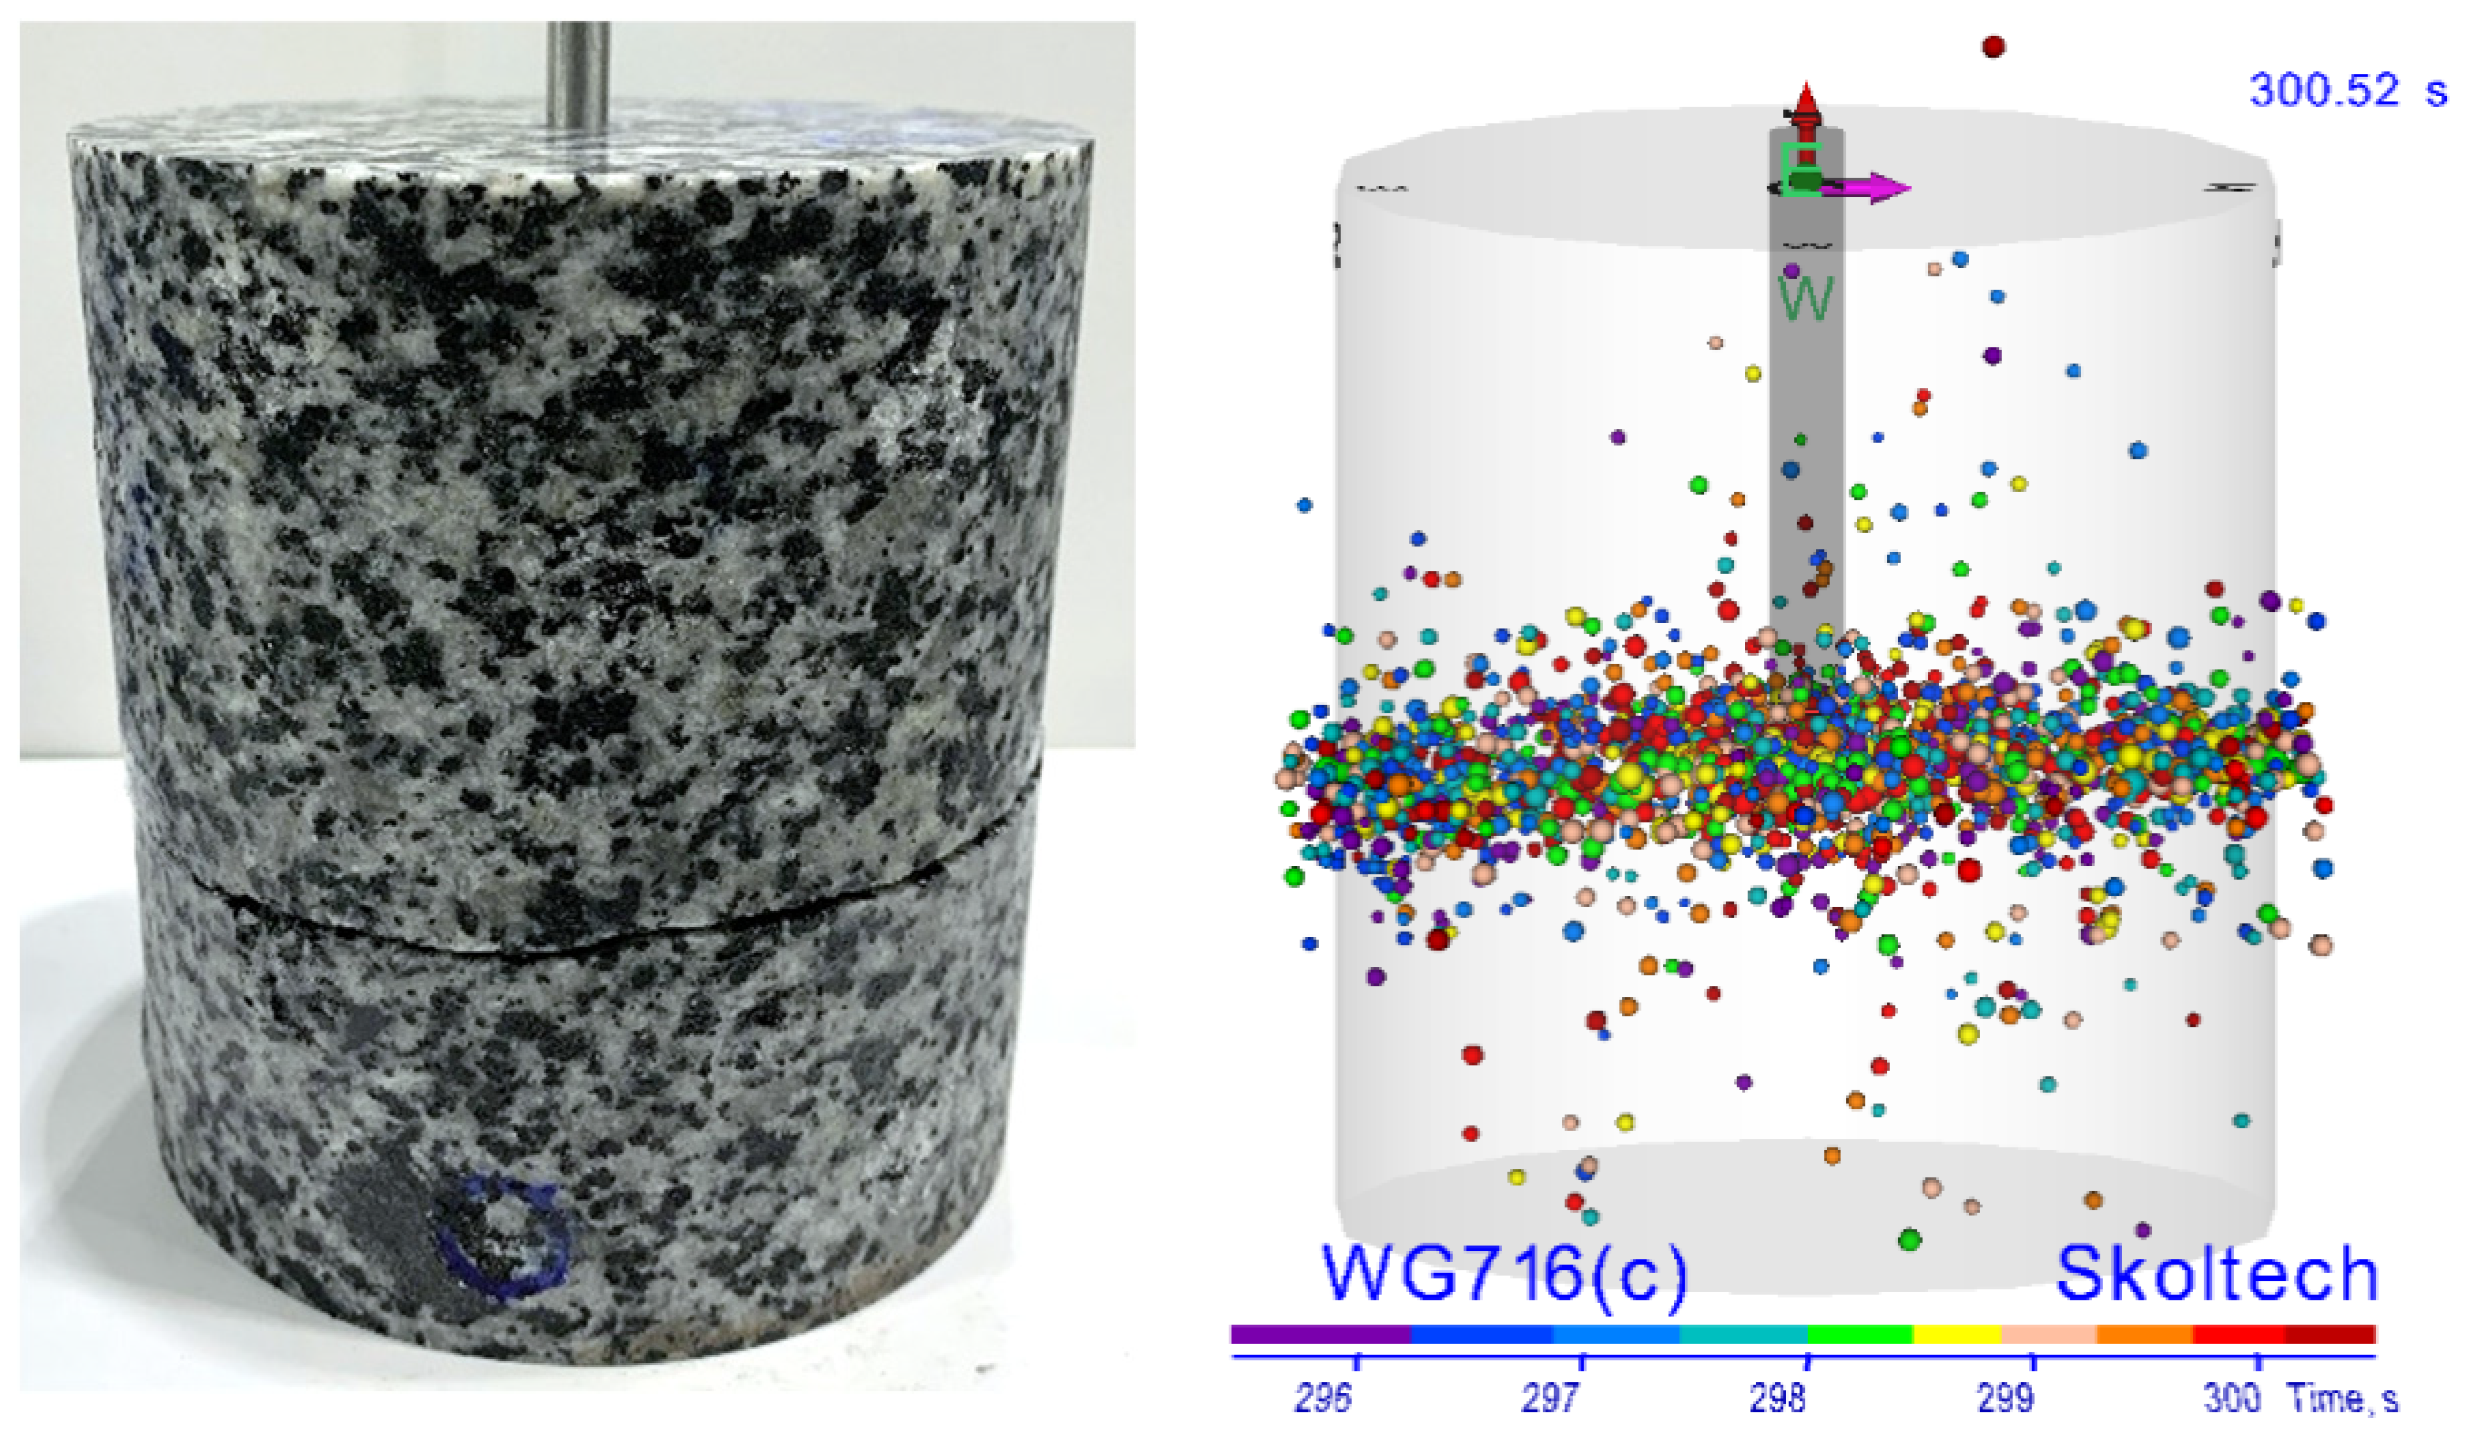
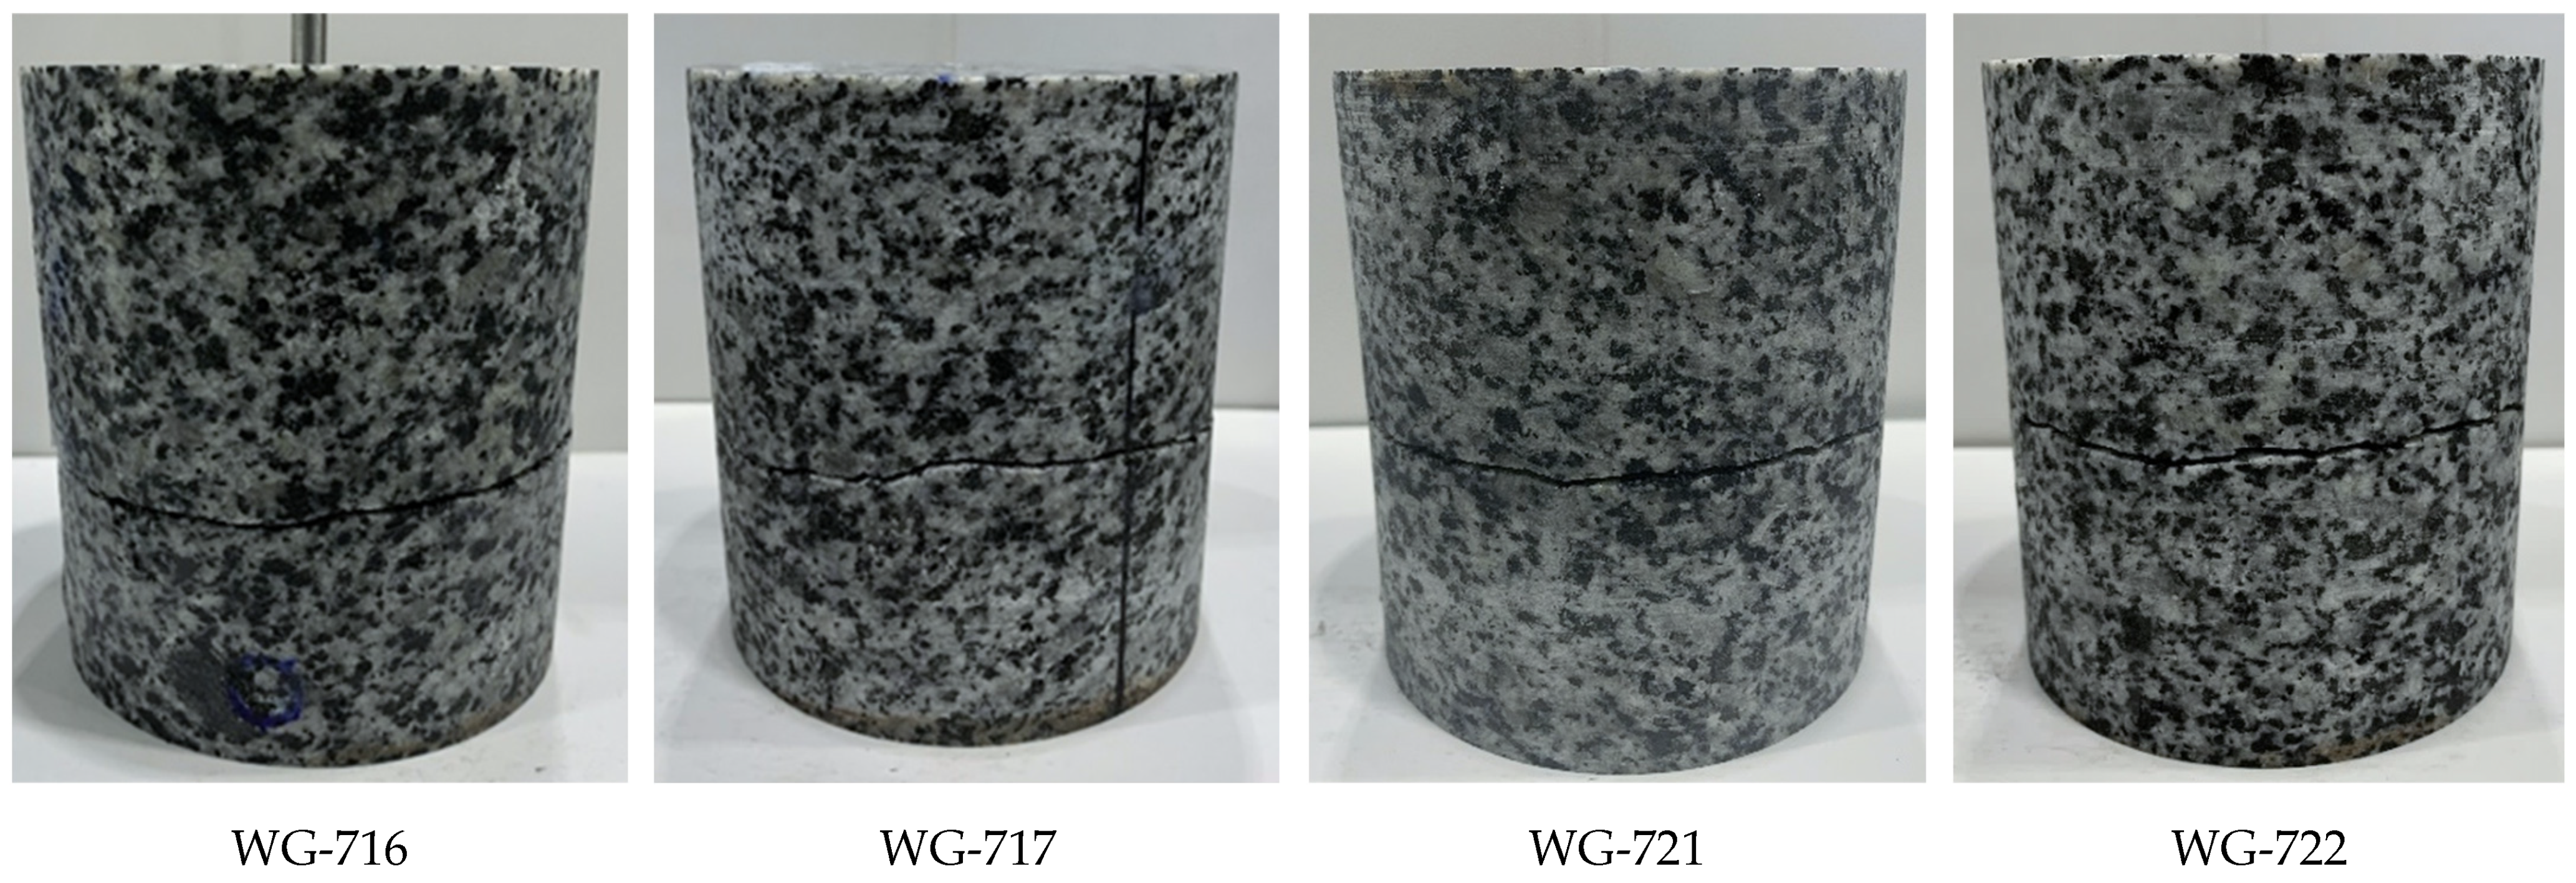
We present the results of our laboratory study of the hydraulic fracturing dynamics in low permeability granite samples with the analysis of hydraulic fracture characteristics measured during the test and post-test analysis of the created fracture topography. It has been found that the hydraulic fracturing behavior during the injection of two water-based fluids with relatively similar viscosity (non-polymer fluid (VES) ~81 cP and PolyGel fluid ~95 cP) varies significantly.
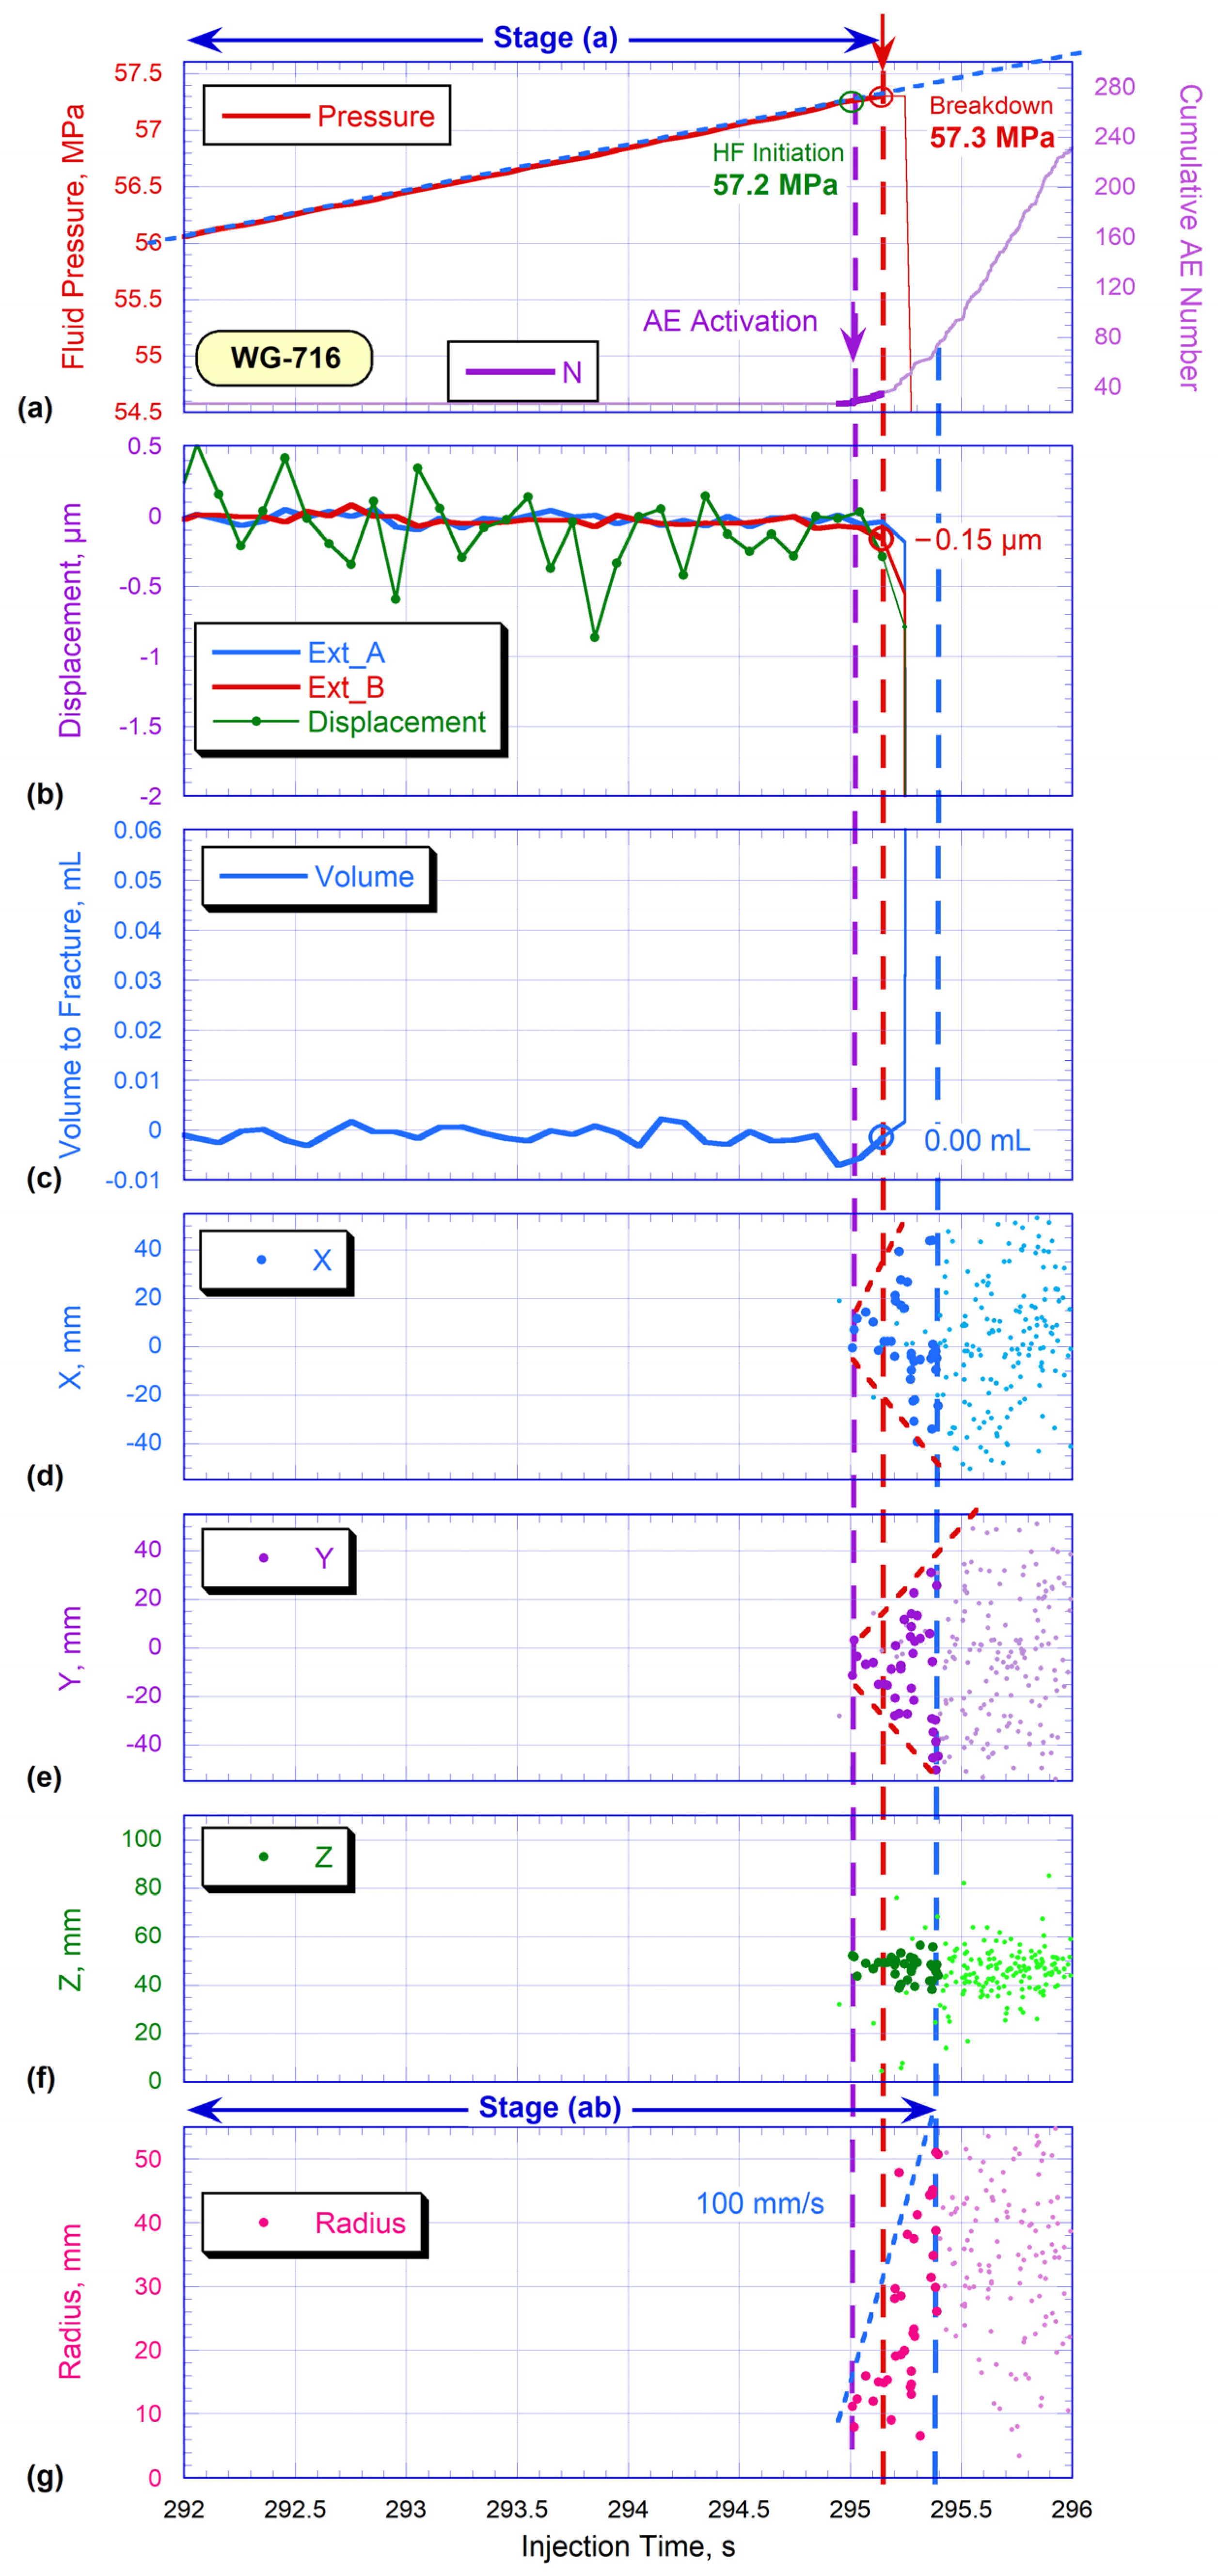
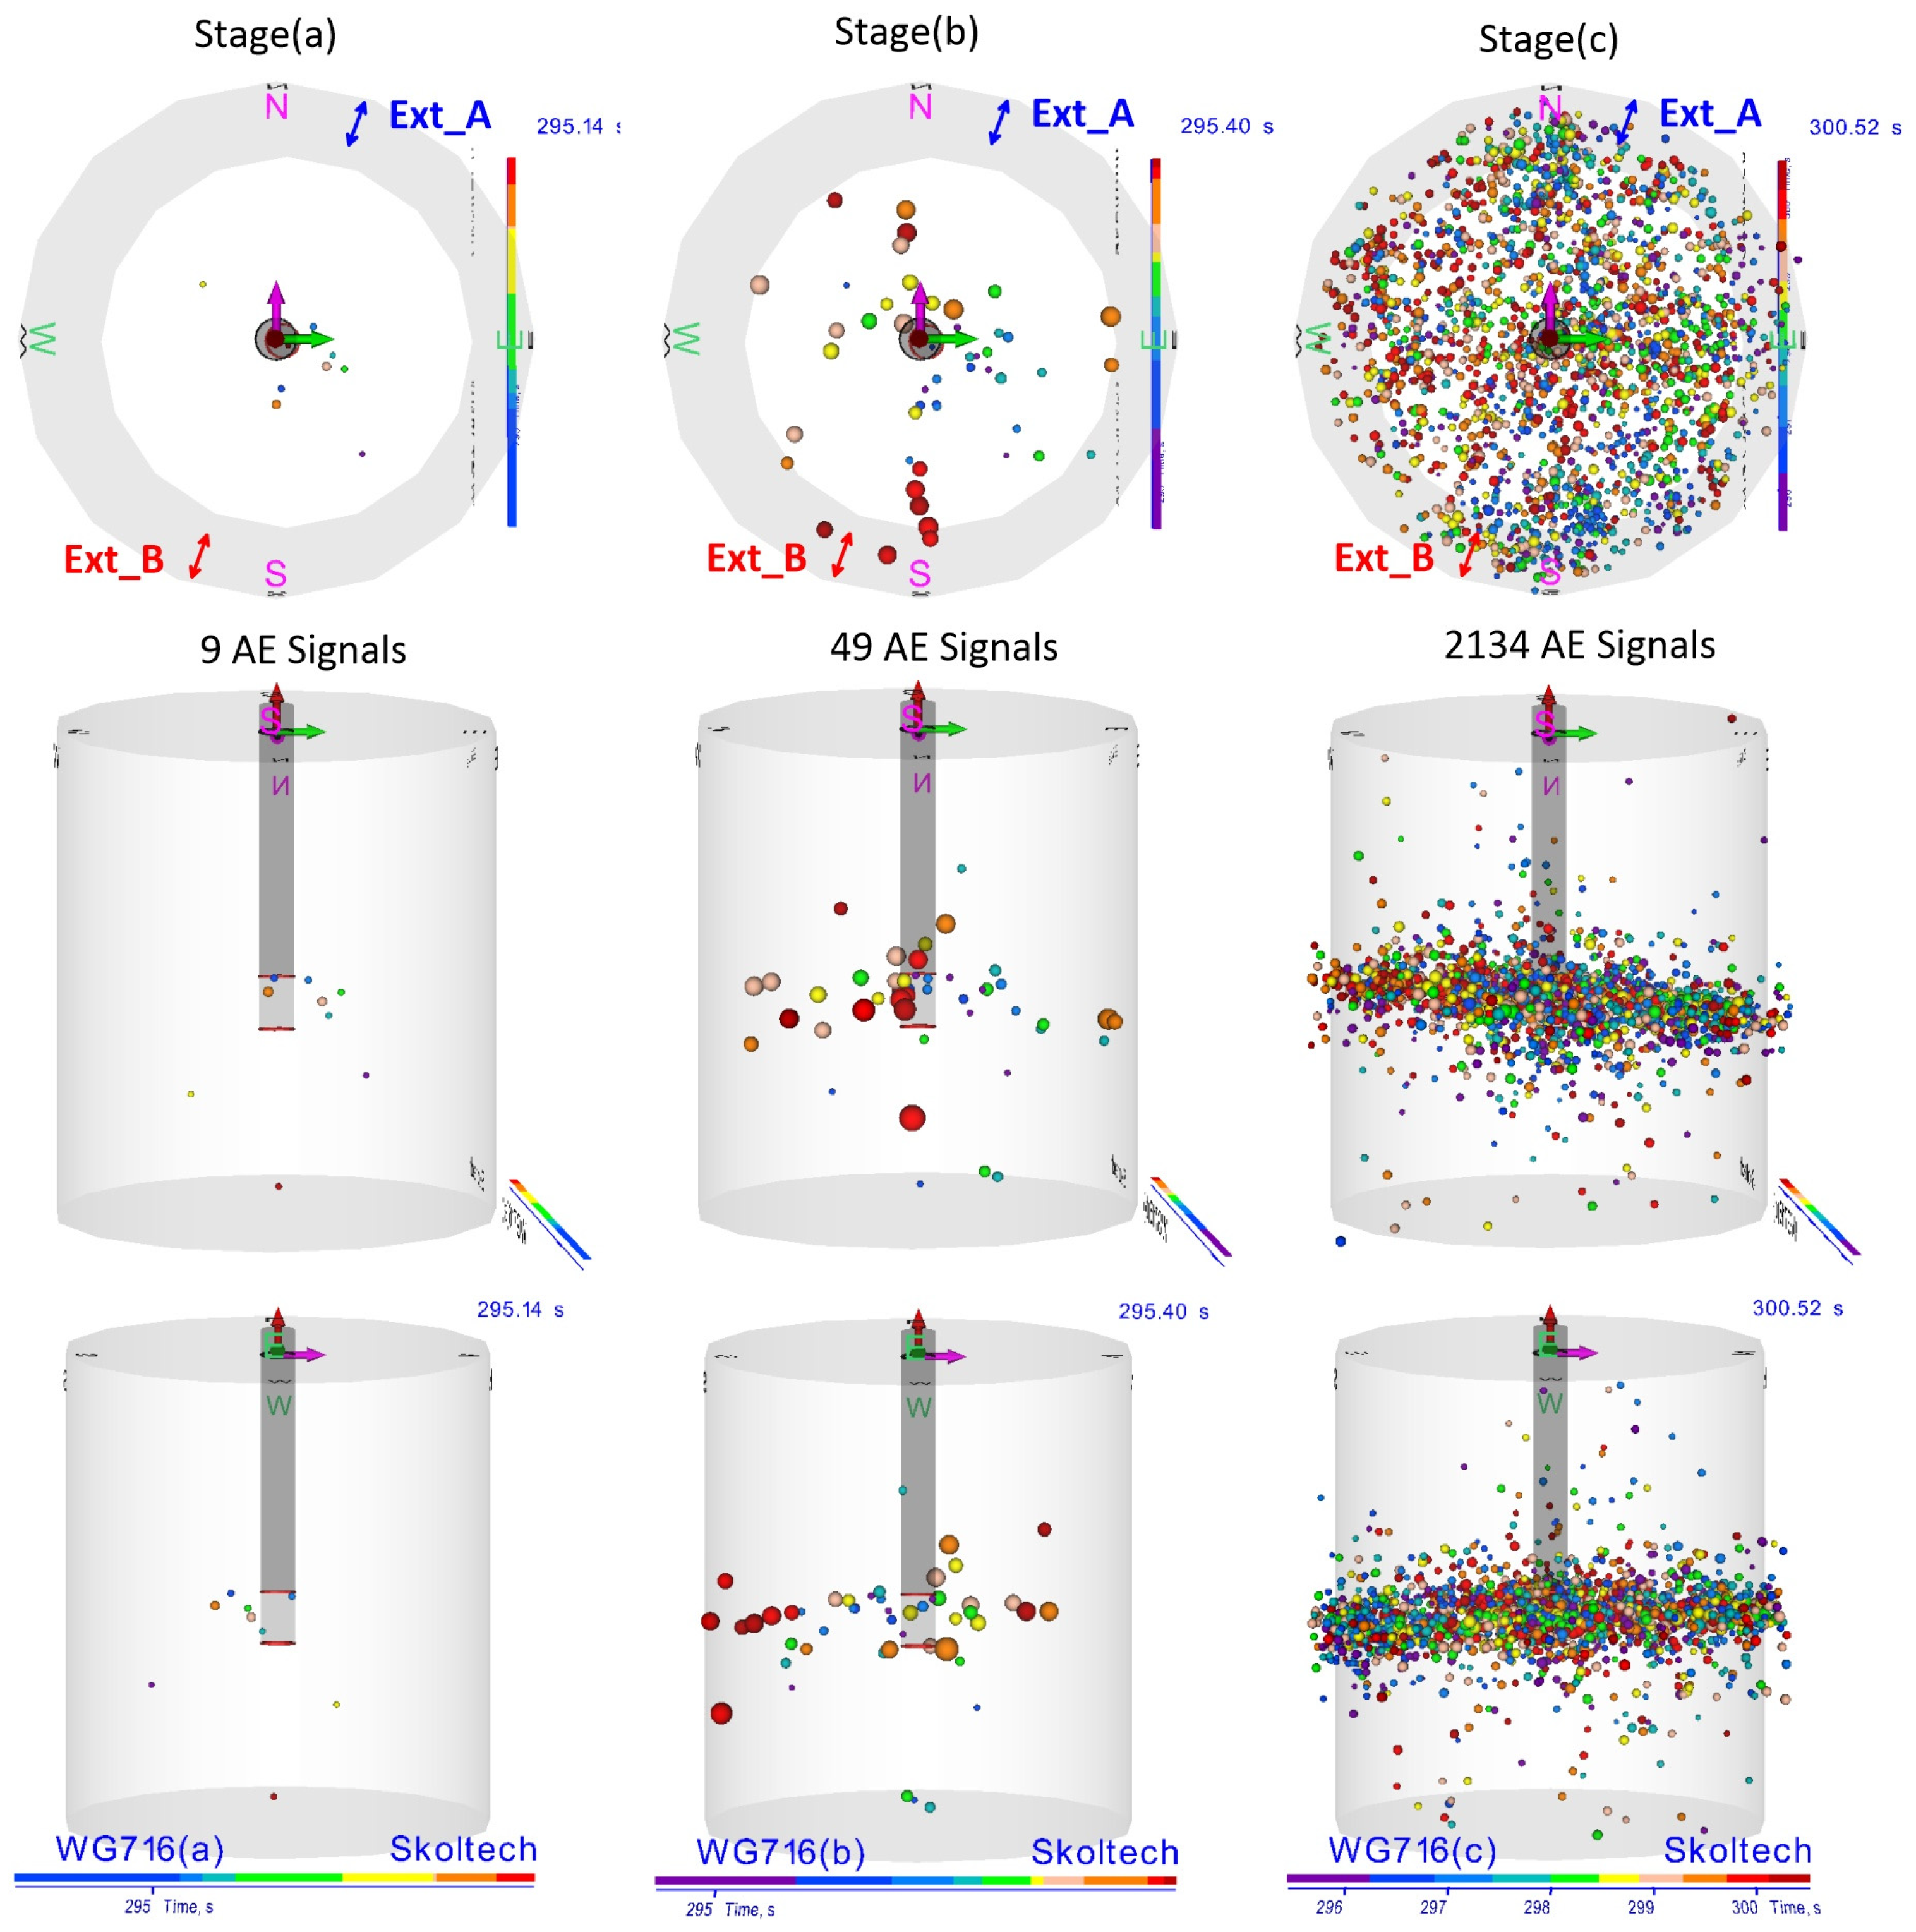
In the case of viscoelastic surfactant fluid injection (WG-716 sample), the initiation of AE had been observed 0.15 s before the maximum pressure was reached. At the moment of breakdown, only 9 AE signals were registered. It should be noted that the HF tip reached the surface of the sample after the breakdown point. The AE signal cloud propagation velocity, which corresponds to the HF propagation velocity, was approximately 100 mm/s. The value of the axial deformation of the WG-716 sample and the volume of fluid injected into the fracture were insignificant (
Table 5). This fracture behavior is typical for low-viscosity fluids such as water [
42]. Presumably, the viscoelastic surfactant fluid had sufficient mobility and began to fill in the hydraulic fracture at the first moment of its initiation, which led to a pressure drop in the well.
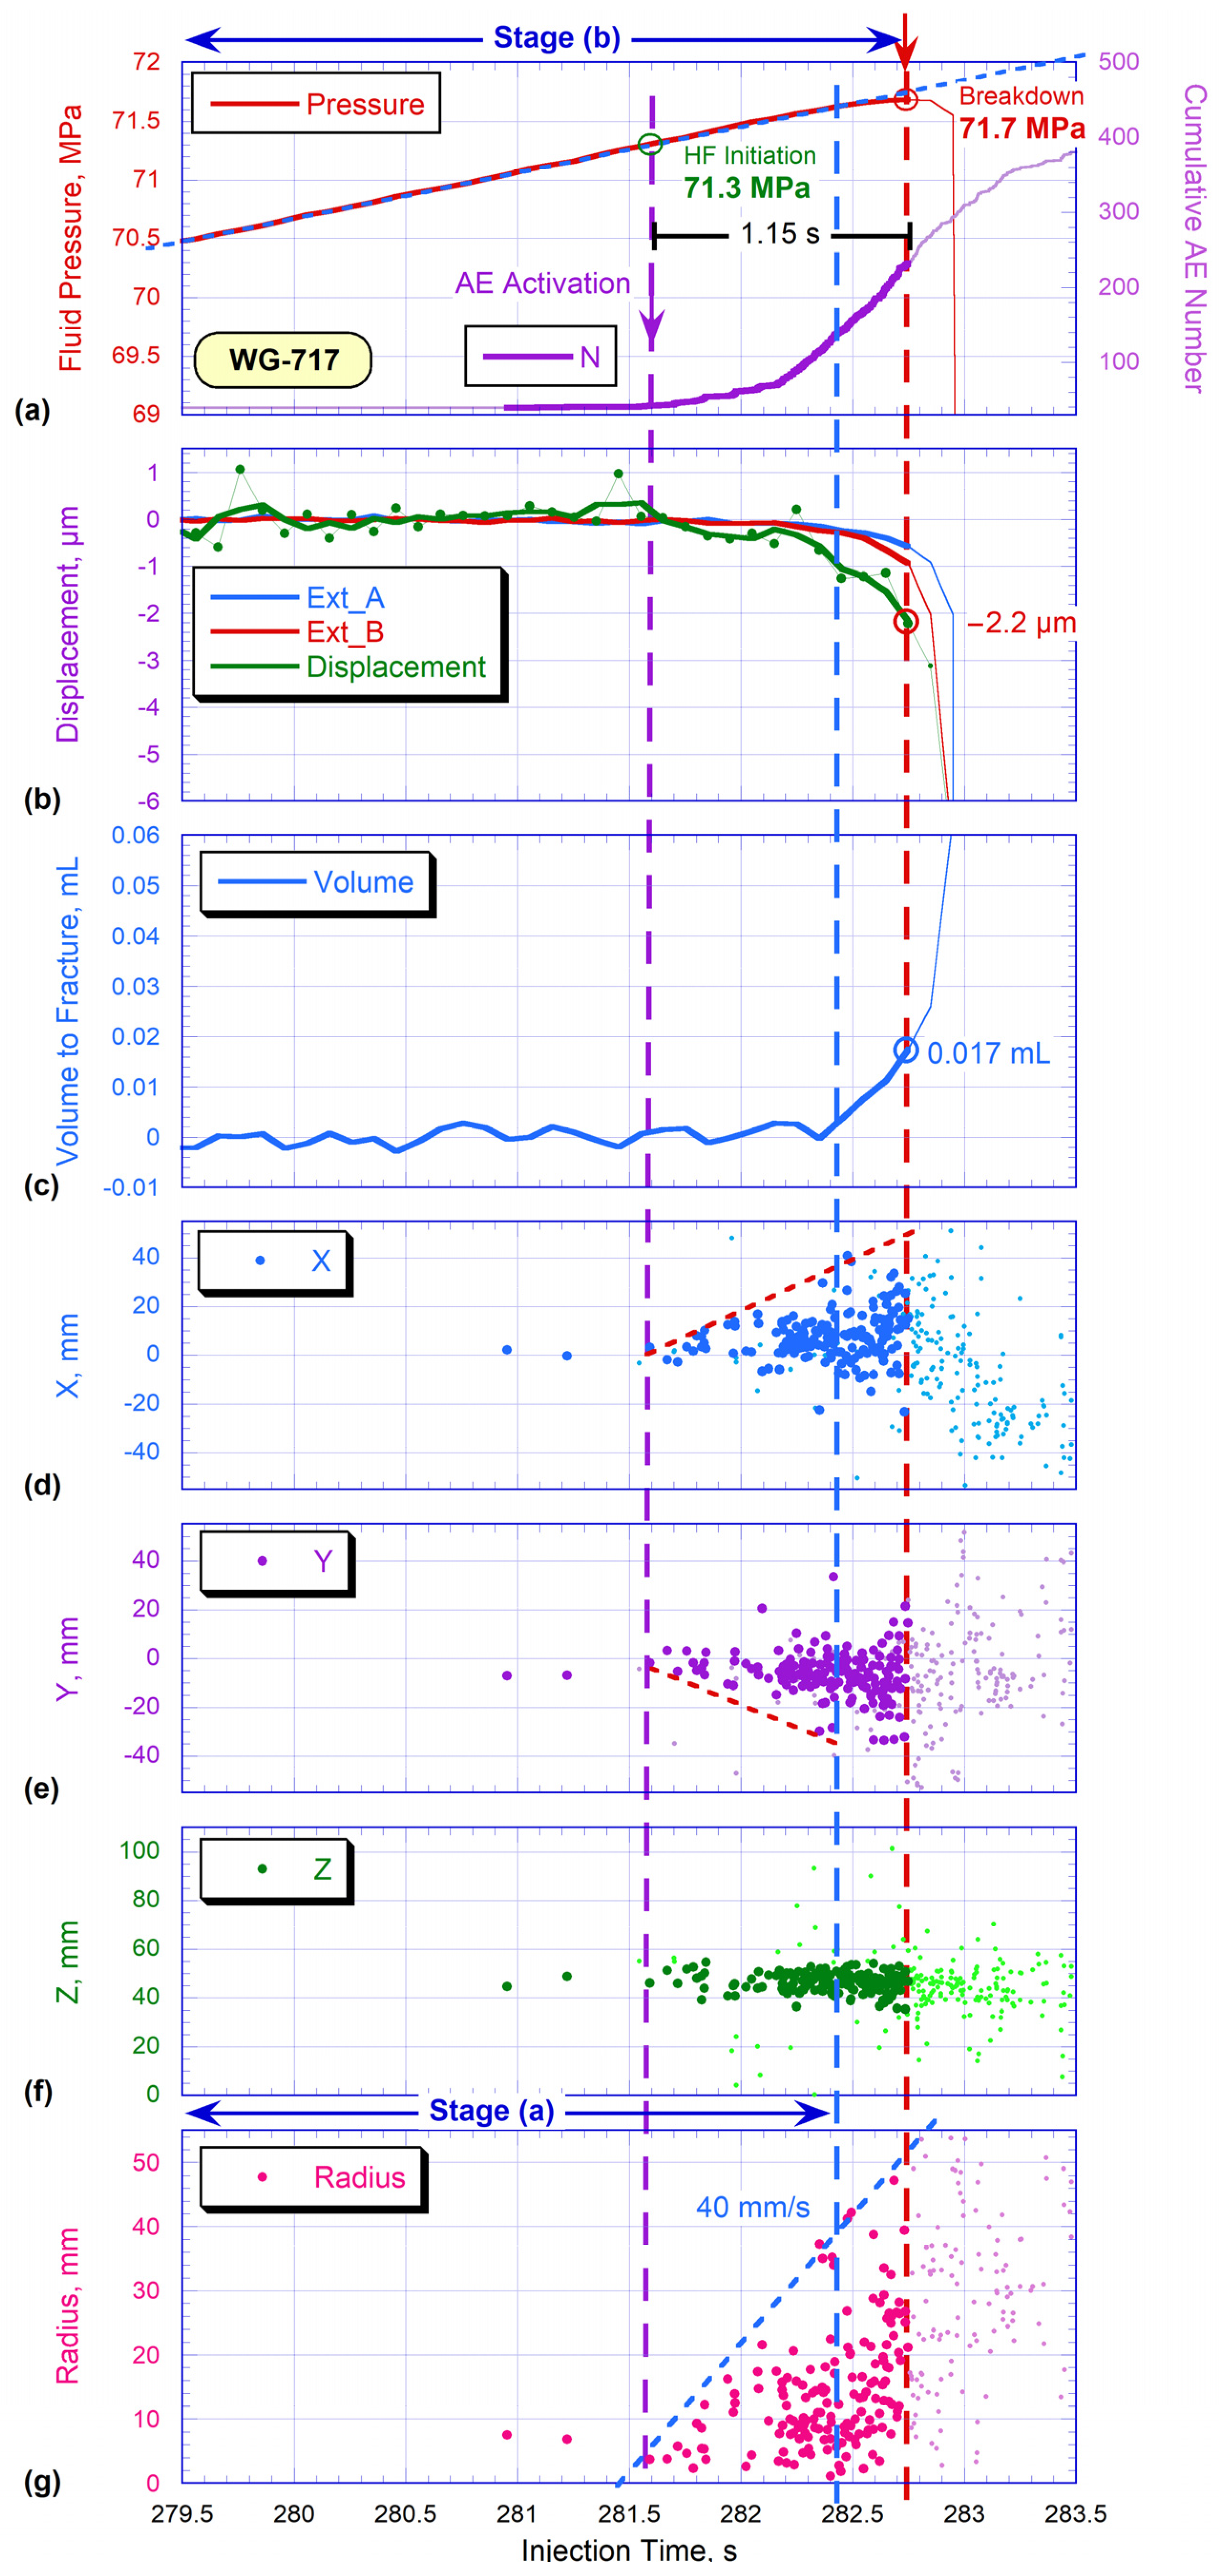
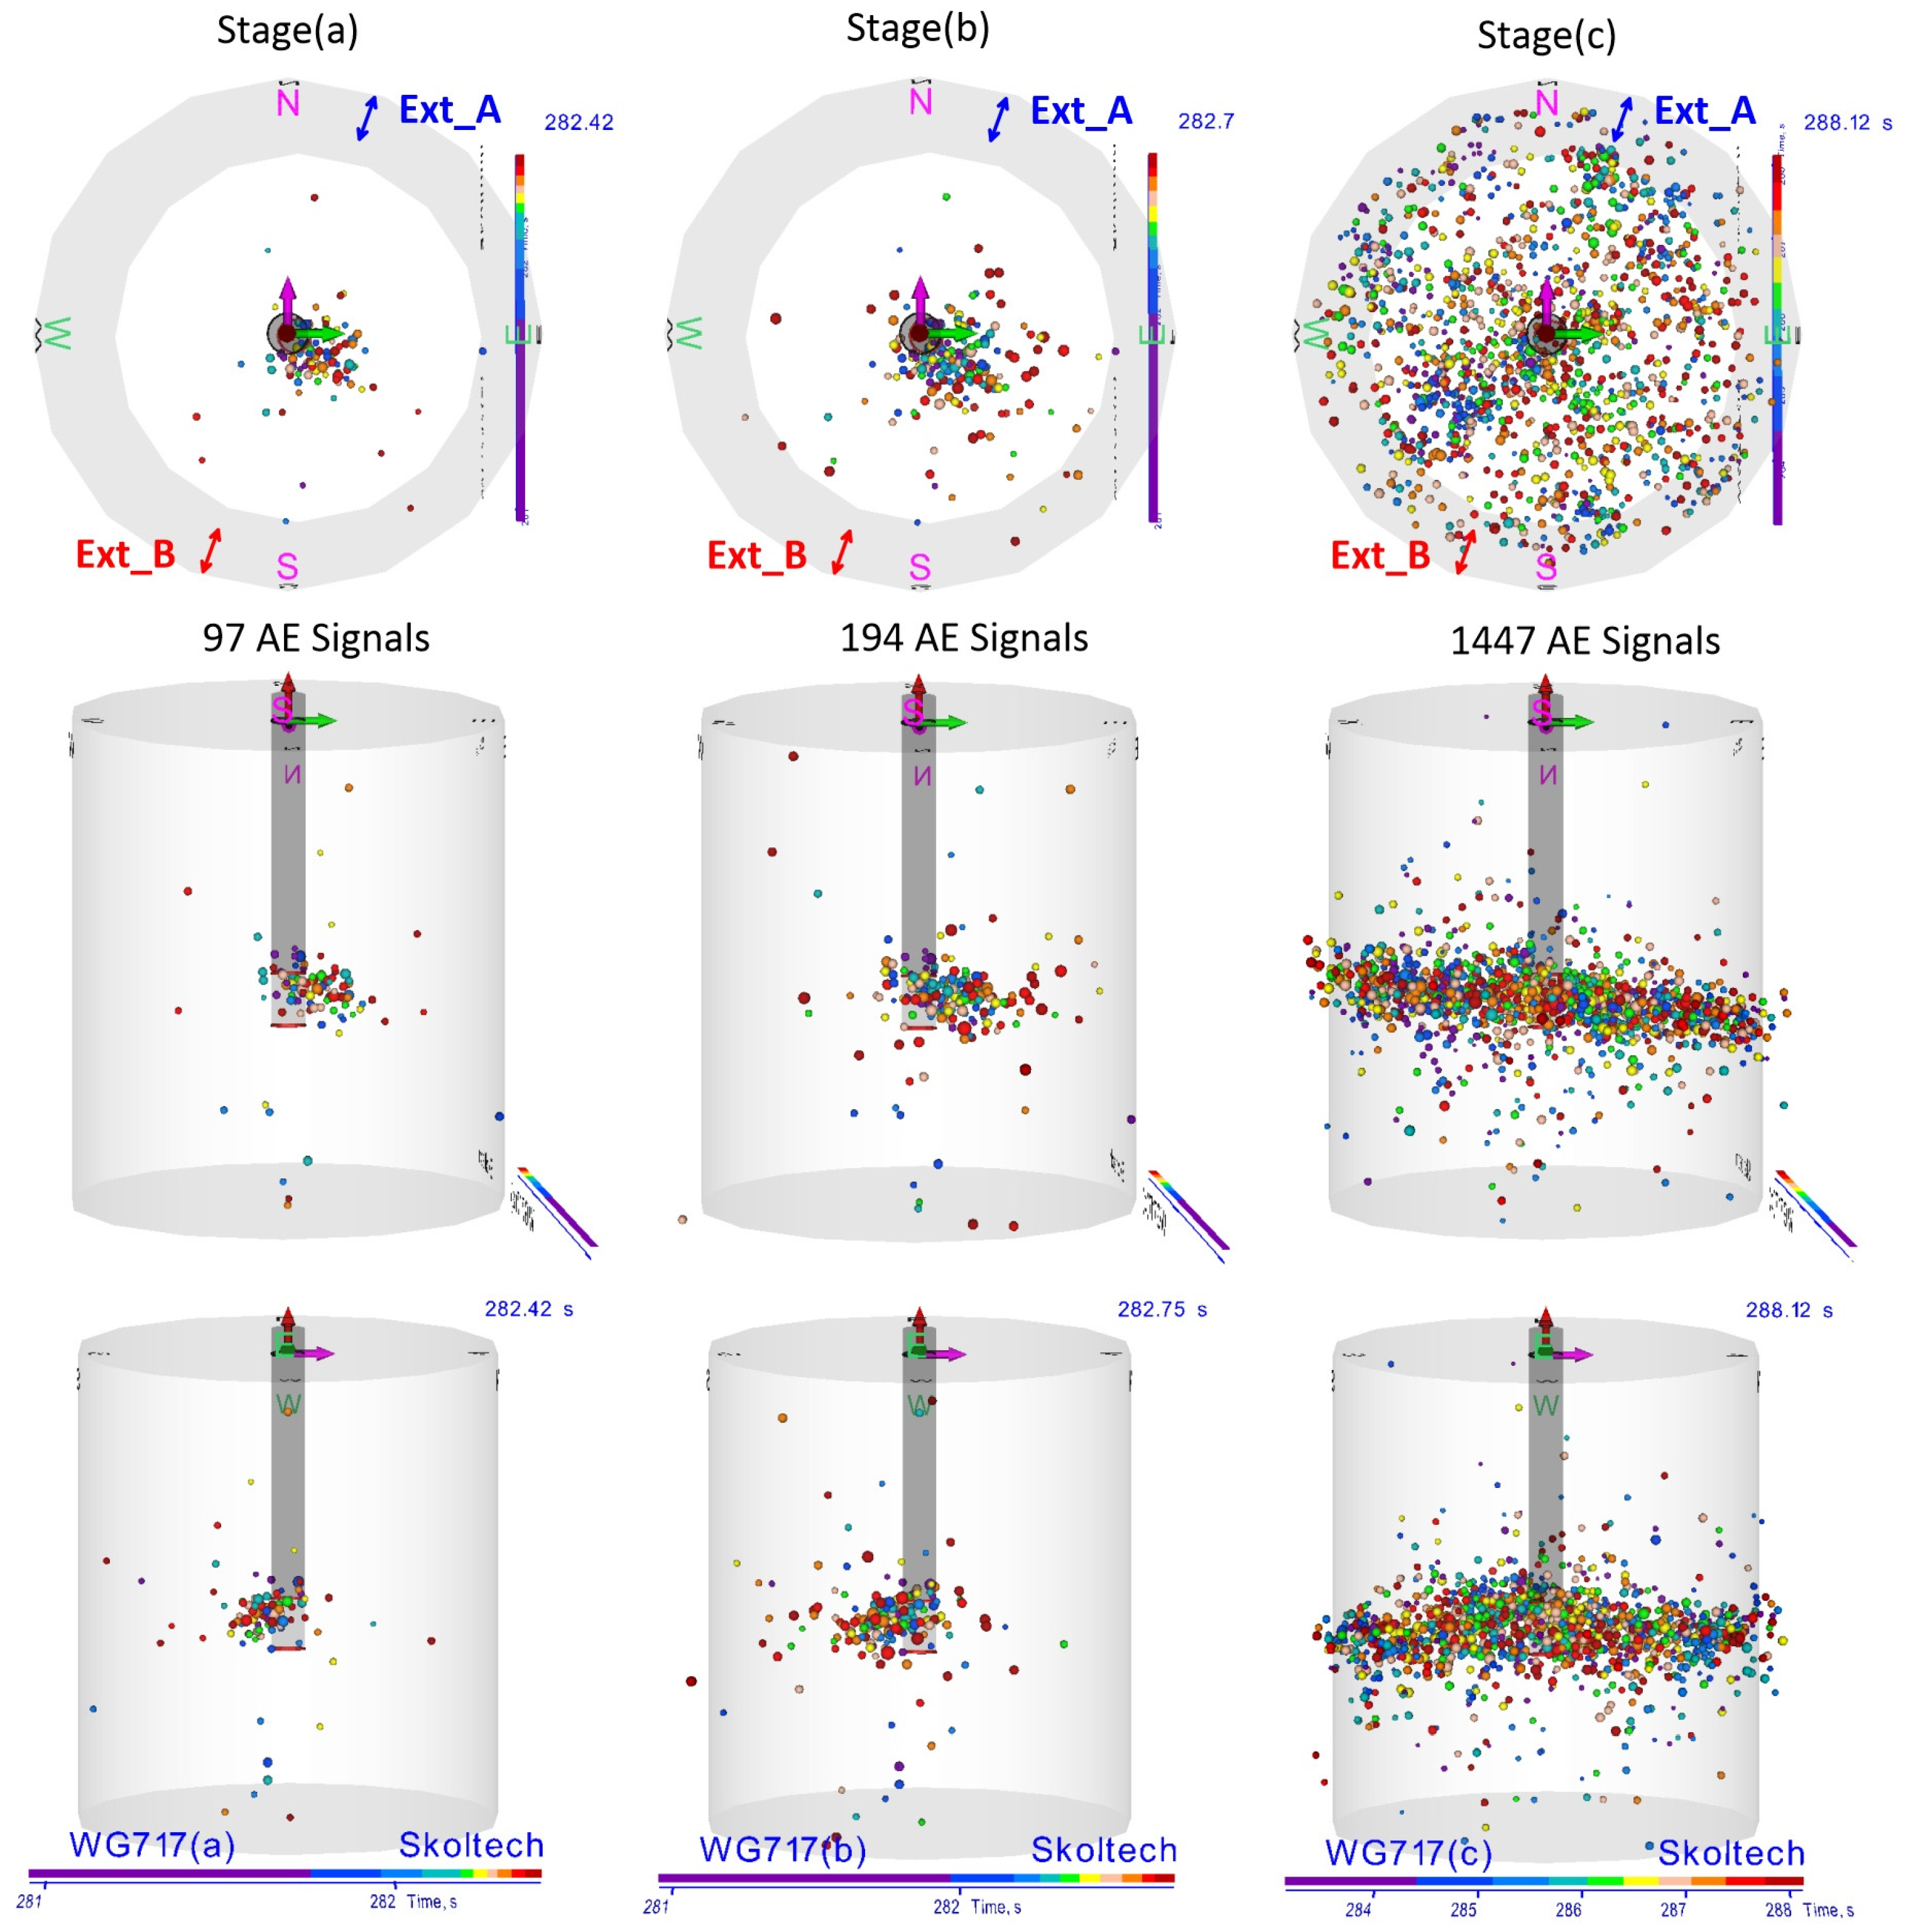
In the case of injection of PolyGel fluid (WG-717 sample), the hydraulic fracture behaved quite differently. The AE initiation had been detected more than 1 s earlier than the maximum pressure in the well was reached, and significantly earlier than in the WG-716 test. The acoustics in this experiment was much more active, namely 97 signals were recorded at the time of maximum pressure. Importantly, the moment of HF reaching the surface practically coincided with the maximum pressure. The AE signal cloud propagation velocity was approximately 40 mm/s. The fracture opening (about 2.2 µm), which was determined using the axial displacement sensor, is also significantly larger in case of PolyGel than in case of VES injection. These observations are in good agreement with the conceptual model proposed in [
42], indicating that PolyGel fluid composition behaves like a higher viscosity fluid in comparison with VES fluid, causing slower propagation of HF with a larger aperture. Due to the small opening of the fracture tip, PolyGel fluid did not completely fill in the formed crack (the volumes of different fluids recorded at the moments of maximum fluid pressures are presented in
Table 5). Analysis of experimental results led to the assumption that in the case of PolyGel injection, at first the dry microcracks were formed (
Figure 12, green dashed vertical line), and approximately 1 s later, fluid started penetrating them (
Figure 12, blue dashed vertical line). In case of VES fluid injection, the appearance of new cracks and their filling with the fluid happened almost simultaneously (
Figure 9).
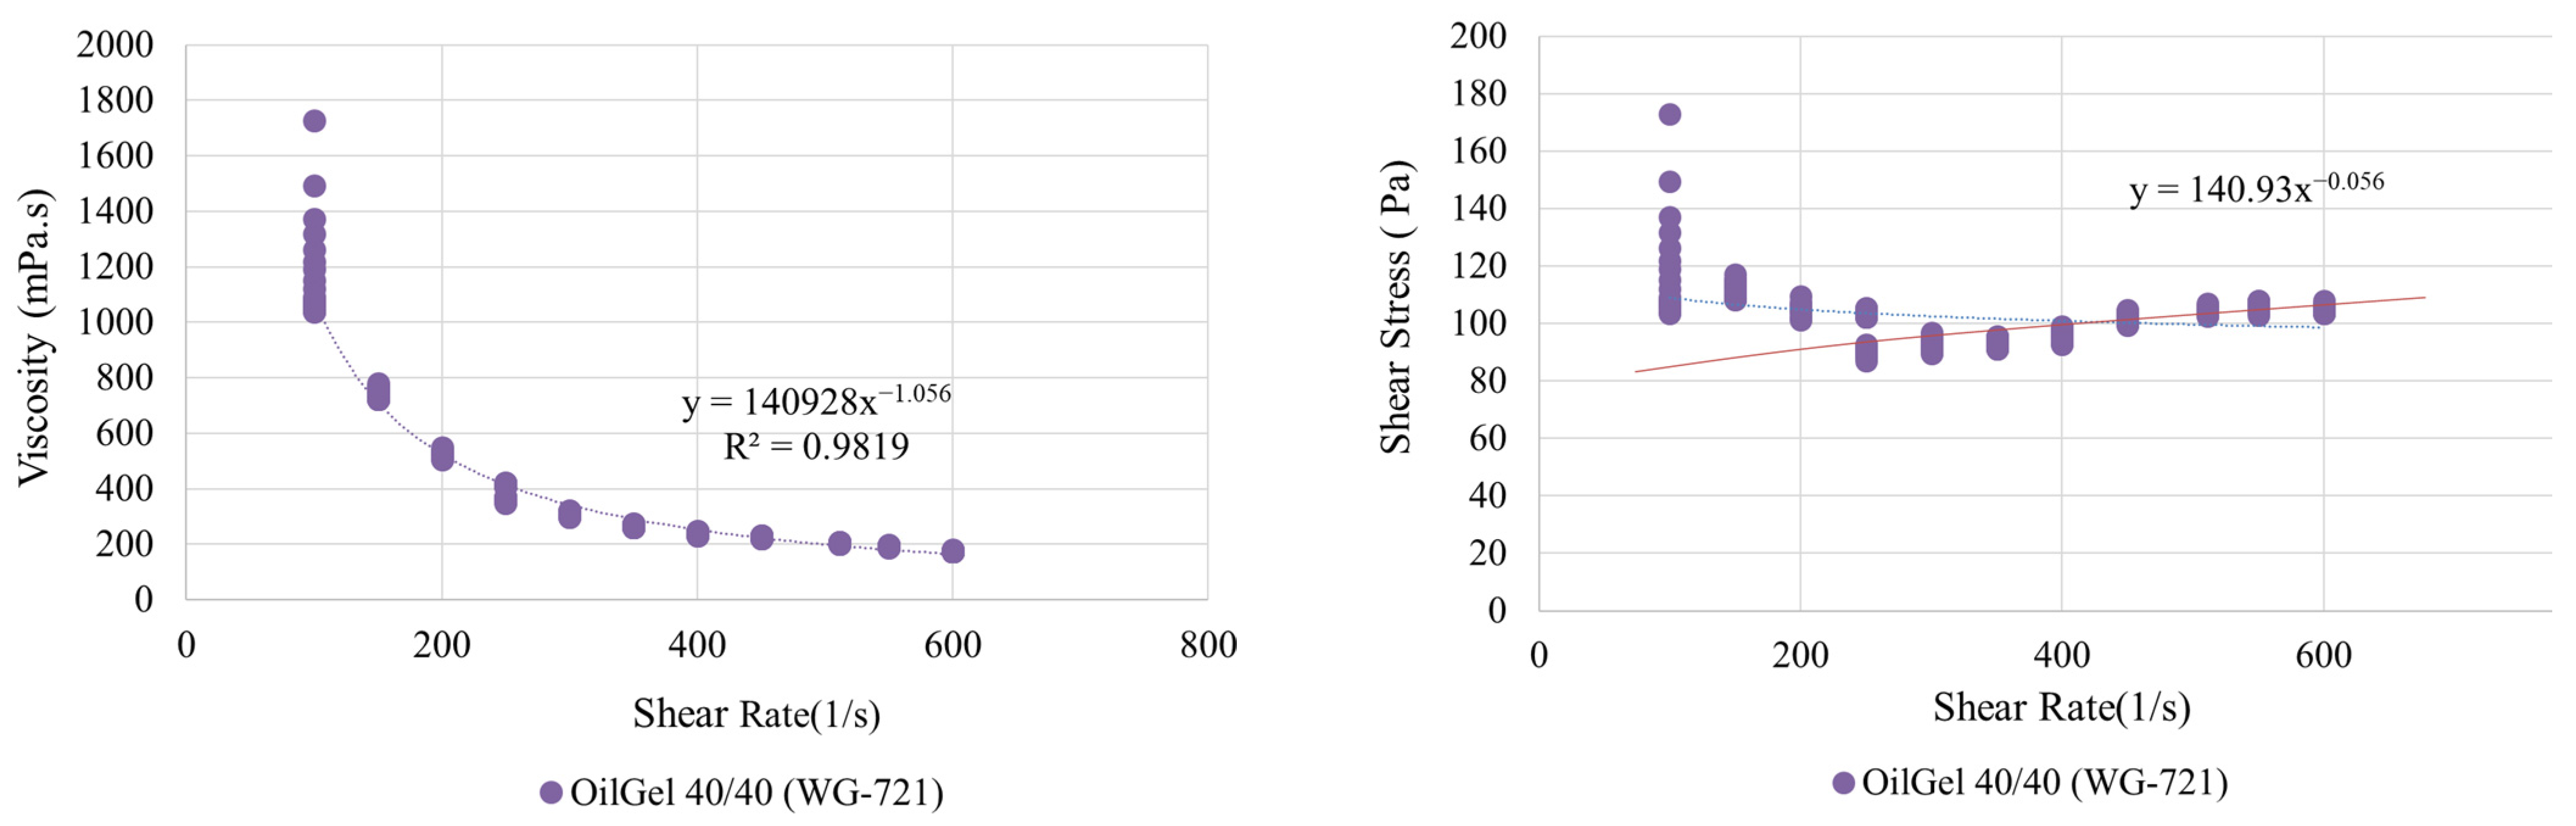
The comparison of experimental results using the injection of diesel-fuel-based fluids with different viscosities (114 cP and 1728 cP) also shows a significant variation. The fracturing agent was chosen to be of the same components with different concentrations in order to gain notable differences in fluids viscosity.
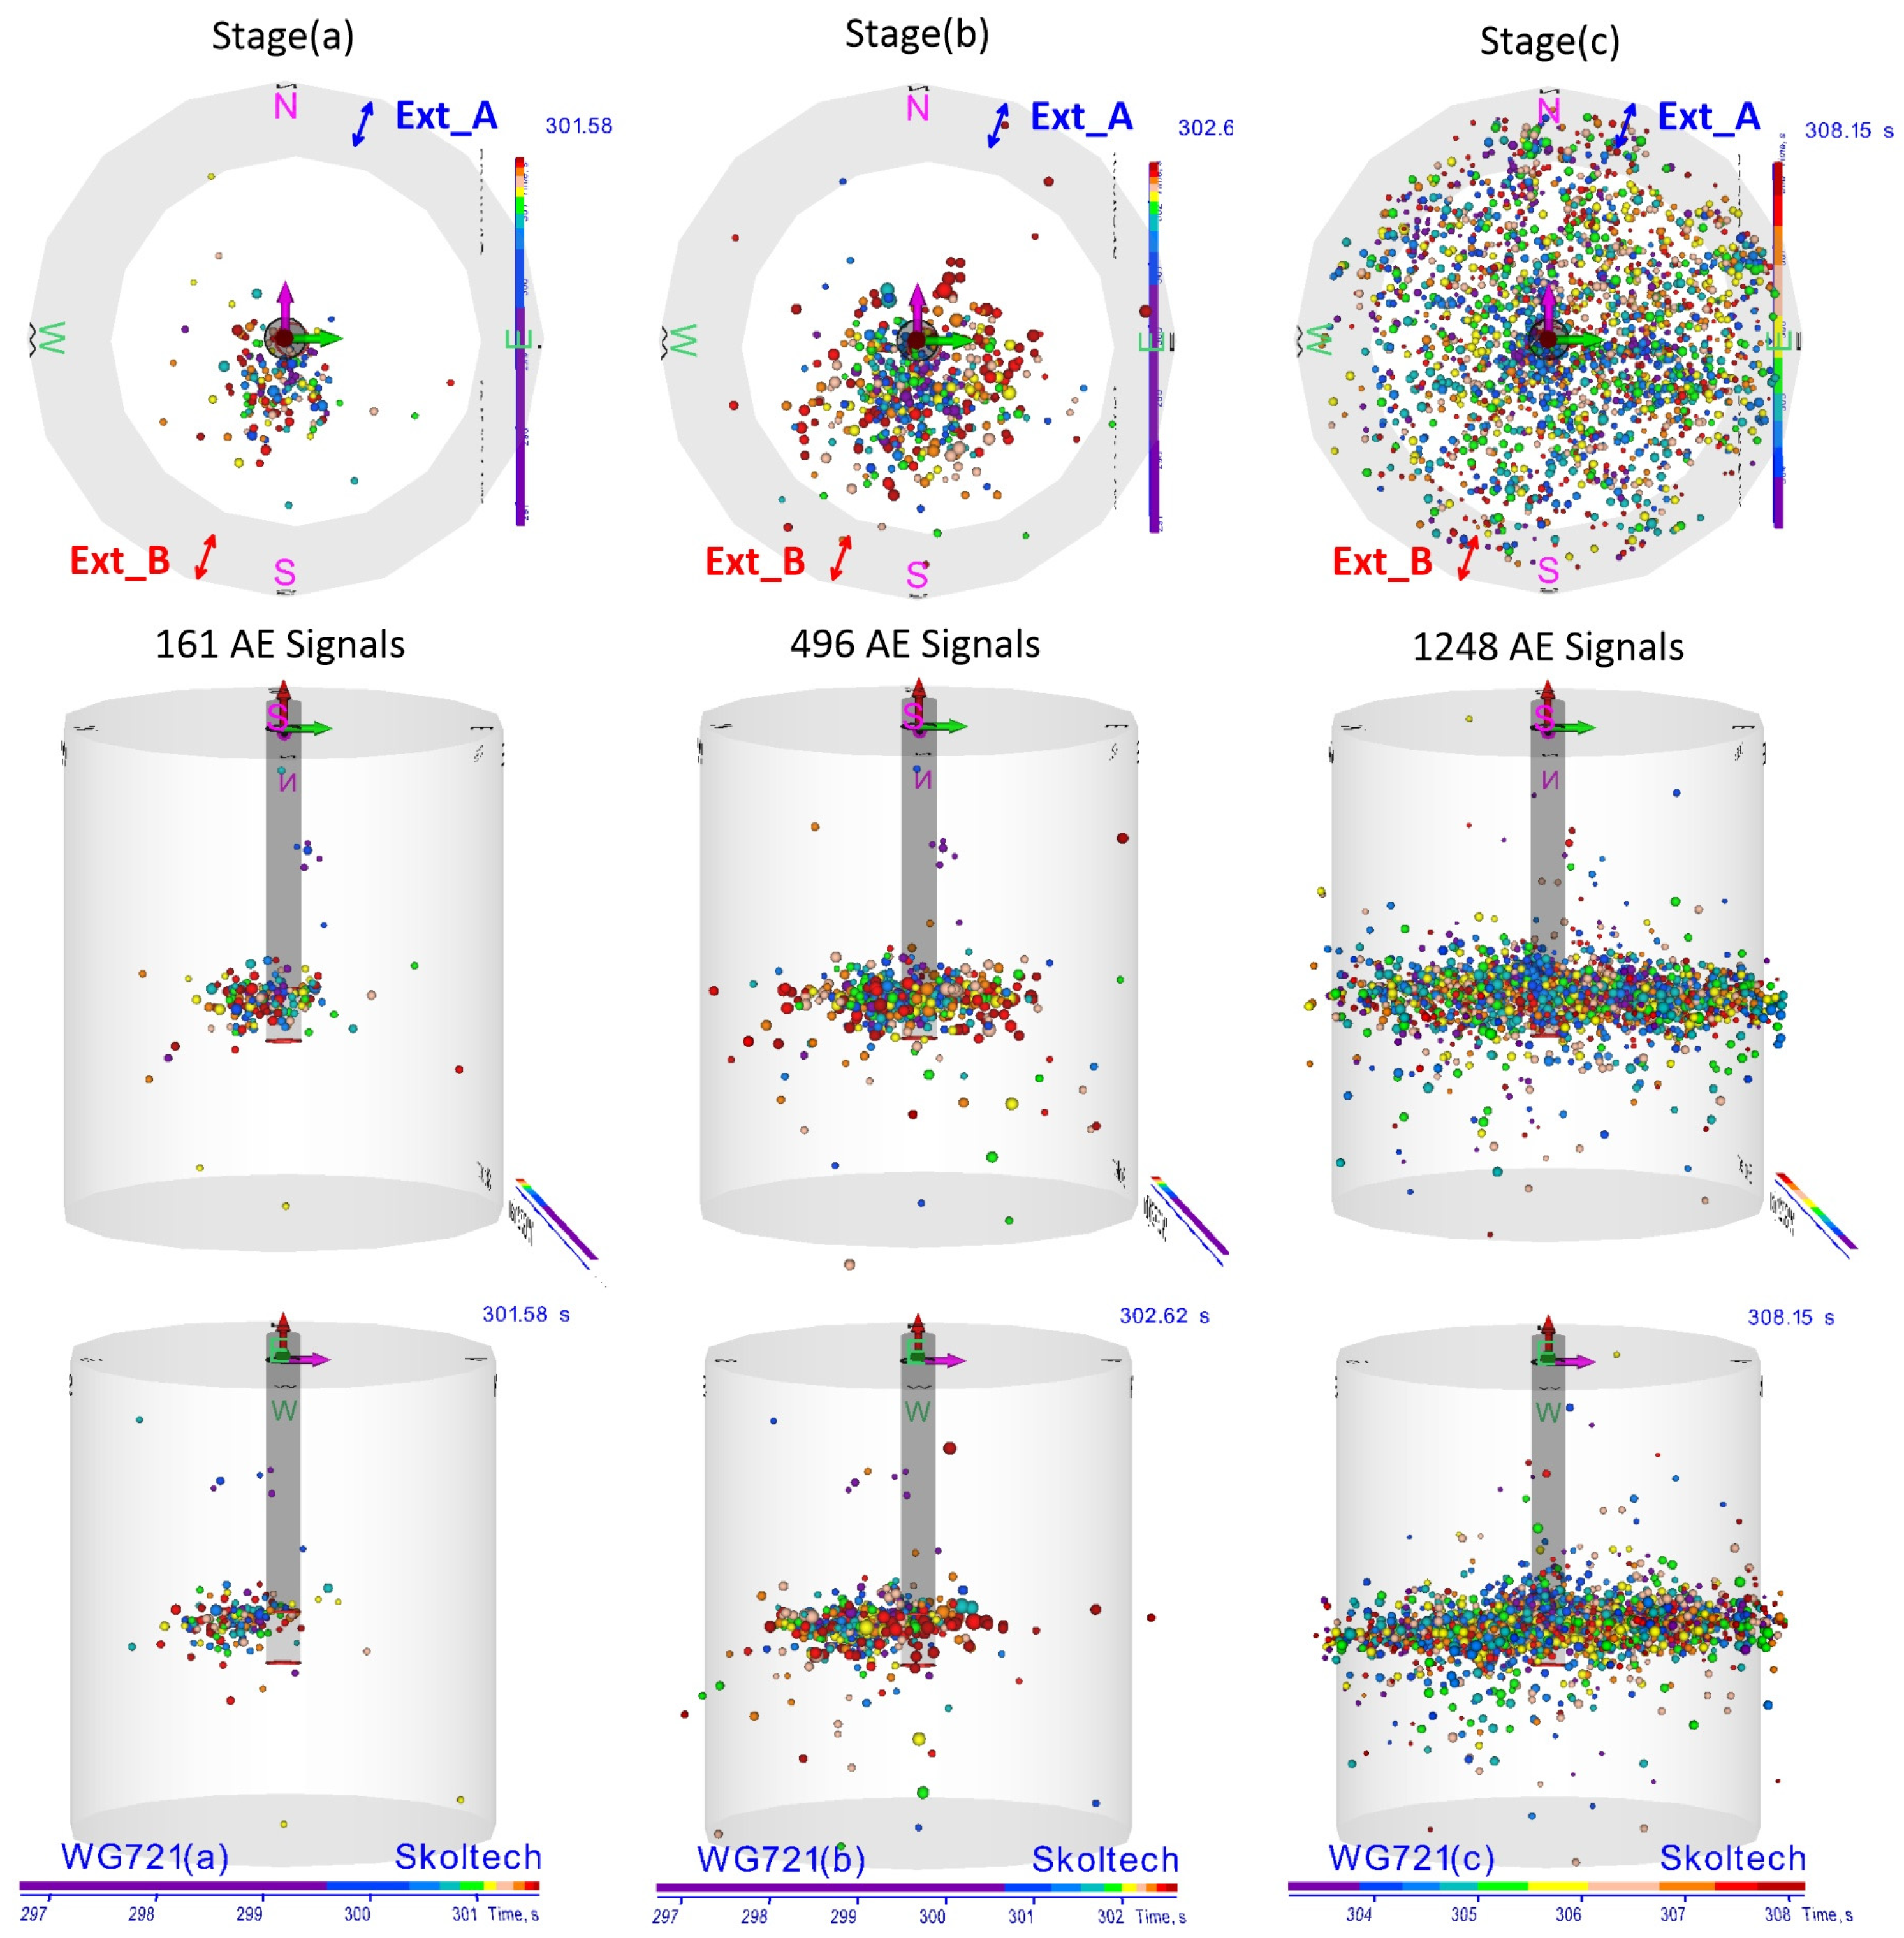
For the high viscous oil-based hydraulic fracturing fluid (sample WG-721) we got a 3.5 s time interval from the moment of AE initiation to the point of maximum pressure (39.9 MPa). The fracture opening during this time was 4 µm (according to the values measured by extensometer B,
Table 5). However, filling the crack with high viscous fluid took only 1 s (
Figure 14). Therefore, there is an assumption that for 2.5 s of the experiment WG-721, a dry crack slowly grew (the propagation velocity of localized events was 15 mm/s) and reached the surface before the breakdown moment. Based on these facts, it can be assumed that there was a gap between the position of a fracture tip and the front of OilGel 40/40, which was unable to fill in all formed microcracks due to high viscosity and poor mobility of the fluid.
In the second experiment (sample WG-722) with the low viscosity oil-based hydraulic fracturing fluid, the AE initiation was registered 1.5 s before the breakdown (39.23 MPa). The opening of the formed fracture at the time of the pressure peak was only 0.9 µm (according to the values measured by extensometer B,
Table 5). The filling of the fracture with the fluid took 0.6 s, moreover, the fluid volume injected into the fracture was insignificant. Despite the fact that the time from the crack initiation to the failure was much less than in the previous experiment with the higher viscosity fluid, the lower-viscosity fluid spread and filled the fracture, thereby resulting in its growth at the rate of 20 mm/s (
Table 5).
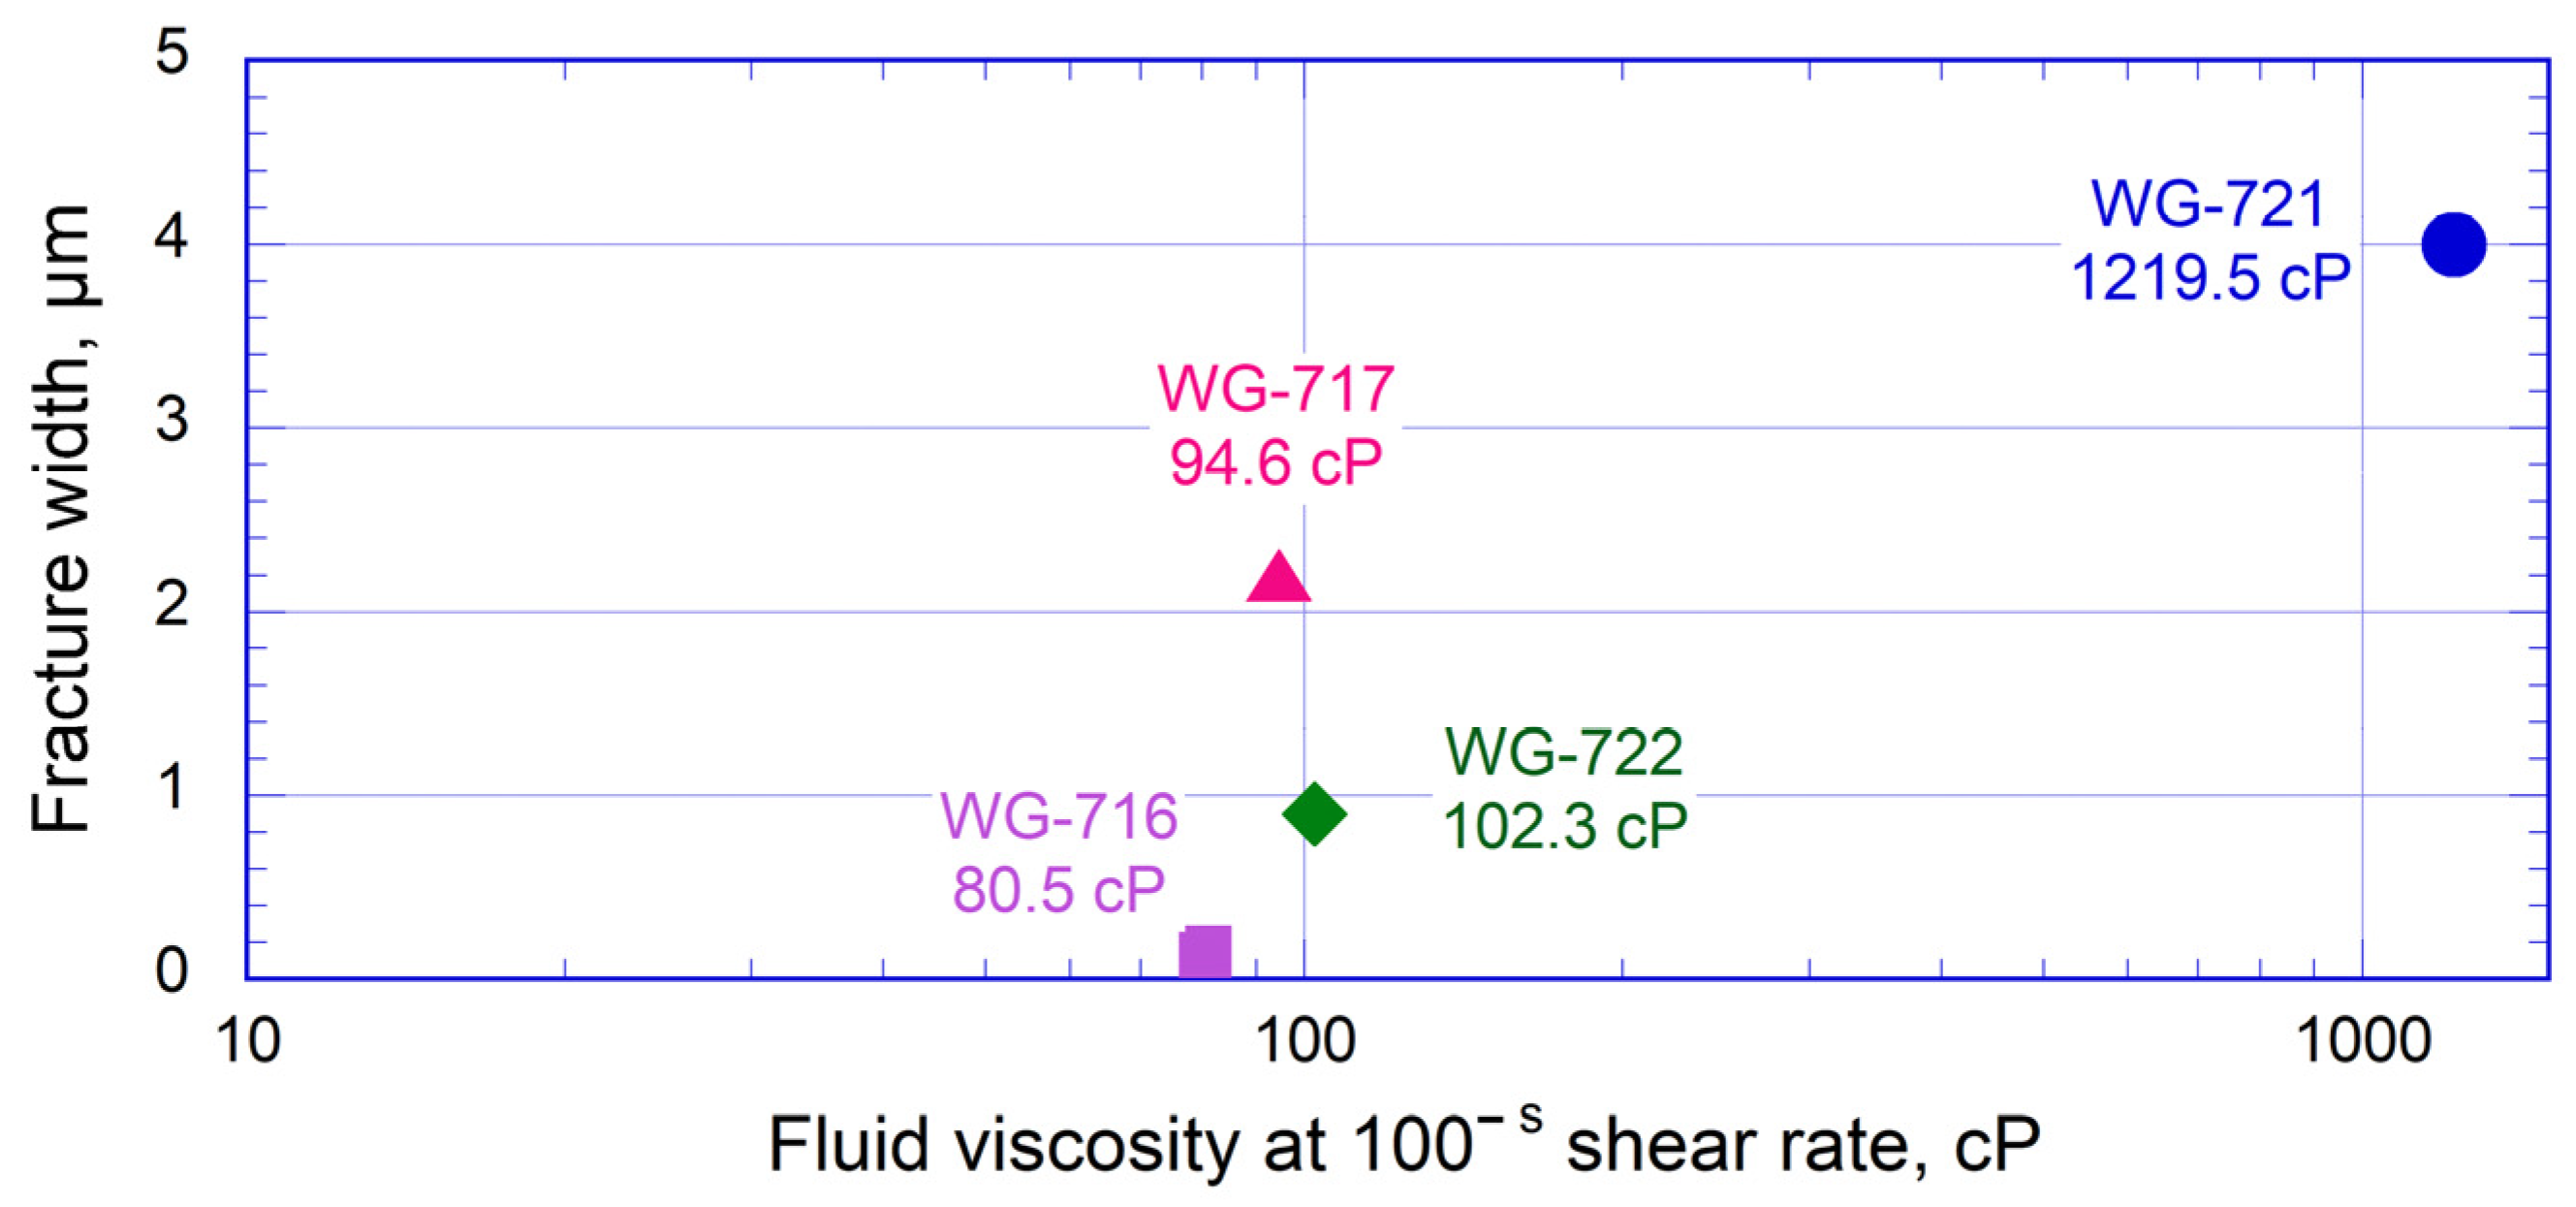
In our study, we demonstrated that the volume of the fluid entering hydraulic fracture depends on the measured fracture width (aperture) and this relationship could be associated with the fluid viscosity (
Figure 19). These results are in a good agreement with Ref. [
42], indicating a larger HF aperture with higher fluid viscosity. PolyGel (WG-717) demonstrates the behavior of a high viscosity fluid.
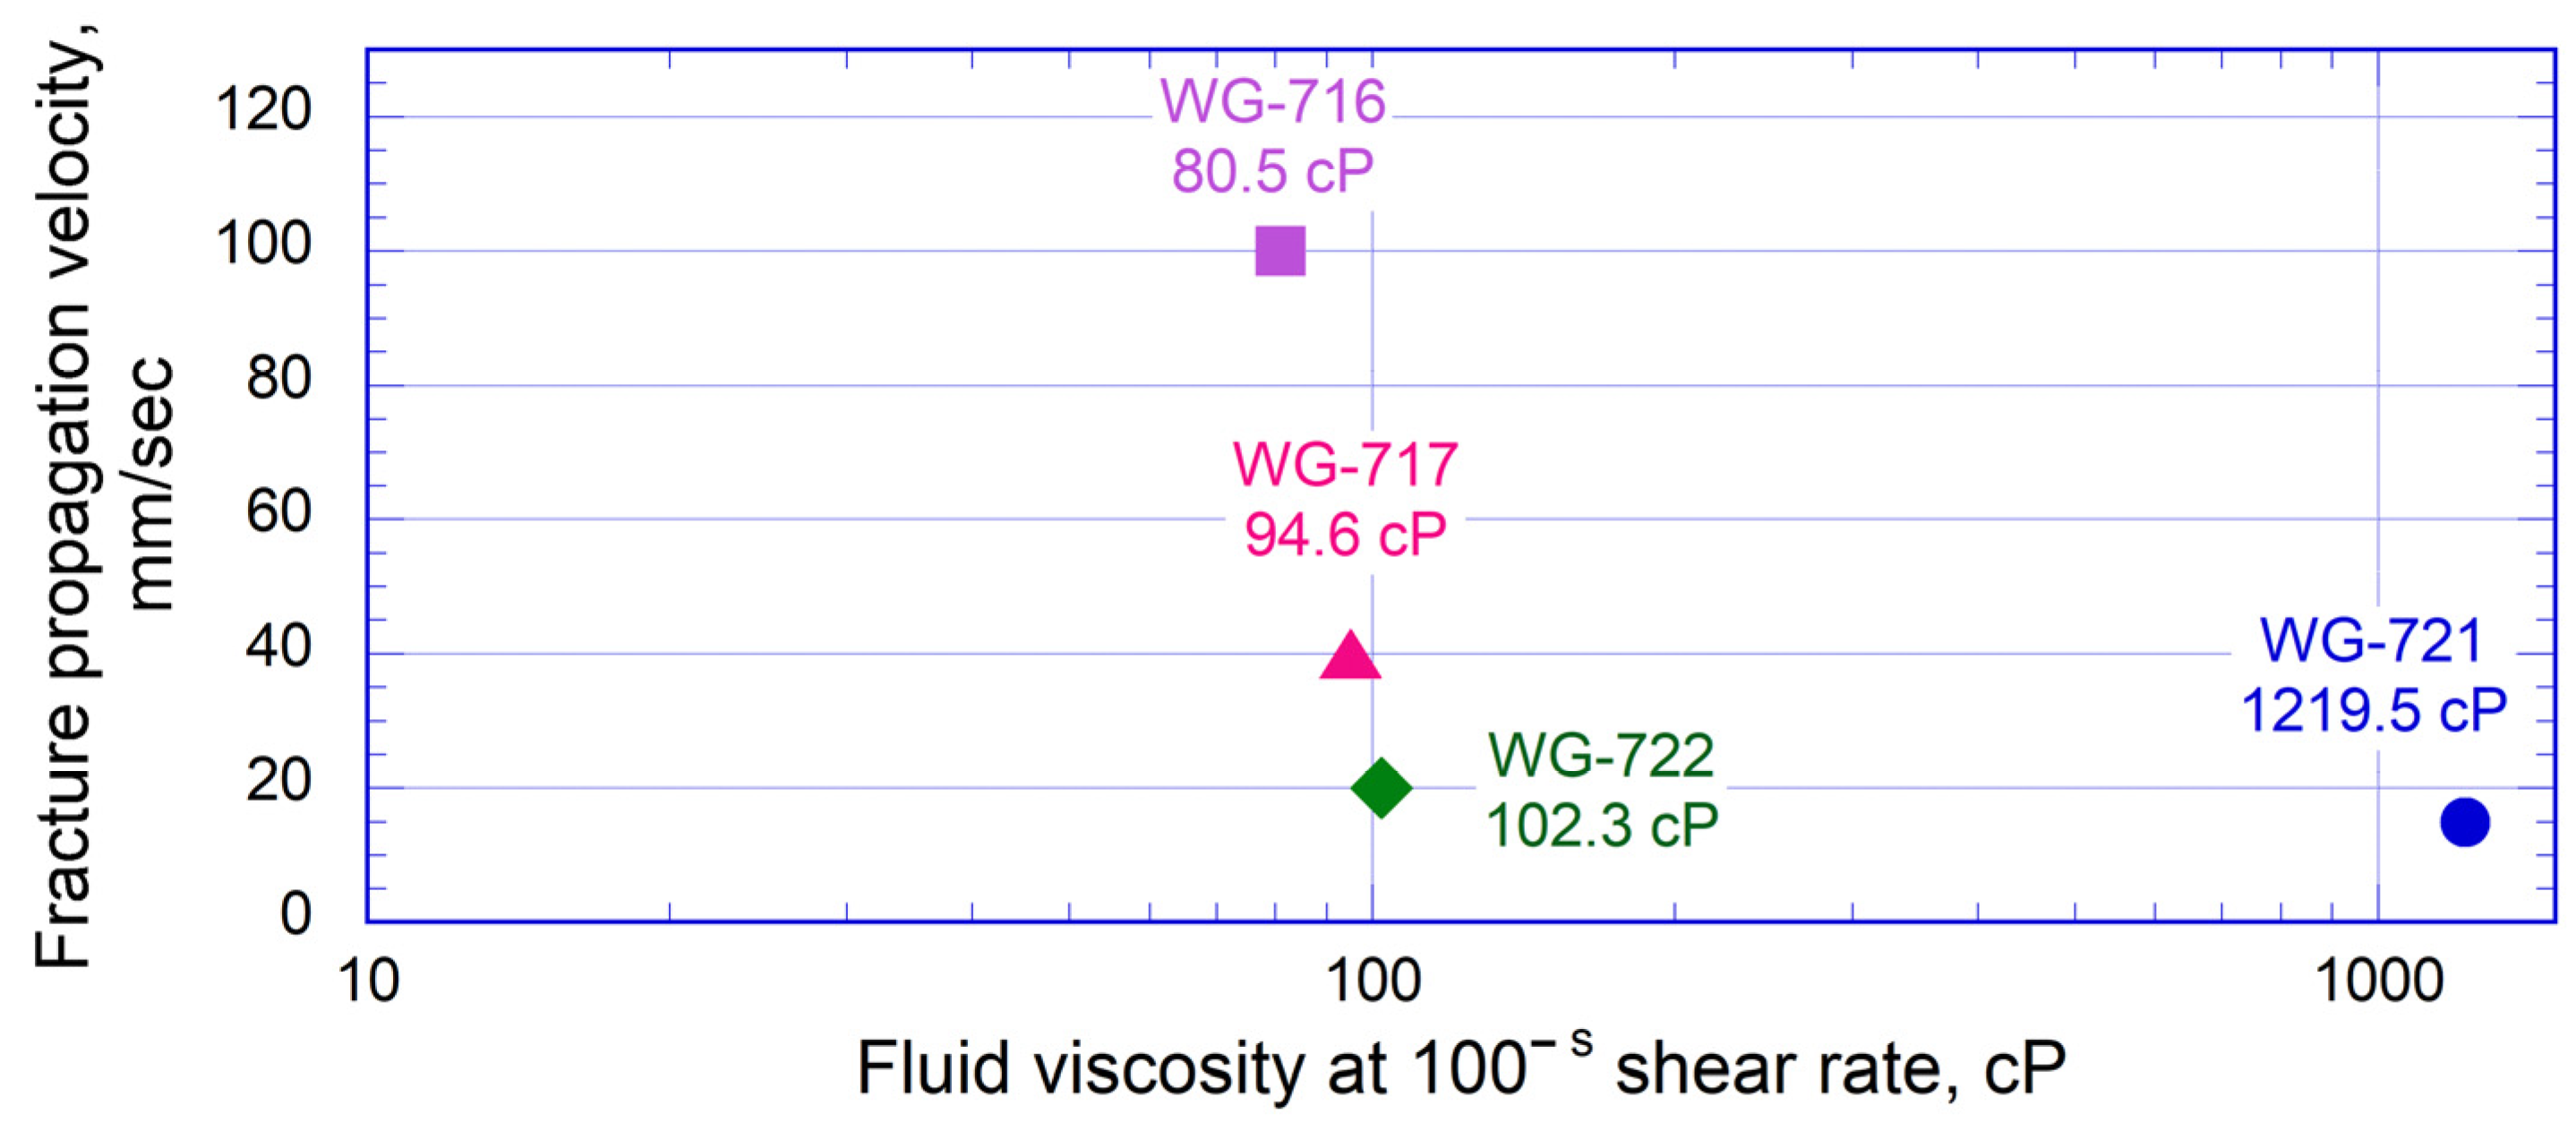
In addition, the dynamics of HF propagation were investigated. We have found that the HF propagation velocity is highly dependent on the injected fluid viscosity.
Figure 20 indicates that injection of lower viscosity fluid induces HF propagation with a higher speed. It can be explained by the high mobility of the low-viscous fracturing fluids, and their ability to easily fill in the microcracks in the fracture process zone. The relationship obtained in the laboratory experiments may be considered for the HF modeling in the field conditions, potentially increasing the reliability of the modelling.
Direct measurements of the HF opening and tortuosity of HF surfaces have significant difficulties in the field. However, they are the key parameters for choosing the optimal proppant size, providing successful proppant delivery into the HF. We investigated the relationship between the formed fracture surface parameters and the viscosity of the fracturing fluid.
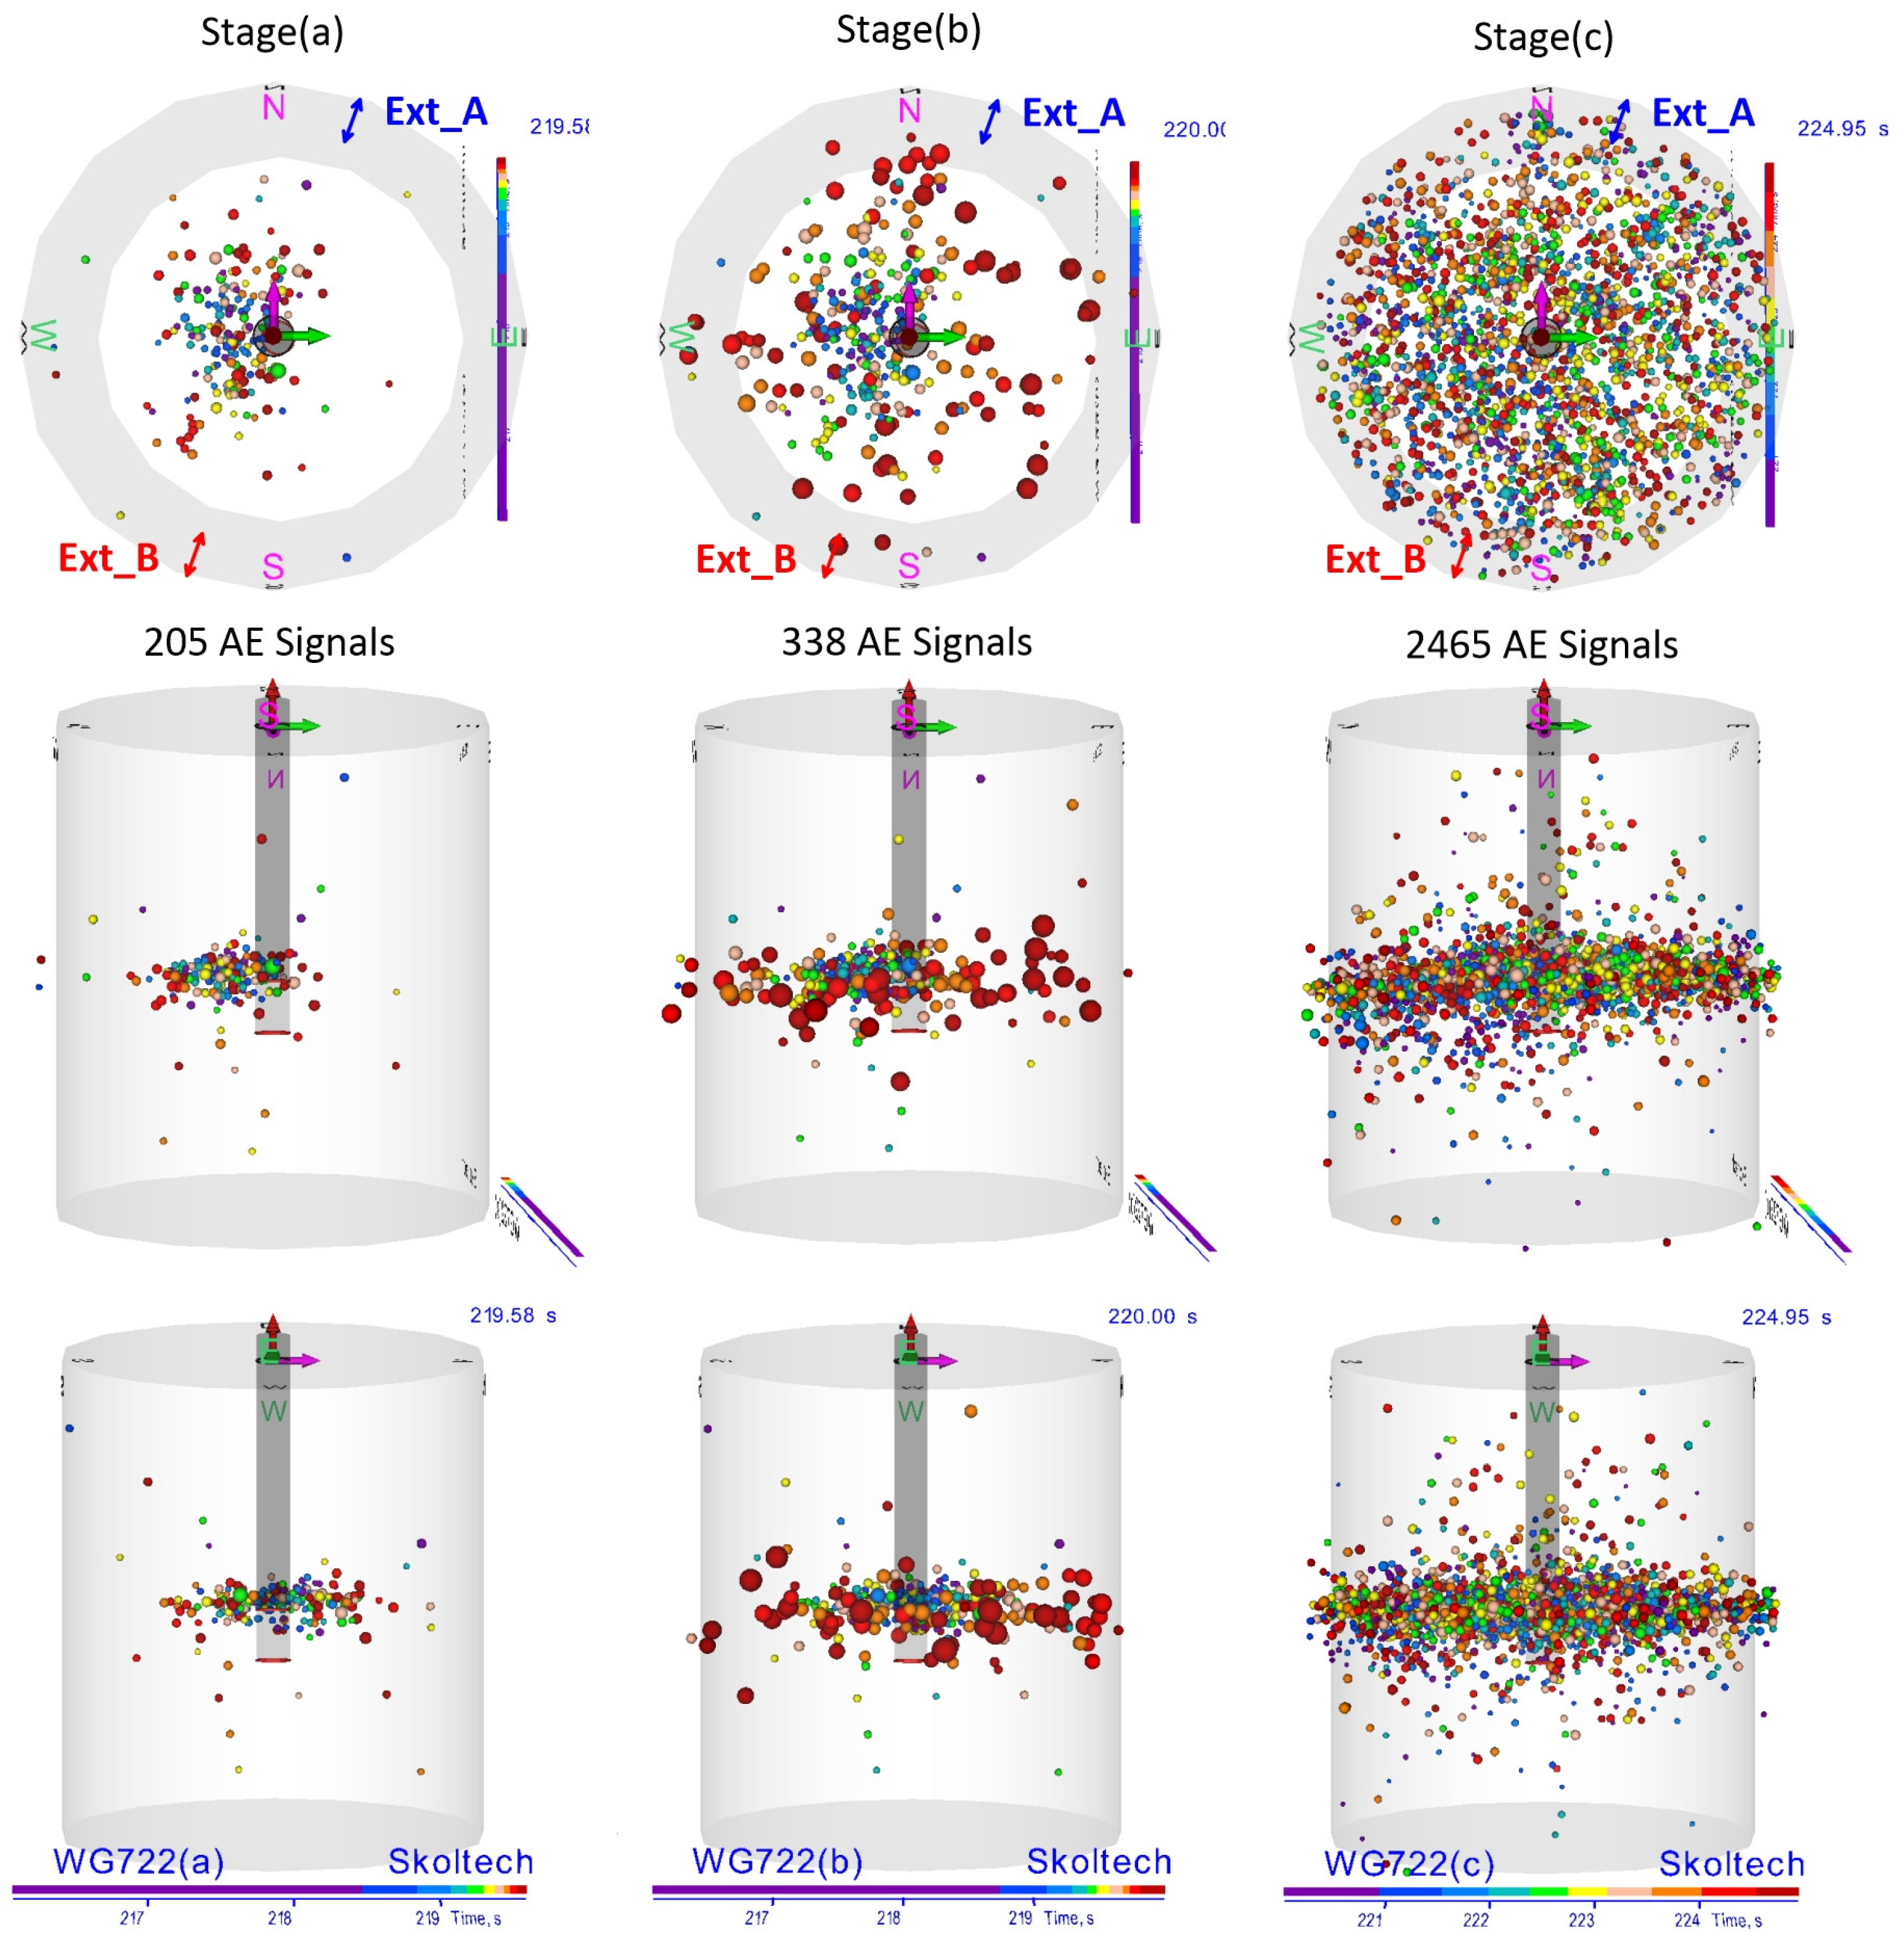
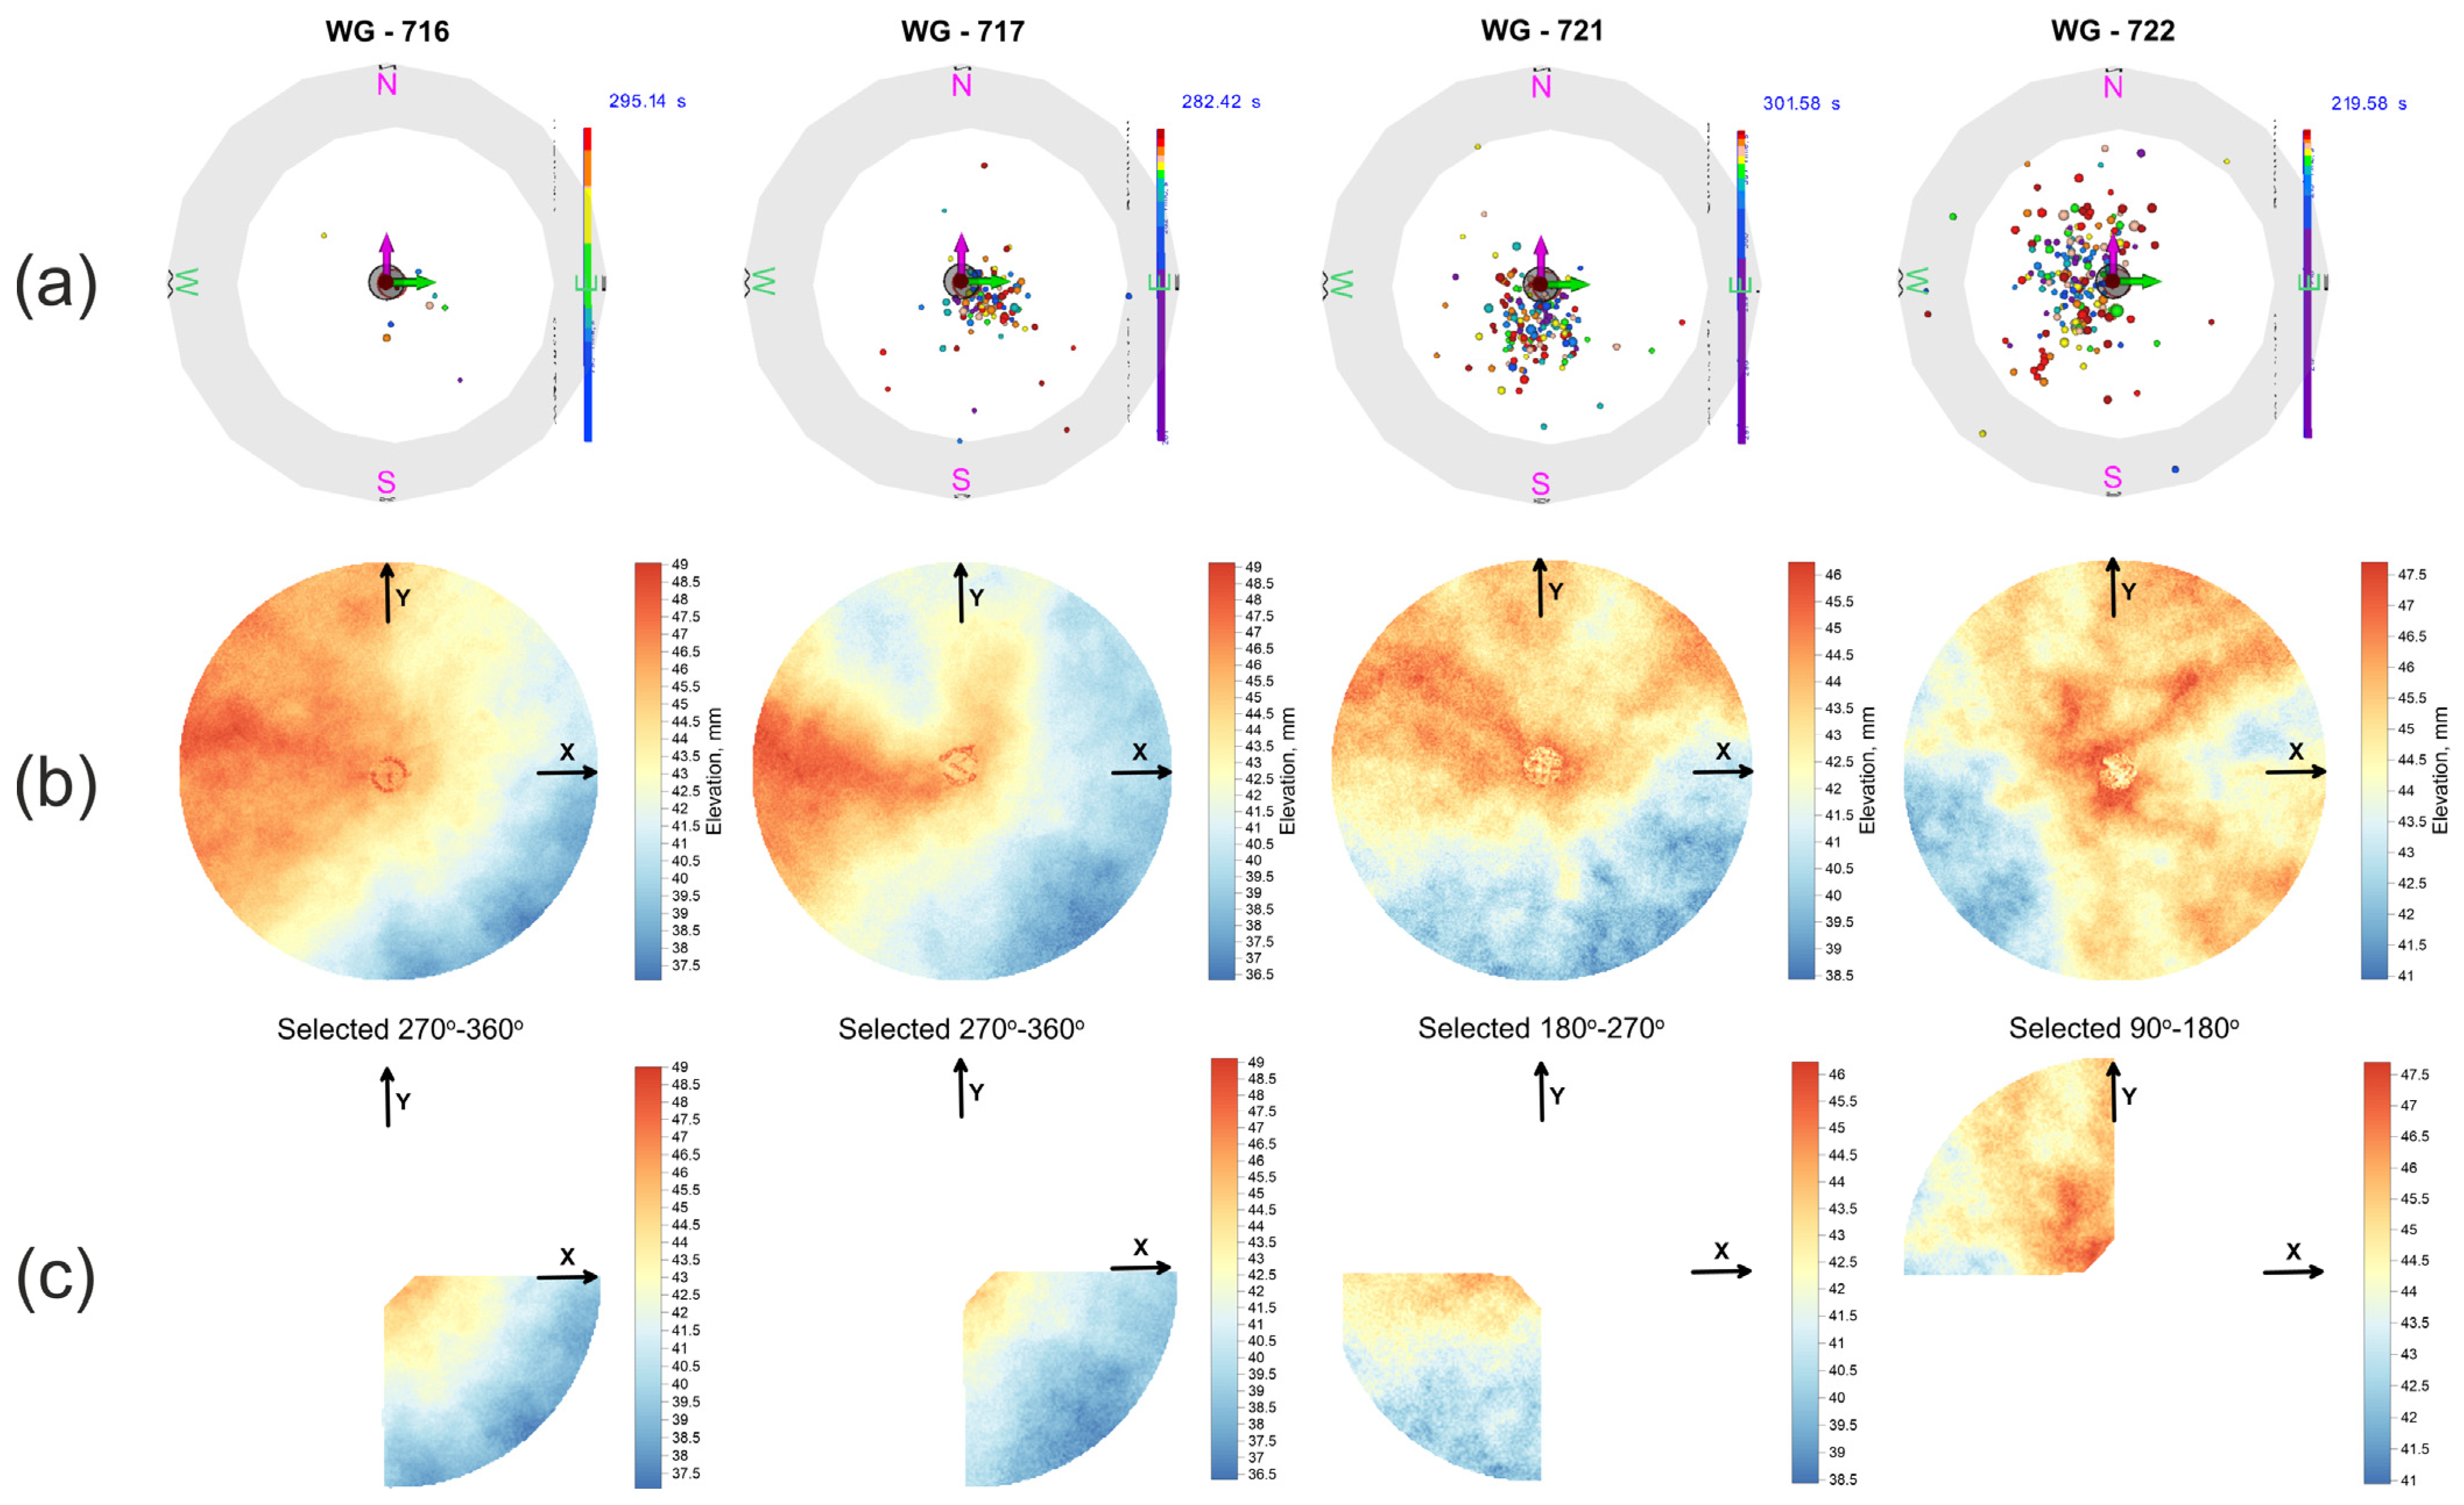
In our study, X-ray tomographic scanning of the fractured samples was performed, allowing us to determine the 3D shape of the fracture surface geometry with the accuracy of 60 µm. The upper row of plots in
Figure 21 shows the top-view of AE signals localized during the initial stage of HF propagation, whereas the middle row shows 2D maps of fracture surface topography, plotted on the basis of X-ray analysis of fractured samples. We suppose that after the moment when the HF approached the cylindrical surface of the sample, the fluid should be spreading along the cylindrical surface of the sample below the impermeable jacket, and, most likely, it can change the stress distribution within the sample, influencing the shape of the created fracture. Therefore, we decided to analyze the shape of HF created only before the exit of the HF to the cylindrical surface of the rock, or during the initial stage of HF propagation towards the surface only. The pattern of the HF surface created during the initial stage of HF propagation was estimated on the basis of AE localization presented in
Figure 21, the upper row, and the corresponding sector of the HF surface was selected for the roughness analysis, as the lower row of
Figure 21 shows.
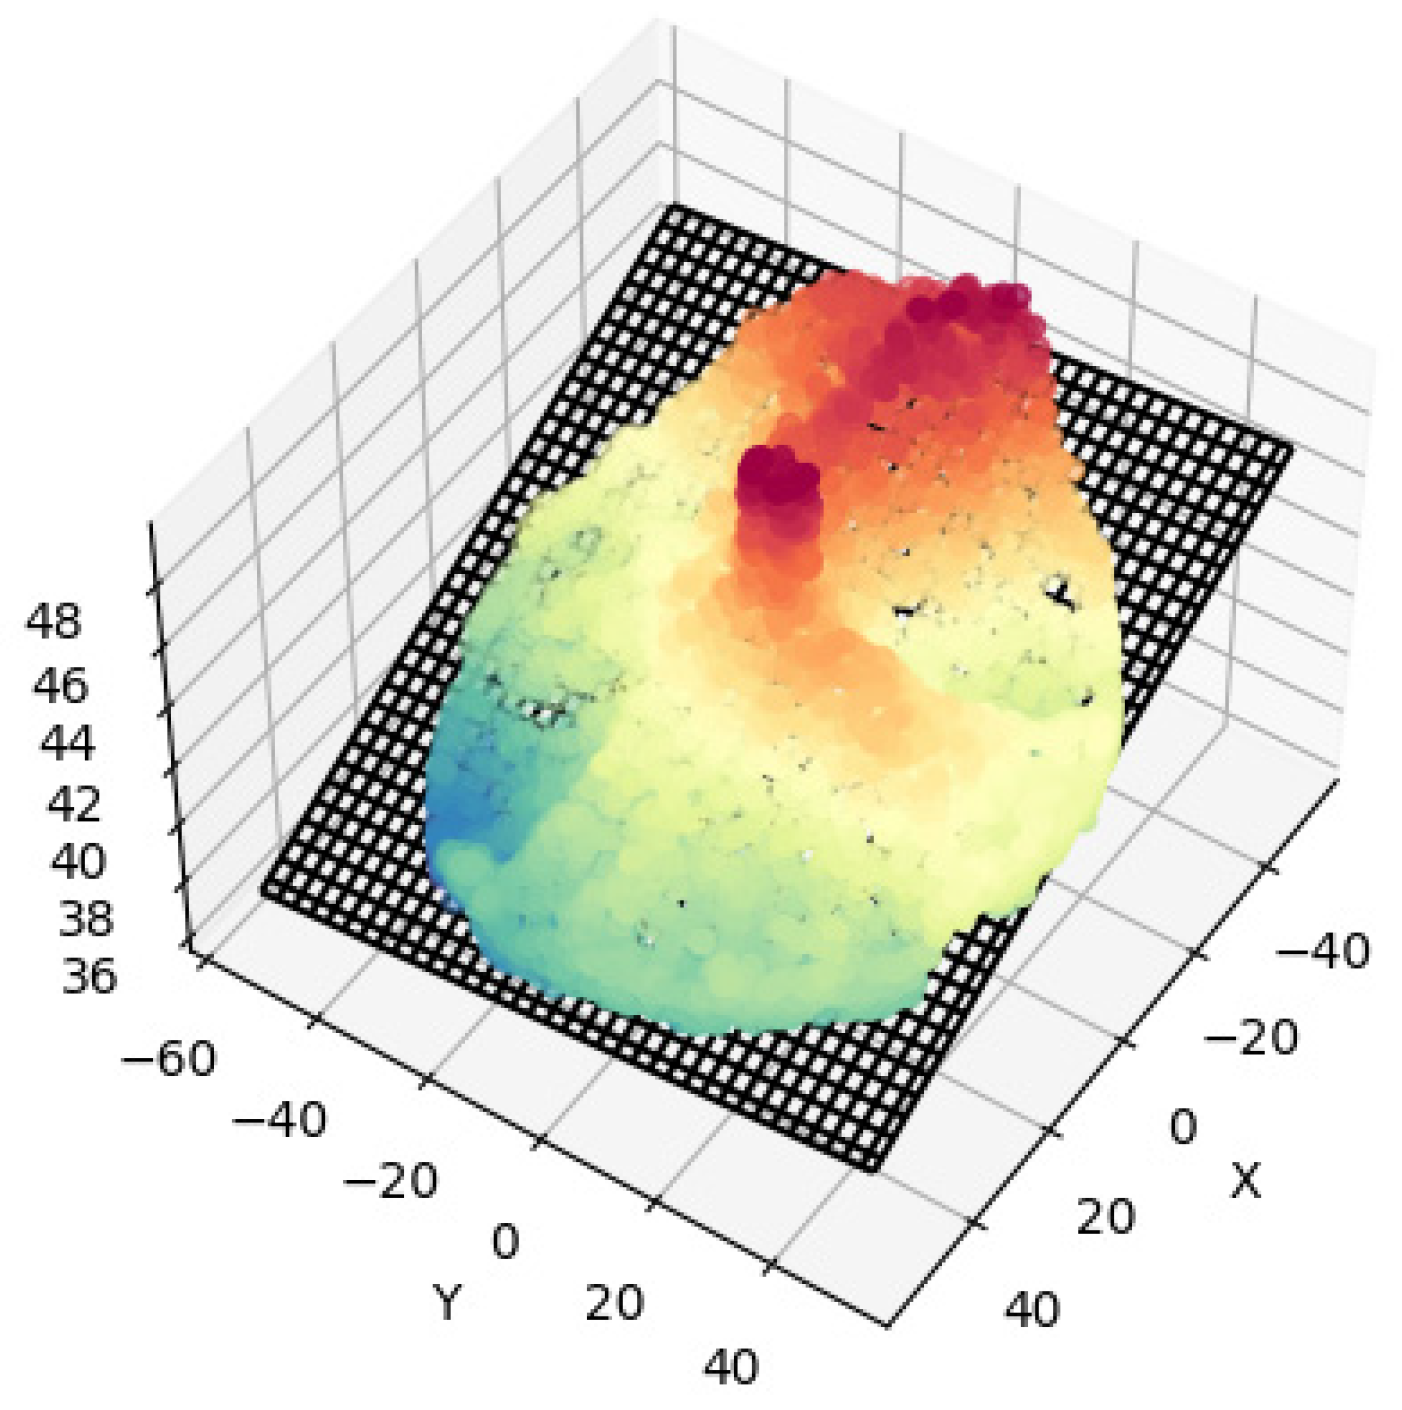
We define the rough fracture surface as an assembly of elements with various asperity heights, slope angles, aspects, and statistical values [
43]. We take the sector file (xyz), approximate it with the best-fit plane, and calculate the distance of each element to this best-fit plane (
Figure 22). The detailed technique for obtaining a best-fit plane of the 3D point fracture surface is represented in [
44].
For this part of the study, we applied statistical expressions directly to the scanned 3D surface data (Equations (1)–(3)). The peak asperity height
, the average roughness
, and the root-mean-square roughness
, where
is the height of the
ith point and
—the mean height of the elevation plane, which is discretized by n points, were obtained (
Table 6). The statistical parameters provide a direct comparison between samples, aiding to distinguish the different surface topographies quantitatively [
45].
The tortuosity is defined as the total fracture length along a pathway divided by the direct length of the two ends in the reference area. In order to measure the total fracture length, the subset of points lying along the steepest line was extracted, and then the sum of 3D distances between adjacent points was obtained. To get the tortuosity value, this sum was divided by the sum of 2D distances between adjacent points of the same subset (
Table 6).
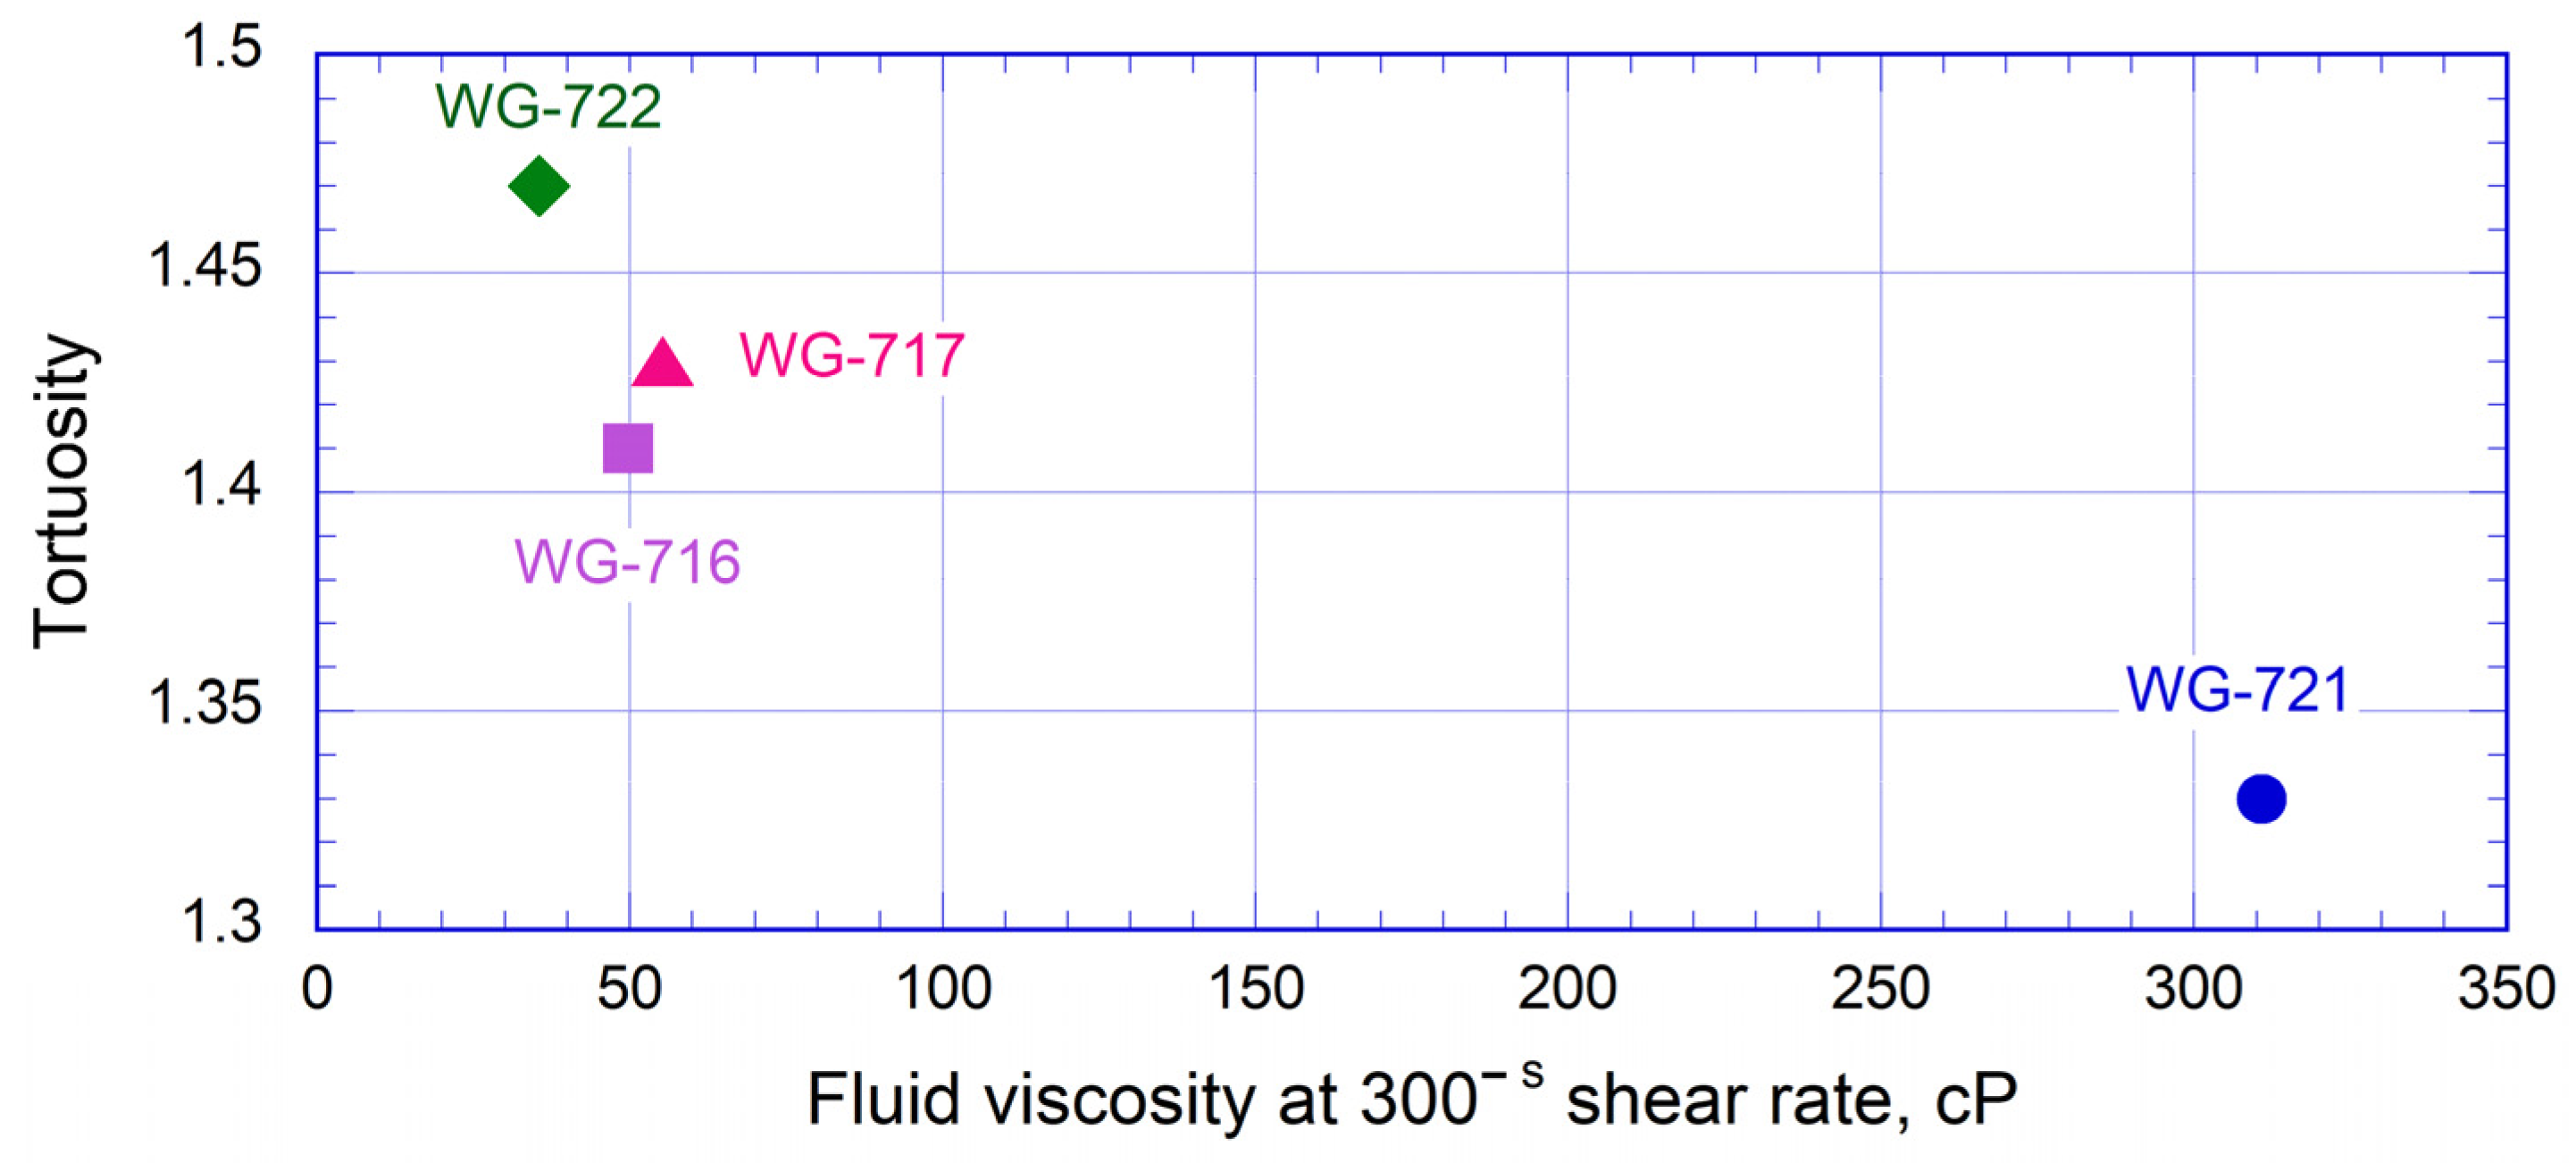
We have found that the shape of the created fracture is dependent on the fracturing fluid viscosity. We observed that the fracture induced with the most viscous fluid had the least tortuous surface (
Figure 23). Consequently, the tortuosity decreased with the increase in fracturing fluid viscosity, which is in compliance with Refs. [
46,
47]. The fracture surface for the WG-722 sample that fractured with the least viscosity fluid has the highest tortuosity magnitude (1.47) and, as a consequence, the most complicated shape of the surface. On the other hand, the fracture surface for the WG-721 specimen has the least tortuosity value (1.33). It can be elucidated by the injection of a high viscosity fluid, creating a smoother surface in comparison with the lower viscosity fluid injection.
The distributions of Probability Density Function versus the height of asperities above the fitted plane are presented in
Figure 24. It can be noticed that the Probability Density function can be characterized by the normal Gaussian distribution (best fit Gaussian). Thus, the calculated
Rrms roughness can be justified [
44] (
Figure 24).


 ,
, 


