Article

Selected Environmental Impact Indicators Assessment of Wind Energy in India Using a Life Cycle Assessment

1
Department of Applied Mechanics, Motilal Nehru National Institute of Technology Allahabad, Prayagraj 211004, Uttar Pradesh, India
2
Commonwealth Scientific and Industrial Research Organization (CSIRO) Energy, Private Bag 10, Clayton South, VIC 3169, Australia
*
Authors to whom correspondence should be addressed.
Energies 2022, 15(11), 3944; https://doi.org/10.3390/en15113944
Submission received: 18 April 2022 / Revised: 20 May 2022 / Accepted: 23 May 2022 / Published: 26 May 2022
(This article belongs to the Section A3: Wind, Wave and Tidal Energy)

Abstract

:
This study focuses on the life cycle assessment (LCA) of an onshore wind farm in India. The study is conducted on 10 Vestas 1.65 MW wind turbines situated in the Karnataka state of India. Following the ISO 14044 standard, SimaPro LCA software is used to model the process. The functional unit is chosen as 1 MWh sent out electricity. The results of the life cycle-based emissions of wind farm are compared with those of the coal power plant. The global warming potential is found to be 11.3 g CO2-eq/MWh for wind power, which is 98.8% lower than that for the coal power plant. A comparison of data available in SimaPro LCA software was carried out with data in GaBi software. There is a small difference between the two databases. This may be due to different boundary and inclusion of input items. Steel, aluminium, and concrete contributed 86%, 84%, 84% and 85% of total CO2, NOx, SO2 and PM2.5 emissions, respectively. Recycling the materials of a wind turbine at the end of its life can reduce the environmental impact. Higher capacity factors can increase the electricity generation with reduced environmental impact. A 22% increase in capacity factor can reduce environmental impact by 19%. In addition, the increase in the life of wind turbines reduces the environmental impact, as a wind turbine only has a few moving parts and requires minimum regular maintenance.

1. Introduction

India is a developing country and the second largest in terms of population with an average growth rate of 1.02% in 2019 [1]. Increasing population and a growing economy mean that a higher amount of electricity is required. The development of new electricity supply sources would be essential for the development of the economy. LCA could be an impactful tool for assisting with energy planning and strategy evaluation [2]. In 2019, the total electricity generated and consumed was 1372 TWh and 1181 kWh, respectively [3]. India, after China and the USA, is the third-largest producer of electricity in the world. Coal has the highest contribution of electricity production in India contributing over 75% of total generation [4]. Electricity generation from coal combustion emits contaminants such as COx, NOx, SOx and particular matter (PM) into air and water. This contributes to serious environmental and health problems [5], and a number of environmental issues [6]. One of the serious environmental problems is greenhouse gas (GHG) emissions from fossil fuels, especially from coal combustion. Few studies have analysed the environmental impact of coal power plant. Yin et al. [6] showed that CO2 emissions from the coal fired power plant total 99.28% compared to other pollutant emissions. The study employed analysis of different load factors and their effect on the CO2 emission. They found that CO2 emissions are 793.4 kg/MWh, 823.1 kg/MWh and 857.5 kg/MWh at load factor 75%, 50% and 40%, respectively. Odeh et al. [7] examined the LCA of coal power plants in the UK and found that CO2 emissions are 989.7 kg CO2/MWh with a high contribution of combustion (89%). Tang et al. [8] examines the LCA of a coal fired power plant with CCS technology. For the baseline case, the emissions total 890 kg CO2-eq/MWh, while including CCS reduces the CO2 emissions compared to the baseline case. CCS with pipeline transportation emits 240 kg CO2-eq/MWh and CCS with ship transportation emits 310 kg CO2-eq/MWh. Martinez et al. [9] and Yang et al. [10] proposed that overall impacts from wind power plants are slightly lower than those from the conventional power plant, coal and natural gas [11]. Thus, compared to nuclear, coal, and other fossil fuel plants, wind energy has a shorter energy payback time and fewer environmental impacts. Since environmental consequences of renewable energy sources are relatively small compared to fossil fuels, this industry is growing rapidly. Electricity generation from renewables is likely to increase to 31% in 2050 from 18% in 2018 [12]. India is making significant progress as part of the UN Sustainable Development Goals (SDG) to produce power at lower emission level. This requires a decline in the use of fossil fuel for electricity production. In 2019, India’s per capita emissions totalled 1.6 tonnes of CO2, which constituted 6.4% of the global CO2 emissions [13]. During COVID-19, the share of renewables in the energy mix increased by twofold compared to the share of coal in India [14]. Among different renewable energy technologies, wind and solar electricity generation have been increasing continuously from 2009 to 2018 [15]. India is the fourth largest global wind energy market. The geographic features and weather conditions make India’s wind power system different from other countries. Most of the countries in the world experience steady wind flow patterns during the year, while India receives roughly 70% of its wind between May and September, coinciding with the south-west monsoon. Most of the area of India, except the north-east part, mostly has a wind speed higher than 5 m/s at a height of 100 m. The country’s west coastal region experiences higher speeds throughout the year, but the southern and central part of the west coast experiences more than 5 m/s wind speed specially in monsoon season. Some western parts and most of the northernmost region even have more than 6m/s wind speed. Another parameter is wind power density, which varies with location and weather condition in India. The total target is 175 GW, which is set by the Government of India (GOI), by 2022 [16]. India’s total wind potential is 695.5 GW at 120 AGL [17]. The requirements of materials and economic analysis in order to reach the 695.5 GW potential are estimated by Verma et al. [18] Electricity generation from wind was 62 GWh in 2019 and this increased by more than 17-fold since 2018 [19]. Increasing demand for electricity from wind power demands an increased size of wind turbines. Caduff et al. [20] suggested that the larger the size of wind turbine, the greater the reduction in GHG emission. Thus, wind energy is encouraging sustainable growth and helping to accomplish the Kyoto protocol treaty [21,22]. Oebels and Pacca [23] and Xie et al. [24] recommended wind energy as a green technology from a life cycle assessment of onshore wind turbines. Simons and Cheung [25] also reported wind energy as a green energy based on the quantified environmental impact of wind farms.
The wind turbine transforms the kinetic energy of wind into electrical energy. The tower, nacelle and rotor are the primary components of a wind turbine. Depending on the axis rotation, wind turbines are classified as Horizontal Axis Wind Turbine (HAWT) and Vertical Axis Wind Turbine (VAWT). The performance of HAWT increases using a winglet at tip of the blade [26] and the performance of VAWT increases using a wind lens for H type Darrieus wind turbine [27] and multibladed drag-based micro wind turbine in built-up areas [28]. The winglet also affects the stall phenomenon, causing the stall delay even at higher turbulence-intensity conditions [29]. It is categorized as an onshore or offshore wind turbine based on the location. Kadiyala et al. [30] proposed that environmental impact depends on the rotation axis of the wind turbine, its location, wind turbine capacity, capacity factor and geographic variability. During the electricity-generation stage, wind turbines do not produce emissions but they have environmental impacts at critical stages of wind turbine production, installation and decommissioning. These environmental impacts need to be assessed. Environmental Life Cycle Assessment (ELCA), Life Cycle Costing (LCC), Social Life Cycle Assessment (SLCA), Triple Bottom Line (TBL), Eco-Efficiency Analysis (EEA) are widely used techniques to analyse the sustainability of renewables [31].
The present study aims to quantify the environmental emissions from an Indian location-based wind farm using LCA. After decommissioning the wind turbine, the emissions are quantified for landfilling after the material has been recycled. Due to geographic variability, the capacity value is different for different regions. Thus, the effect of capacity factor is also assessed. This study also focuses on the environmental impact of wind turbines depending on the varying lifespans of wind turbine.
This study investigates the life cycle-based environmental impact of the materials used in the wind turbine using LCA. This paper is organized as follows. The goal and scope of the study is defined with functional unit and system boundary as well as description of the material inventory used in a wind turbine of a selected wind farm. This is followed by a discussion of results. The results are assessed for the environmental impact of the studied wind farm and their comparison with previous study as well as coal power plant. The result also presents the emissions from the landfilling after the recycling of the material. Using environmental indicators as a parameter, a life cycle evaluation of environmental impact from a wind power system at different capacity factors and lifespans of a wind turbine is presented. Finally, conclusions with limitation and future recommendation are presented.

2. Literature Review

Life cycle assessment is a methodology that assesses the quantitative analysis of life cycle GHG emissions of wind turbines. International standard ISO 14044 has four phases—goal and scope definition, inventory analysis, impact assessment and interpretation—which are applied to wind power systems. Few studies have been undertaken on the LCA of the wind power system for onshore and offshore locations in various countries such as Denmark [32], Italy [22], Spain [9], Canada [33], Brazil [23], Mexico [34], China [10,35,36], Libya [37], Texas [38], US [39], Germany [40], Taiwan [41], Jordan [42]. Based on the various studies, the amount of CO2 emissions is summarized in Table 1. Kabir et al. [33] explored three different capacity wind turbine models. They found that a higher capacity wind turbine is superior regarding energy and emissions, as well as from an economic perspective. That study further suggested that funding from the government as an encouragement might attract wind energy systems. Oebels and Pacca [23] studied a 1.5 MW wind turbine and found that steel tower is mostly responsible for higher emission. Al-Behadili and El-Osta [37] explored the 1.65 MW model and concluded that wind electricity produces fewer emission than fossil fuels and other renewables. Yang et al. [10] explored two different capacity wind turbines for offshore locations and concluded that the offshore wind farm is vulnerable to energy and emissions with steel materials and due to the replacement of components such as generators and blades. Chipindula et al. [38] explored the LCA of onshore and offshore wind farms at a different capacity factors. They suggested that increasing capacity reduces CO2 emissions and energy payback time at a suitable location and capacity factor. Alsaleh and Sattler [39] explored a 2 MW wind turbine at the different lifespan of wind turbines and concluded that the manufacturing phase has a larger impact (>60%) compared to other phases. The tower produces greater impact due to the use of steel as a material of construction.
Demir and Taskin [43] explored LCA of wind turbines at different hub height and capacity of wind turbine. It has been proposed that increasing the capacity and hub height of the wind turbine reduces the environmental impact due to an increase in electricity production. LCA is performed in design variation of wind turbine. Ozoemena et al. [44] assessed the environmental impact of a 1.5 MW wind turbine using LCA and compared it to the environmental impact of the advanced-performance wind turbine. They suggested that enhancement in wind turbine technology through permanent magnet generators is a better option than rotor advancement and increased tower height. Vargas et al. [34] analysed two wind turbine models with the same capacity using LCA methodology. They found that nacelle and tower components are responsible for the most significant environmental impact. Furthermore, they suggested that the quantity and type of material can improve the environmental impact. Thus, proper material selection is necessary in order to reduce the environmental impact. Meanwhile, Martinez et al. [9] discussed the LCA of a 2 MW wind turbine and recommended that the turbine blade should have a substantial impact on the environment among all other components of the wind turbine. Xu et al. [11] concluded that the production process and production of the tower is the largest contributor of environmental impact in terms of global warming potential. They further suggested that optimization of structural design and better application of raw material can improve the environmental performance. In order to achieve increasing energy demand, higher capacity wind turbines are manufactured. Higher capacity can be achieved by increasing the size of wind turbine, either in terms of tower height or blade length. Stavridou et al. [45] investigated tubular and lattice type towers with 76.16 m height using LCA. The results suggested that the lattice tower configuration is better, both structurally and environmentally. Gkantou et al. [46] used LCA to quantify the environmental impact of a hybrid tower with 185 m height and suggested that hybrid structures have a similar carbon footprints and energy payback times to conventional towers. Tefera et al. [47] assessed the environmental impact of a wind power system in Ethiopia. Sensitivity analysis presents that the lifespan of a wind turbine, its capacity factors, the replacement rates of parts, transport routes, and waste management after the wind turbine is decommissioned may affect LCA results. Kouloumpis et al. [48] performed LCA for H-rotor Darrius VAWT and suggested that the appropriate siting, recycling and roof mounting of the VAWT should use an environmentally friendly technology. The results also found that a capacity factor greater than 1.4% is enough to reduce the GWP, while a capacity factor greater than 12% is enough to reduce the environmental impacts, except ADP. Nagle et al. [49] presented an analysis on the most suitable disposal method after decommissioning the Irish wind turbine blades. The results suggested that co-processing is beneficial compared to landfill and found a more sustainable Irish alternative. Bi et al. [50] investigated 378 wind farms in China for carbon emissions using input–output LCA. The results found that carbon emissions at the manufacturing stage are 3.36 MT, while at the farm construction stage, the highest is 5.94 MT, in the Inner Mongolia region. Xu et al. [51] explored the estimation of GHG emissions from onshore wind turbines in China using LCA and engineering-based models. The results found that onshore wind energy has an emission intensity 98% lower than the traditional resources. The results also suggested that the advanced design of wind turbines can reduce the GHG emissions. Doerffer et al. [52] presented LCA for drag force driven wind turbines. The results suggested that, among different components, the tower has the highest negative environmental impact. Recycling can reduce the environmental impact by 30%. Morini et al. [53] presented an assessment of the environmental impact of a blade. The results shows that careful selection of materials and end of life options for wind turbine blades can reduce the environmental impact.
LCA studies were undertaken for different countries such as China, Brazil, USA, Mexico, Libya, Canada, Denmark, Italy, Spain, and Germany. However, environmental emissions of wind energy have not been investigated in India, where the installed capacity of wind power is increasing. At different locations, wind energy contribution varied according to capacity value. A study on environmental impacts at different capacity factors is also limited, as it varies according to the location. India has a huge potential of wind power and untapped wind energy, which makes it a promising solution to the cleaner power energy transition. Thus, an LCA study would be representative for the environmental impact of wind power in India. Most of the previous analysis has been carried out under the assumption of a 20-year-long life cycle of a wind turbine. Limited research has been carried out for variable lifespans of wind turbines. What will be the effect on the environment if the lifespan of wind turbines is increased? This study also focuses on the environmental impact of wind turbines at an increased lifespan of the wind turbines.

3. Life Cycle Assessment Methodology

This study utilizes LCA methodology of wind power as per the ISO14044 standards [54]. CO2, SO2, NOx and PM2.5 are emissions quantified for the environmental impacts for the wind power system. CO2, SO2 and NOx report global warming potential (GWP), acidification potential (AP), and Photochemical Oxidant Potential (POP), respectively [36,40,55]. LCA starts with the goal to determine the aim of the study. Scope is used to determine the products for assessment and processes of assessment. The functional unit presents the quantitative description of the product. The third phase of LCA is life cycle inventory analysis, which represents the collection and compilation of the raw material data. The next phase is life cycle impact assessment. The life cycle inventory data are transformed into environmental impact using LCA software (SimaPro). Global warming potential (GWP), acidification potential (AP), Photochemical Oxidant Potential (POP) and particulate matter formation are the environmental impact assessments based on midpoint impact indicators.

3.1. Goal and Scope of the Present Study

The objective of the current study is to analyse the environmental impact associated with electricity generation from wind energy and to compare these impacts with alternative resources such as coal. Karnataka is one of the top five states in India in terms of potential for wind power due to its coastal and dry arid zones. This is the ideal geographic location to harvest the wind energy due to higher annual wind speed and the fact that the area is rich in wind farms. The potential of wind power in Karnataka is estimated to be 13.6 GW at 80 m AGL, 55.9 GW at 100 m AGL and 124 GW at 120 m AGL and the current installed capacity is 4.8 GW. This huge untapped wind power potential makes it a promising solution to cleaner energy transition. The environmental emissions have not been investigated, and an LCA study in this state could be helpful in harnessing this huge potential of wind power with minimal environmental impact by implementing the policies and regulations to reduce global warming. In this study, Anabaru wind farm is selected due to data availability of materials used in the Vestas wind turbine to analyse the environmental impact due to wind power in this state of India.
Here, the wind farm in the Karnataka state of India commissioned in 2008 is selected to study life cycle assessment. The location of the wind farm is at latitude 14°34′24.7″ and longitude 76°23′31.5″ and it is situated at an altitude of 750 m [56]. This wind farm is equipped with 10 Vestas V-82 wind turbines, each with an 82 m rotor diameter and 78 m hub height. Each V-82 wind turbine model has a production capacity of 1.65 MW [57]. A wind farm comprises turbines, internal cables, transformer stations and external cables. The turbine system generates electricity from the kinetic energy of wind and it is composed of a rotor (three blades and hub), a nacelle and a tower. The turbine is installed on the foundation. The individual wind turbines are connected with the transformer station through internal cables and the wind power plant is connected to the electricity grid through external cables.

3.1.1. Functional Unit

The function of the wind power system is to generate electricity. The functional unit is 1 MWh of electricity generated from a wind farm. This is based on the lifetime of the wind farm. The functional unit considers the generated electricity, but not the electricity distributed to the consumer and, hence, grid loss is not considered here.

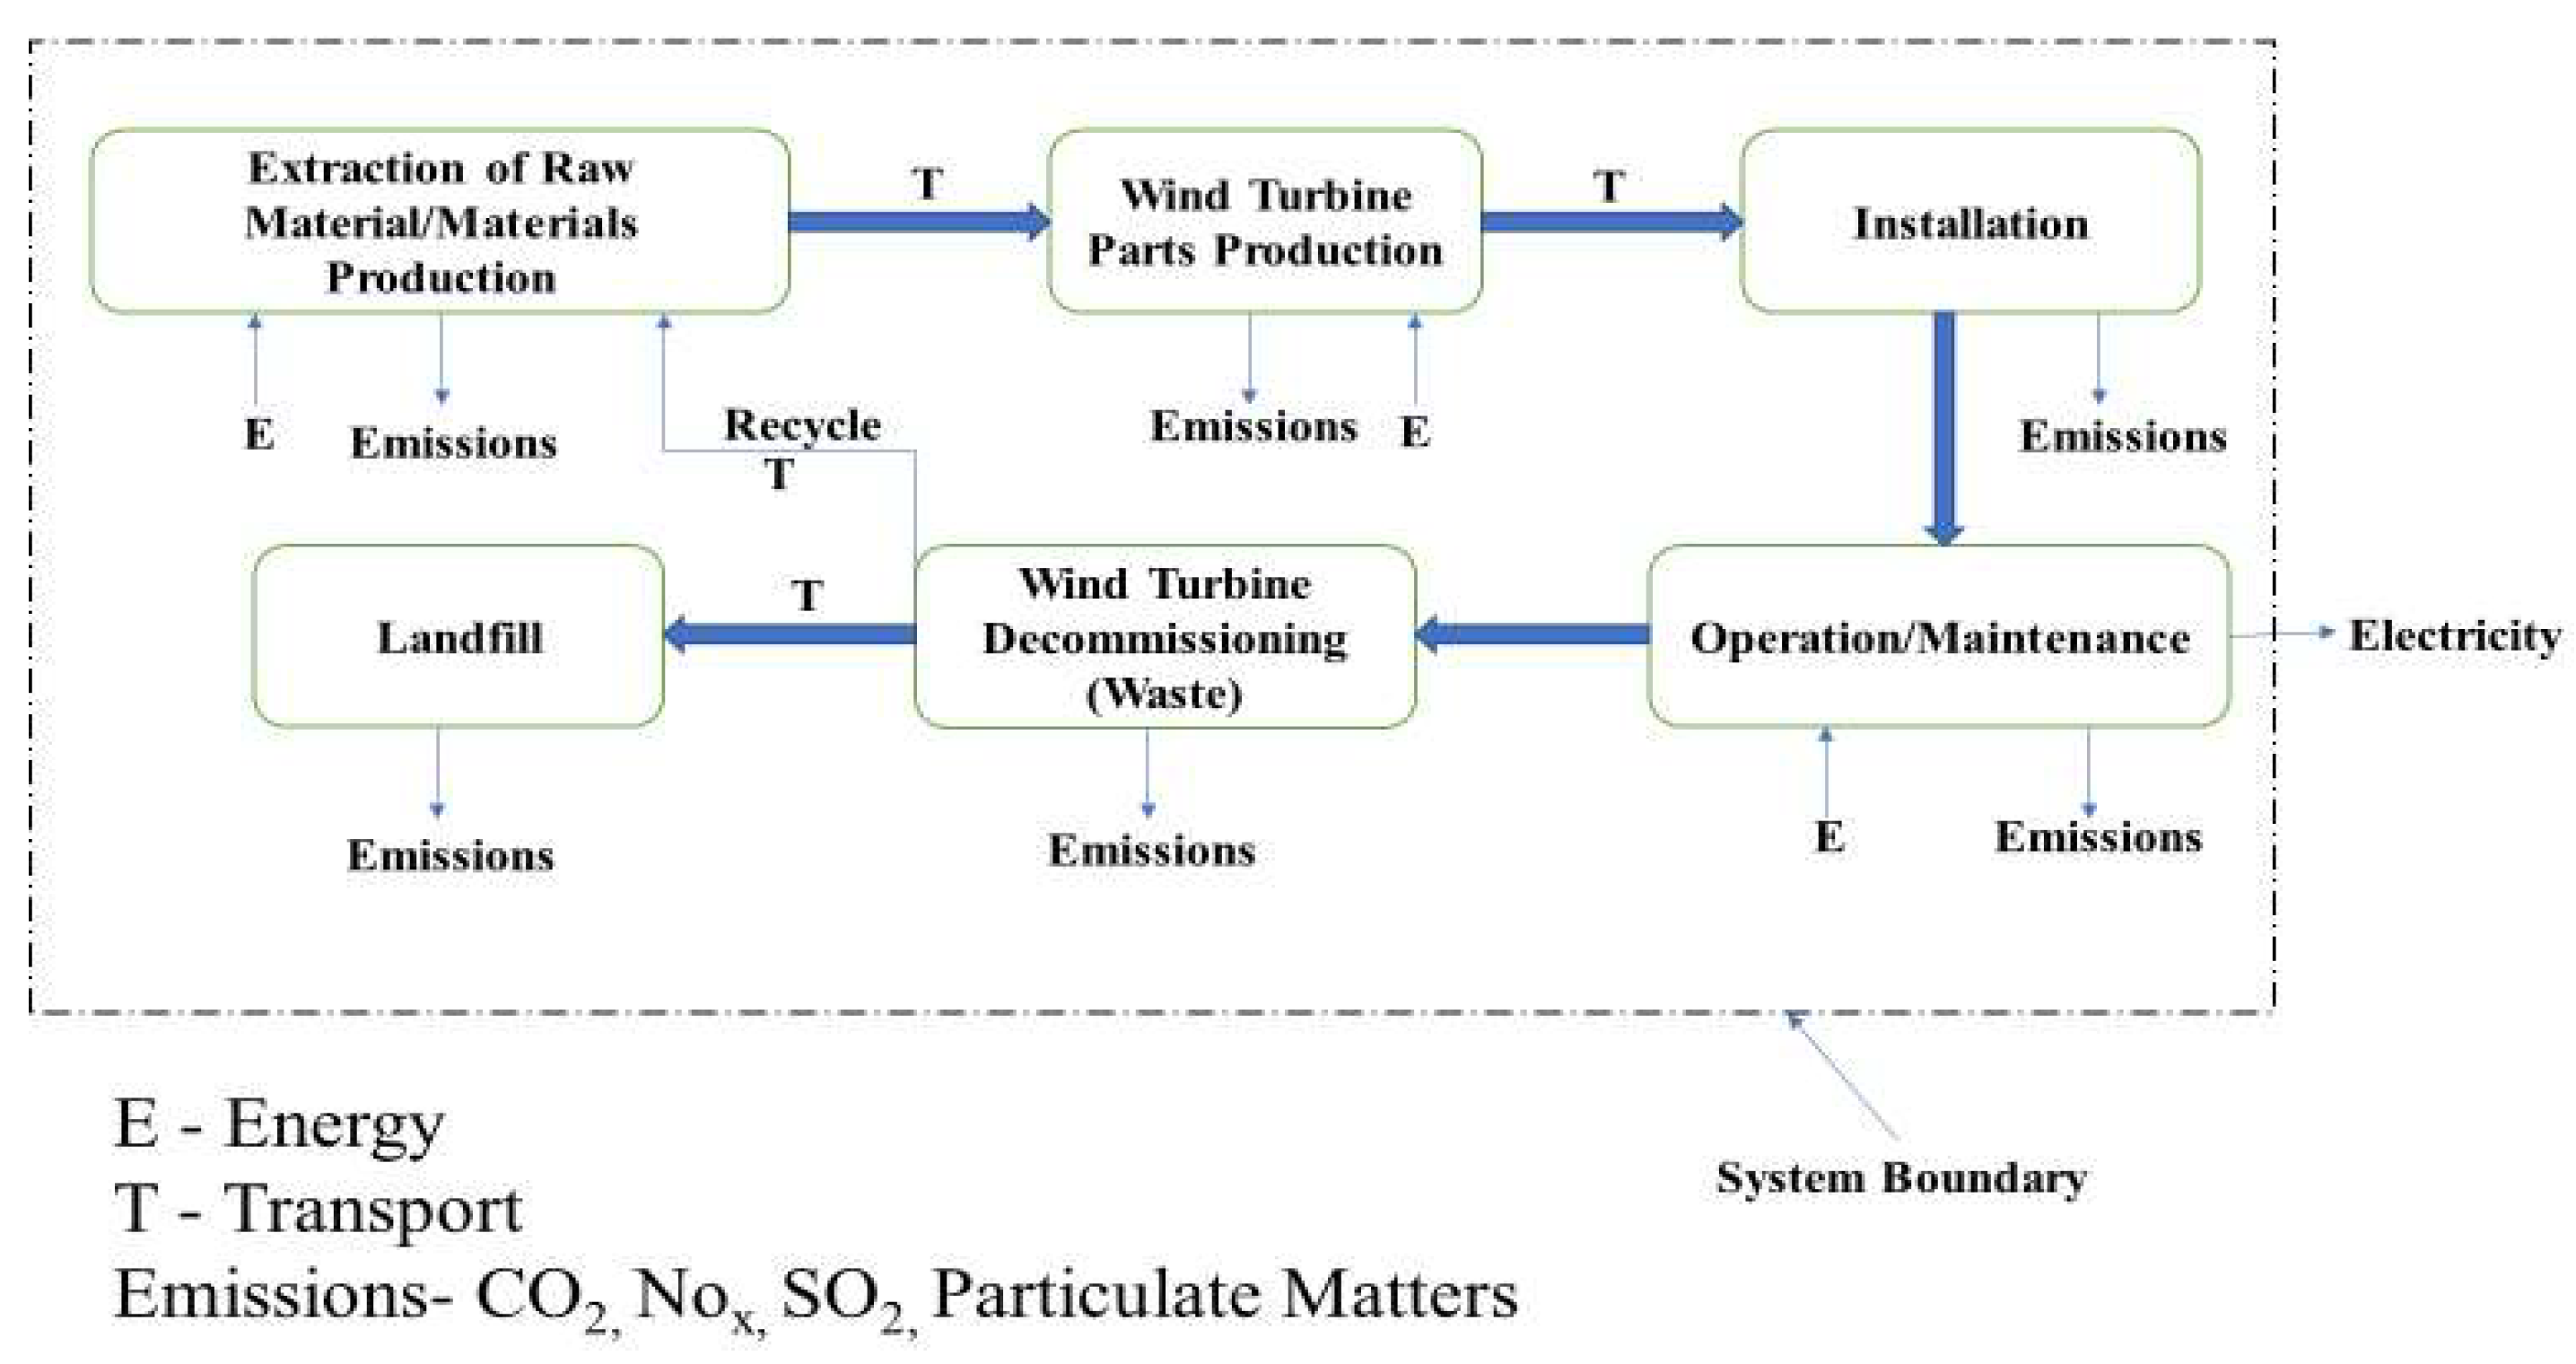
3.1.2. System Boundary

An assessment of a wind farm includes production, transportation, installation, maintenance, decommissioning and disposal. The system boundary is shown in Figure 1. The system boundary for the wind turbine consists of the stages as shown in Figure 1. Initially, raw material is extracted or produced and transported to the wind turbine production site. Wind turbine components such as the rotor, the nacelle, the tower are manufactured from transported materials at the production site. To collect and distribute the electricity, the internal cable, transformer station and external cable are also manufactured from various materials. This production phase consumes energy and releases pollutants. The manufactured parts are transported to the installation site. The transportation stage also releases pollutant contaminations. At the installation site, the foundation is constructed and the wind turbine is installed on it. Furthermore, the operation and maintenance stages include generation of electricity, regular inspection and replacement of equipment which requires certain amount of energy and extraction of emissions. After completion of a lifetime (20 years) of a wind turbine, it is decommissioned. Recycled parts are transported to the material production site or disposable products are transported to the landfill area.

3.2. Material Inventory Assessment

3.2.1. Material Data Used in the Production of a Wind Turbine

To execute the life cycle assessment of wind farms in India, material inventory data have been obtained from the report of VESTAS [57]. Detailed material data for wind turbine components (rotor, Nacelle, tower, foundation, internal cables, transformer station, and external cables) are included here and the quantities of each required material for a wind farm with 10 V82–1.65 MW wind turbines are summarized in Table 2.

3.2.2. Breakdown of Material in a Complete Wind Farm

Figure 2 illustrates the material breakdown of a complete wind farm based on its mass. The blade part of the rotor is manufactured from a glass fibre with epoxy to give it good resistance to moisture and polluting elements, since this material has good mechanical properties. Birchwood and balsawood also can be used as supporting cores and inner ribs. In this study, epoxy and fibre glass are separated as 40% and 60% of weight fractions, respectively. Concrete makes up the largest contribution to a wind farm, and it is used for foundation construction. Based on larger material contribution and availability analysis, concrete, steel, cast iron, fibre glass, aluminium and copper are used for impact assessment.

3.2.3. Calculation of Electricity Production

Electricity production is calculated by using the capacity factor and it is defined as the ratio of the amount of electricity production and capacity of the wind turbine. It is shown in Equation (1):
CF = AEP Capacity × 24 × 365
where
  • CF: Capacity Factor (dimensionless),
  • AEP: Annual Energy Production in MWh, Capacity in MW.
In this study, the capacity factor is selected as 24% for Karnataka State in India [58]. Total production of electricity from the wind turbine is 3468 MWh/year. In this wind farm, there are 10 wind turbines, and hence electricity production from the wind farm is 34,689 MWh/year. During the lifetime of 20 years, the total electricity generation from the wind farm is 693,792 MWh.
The capacity factor varies according to the location. In India, the capacity factor varies between 20.5 and 29.5% [58]. According to the location, it is 20.5% for Rajasthan, 23% for Maharashtra and Tamil Nadu, 25.5% for Andhra Pradesh, 29.5% for Gujarat and 24% for Karnataka and other states. For this study, maximum (29.5%), minimum (20.5%) and case study (24%) values are considered for the analysis on environmental impact.

4. Results and Discussion

4.1. Environmental Impact of a Complete Wind Farm

Based on the emission factors, the environmental impact of a wind farm is shown in Figure 3. CO2, NOx, SO2 and PM2.5 emissions are selected for the environmental impact from the different materials used in a wind farm. The potential values of CO2, NOx, SO2 and PM2.5 emissions are 11.3 kg CO2-eq/MWh, 0.037 kg NOx-eq/MWh, 0.044 kg SO2-eq/MWh and 0.014 kg PM2.5-eq/MWh, respectively. GWP (CO2) is dominant environmental impacts from a wind farm. Thus, this clearly shows the largest contribution of CO2 emissions and reporting higher global warming potential in wind power.
After decommissioning of the wind farm, the materials used here can be recycled or landfilled. Mainly steel, cast iron, copper, and aluminium are 90% recyclable, while concrete and glass fibres are 100% landfilled. If the recyclable materials used in a wind farm are recycled after end of life, the total emission factors through landfilling are presented in Figure 4. The figure shows that recycling the materials could reduce the total CO2 emissions by 71.3%, NOx emissions by 71%, SO2 emissions by 74.7% and PM2.5 emissions by 73.8%.

4.2. Comparison of the Wind Results with Previous Literature

A comparison of the calculations from present study with previous studies is shown in Figure 5 and represents the comparison of CO2 emissions from the literature studied for similar wind turbine model (VESTAS V82 1.65 MW) at different locations and capacity factors. A direct comparison of the results between different literatures could vary due to different parameters such as power output, wind turbine capacity, capacity factor and design variation. The quantity of CO2 emissions for the present study is 11.3 kg CO2-eq/MWh for SimaPro [59], while it is 9.48 kg CO2-eq/MWh for the Gabi result [60], 6.6 kg CO2-eq/MWh for Schmidt [57] and 8.21 kg CO2-eq/MWh for Wang and Sun [35]. This variation in results could be due to the capacity factor variation.

4.3. Comparison of Wind Power with Coal Scenario and Other Greener Technologies

The assessment result of the wind farm is compared to the assessment of the coal power plant. In this study, four types of pollutant emissions produced by the life cycle of wind and coal power plants are evaluated. Table 3 shows the pollutant emissions produced from 1 MWh electricity generation. All emissions are lower for wind power than the coal scenario. For 1 MWh of electricity, CO2 emissions for coal power and wind power are 965 kg-eq./MWh and 11.3 kg-eq./MWh, respectively. Wind power could reduce CO2, NOX, SO2 and PM2.5 emissions by 953.7 kg-eq./MWh, 4.7 kg-eq./MWh, 3.2 kg-eq./MWh and 0.078 kg-eq./MWh compared to the coal power plant. This gap in pollutant emissions would help substitute coal power plants with wind energy. CO2 emissions from wind power are also compared to those from PV and CSP power plant. The emissions from PV and CSP power plant [61] are much higher compared to those from wind power. CO2 emissions are dominated by wind and coal plants compared to other emissions.

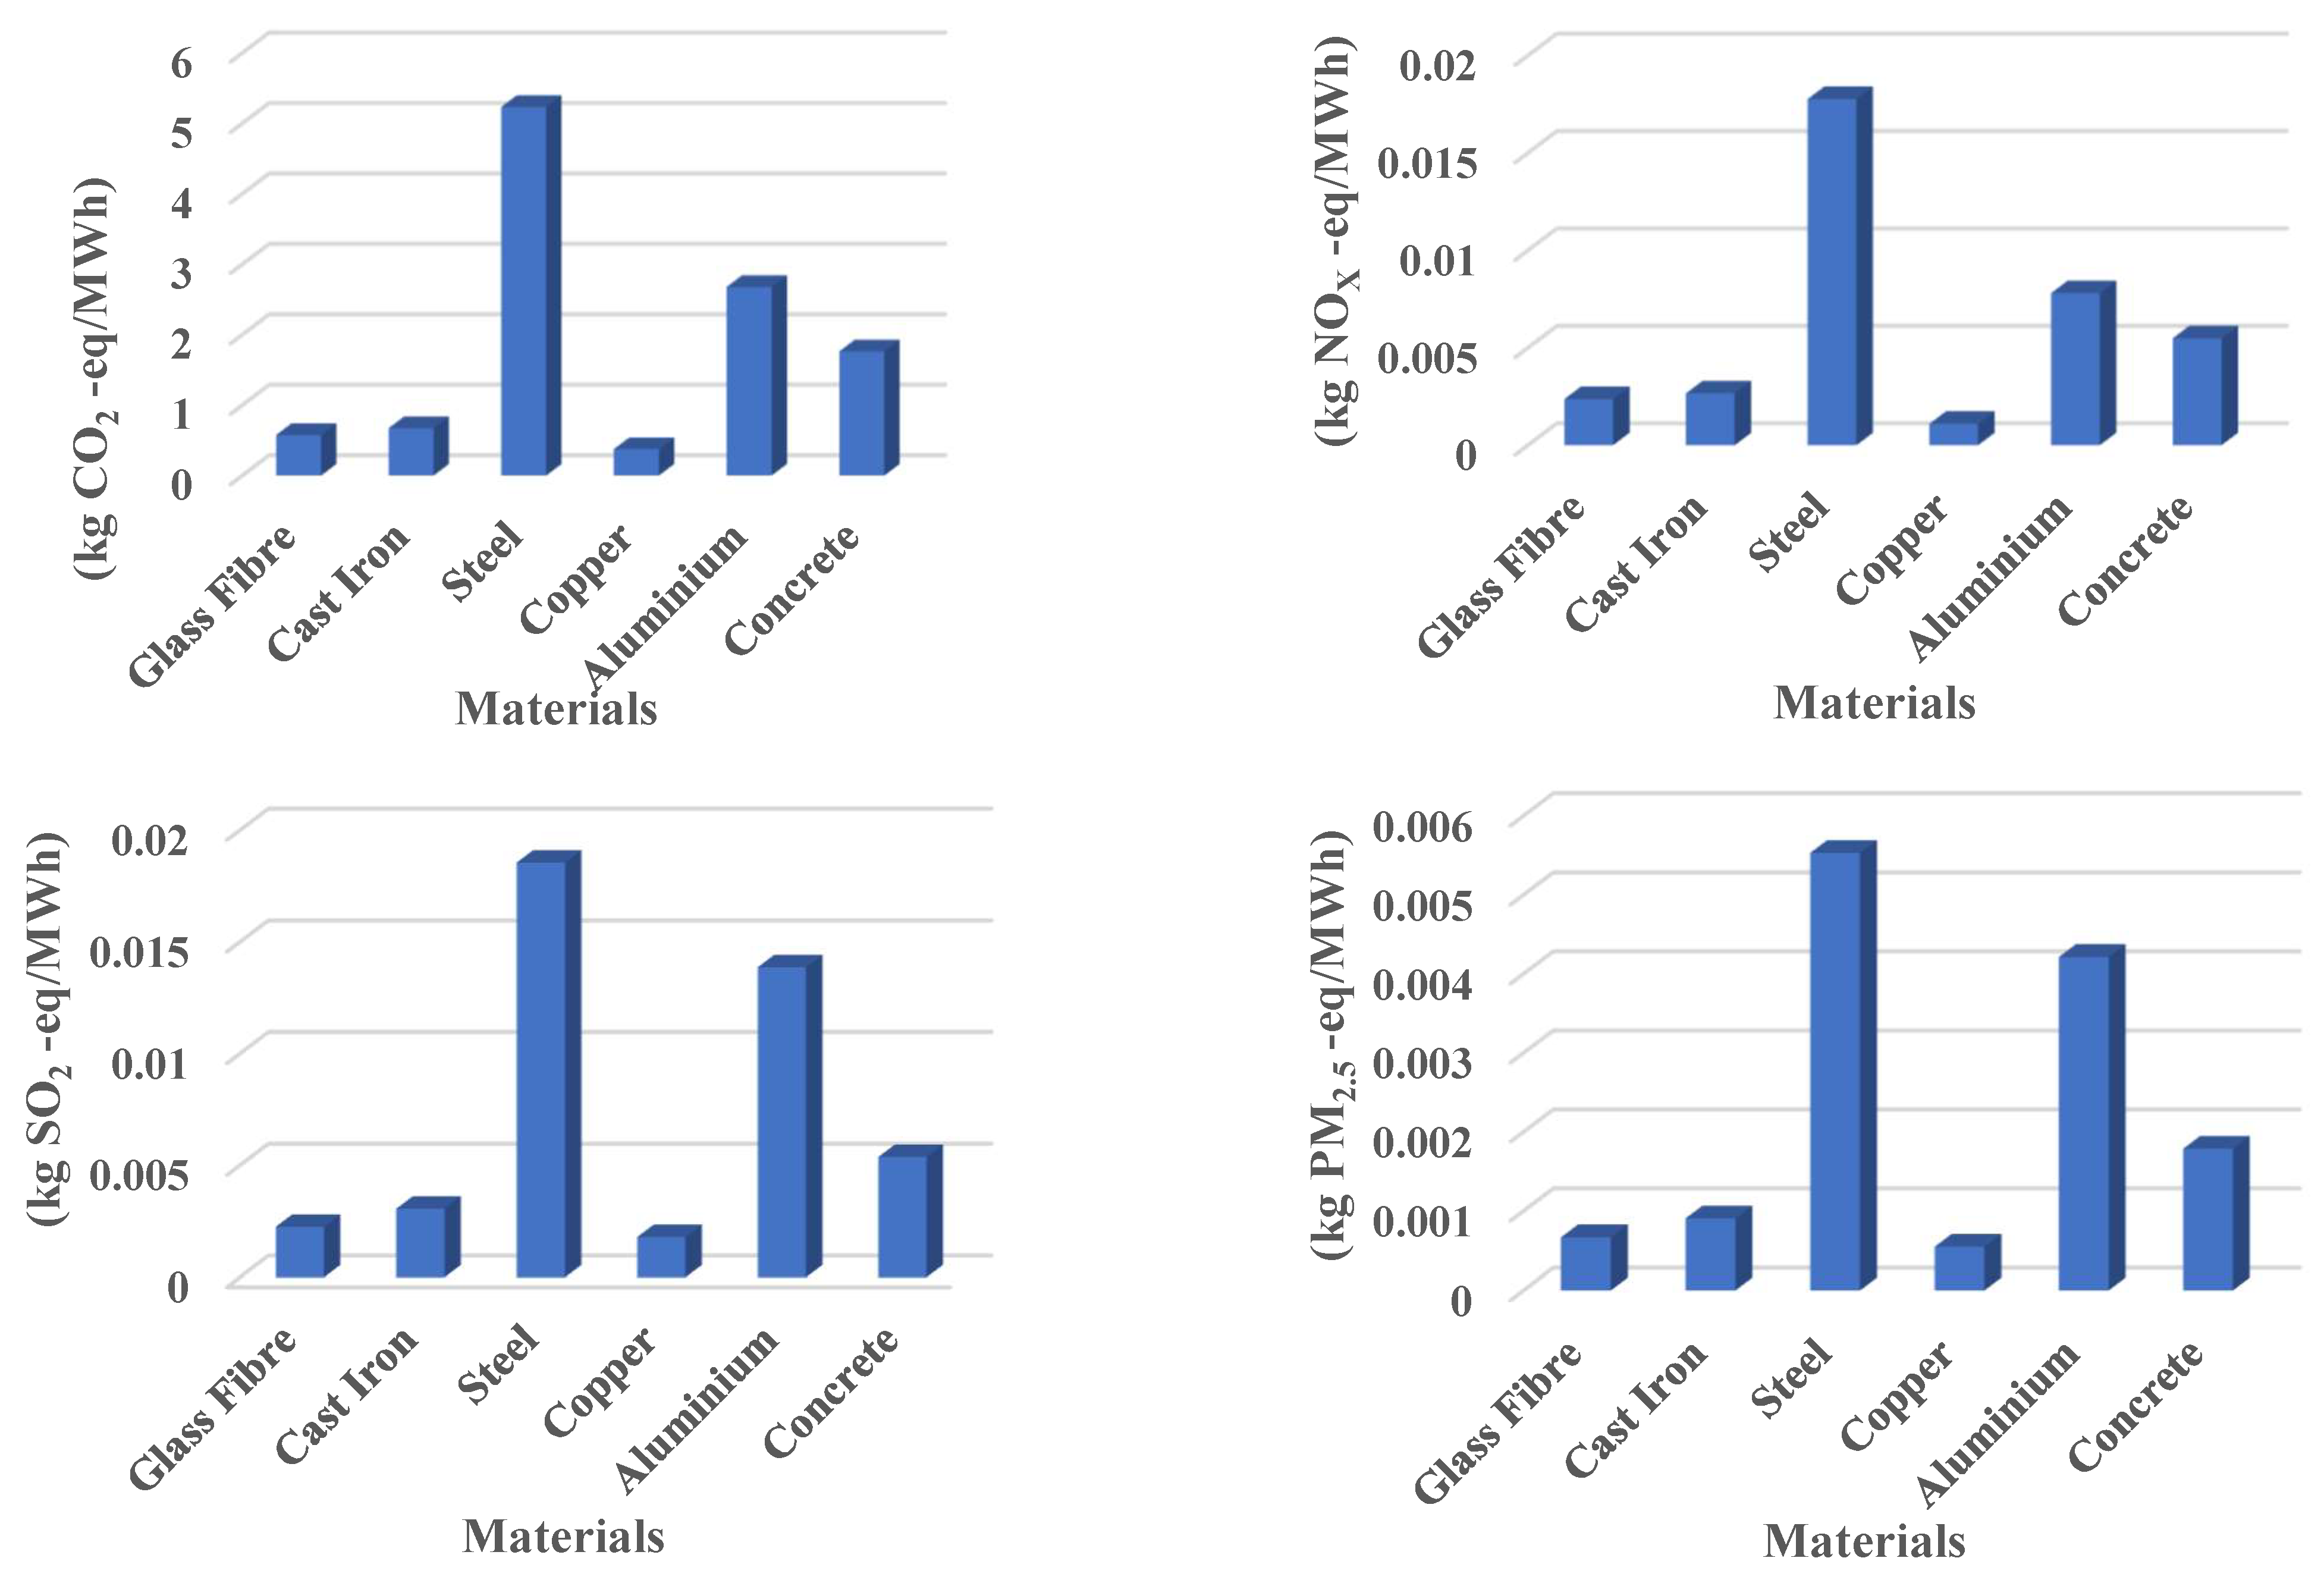
4.4. Pollutant Emissions from Different Materials

CO2, NOx, SO2 and PM2.5 emissions of the main materials for the manufacture of wind power systems are shown in Figure 6 and it presents the environmental impact of the materials used for a wind farm. Glass fibre, cast iron, steel, copper, aluminium, and concrete are selected for their higher contribution to wind turbine production. Figure 6 shows that the CO2, NOx, SO2 and PM2.5 emissions for steel are the greatest, followed by aluminium, concrete, cast iron, glass fibre, copper. During the life cycle phase of a wind farm, steel has the largest contribution in the environmental impact (5.2 kg CO2-eq/MWh, 0.017 kg NOX-eq/MWh, 0.019 kg SO2-eq/MWh, 0.006 kg PM2.5-eq/MWh) while copper has the minimum contribution in the environmental impact (0.37 kg CO2-eq/MWh, 0.0011 kg NOX-eq/MWh, 0.0018 kg SO2-eq/MWh and 0.0005 kg PM2.5-eq/MWh). The analysis shows that during a complete life of a wind farm, the quantity of the CO2 emissions is highly up to 5.2 kg per 1 MWh. The highest contributing materials, steel, aluminium and concrete, contribute 85.6% of total CO2 emissions.
NOx can cause photochemical ozone formation, which affects the plants by damaging the photosynthesis process and human health, causing issues such as irritation in the eyes, and respiratory system and dental problems. The figure for total NOx emissions is 0.037 kg-eq./MWh. During the life cycle phase of a wind farm, steel makes the largest contribution in environmental impact (0.017 kg NOx-eq/MWh) followed by aluminium (0.008 kg NOx-eq/MWh) and concrete (0.005 kg NOx-eq/MWh). These three materials contribute 83.5% of total NOx emissions. Total SO2 emissions are estimated to be 0.045 kg-eq./MWh. SO2 is categorized as acidification potential, which is a pioneer of acid rain affecting ecosystem, soil and water bodies. The major contributor of SO2 emissions is steel (0.018 kg/MWh), followed by aluminium (0.013 kg SO2-eq/MWh) and concrete (0.005 kg SO2-eq/MWh). These three materials contribute 84.1% of total SO2 emissions. Emissions of particulate matter PM2.5 total 0.013 kg-eq./MWh from a wind farm. Steel has a higher contribution to PM2.5 than other materials. Steel, aluminium and concrete contribute 84.5% of total PM2.5 emission.
Overall, CO2 emissions have to a higher impact. From the life cycle perspective, steel makes a major contribution to environmental impact compared to other materials. Life cycle emissions for steel make up 46.3% of total CO2, 47.8% of total NOx, 41.3% of total SO2 and 40.5% of total PM2.5.

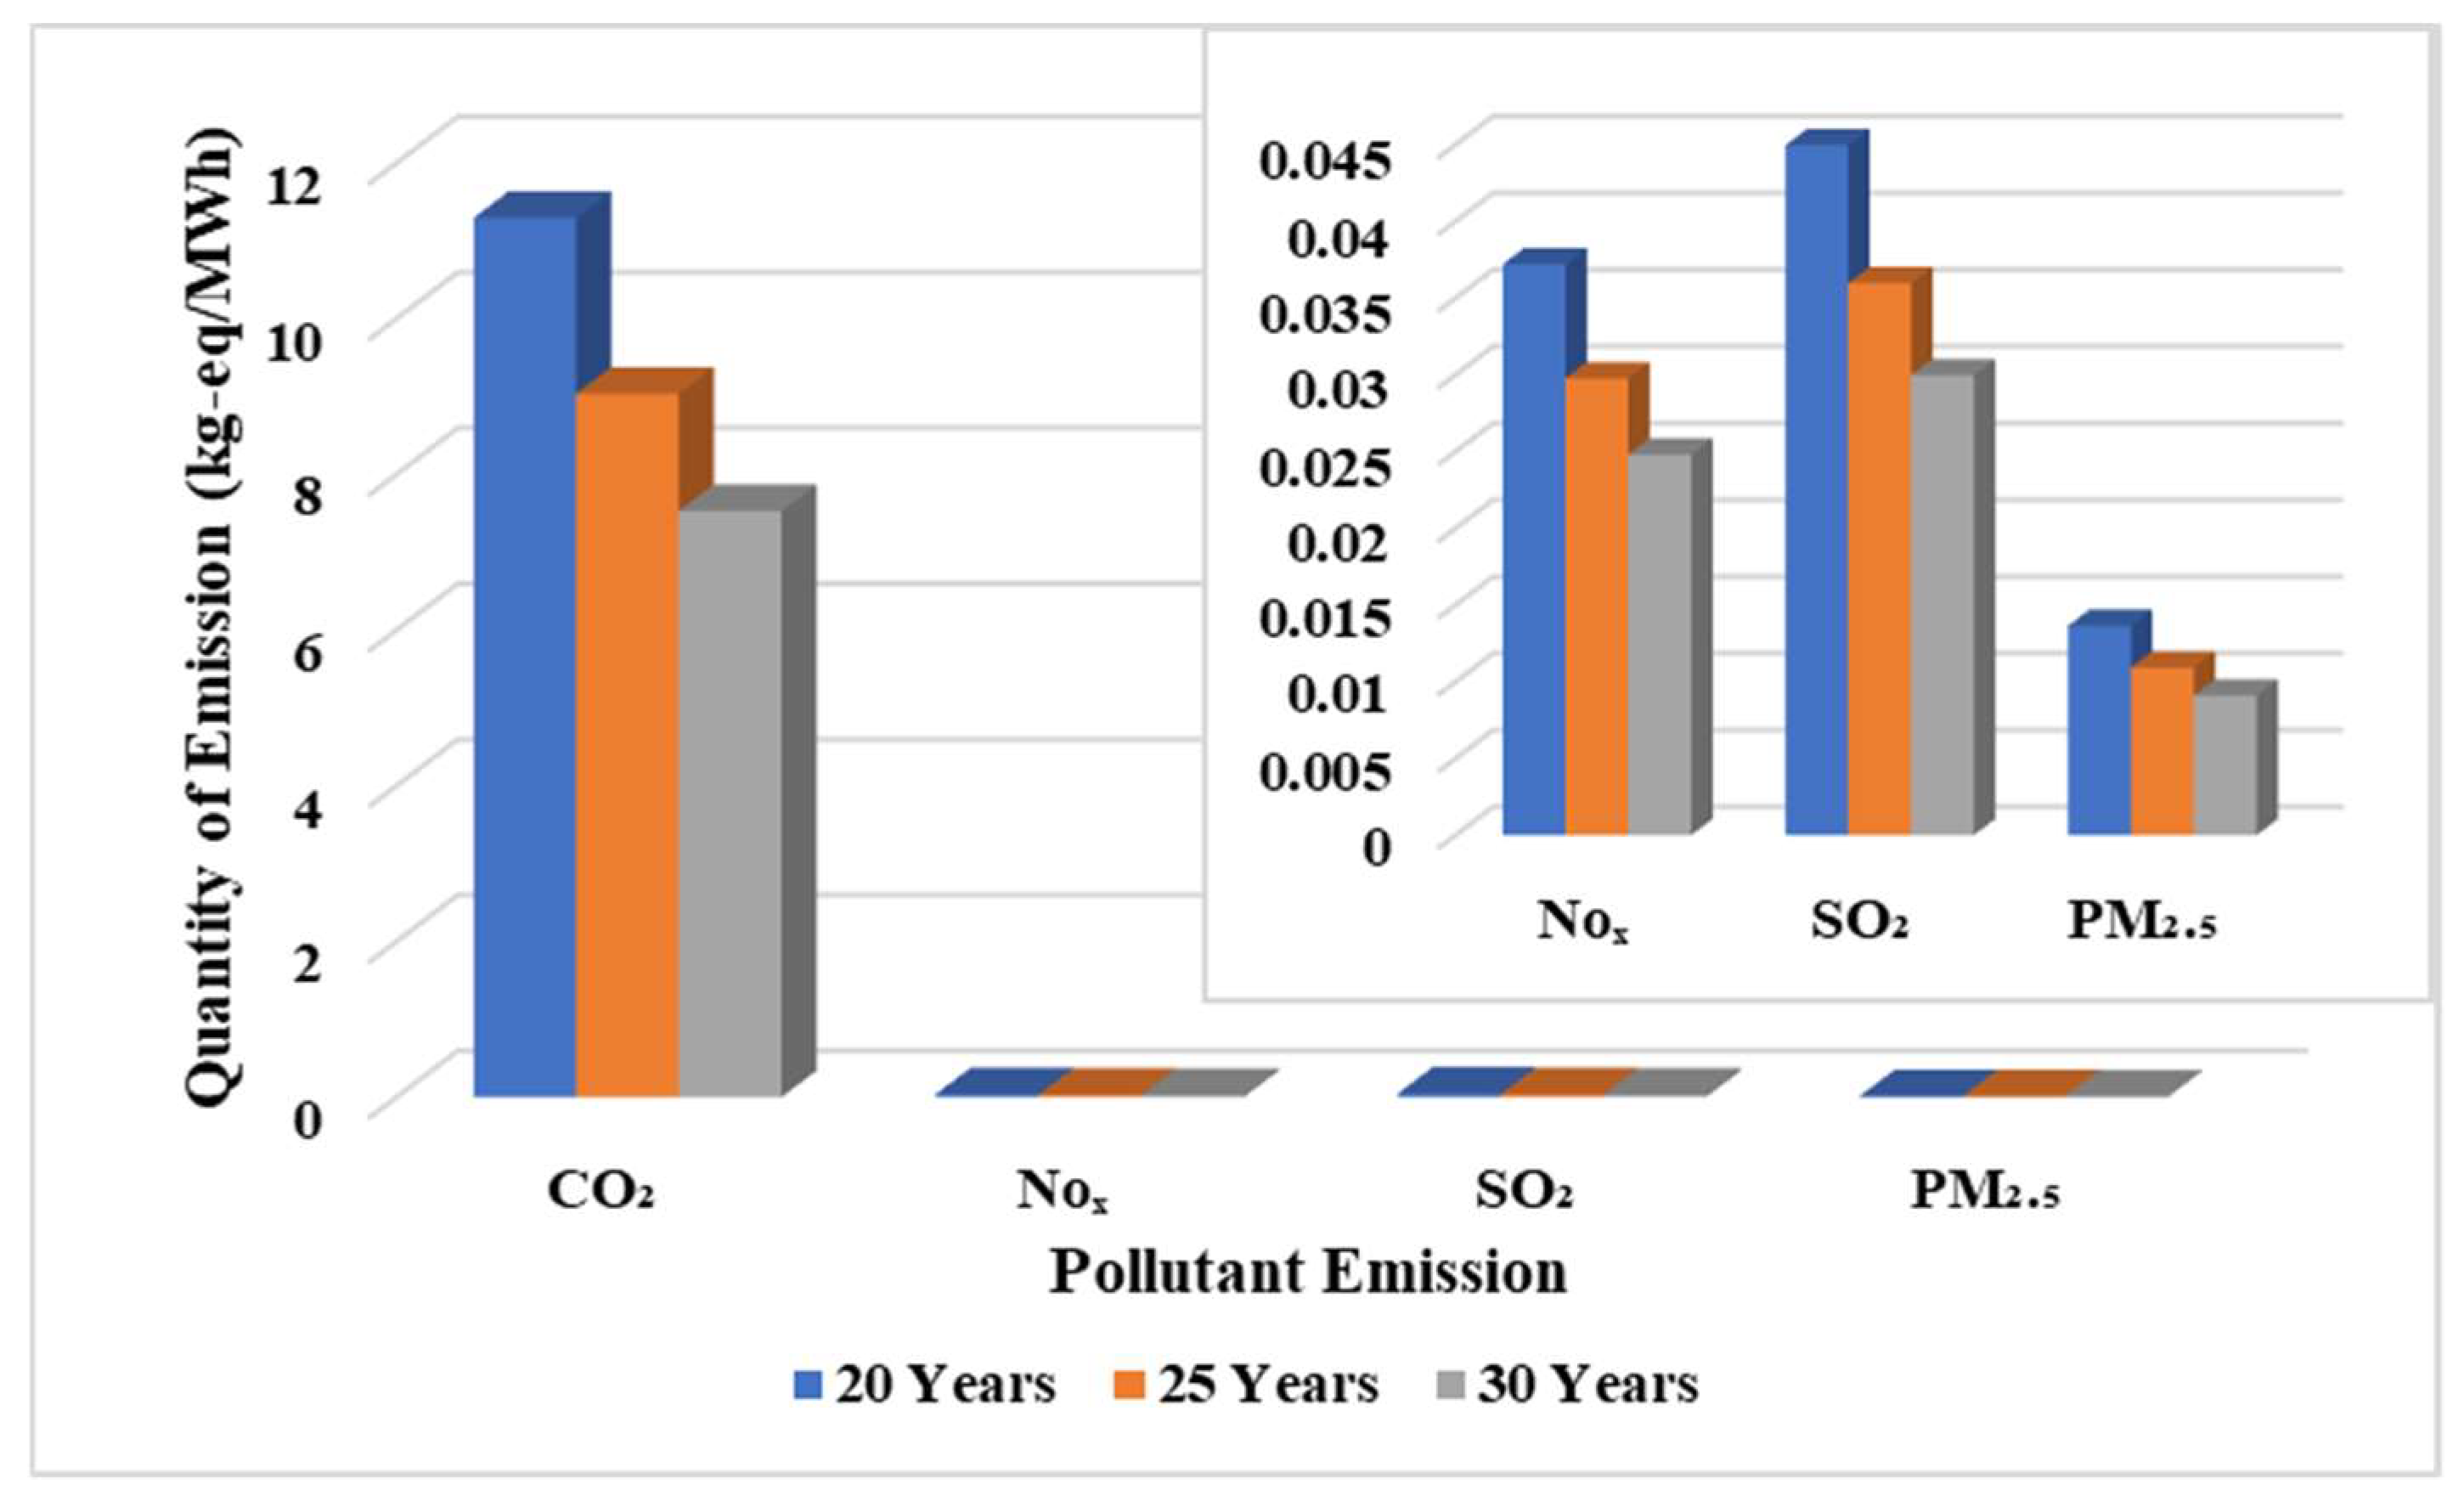
4.5. Effect of the Operational Life of Wind Turbine on Environmental Impact

The life of a wind turbine plays an important role in environmental impact. In this section, life cycle emissions are quantified for a different lifespan of the wind turbine. The study is analysed for 20 years of operational time. Further 25 years and 30 years are considered for analysis as shown in Figure 7. The highest impact out of the pollutants come from carbon dioxide emissions. The findings suggest that a wind turbine with a 30-year life cycle has less environmental impact than a wind turbine with a lower life cycle of 20 years or 25 years. The emissions are 33.4% and 16.7% lower for wind turbine with a 30-year life cycle compared one with a life cycle of 20 years and 25 years, respectively. This represents that the GHG emissions, acidification potential, Photochemical Oxidant Potential and particulate matters could be reduced by increasing the lifespan of a wind turbine with proper maintenance.

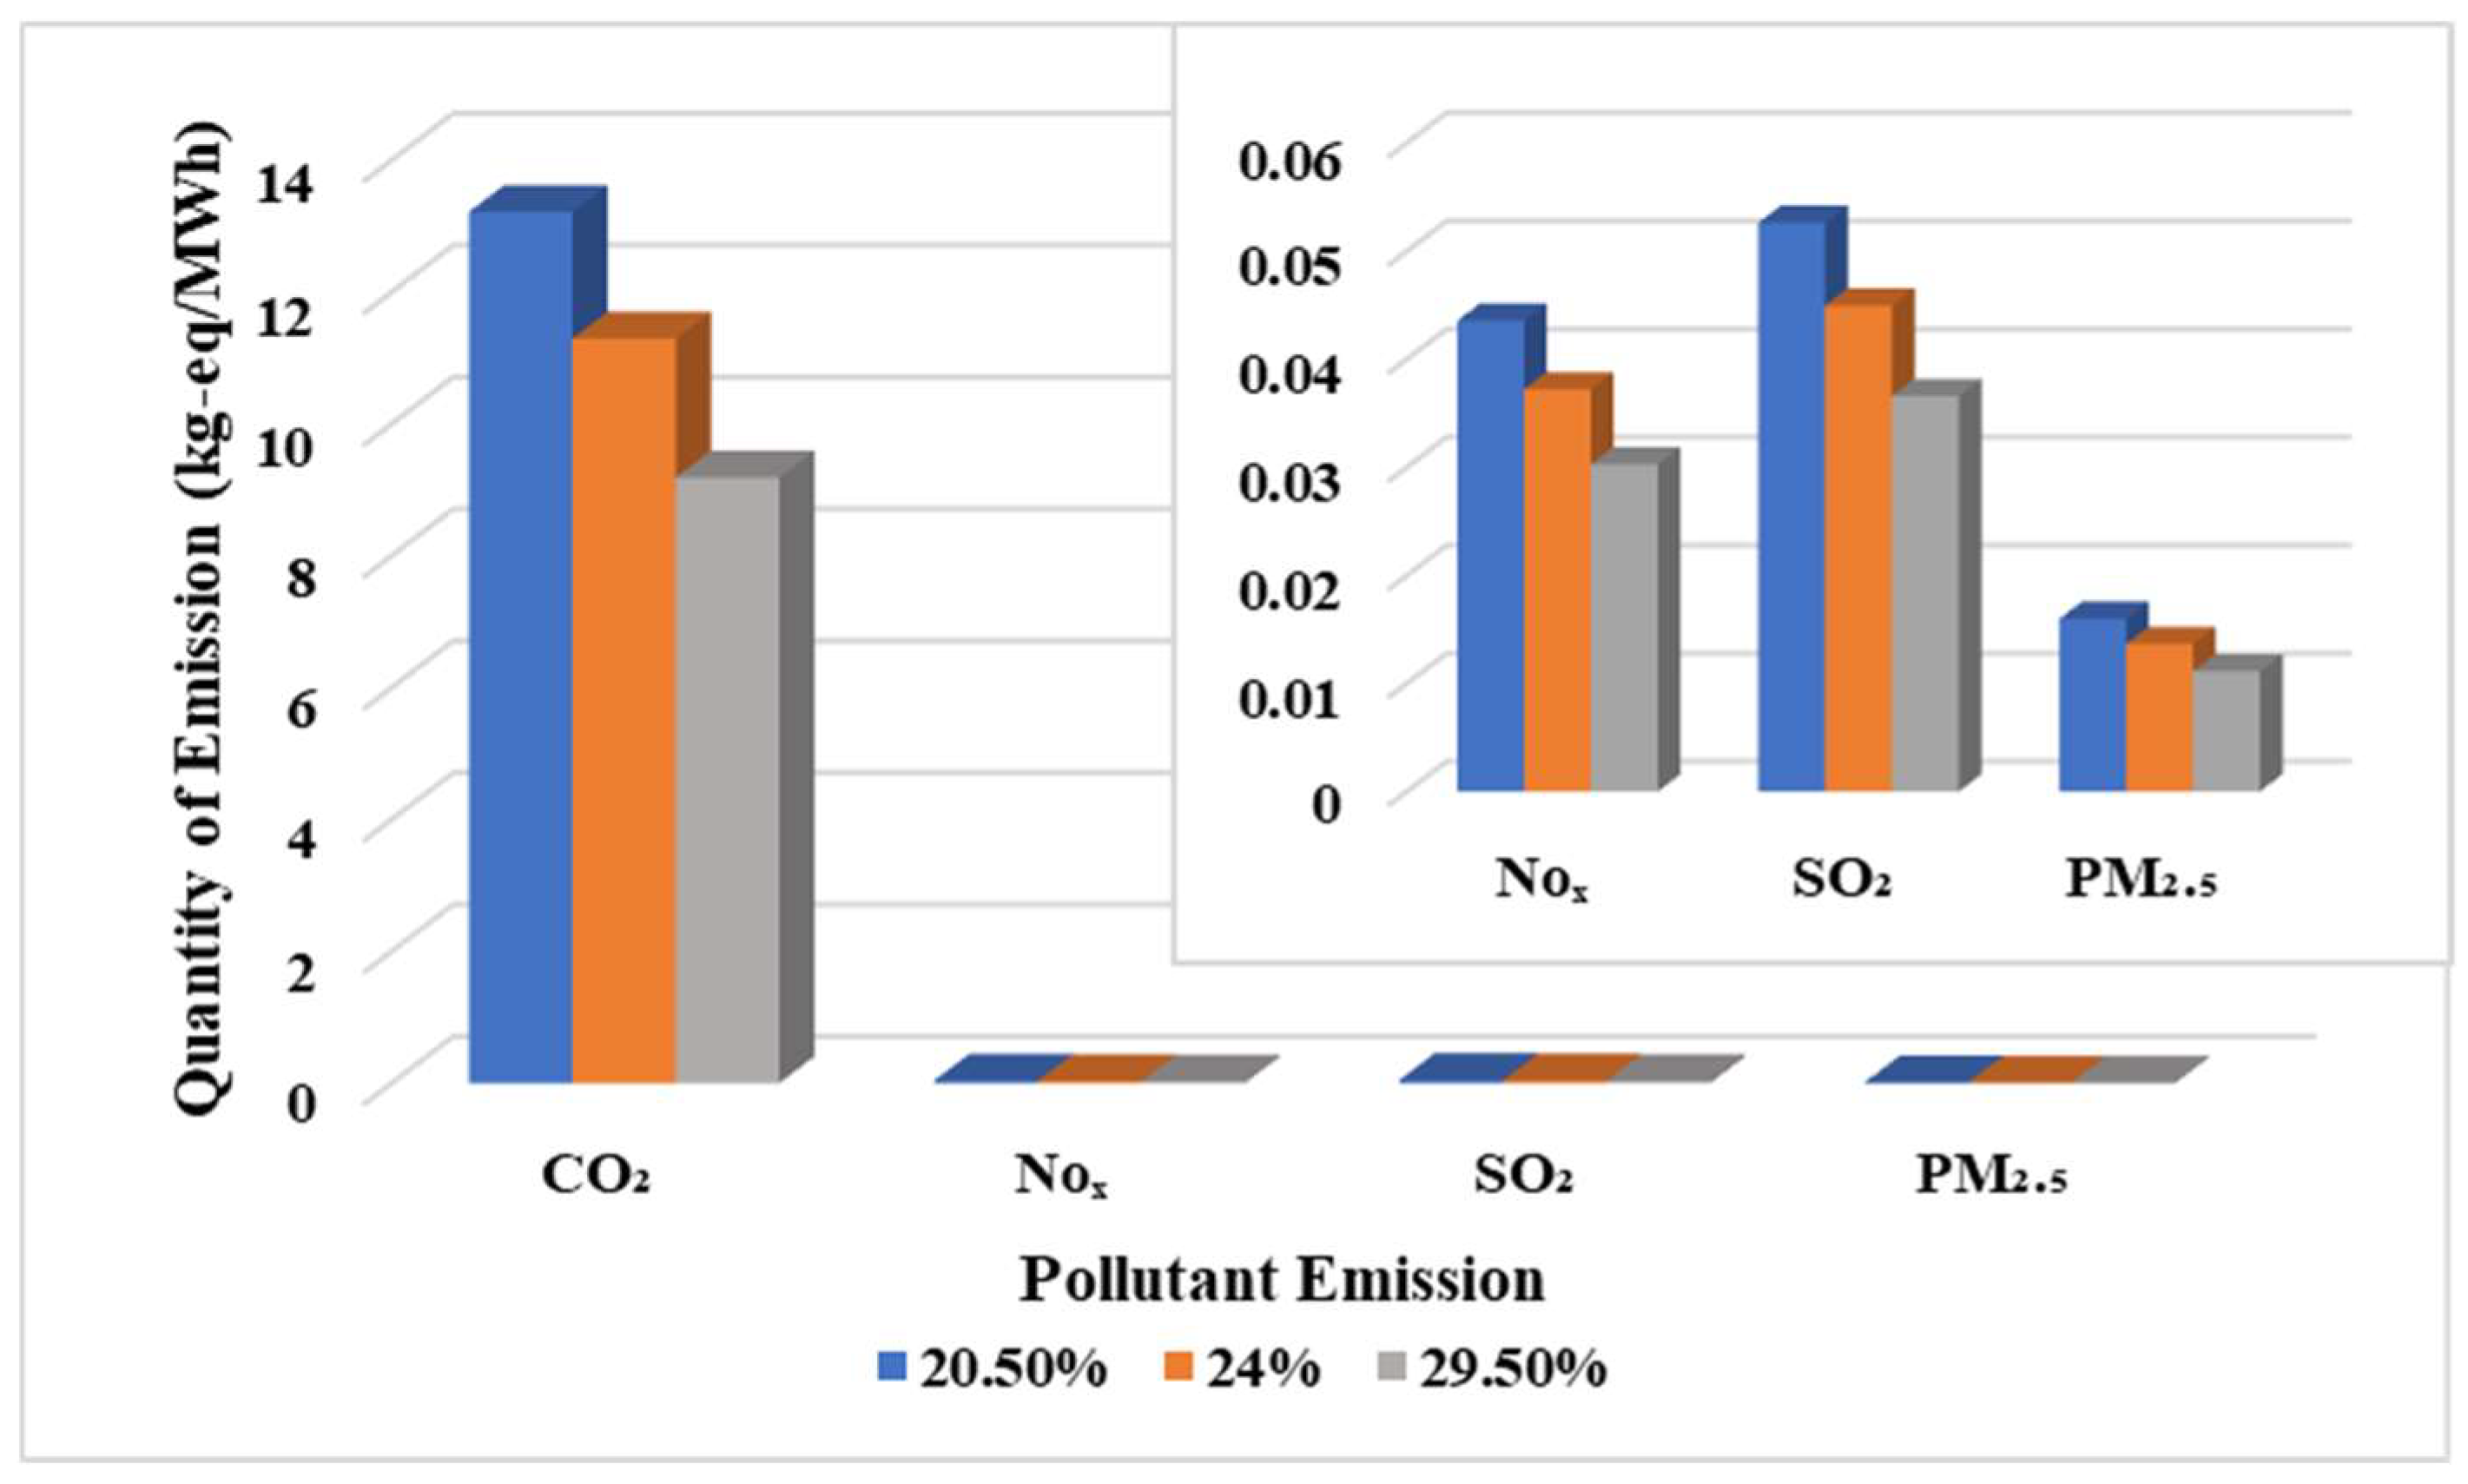
4.6. Effect of the Capacity Factor Variation on Environmental Impact

In order to analyse the effect of the capacity factor for a similar wind turbine model on the environmental impact, total CO2, NOx, SO2 and PM2.5 emissions are presented in Figure 8. It depicts that the total environmental emissions for 20.5% capacity factor are the highest out of all the materials, while total emissions for 29.5% capacity factor is the minimum. Based on the analysis in Figure 8, total CO2 emissions are 13.2 kg CO2-eq/MWh, 11.3 kg CO2-eq/MWh and 9.2 kg CO2-eq/MWh at 20.5%, 24% and 29.5% capacity factors, respectively. The emissions rates increase to about 17% for a 20.5% capacity factor and decrease to about 18.6% for a 29.5% capacity factor when compared with the base case study. Thus, it represents that higher capacity factor location could increase the electricity generation amount with the lower environmental impact.

5. Conclusions and Limitations

This paper focuses on the LCA of wind farms used for electricity generation in India. The wind farm is constructed using 10 VESTA V82 wind turbine in Karnataka state of India and this is considered for this analysis. From the present study, it is found that the total CO2 emissions are 11.3 kg CO2 -eq/MWh. The emissions are lower than 33.6 kg CO2-eq/MWh [47], 19.88 kg CO2-eq/MWh [51]. The recycling of material could reduce the overall environmental impact by 71–75%. The CO2 emissions are 19% higher using data in SimaPro LCA software compared with using GaBi LCA data. Total CO2 emissions for coal power are 85.4 times higher than those for wind power, making it a cleaner technology for electricity generation. Steel, aluminium and concrete make the greatest contributions for environmental impact among the materials of construction. These three materials together have 85.6%, 83.5%, 84.1% and 84.5% contribution for CO2, NOx, SO2 and PM2.5, respectively. The difference in total emissions for 30 years is 33.4% and 16.7% lower compared to 20 years and 25 years. Increasing the lifespan of the wind turbine with the same amount of materials could reduce the environmental consequences. This suggests that the lifetime increase in a wind turbine will increase the electricity production at a reduced GHG emission. This study also concludes that capacity factor is an important parameter for reducing the environmental impact. The higher capacity factor location could reduce the total emissions by 18.6% from the base study.
After decommissioning of the wind turbine, the recycling of the material could reduce the environmental impact. Steel, aluminium and concrete are the materials with the highest contribution for environmental impact. Increasing the lifespan of the wind turbine could reduce the environmental emission. Different geographic locations have different capacity factors, and larger capacity factors can reduce the environmental emissions.
This study mainly focuses on the life cycle of selected materials that make a higher contribution in a complete wind farm. It excludes the emissions from fuel during the transportation of wind turbine components due to data unavailability regarding the distance and type of transportation.
To obtain realistic results, sensitivity analysis is an important characteristic for LCA studies. Future work can be carried out by including the sensitivity analysis for a lifetime wind farm by varying the lifespan of the wind turbine and capacity factor at different locations. The wind energy industry is advancing day by day, and thus newer technologies are developing, with modifications in the tower and blade increasing the trend of gearless wind turbines to avoid frequent maintenance and early replacement of gearboxes with smaller lifespans. Future studies may conduct LCA on newer technology wind turbines.

Author Contributions

Methodology: A.R.P. and N.H.; Investigation: S.V.; Formal analysis: S.V., A.R.P. and N.H.; Data curation: S.V. and A.R.P.; Writing original draft preparation: S.V., Writing review and editing: S.V., A.R.P. and N.H. All authors have read and agreed to the published version of the manuscript.

Funding

This research received no external funding.

Data Availability Statement

The data presented in this study are available on request from the corresponding authors.

Conflicts of Interest

The authors declare no conflict of interest.

References

  1. The World Bank. Population Growth (Annual %)—India. Available online: data.worldbank.org (accessed on 3 October 2020).
  2. Gargiulo, A.; Carvalho, M.L.; Girardi, P. Life Cycle Assessment of Italian Electricity Scenarios to 2030. Energies 2020, 13, 3852. [Google Scholar] [CrossRef]
  3. CEA. Growth of Electricity Sector in India from 1947–2019; CEA: New Delhi, India, 2020. [Google Scholar]
  4. BP. Statistical Review of World Energy, 2019, 68th ed.; BP: London, UK, 2019. [Google Scholar]
  5. Munawer, M.E. Human health and environmental impacts of coal combustion and post-combustion wastes. J. Sustain. Min. 2018, 17, 87–96. [Google Scholar] [CrossRef]
  6. Yin, L.; Liao, Y.; Zhou, L.; Wang, Z.; Ma, X. Life cycle assessment of coal-fired power plants and sensitivity analysis of CO2 emissions from power generation side. IOP Conf. Ser. Mater. Sci. Eng. 2017, 199, 012055. [Google Scholar] [CrossRef] [Green Version]
  7. Odeh, N.A.; Cockerill, T.T. Life cycle analysis of UK coal fired power plants. Energy Convers. Manag. 2008, 49, 212–220. [Google Scholar] [CrossRef]
  8. Tang, L.; Yokoyama, T.; Kubota, H.; Shimota, A. Life cycle assessment of a pulverized coal-fired power plant with CCS technology in Japan. Energy Procedia 2014, 63, 7437–7443. [Google Scholar] [CrossRef] [Green Version]
  9. Martínez, E.; Sanz, F.; Pellegrini, S.; Jiménez, E.; Blanco, J. Life-cycle assessment of a 2-MW rated power wind turbine: CML method. Int. J. Life Cycle Assess. 2009, 14, 52. [Google Scholar] [CrossRef]
  10. Yang, J.; Chang, Y.; Zhang, L.; Hao, Y.; Yan, Q.; Wang, C. The life-cycle energy and environmental emissions of a typical offshore wind farm in China. J. Clean. Prod. 2018, 180, 316–324. [Google Scholar] [CrossRef]
  11. Xu, L.; Pang, M.; Zhang, L.; Poganietz, W.R.; Marathe, S.D. Life cycle assessment of onshore wind power systems in China. Resour. Conserv. Recycl. 2018, 132, 361–368. [Google Scholar] [CrossRef]
  12. EIA. Annual Energy Outlook 2019; U.S. Energy Information Administration: Washington, DC, USA, 2019.
  13. IEA. India 2020; IEA: Paris, France, 2020; Available online: https://www.iea.org/reports/india-2020 (accessed on 8 October 2020).
  14. IEA. Electricity Mix in India, January–August 2020; IEA: Paris, France, 2020; Available online: https://www.iea.org/data-andstatis-tics/charts/electricity-mix-in-india-january-august-2020 (accessed on 20 October 2020).
  15. IRENA. Renewable Capacity Statistics 2019; International Renewable Energy Agency: Abu Dhabi, United Arab Emirates, 2019; ISBN 978-92-9260-123-2. [Google Scholar]
  16. MNRE. Physical Progress; Ministry of New and Renewable Energy: New Delhi, India, 2019. Available online: https://mnre.gov.in/physical-progress-achievements (accessed on 20 October 2020).
  17. National Institute of Wind Energy. India’s Wind Potential Atlas at 120m agl; Ministry of New and Renewable Energy, Government of India: New Delhi, India, 2019.
  18. Verma, S.; Paul, A.R.; Haque, N. Assessment of Materials and Rare Earth Metals Demand for Sustainable Wind Energy Growth in India. Minerals 2022, 12, 647. [Google Scholar] [CrossRef]
  19. CEA. Summary of All India Provisional Renewable Energy Generation; CEA: New Delhi, India, 2019. [Google Scholar]
  20. Caduff, M.; Huijbregts, M.A.; Althaus, H.J.; Koehler, A.; Hellweg, S. Wind power electricity: The bigger the turbine, the greener the electricity? Environ. Sci. Technol. 2012, 46, 4725–4733. [Google Scholar] [CrossRef]
  21. Guezuraga, B.; Zauner, R.; Pölz, W. Life cycle assessment of two different 2 MW class wind turbines. Renew. Energy 2012, 37, 37–44. [Google Scholar] [CrossRef]
  22. Ardente, F.; Beccali, M.; Cellura, M.; Brano, V.L. Energy performances and life cycle assessment of an Italian wind farm. Renew. Sustain. Energy Rev. 2008, 12, 200–217. [Google Scholar] [CrossRef]
  23. Oebels, K.B.; Pacca, S. Life cycle assessment of an onshore wind farm located at the north eastern coast of Brazil. Renew. Energy 2013, 53, 60–70. [Google Scholar] [CrossRef]
  24. Xie, J.B.; Fu, J.X.; Liu, S.Y.; Hwang, W.S. Assessments of carbon footprint and energy analysis of three wind farms. J. Clean. Prod. 2020, 254, 120159. [Google Scholar] [CrossRef]
  25. Simons, P.J.; Cheung, W.M. Development of a quantitative analysis system for greener and economically sustainable wind farms. J. Clean. Prod. 2016, 133, 886–898. [Google Scholar] [CrossRef]
  26. Verma, S.; Paul, A.R.; Jain, A. Performance investigation and energy production of a novel horizontal axis wind turbine with winglet. Int. J. Energy Res. 2022, 46, 4947–4964. [Google Scholar] [CrossRef]
  27. Verma, S.; Paul, A.R. Power augmentation in H-Type Darrieus wind turbine using wind lens. J. Phys. Conf. Ser. 2022, 2217, 012040. [Google Scholar] [CrossRef]
  28. Loganathan, B.; Chowdhury, H.; Allehibi, H.; Alam, F.; Paul, A.R. A Micro Multi-blade Vertical Axis Wind Turbine for Built-Up Areas. In Proceedings of the 16th Asian Congress of Fluid Mechanics, Bangalore, India, 13–17 December 2019; Springer: Singapore, 2021; pp. 149–157. [Google Scholar] [CrossRef]
  29. Verma, S.; Paul, A.R.; Jain, A.; Alam, F. Numerical investigation of stall characteristics for winglet blade of a horizontal axis wind turbine. E3S Web Conf. 2021, 321, 03004. [Google Scholar] [CrossRef]
  30. Kadiyala, A.; Kommalapati, R.; Huque, Z. Characterization of the life cycle greenhouse gas emissions from wind electricity generation systems. Int. J. Energy Environ. Eng. 2017, 8, 55–64. [Google Scholar] [CrossRef] [Green Version]
  31. Arceo, A.; Biswas, W.; Rosano, M. Review of Tools for Sustainability Assessment of Renewable Energy Technologies for Remote Area Power Supply. J. Fundam. Renew. Energy Appl. 2018, 8, 2. [Google Scholar] [CrossRef]
  32. Schleisner, L. Life cycle assessment of a wind farm and related externalities. Renew. Energy 2000, 20, 279–288. [Google Scholar] [CrossRef]
  33. Kabir, M.R.; Rooke, B.; Dassanayake, G.M.; Fleck, B.A. Comparative life cycle energy, emission, and economic analysis of 100 kW nameplate wind power generation. Renew. Energy 2012, 37, 133–141. [Google Scholar] [CrossRef]
  34. Vargas, A.V.; Zenón, E.; Oswald, U.; Islas, J.M.; Güereca, L.P.; Manzini, F.L. Life cycle assessment: A case study of two wind turbines used in Mexico. Appl. Therm. Eng. 2015, 75, 1210–1216. [Google Scholar] [CrossRef]
  35. Wang, Y.; Sun, T. Life cycle assessment of CO2 emissions from wind power plants: Methodology and case studies. Renew. Energy 2012, 43, 30–36. [Google Scholar] [CrossRef]
  36. Li, H.; Jiang, H.D.; Dong, K.Y.; Wei, Y.M.; Liao, H. A comparative analysis of the life cycle environmental emissions from wind and coal power: Evidence from China. J. Clean. Prod. 2019, 248, 119192. [Google Scholar] [CrossRef]
  37. Al-Behadili, S.H.; El-Osta, W.B. Life cycle assessment of Dernah (Libya) wind farm. Renew. Energy 2015, 83, 1227–1233. [Google Scholar] [CrossRef]
  38. Chipindula, J.; Botlaguduru, V.S.V.; Du, H.; Kommalapati, R.R.; Huque, Z. Life cycle environmental impact of onshore and offshore wind farms in Texas. Sustainability 2018, 10, 2022. [Google Scholar] [CrossRef] [Green Version]
  39. Alsaleh, A.; Sattler, M. Comprehensive life cycle assessment of large wind turbines in the US. Clean Technol. Environ. Policy 2019, 21, 887–903. [Google Scholar] [CrossRef]
  40. Schreiber, A.; Marx, J.; Zapp, P. Comparative life cycle assessment of electricity generation by different wind turbine types. J. Clean. Prod. 2019, 233, 561–572. [Google Scholar] [CrossRef]
  41. Wang, W.C.; Teah, H.Y. Life cycle assessment of small-scale horizontal axis wind turbines in Taiwan. J. Clean. Prod. 2017, 141, 492–501. [Google Scholar] [CrossRef]
  42. Gomaa, M.R.; Rezk, H.; Mustafa, R.J.; Al-Dhaifallah, M. Evaluating the Environmental Impacts and Energy Performance of a Wind Farm System Utilizing the Life-Cycle Assessment Method: A Practical Case Study. Energies 2019, 12, 3263. [Google Scholar] [CrossRef] [Green Version]
  43. Demir, N.; Taşkın, A. Life cycle assessment of wind turbines in Pınarbaşı-Kayseri. J. Clean. Prod. 2013, 54, 253–263. [Google Scholar] [CrossRef]
  44. Ozoemena, M.; Cheung, W.M.; Hasan, R. Comparative LCA of technology improvement opportunities for a 1.5-MW wind turbine in the context of an onshore wind farm. Clean Technol. Environ. Policy 2018, 20, 173–190. [Google Scholar] [CrossRef] [Green Version]
  45. Stavridou, N.; Koltsakis, E.; Baniotopoulos, C.C. A comparative life-cycle analysis of tall onshore steel wind-turbine towers. Clean Energy 2020, 4, 48–57. [Google Scholar] [CrossRef]
  46. Gkantou, M.; Rebelo, C.; Baniotopoulos, C. Life cycle assessment of tall onshore hybrid steel wind turbine towers. Energies 2020, 13, 3950. [Google Scholar] [CrossRef]
  47. Teffera, B.; Assefa, B.; Björklund, A.; Assefa, G. Life cycle assessment of wind farms in Ethiopia. Int. J. Life Cycle Assess. 2021, 26, 76–96. [Google Scholar] [CrossRef]
  48. Kouloumpis, V.; Sobolewski, R.A.; Yan, X. Performance and life cycle assessment of a small-scale vertical axis wind turbine. J. Clean. Prod. 2020, 247, 119520. [Google Scholar] [CrossRef]
  49. Nagle, A.J.; Delaney, E.L.; Bank, L.C.; Leahy, P.G. A Comparative Life Cycle Assessment between landfilling and Co-Processing of waste from decommissioned Irish wind turbine blades. J. Clean. Prod. 2020, 277, 123321. [Google Scholar] [CrossRef]
  50. Bi, X.; Yang, J.; Yang, S. LCA-Based Regional Distribution and Transference of Carbon Emissions from Wind Farms in China. Energies 2022, 15, 198. [Google Scholar] [CrossRef]
  51. Xu, K.; Chang, J.; Zhou, W.; Li, S.; Shi, Z.; Zhu, H.; Chen, Y.; Guo, K. A comprehensive estimate of life cycle greenhouse gas emissions from onshore wind energy in China. J. Clean. Prod. 2022, 338, 130683. [Google Scholar] [CrossRef]
  52. Doerffer, K.; Bałdowska-Witos, P.; Pysz, M.; Doerffer, P.; Tomporowski, A. Manufacturing and Recycling Impact on Environmental Life Cycle Assessment of Innovative Wind Power Plant. Part 1/2. Materials 2021, 14, 220. [Google Scholar] [CrossRef] [PubMed]
  53. Morini, A.A.; Ribeiro, M.J.; Hotza, D. Carbon footprint and embodied energy of a wind turbine blade—A case study. Int. J. Life Cycle Assess. 2021, 26, 1177–1187. [Google Scholar] [CrossRef]
  54. ISO 14044; Environmental Management–Life Cycle Assessment–Requirements and Guidelines. International Organisation for Standardisation (ISO): Geneva, Switzerland, 2006.
  55. Wang, S.; Wang, S.; Liu, J. Life-cycle green-house gas emissions of onshore and offshore wind turbines. J. Clean. Prod. 2019, 210, 804–810. [Google Scholar] [CrossRef]
  56. The Wind Power. Wind Energy Market Intelligence. Available online: https://www.thewindpower.net/windfarm_en_26892_anabaru.php (accessed on 18 August 2020).
  57. Schmidt, A. Life cycle assessment of electricity produced from onshore sited wind power plants based on Vestas V82-1.65 MW turbines. In Vestas Reports 2007; Vestas: Aarhus, Denmark, 2007. [Google Scholar]
  58. ICF International. Capacity Value of Wind Generation in India—An Assessment; ICF: Fairfax, VA, USA., 2014. [Google Scholar]
  59. SimaPro, Version 9.0.0.33; SimaPro: Utrecht, The Netherlands, 2019.
  60. GaBi Software and Database for Life Cycle Assessment. Available online: http://www.gabi-software.com (accessed on 20 August 2020).
  61. Union of Concerned Scientists. Environmental Impacts of Solar Power. 2013. Available online: https://www.ucsusa.org/resources/environmental-impacts-solar-power (accessed on 18 May 2022).
Figure 1. System boundary for wind power.
Energies 15 03944 g001
Figure 2. Breakdown of materials in a wind farm [57].
Energies 15 03944 g002
Figure 3. Different pollutant emissions from an Indian wind farm.
Energies 15 03944 g003
Figure 4. Emissions from landfilling after recycling of the material.
Energies 15 03944 g004
Figure 5. Comparison of CO2 emissions from 1.65 MW wind turbine for a wind farm [35,57].
Energies 15 03944 g005
Figure 6. Life cycle emissions from different materials used in wind turbine production.
Energies 15 03944 g006
Figure 7. Pollutant emissions at the different life cycles of the wind farm.
Energies 15 03944 g007
Figure 8. Variation in CO2 emissions at the varying capacity factor.
Energies 15 03944 g008
Table 1. CO2 emissions for wind power at different locations.
ReferencesTurbine CapacityLocationWind Farm SiteLife (Years)Capacity Factor (%)CO2 Emission
(gCO2-eq/kWh)
Kabir et al. [33]5 KW
20 kW
100 kW
CanadaOnshore2523
22
24
42.7
25.1
17.8
Oebels and Pacca [23]1.5 MWBrazilOnshore2034.257.1
Al-Behadili and El-Osta [37]1.65 MWLibyaOnshore20-10.42
Yang et al. [20]3.6 MW
5 MW
ChinaOffshore25-25.5
Chipindula et al. [38] 20
1–2.3 MW Onshore305.63–7.13
2–2.3 MW Offshore456.23–9.11
Texas(Shallow water)
Gulf CoastOffshore
2.3–5 MW (Deepwater)476.98–7.58
Alsaleh and Sattler [39]2 MWUSAOnshore20
25
30
-52.7
42.2
35.3
Table 2. LCI data for 10 wind turbines in a wind farm [57].
ComponentsSub-ComponentsMaterialsQuantity (Tonnes)
TurbineRotorEpoxy, fibre glass, birchwood, 252
Balsawood etc
Cast Iron113
Steel42
Steel Engineering (Tool Steel)15
NacelleCast Iron180
Steel63
Steel Engineering (Tool Steel)130
Stainless Steel78
Copper16
Fibre Glass18
Plastic10
Aluminium5
Electronics3
Oil3
TowerSteel1260
Aluminium26
Electronics22
Plastic20
Copper13
Oil10
FoundationConcrete8050
Steel270
Internal cables Aluminium3.5
Plastic3
Copper1.7
Transformer station Steel5
Copper1.3
Transformer Oil2.1
Others1.1.
Plastic83.5
External cables Aluminium52.4
Copper13.1
Table 3. Result assessment of wind and coal power.
Power System/
Emission Factor
Capacity ValueCO2
(kg-eq./MWh)
NOX
(kg-eq./MWh)
SO2
(kg-eq./MWh)
PM2.5
(kg-eq./MWh)
Wind power system24%11.30.0370.0450.014
Coal
power plant
70%9654.773.260.092
PV
power
plant
-32–82-----
CSP
Power
plant
-36–91---
Publisher’s Note: MDPI stays neutral with regard to jurisdictional claims in published maps and institutional affiliations.

