Article

Influence of Measurement Methodologies for the Volumetric Air Flow Rate of Mobile Positive Pressure Fans on Drive Unit Performance

1
Scientific and Research Centre for Fire Protection, National Research Institute, 05-420 Józefów, Poland
2
Institute of Machine Design, Faculty of Mechanical Engineering, Poznań University of Technology, 60-965 Poznań, Poland
*
Author to whom correspondence should be addressed.
Energies 2022, 15(11), 3953; https://doi.org/10.3390/en15113953
Submission received: 19 April 2022 / Revised: 16 May 2022 / Accepted: 24 May 2022 / Published: 27 May 2022

Abstract

:
Since there are no legally defined testing requirements for mobile positive pressure fans, they may be tested based on methods that do not correspond to their actual operating conditions. Adequate assessment of the technical and operating conditions for this type of equipment is particularly important for equipment used in rescue operations. Such units should be characterized by efficient and reliable operation. This article investigates the influence of measurement methods of the volumetric airflow rate on the performance of a power unit. The article shows that the applied measurement method, whether it is PN-EN ISO 5801 (test conditions in a pipe duct—Method A) or other methods, i.e., ANSI/AMCA 240-15 and testing of the characteristics of the velocity profile (tests in open flow—Method B), can cause differences in the power demand of fans of from 3.2% to 4.5%. The differences in the requirements of propulsion power translate into fuel consumption and emissions of harmful exhaust gases generated by the combustion drive units (4 kW). It was also observed that fans with conventional impellers (W1) show a lower power demand when applying Method B (open flow) tests, while fans with turbo impellers (W2) show a lower power demand when Method A (duct) tests are applied. Comparative analysis of the parameters of the drive unit in the test group of fans without taking into account the measurement method can cause errors of up to about 7.7%, 6.4%, and 2.4% for the power, torque, and speed, respectively.

1. Introduction

The testing of machine and equipment characteristics requires the use of unified standards to enable comparison. Hence, standardized testing is provided for many machines and equipment. Often, such tests are performed by accredited laboratories that perform tests under conditions similar to the actual operating conditions of the machine or equipment. However, the adopted laboratory methodology does not always coincide with the results of the tests in real working conditions. An example of such tests available in the literature are tests of vehicles equipped with internal combustion engines, where differences can be noticed in the values of the exhaust gas emissions of machines and vehicles tested during laboratory tests (reproducing real working conditions) and road tests (real working conditions) [1,2,3,4]. Thus, the test methods used should allow for comparisons between the machines and equipment being tested, but they should also be characterized by the best possible reproduction of real working conditions to ensure their reliability.
Machines and equipment used in hazardous working conditions or characterized by work with particularly high responsibility are subject to additional control tests before they are put for sale [5]. Examples of such devices include tools used by fire protection units. In Poland, as well as in many countries around the world, the results of laboratory tests carried out for the purposes of admittance and certification processes of such products are decisive for the admittance for use of devices and vehicles by fire protection units [6,7]. Unfortunately, no testing methods have yet been implemented for mobile fans to comprehensively evaluate their performance. This, of course, does not prevent the increasingly common use of the equipment in question during rescue and firefighting operations. At the same time, it seems that there is no need to justify in detail the legitimacy of efforts to create test stands and research methodologies that would make it possible to determine the operational parameters of the fans under consideration and to assess their suitability for work in extreme conditions [8,9,10,11,12].
Research results are available in the literature showing a wide range of applications of the mobile positive pressure fans used by fire protection units [13,14,15]. There is, however, no doubt that an equally important aspect is the implementation of laboratory tests allowing for proper evaluation of the products intended for use in extreme conditions. Due to the nature of the use of this type of equipment (work in a dangerous fire environment to save people and property), it is very important that the parameters determining their effectiveness are properly verified. In this context, special attention should be focused on, among other things, the features related to mobility (ease of handling), durability, resistance to conditions occurring in the fire environment, amount of generated air flow, and other parameters such as the shape of the generated jet.
One of the studied characteristics, which mainly determines the performance of mobile positive pressure fans, is the volumetric airflow rate. The value of this parameter is, in turn, derived from such components as motor power, rotor diameter, the way it is made (including blade shape, profile, chord, and angle of inclination with respect to the rotational plane), and the type of rotor enclosure [16].
The quality of the pumped air stream in such a device should be verified in terms of its ability to produce flow through the ventilated volumes. This ability, in turn, mainly depends on the momentum of the generated jet. Fan units that produce a less turbulent jet will be able to pump air masses over longer distances due to reduced jet speed attrition. On the other hand, fans characterized by more turbulent flow may work less efficiently—the jet they produce in the presence of turbulence (where there will be an increase in the mass of the air stream through strong induction of air from the environment) will lose velocity much faster and may also change the direction of the flow.
There are many methodologies that can be used for testing aerodynamic performance. Depending on which methodology is selected for testing, the obtained results may vary significantly, and their misinterpretation may mislead potential users about the products’ actual usefulness in rescue operations. Therefore, it is very important that the selected methodology reflects as closely as possible the potential operating conditions of the mobile fan during rescue operations.
In 2021, Kaczmarzyk et al. described methods for testing the aerodynamic performance of mobile positive pressure fans used in rescue operations [16]. In this study, methods were selected to evaluate the flow rate in pipe ducts (Method A), i.e., PN-EN ISO 5801 [17], and in open flow (Method B), i.e., tests according to ANSI/AMCA 240-15 [18] and testing of the characteristics of the velocity profile of the air jet [16].
By design, Method A is prepared in such a manner as to evaluate fans operating in ducted systems, such as air handling units. Therefore, the authors of [16] do not recommend its use to evaluate the aerodynamic performance of mobile fans operating in real free-flow conditions. On the other hand, Method B tests are applied to evaluate flow rates under real application conditions. The first test, designed by the American National Standard Institute, is described in ANSI/AMCA Test Standard 240—Laboratory Methods of Testing Positive Pressure Ventilators for Aerodynamic Performance Rating [18]. The test performed under this standard involves positioning a mobile positive pressure fan (under free-flow conditions) at a specified distance in front of a door opening of a test chamber in which flow straighteners, standardized nozzles, and multipoint static pressure measuring apparatus are located.
The second test (evaluation of the characteristics of the velocity profile of the air stream [16]) is a test that allows for measuring the value of the air stream velocity generated by a fan positioned at a certain distance in front of the measuring plane. The test stand consists of a suitably made frame, which serves as a plane for measuring the velocity value of the rushing air stream, generated by a mobile fan located at a suitable distance in the open flow. The advantage of this test is the possibility to introduce obstacles (e.g., a wall fragment with an opening) between the fan and the measuring plane. In 2021, Kaczmarzyk et al. suggested that Method B is suitable for testing the described devices [16] because they best reflect the actual operating conditions of mobile fans, including geometric parameters related to positioning of the fan, i.e., positioning distance or impeller angle. Additionally, Fritsche et al. in 2018 indicated that the manufacturers’ declared volumetric airflow rate values for mobile fans may differ from the actual ones due to the lack of a standardized test methodology for testing this type of equipment [19].
In the existing body of knowledge and resources of research tools, there are methods and detailed analyses regarding the volumetric flow rates of mobile fans, aimed at evaluating the generated airflow. However, no studies have demonstrated the effect of the test method on the evaluated performance of the power unit. Tests that do not accurately represent the actual operating conditions can lead to incorrect conclusions, not only in terms of the generated air flow, but also in terms of the characteristics of the drive unit, such as fuel consumption and emissions of harmful exhaust gas. This article presents an analysis of the effect of the test method (Methods A and B) on the operating conditions of the power unit. Mobile positive pressure fans equipped with internal combustion engines were tested by recording the variations in torque, speed, and power parameters at the engine shaft depending on the conditions required by the measurement method. Changes in these conditions can translate directly into changes in the consumption of energy, e.g., fuel, and emissions of harmful exhaust compounds. In addition, the article presents a characterization of the volume flow rate (Method A) for mobile fans.

2. Materials and Methods

Mobile positive pressure fans commonly used in rescue and firefighting actions were tested. The first one is a conventional fan (W1) [20], and the second one is a fan referred to in firefighting nomenclature as a turbo type (W2) [21] (Figure 1). These devices are characterized by an internal combustion power unit, classified in the European Union as non-road machines, regulated as described in Regulation 2016/1628/EU [22]. The characteristics of the fans and drive units are shown in Table 1. A common feature of the fans is a similar power range of the drive units of about 4 kW.
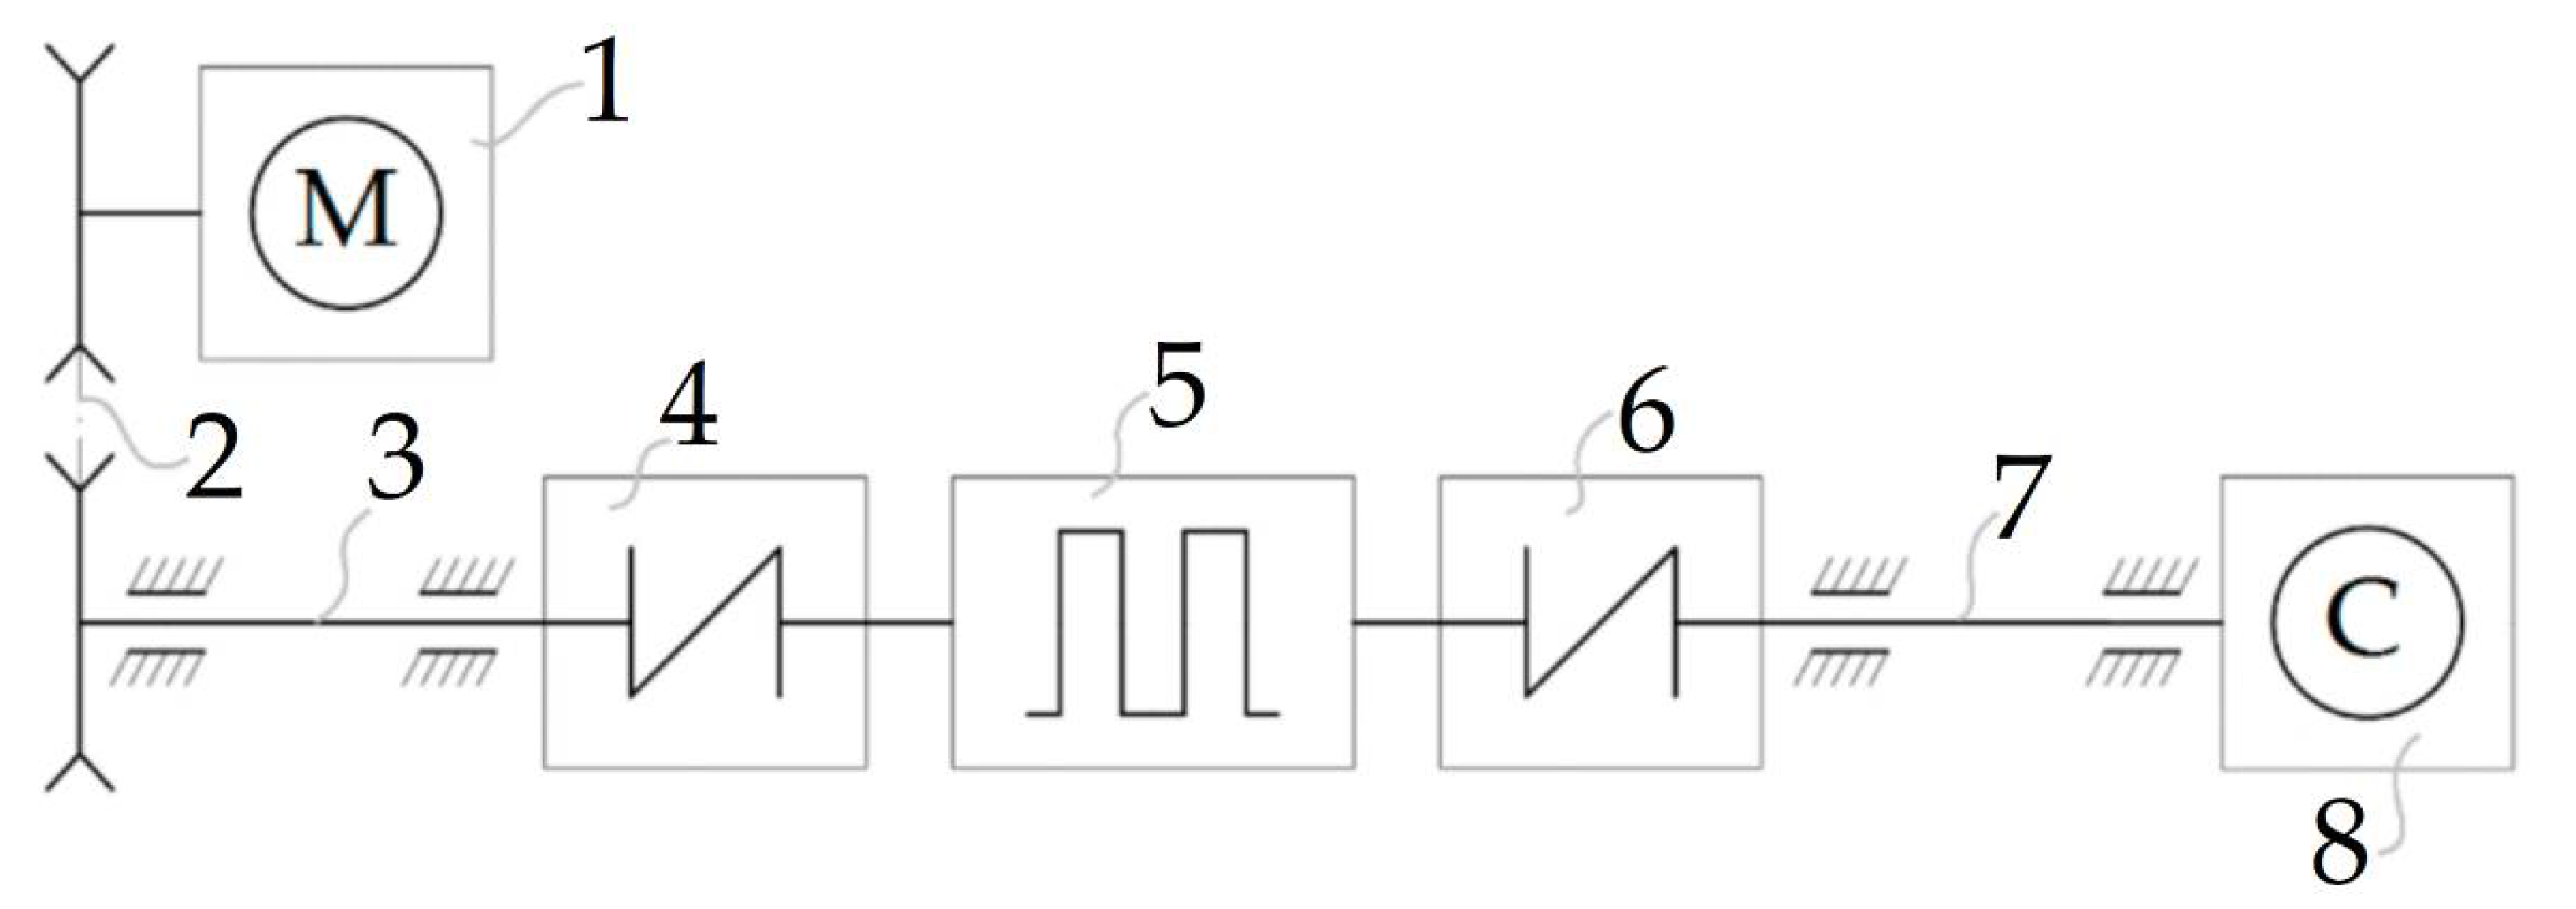
Torque and speed measurements, based on which power was determined, were carried out on a specially prepared measuring stand (Figure 2). A measuring system with a torque meter (Electronic Workshop Roman Pomianowski, Poznań, Poland) extended with a speed measuring system was inserted between the motor and the fan rotor. Connecting these components required a belt transmission (which also acts as an overload clutch), flexible couplings, and intermediate shafts. The influence of the given (rubber) elements was considered in the torque analysis; a detailed analysis of these factors is described in a methodologically similar publication [23].
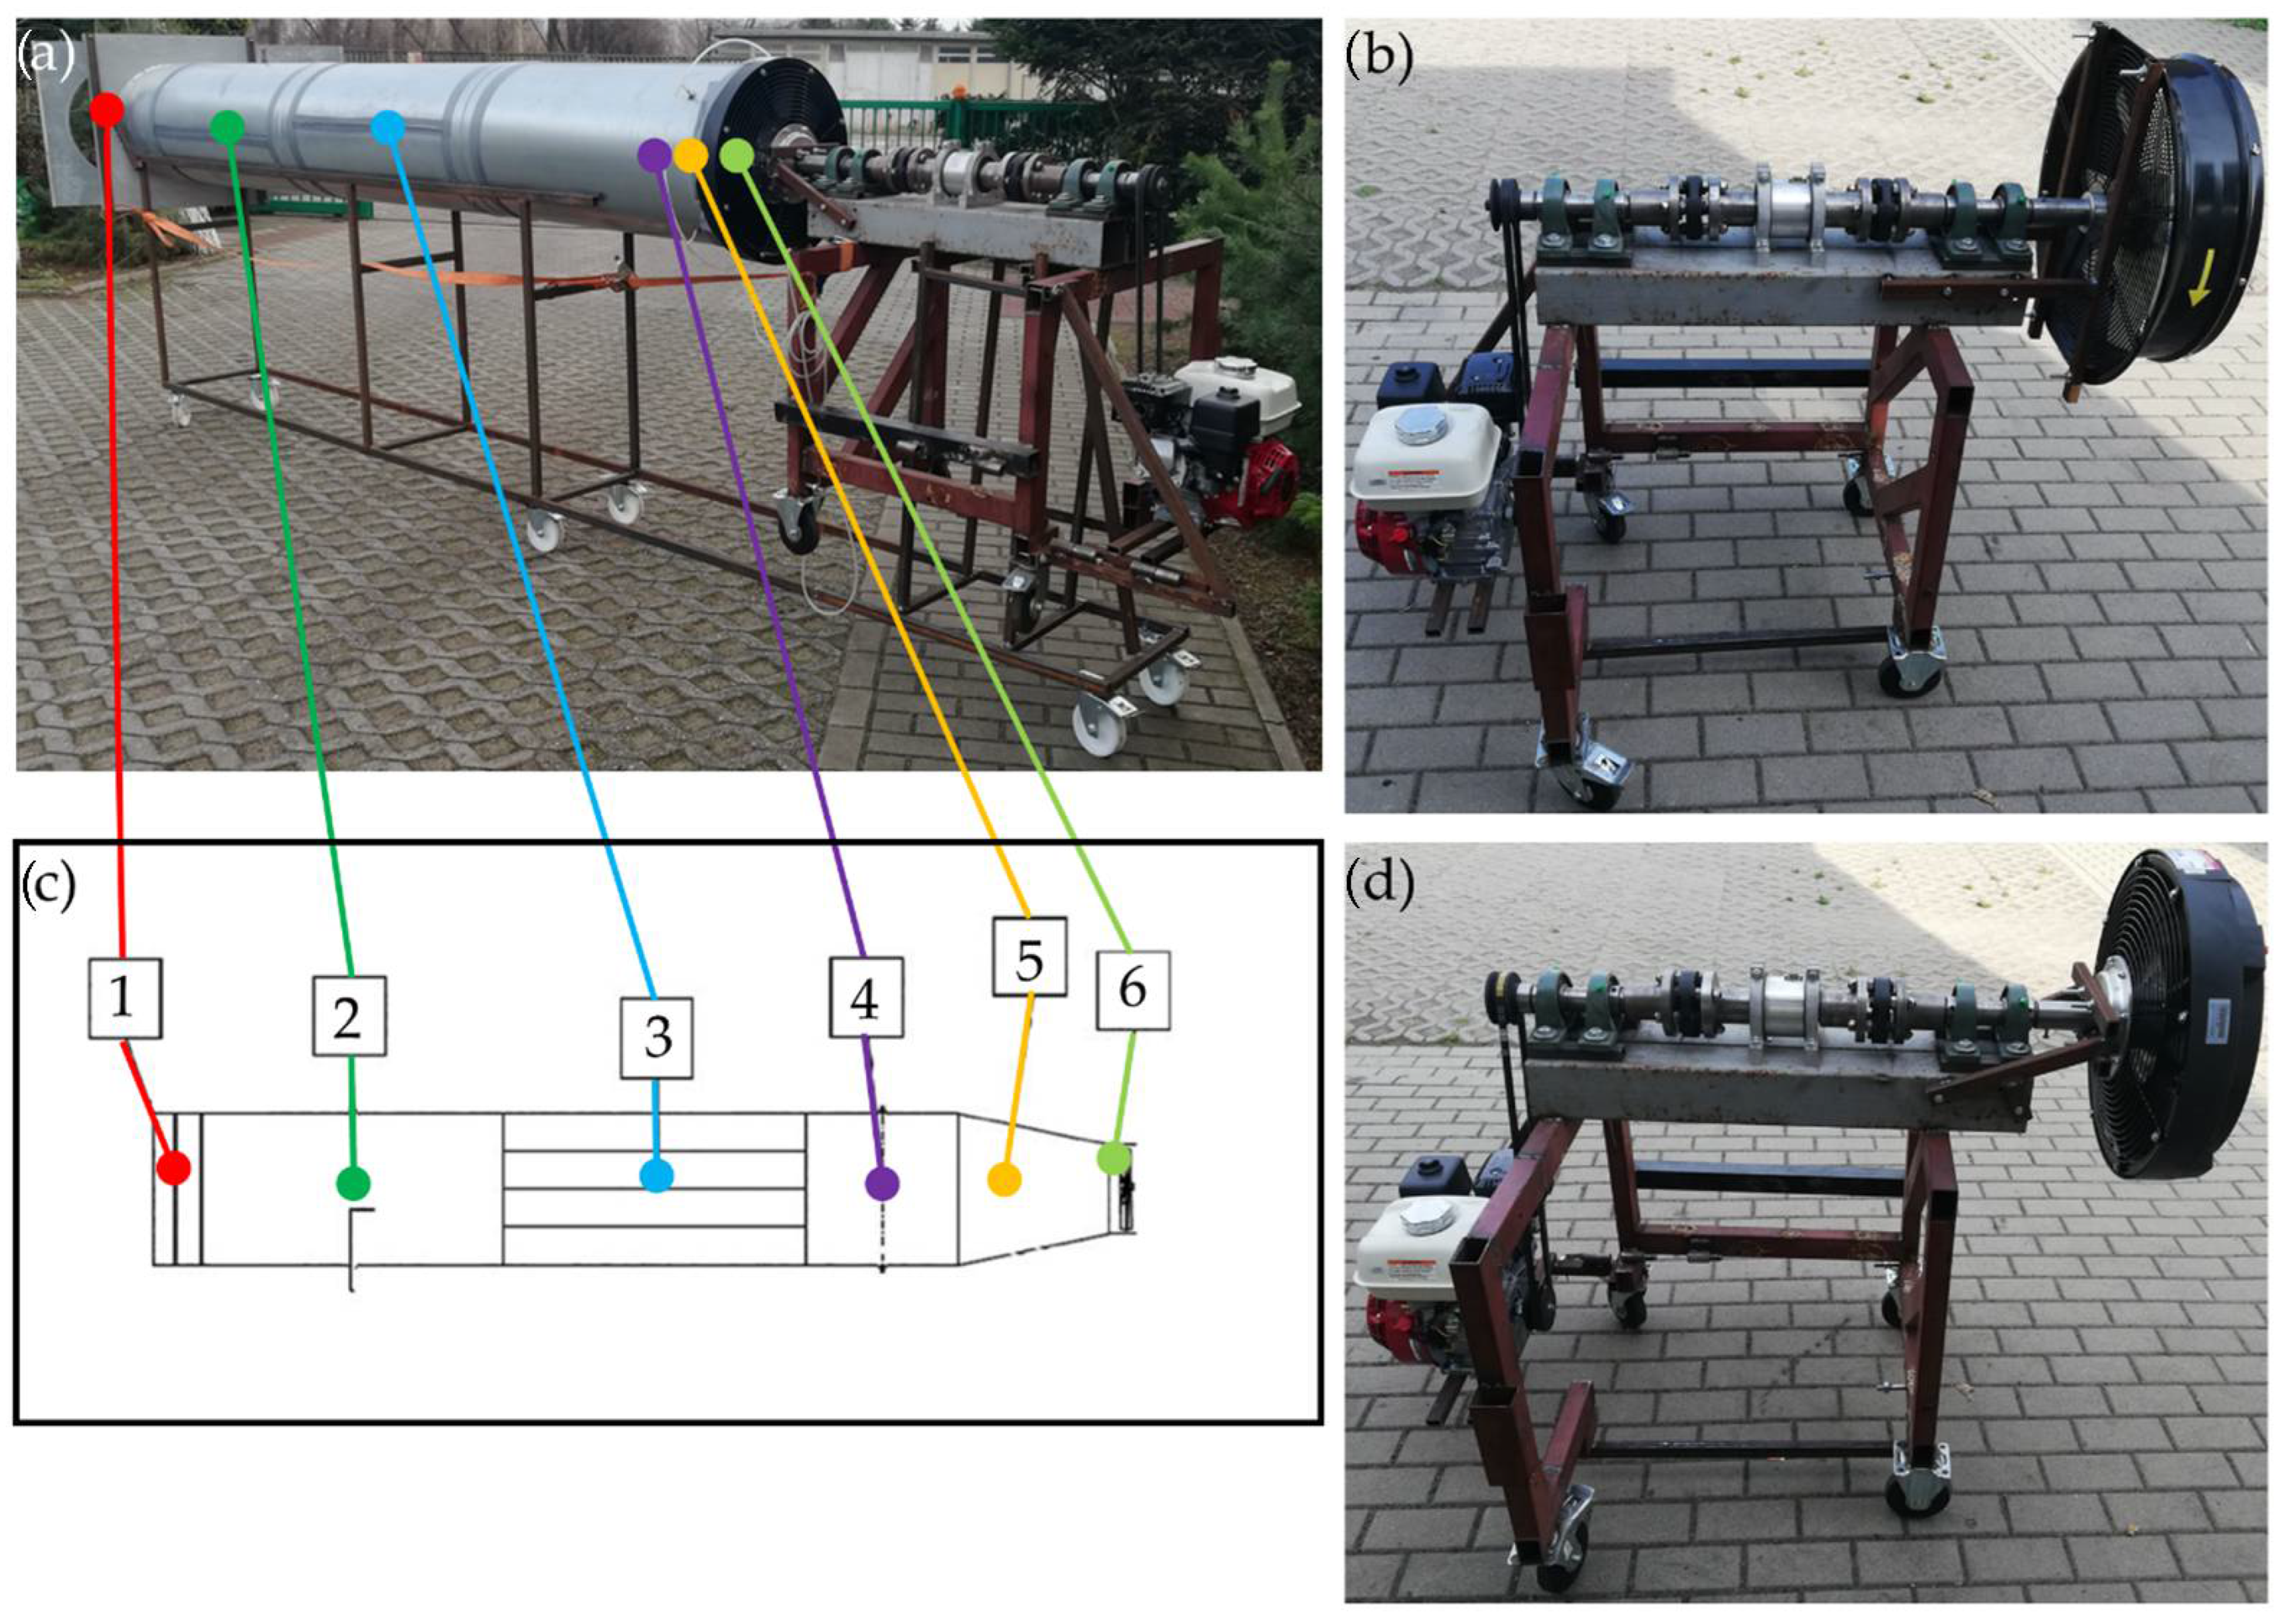
A mobile positive pressure fan equipped with a torque, speed, and power measurement system was tested under flow test conditions appropriate to Methods A and B. During the tests using Method A, mobile positive pressure fans were coupled to a station for measuring the flow rate of the generated air stream (flow measurement in the tube duct) (Figure 3a,c), whereas when tested using Method B (open flow measurement), the fan was operated in an open space (Figure 3b,d). The main research concerned the measurement of the driving power. Additional tests of volumetric flow rate were performed only with Method A, extended by measuring the flow characteristics with the use of a throttling device. Volumetric flow rate studies were not performed for Method B; only the drive power was tested under the operating conditions corresponding to this test.
The measurement under the conditions of Method A was performed on a test stand made in accordance with the PN-EN ISO 5801 standard (Figure 3). According to the standard, the test stand (dedicated to determining the characteristics of the volumetric air flow) belongs to the type B category, i.e., a free inlet, ducted outlet. The elements of the test stand include a confusor, designed for stable mounting of the fan’s rotor to the duct. Then, behind the confusor, there is the static pressure measurement area (four-point ring). Static pressure is measured using Setra transducers with a measuring range of ±1 inch water column. Another element of the test stand is the flow straightener (star configuration). Directly behind the flow straightener, there is a measuring area for the static and dynamic pressure values. This measurement was carried out with a Prandtl tube, using the traverse method (14 points located on the cross-sectional surface of the channel) according to ISO 3966 [24]. During the additional test determining the characteristics of the volumetric air flow rate, the stand was equipped with a throttling device (located at the end of the duct). During tests using the throttle, its configuration was set to the 10 positions shown in Figure 4 and Table 2.
The measurement according to Method B was performed under free-flow conditions. In our tests, the mechanical power of the fans was examined under the same conditions as during the Method A tests, but no volumetric flow rate tests were performed.
The tests for the conditions corresponding to Methods A and B were carried out in a 1500 m3 test hall, thanks to which it was possible to ensure stable environmental conditions (constant temperature 21 ± 1 °C, speed 41 ± 2%).
In the analysis of the measurement error, the arithmetic mean was taken as the estimator of the desired value, and the standard deviation of the arithmetic mean was taken as the error of the estimator.

3. Results and Discussion

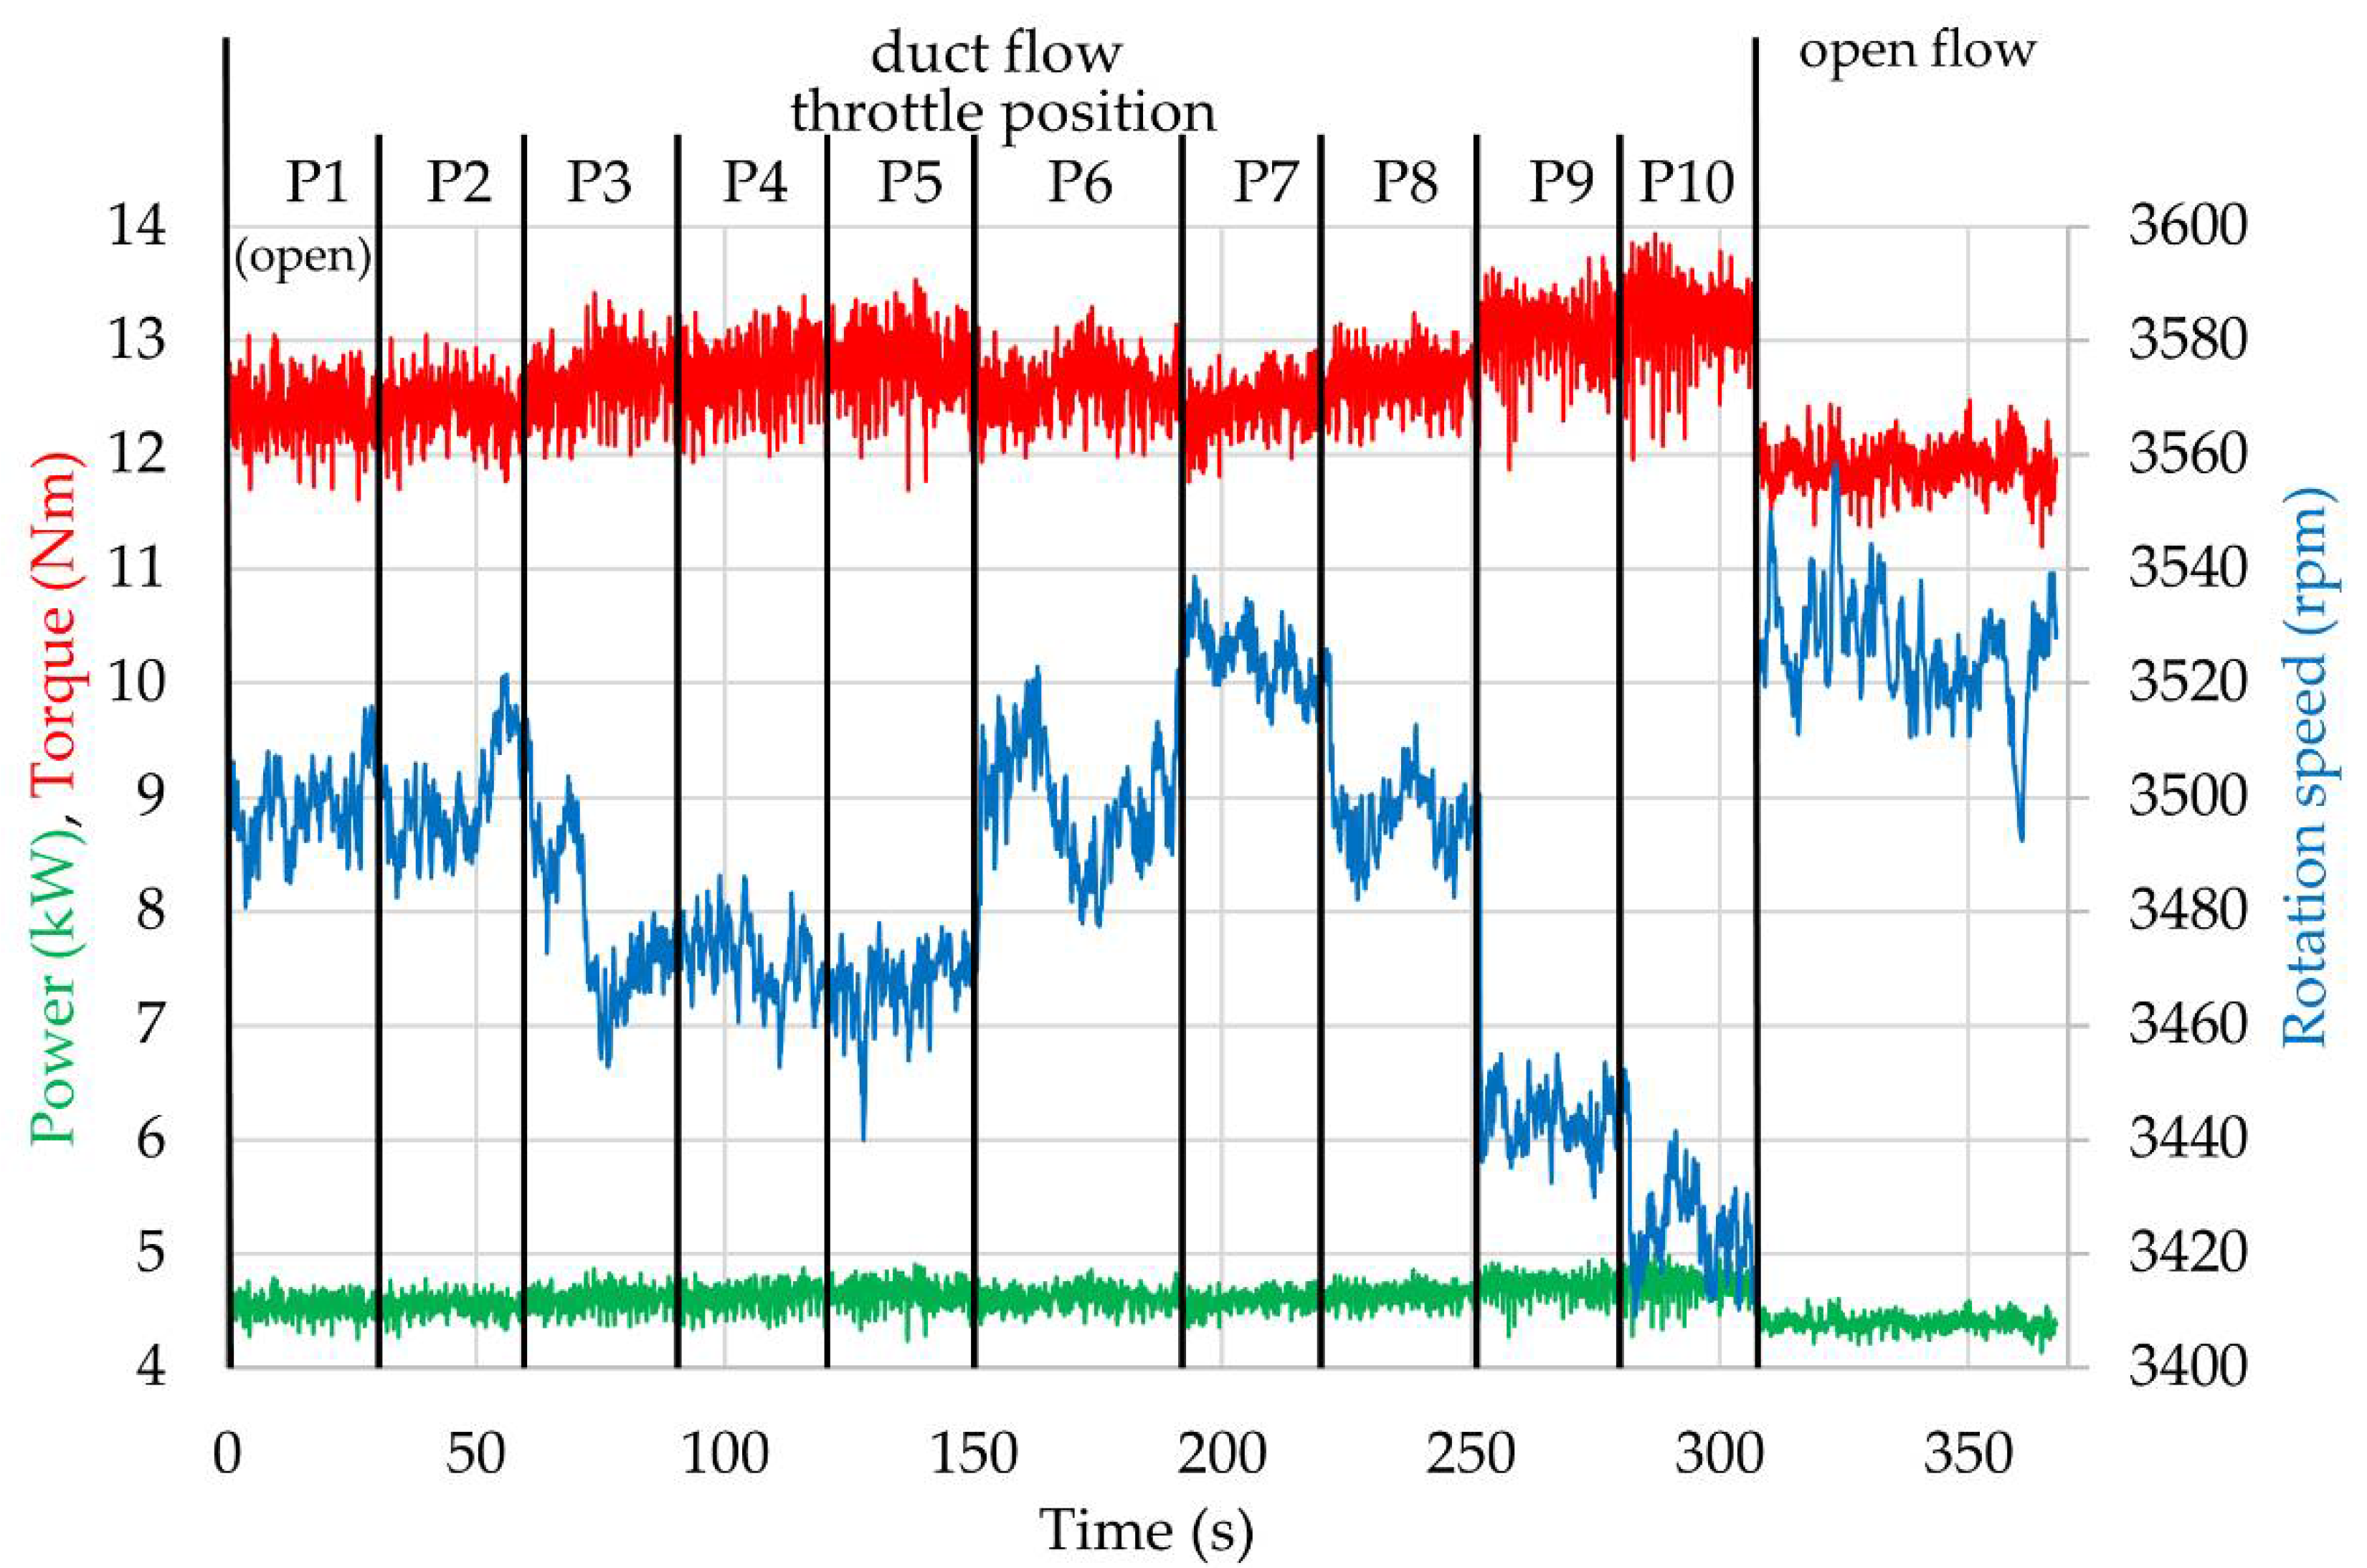
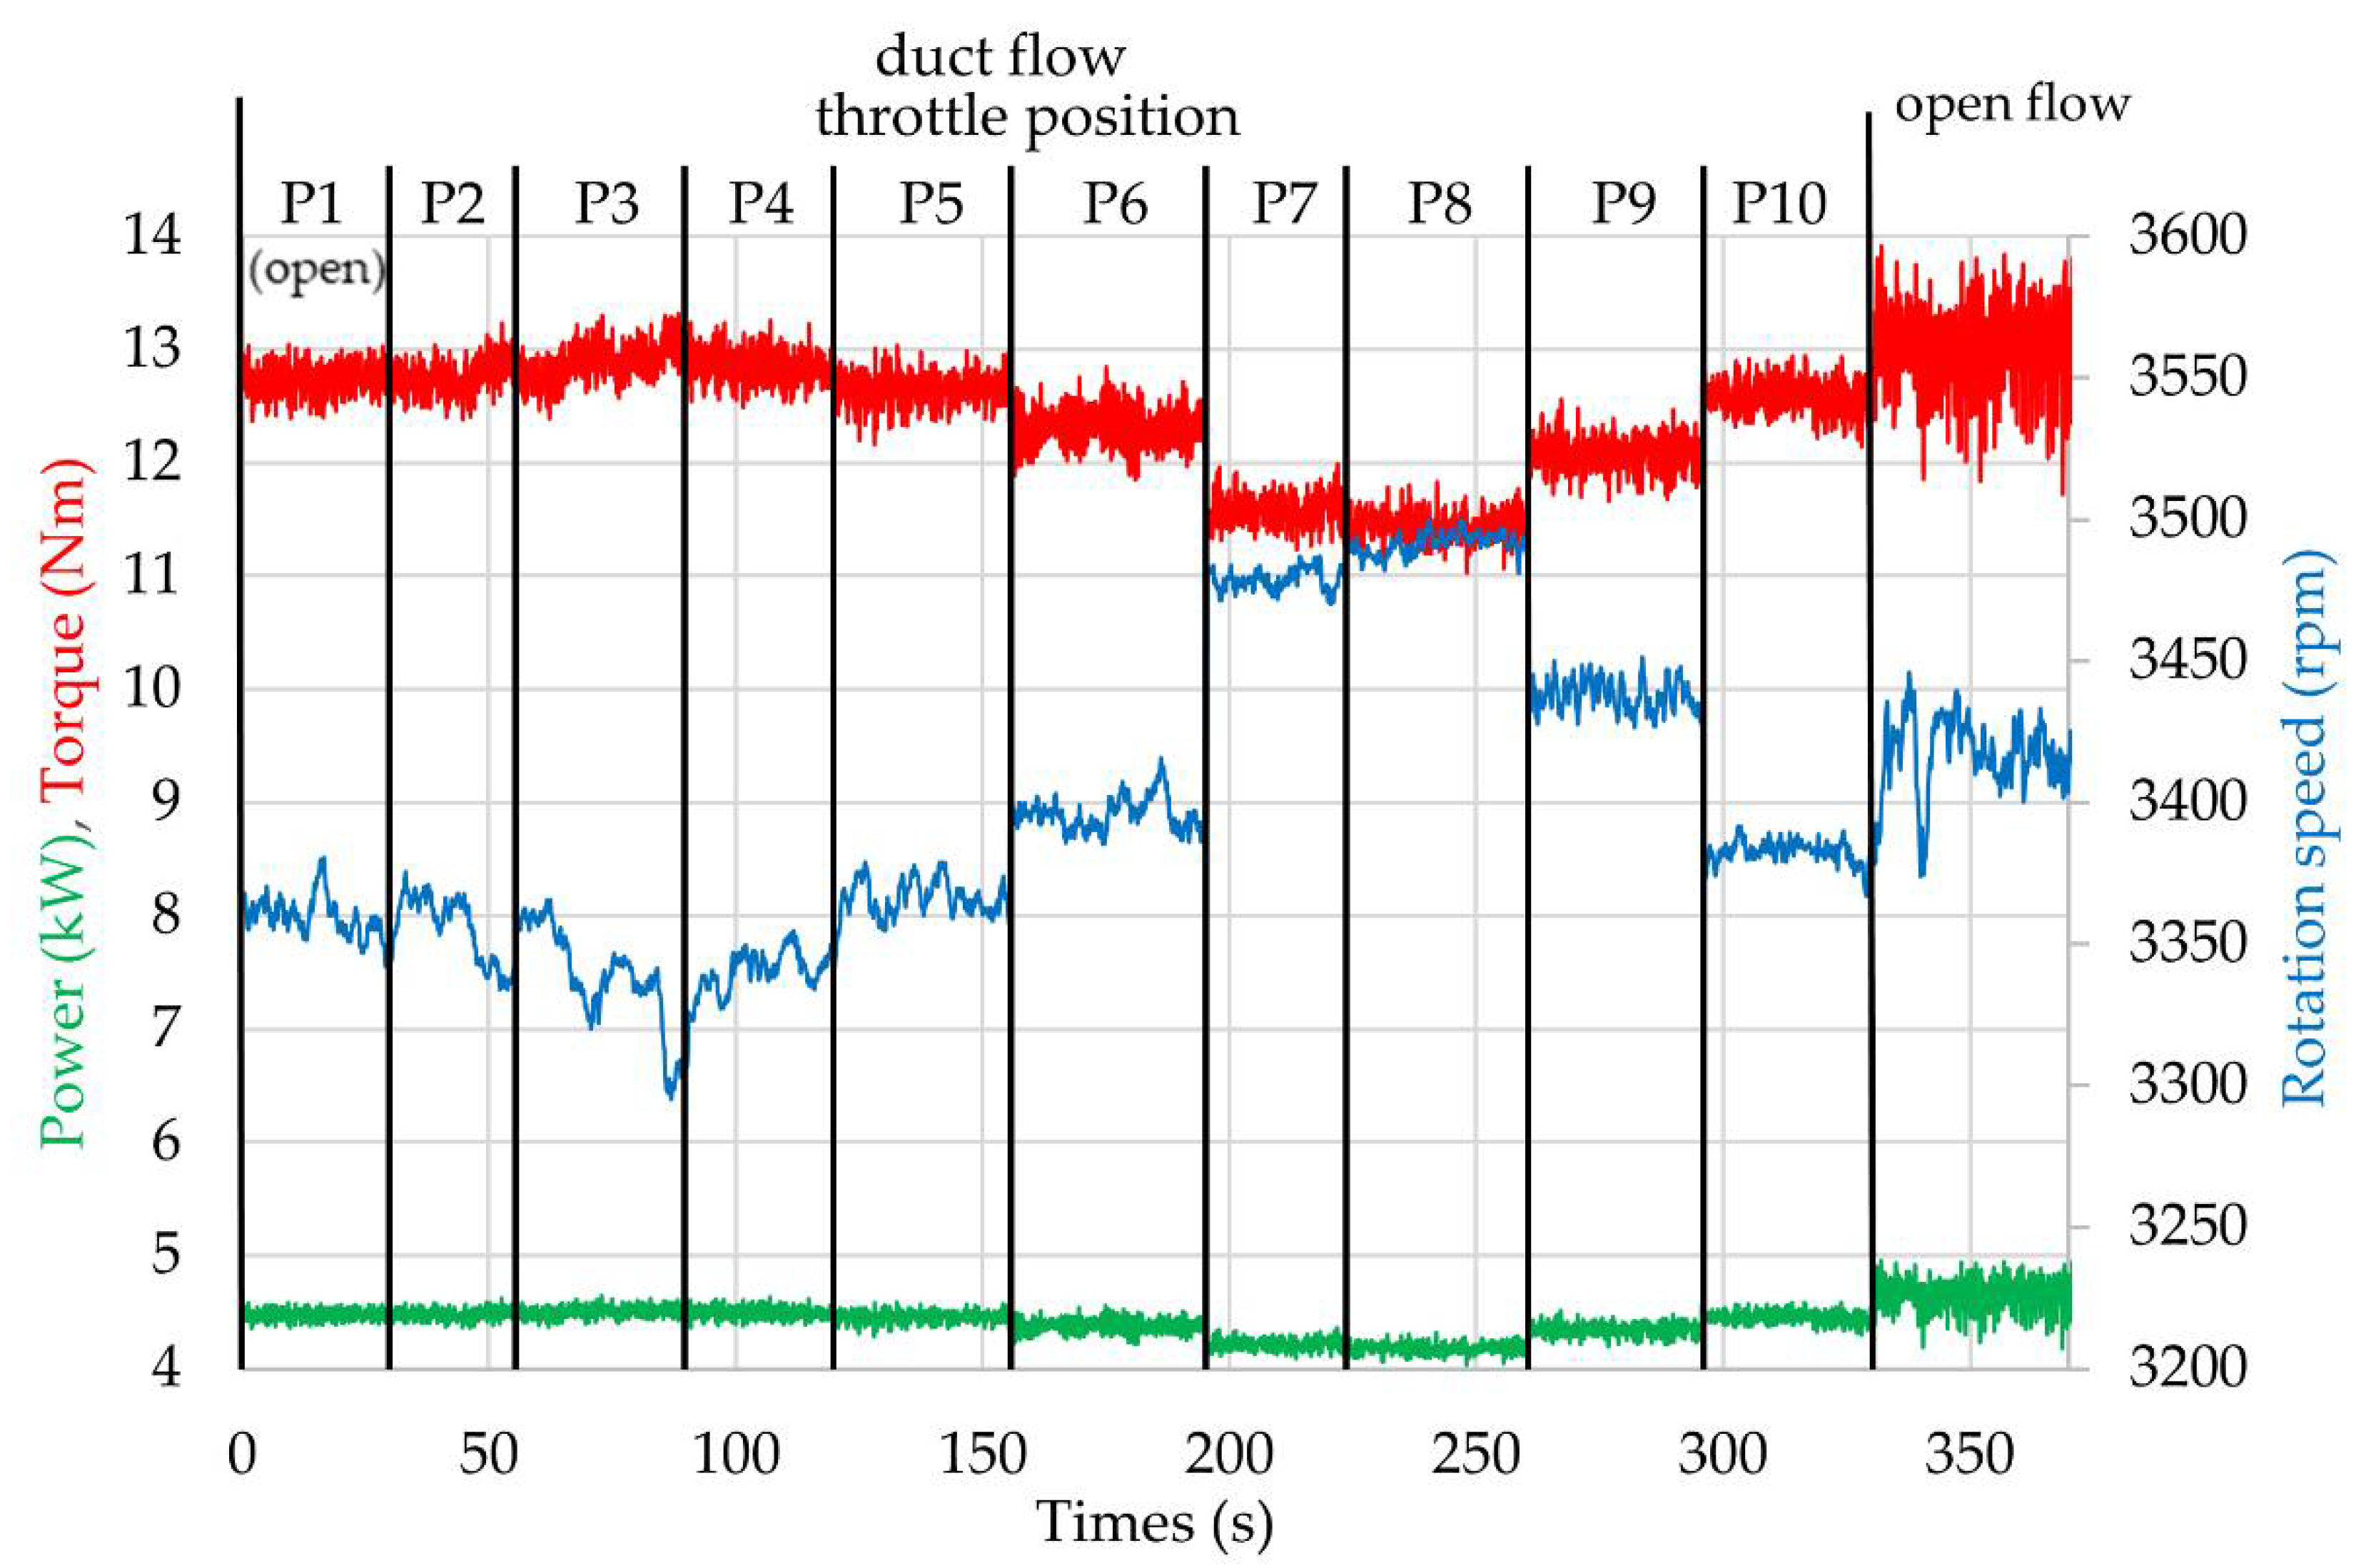
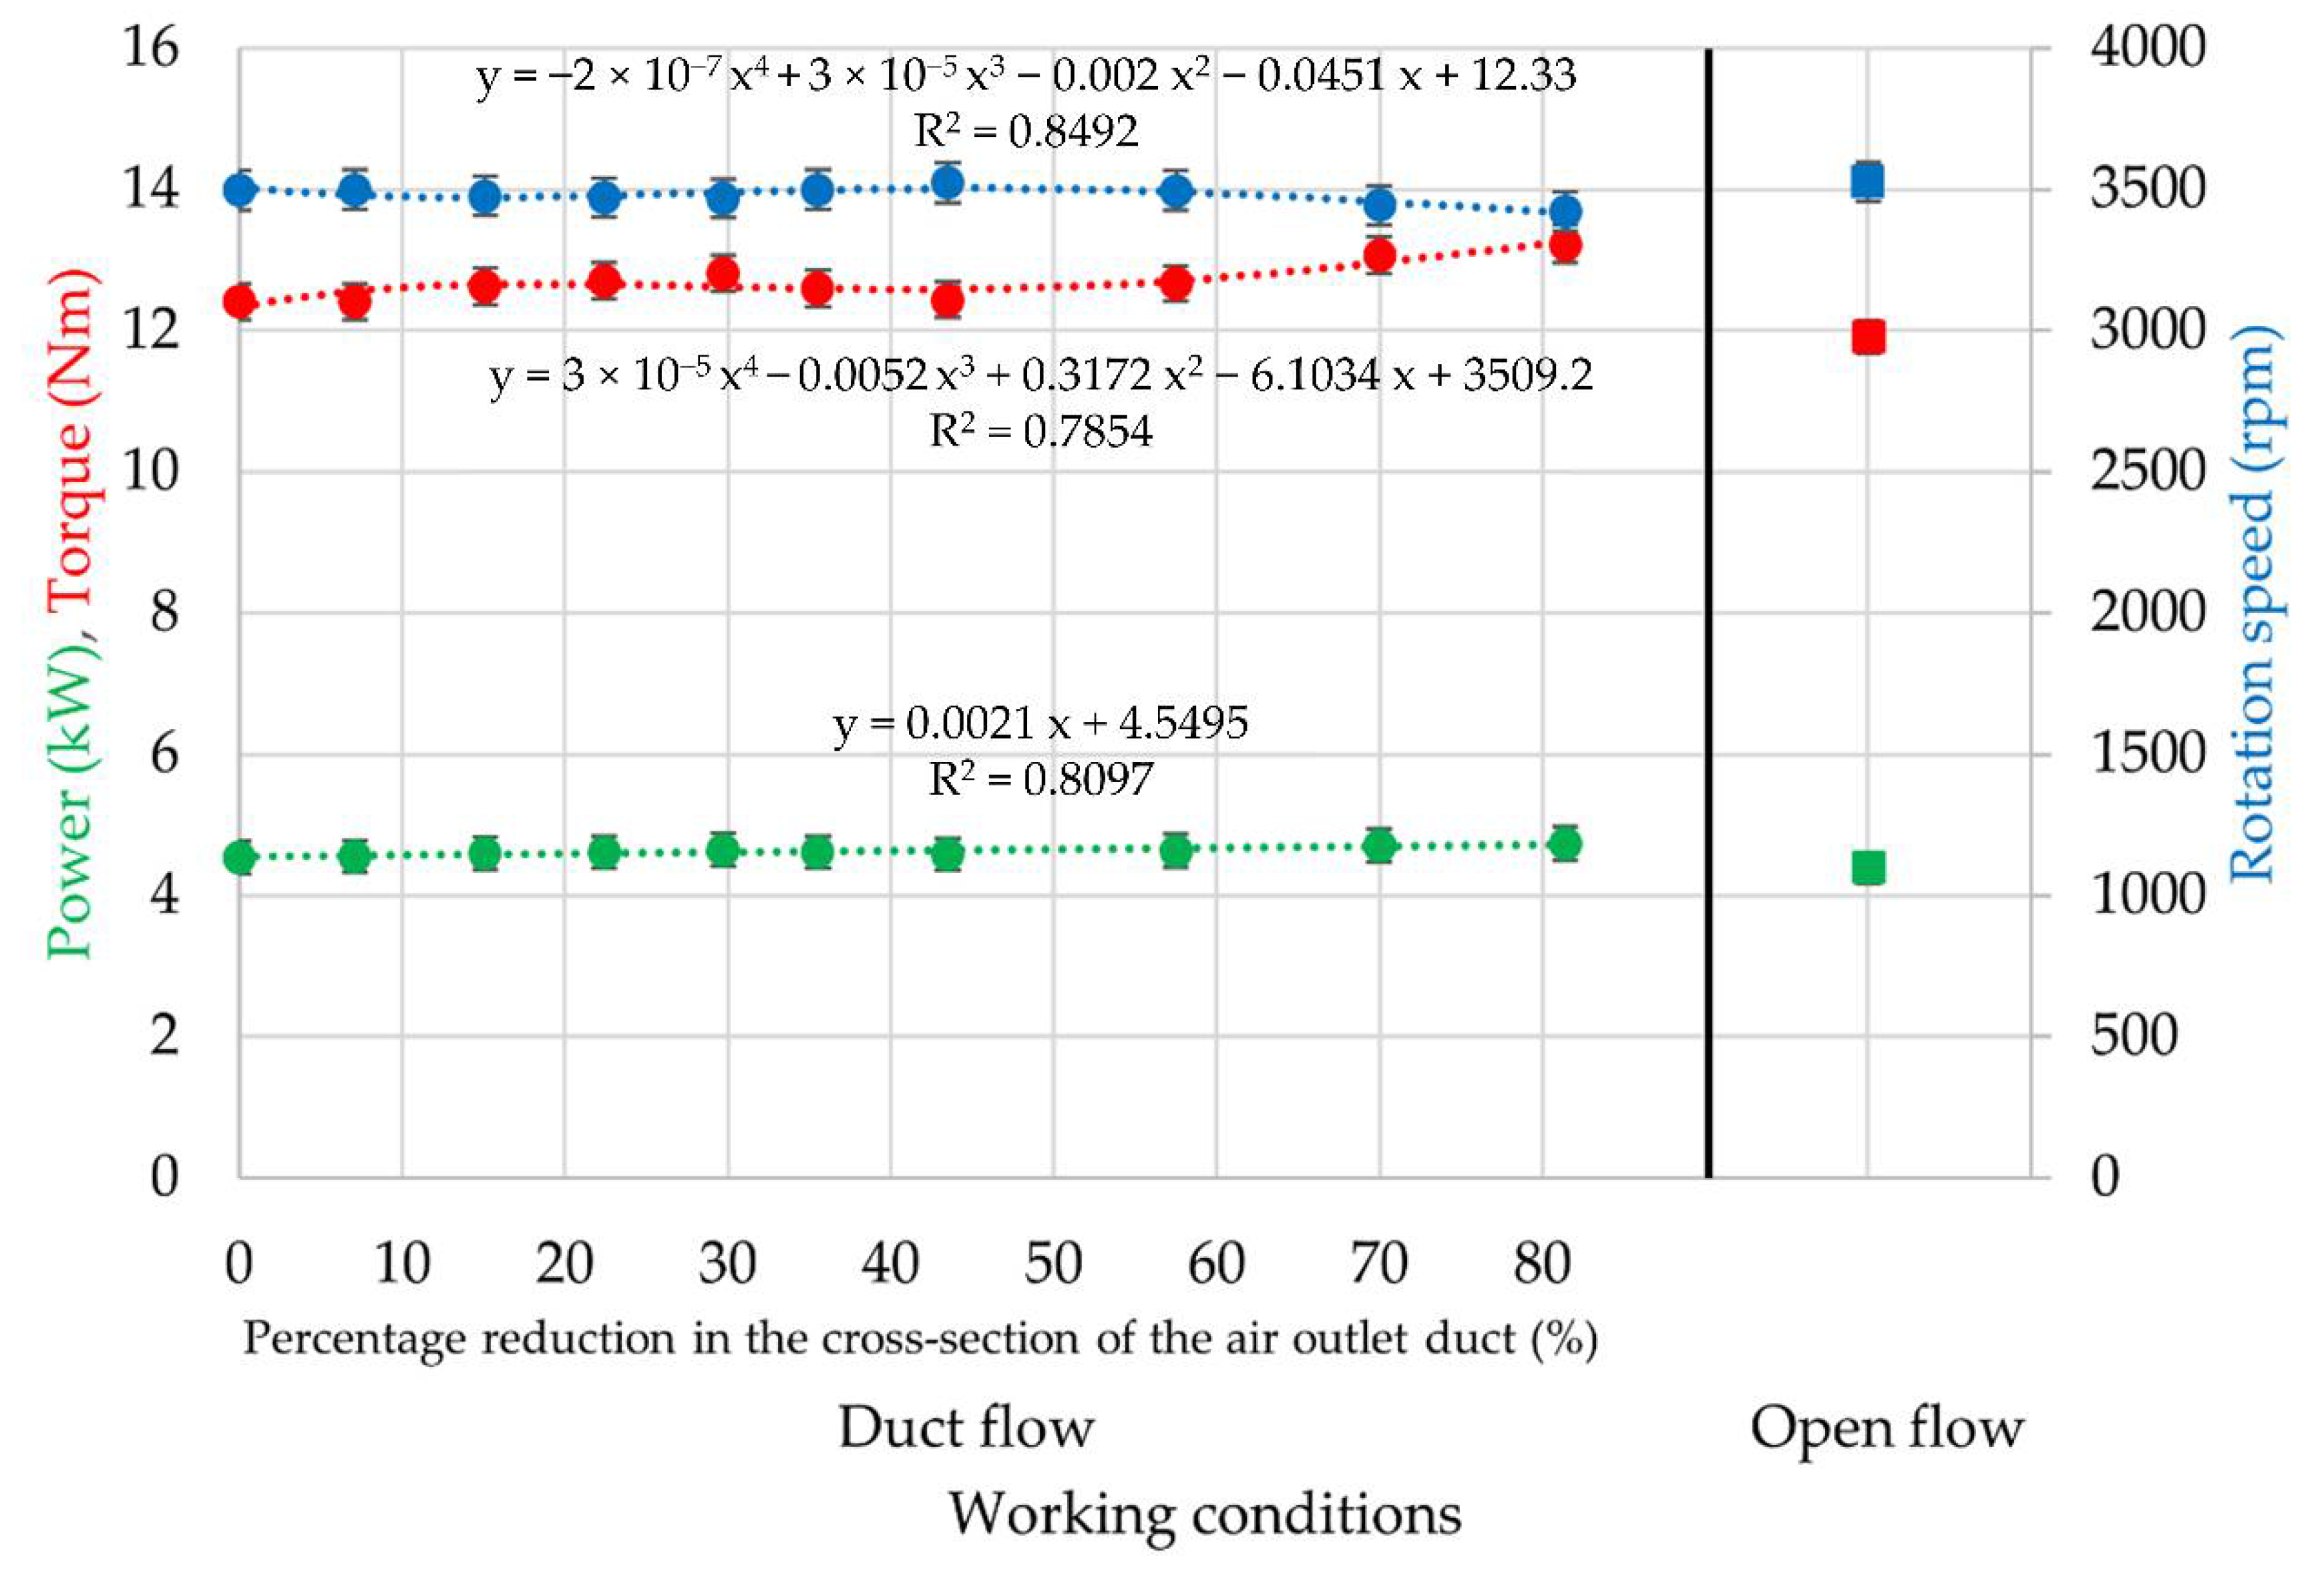
In order to enable a meaningful comparison of the influence of the measurement method of the volumetric flow rate on the performance of the power unit (internal combustion engine), tests were performed using two methods (A and B), recording the values of torque, speed, and power (Figure 5 and Figure 6). In addition, Method A was extended with a measurement to evaluate the volume flow of the fans, taking into account flow throttling from P1 to P10. In evaluating Method A against Method B, only the P1 measurement (duct flow with the flow damper open) was used in the analysis. Based on this research, the average values of the studied parameters were determined according to the working conditions created by the discussed test methods (Figure 7 and Figure 8). It was observed that the fan drive units in this application operated at near-maximum power (approximately 4 kW). Comparing the effect of the test Methods A (under P1 operating conditions) and B (Figure 9), it was noted that Method B allowed the drive unit to operate at a higher speed (0.7–1.7%). This is due to the fact that the generated jet is dynamically dispersed in the environment and turbulently mixed with the air accumulated in the open space [25]. In the duct test (Method A), the impeller additionally has to overcome the pressure losses associated with the flow through the duct. Depending on the fan type and measurement method, the torque value of the drive unit decreased by 4% (for W1) or increased by 2.4% (for W2) when operating according to Method B, i.e., in open flow. A similar relationship can be observed from the measurement of power P, which is dependent on speed n and torque M according to Equation (1):
P = M · n 9550 ,   ( kW )
For the conventional fan (W1), the measurement under the test conditions closer to the real ones (Method B) shows a lower power demand by about 3.2%. Operating under such conditions as a function of time will translate into lower energy requirements for the device [26,27]. Operating at a lower load will also translate into lower emissions, as combustion units have higher emissions of harmful exhaust gases when operating at a higher load—in this case, operating at a higher power [28,29]. On the other hand, the turbo fan (W2) in Method B tests showed a 4.5% increase in power consumption. The mentioned increase in power consumption is related to the absence of channel flow losses and higher mass flux flows through the fan (a typical characteristic of the fan) [30].
It can be seen that the test methods used to evaluate mobile positive pressure fans affect the performance of the drive units. The tests show that Method A is more advantageous for conventional fan manufacturers (W1) because the fan operates at a lower load on the drive unit under these measurement conditions, as opposed to turbo fans (W2). The differences in the values of the drive units without considering the test method can be up to about 7.7%, 6.4%, and 2.4% for the power, torque, and speed of the tested fans, respectively. In light of the results of the tests, the parameter least sensitive to the type of method used turned out to be the rotational speed. Similar observations were also made by Fritsche et al. in 2018 [19], while noting that this speed also depends on the operating parameters of the power unit—in particular, the power transmitted from the engine crankshaft to the fan rotor hub.
Determining the operating conditions of the power unit, mainly speed and torque, is important in the selection of the test during European Union approval tests of power units [22,31,32]. The test procedures on non-road small engine spark ignition (SI) provide for the selection of an approval test for the operating conditions under which the equipment will primarily operate. In the case of mobile positive pressure fans, it can be assumed that they will operate at full capacity, as confirmed by the test results.
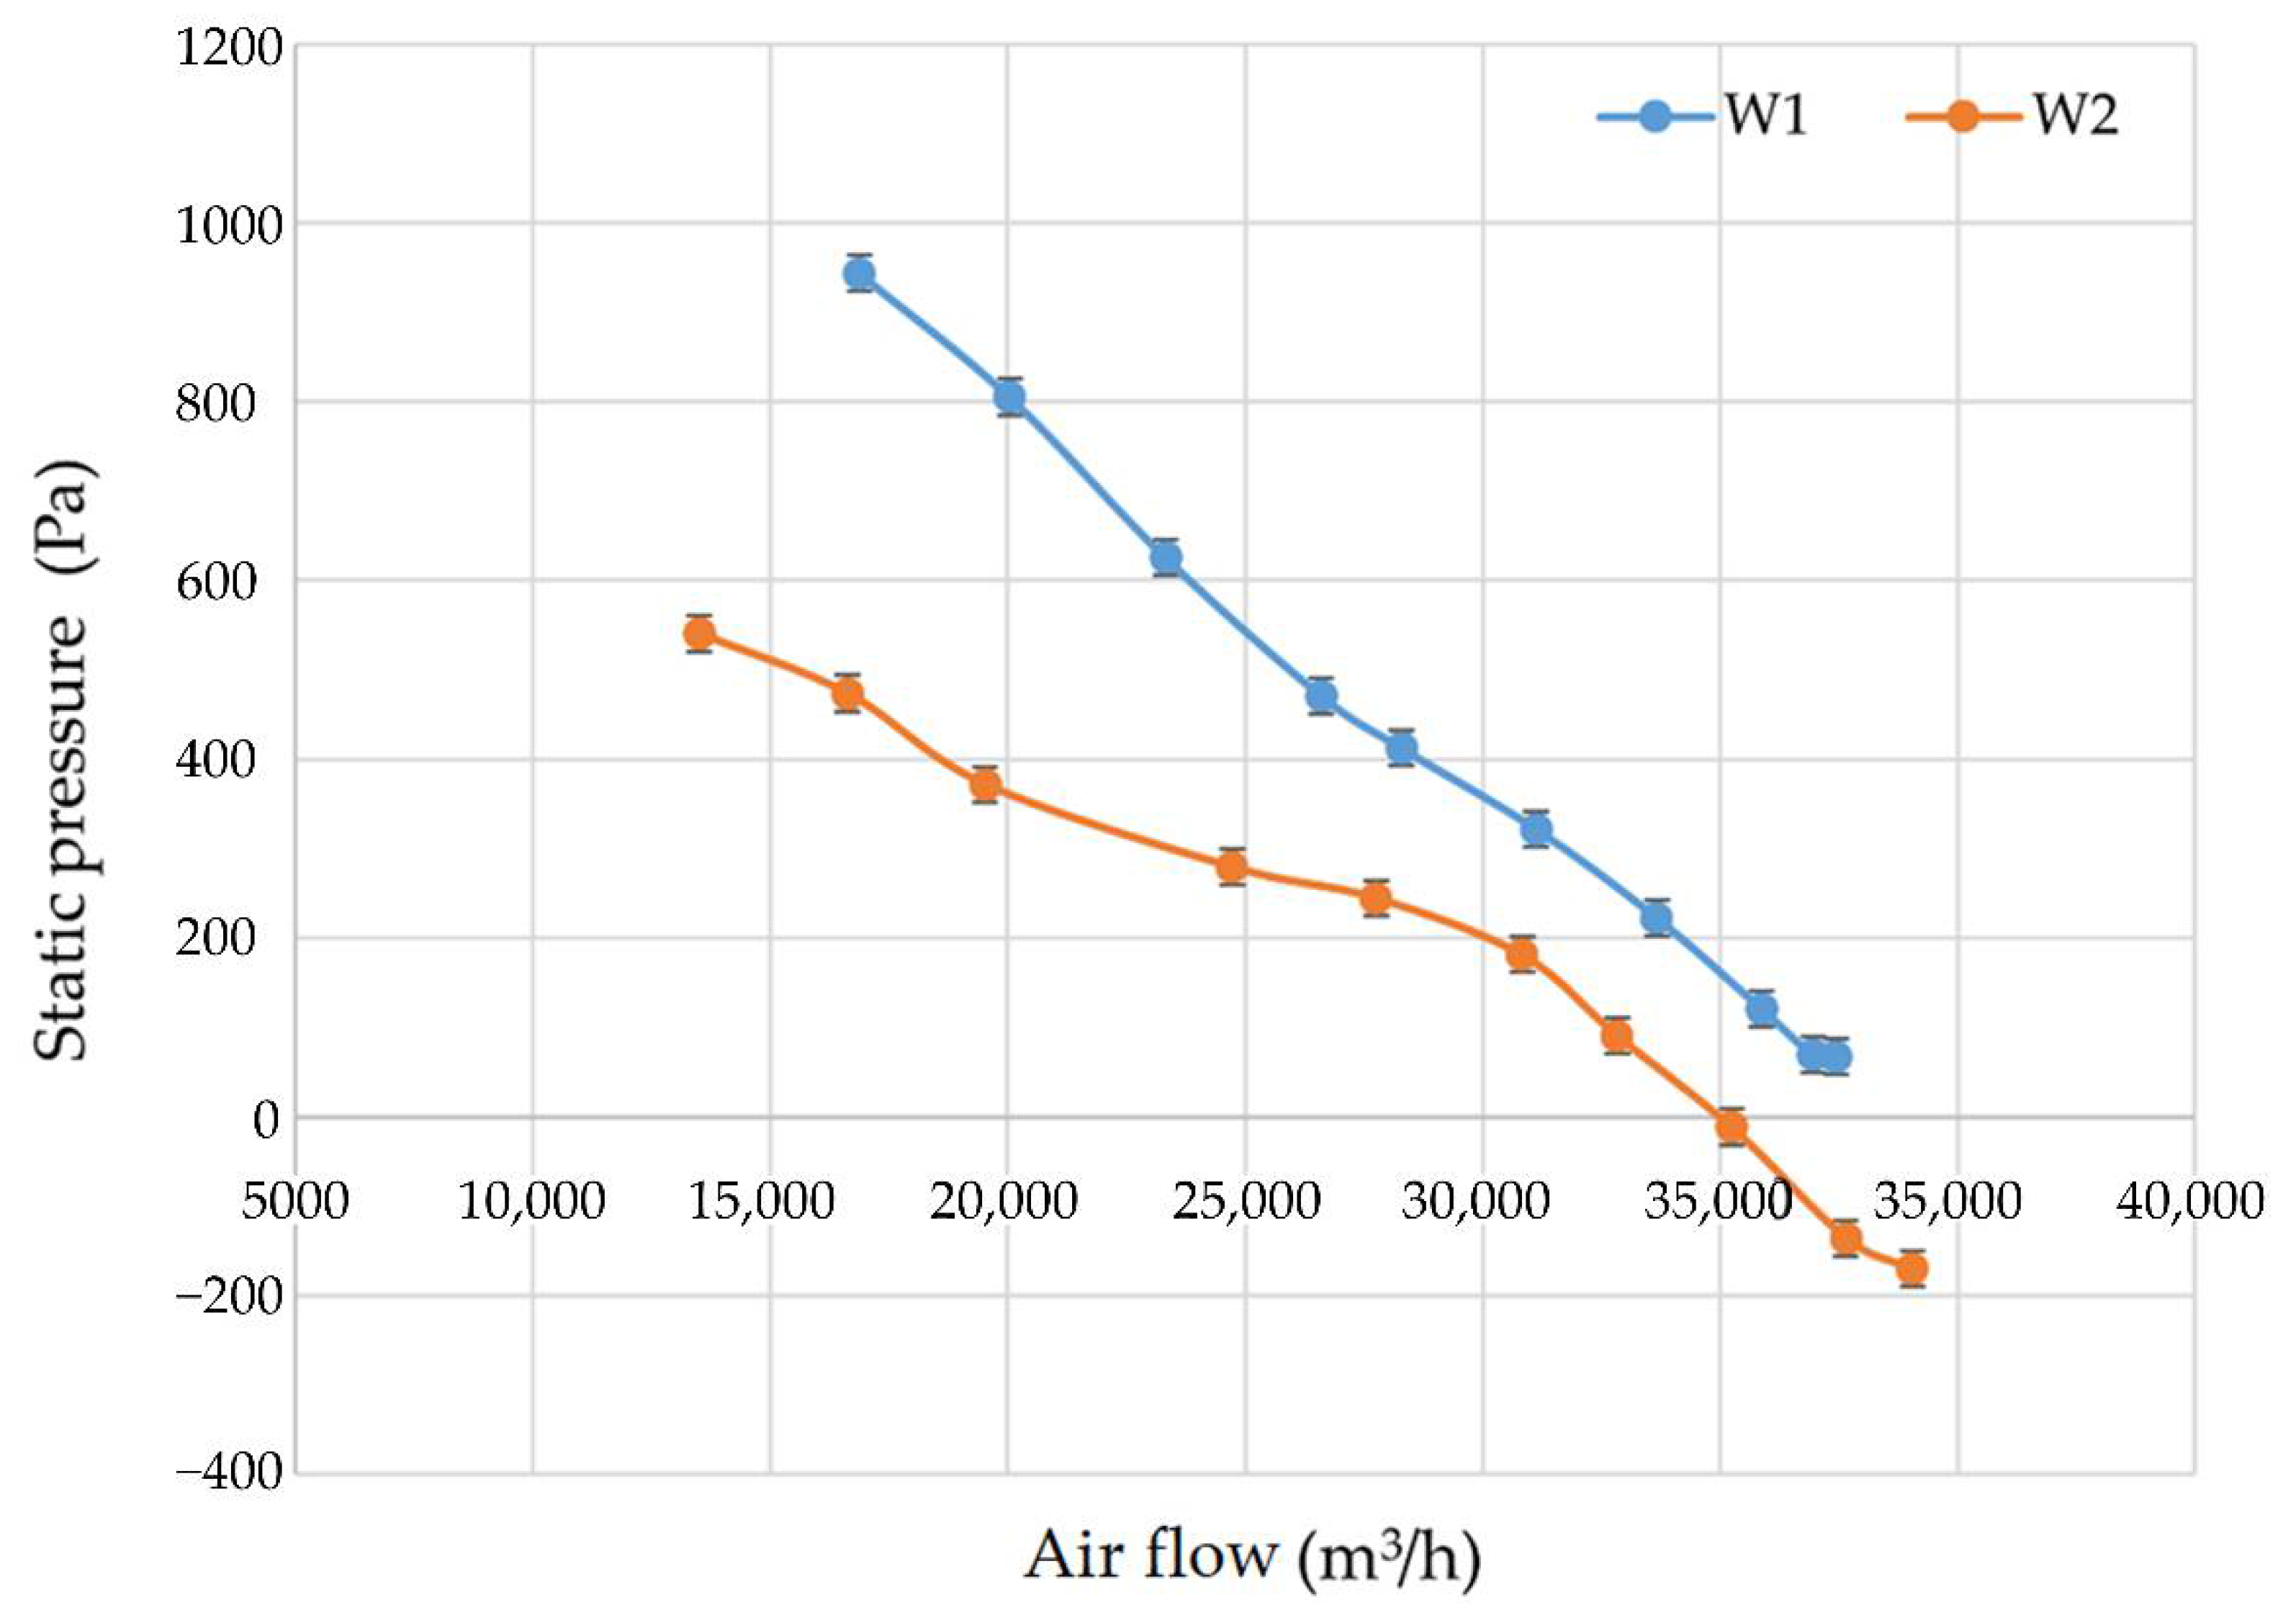
Based on the tests performed according to ISO 5801 (in duct) Method A for both fan units W1 and W2, the fan characteristics were determined (Figure 10). For the conventional fan (W1), the maximum air flow rate was 32,444 m3/h, while for the turbo unit (W2), it was 34,040 m3/h. Both values were obtained during testing in the full throttle configuration. The flow rates specified in the indicated configuration of the throttle operation appear to best reflect the target conditions under which the fan operates. The presented flow characteristics showed that the fan units operate in a slightly different manner. In the case of the turbo fan, negative static pressure values were obtained in the positioning region of the fan rotor during testing in configurations P1, P2, and P3. It can be assumed that this is due to the fact that the duct shaping the jet imparts a negative radial velocity component to the jet at the outer radius of the outlet, which, in turn, creates areas of detachment and local vacuum on the duct walls where the measurement is made [30]. The present vacuum may also have an effect on the increase in mass flux pumped by a fan of this type and the measured increase in drag torque and power.
A different situation was recorded for the conventional unit—in this case, positive pressure values were recorded for the indicated configurations of the throttle position. The presence of positive pressure in the free flow in this case is also related to the design of the conventional fan; its enclosure is made of mesh, which acts mainly as protection and does not act as a flow guide [25]. The jet generated by the conventional fan chaotically propagated in all directions, including into the positioning areas of the pressure sensors.

4. Conclusions

It can be seen from the results presented herein that the operating conditions resulting from the measurement method used affect the parameters of the drive unit, such as speed, torque, and power. The effect of the change in operating conditions resulting from the change in test method can cause variation in the test results of 0.7 to 1.7% for the speed, up to 2.4 to 4% for the torque, and 3.2 to 4.5% for the power values at the drive shaft. In addition, it should be noted that measurement according to Method A is advantageous for conventional fan drive units (W1) because it has a lower mechanical power requirement. A similar relationship can be seen when testing turbo fans (W2), which have a lower demand for mechanical power when tested using Method B. Depending on the adopted measurement method and the type of fan impeller, the mechanical power requirement needed to drive the fan can vary by about 7.7%. This parameter is the main factor influencing the fuel consumption and emissions of harmful exhaust compounds. It is reasonable to conduct further investigations in the area of the operating conditions of the power unit resulting from the applied measurement method in terms of determining differences in fuel consumption and harmful exhaust gas emissions. Tests for measuring the aerodynamic performance of mobile positive pressure fans should also be performed, and standardized criteria for selecting a test method for equipment used in rescue operations should be established.

Author Contributions

Conceptualization, Ł.W., P.K. (Piotr Kaczmarzyk), P.J. and P.K. (Piotr Krawiec); methodology Ł.W., P.K. (Piotr Kaczmarzyk), P.J. and P.K. (Piotr Krawiec); software, P.K. (Piotr Kaczmarzyk), Ł.W., P.J. and P.K. (Piotr Krawiec); validation, Ł.W., P.K. (Piotr Kaczmarzyk), P.J. and P.K. (Piotr Krawiec); formal analysis, Ł.W., P.K. (Piotr Kaczmarzyk), P.J. and P.K. (Piotr Krawiec); investigation, Ł.W., P.K. (Piotr Kaczmarzyk), P.J. and P.K. (Piotr Krawiec); resources, Ł.W., P.K. (Piotr Kaczmarzyk), P.J. and P.K. (Piotr Krawiec); data curation, P.K. (Piotr Kaczmarzyk), Ł.W., P.J. and P.K. (Piotr Krawiec); writing—original draft preparation, Ł.W., P.K. (Piotr Kaczmarzyk), P.J. and P.K. (Piotr Krawiec); writing—review and editing, P.K. (Piotr Kaczmarzyk), Ł.W., P.J. and P.K. (Piotr Krawiec); visualization, P.K. (Piotr Kaczmarzyk), Ł.W., P.J. and P.K. (Piotr Krawiec); supervision, P.K. (Piotr Kaczmarzyk), Ł.W., P.J. and P.K. (Piotr Krawiec); project administration, Ł.W., P.K. (Piotr Kaczmarzyk) and P.J.; funding acquisition, P.K. (Piotr Kaczmarzyk), P.J. and Ł.W. All authors have read and agreed to the published version of the manuscript.

Funding

The research presented in the article was carried out as part of the Ministry of Education and Science program “Implementation Doctorate” executed in 2020–2024 (agreement no. DWD/4/22/2020).

Institutional Review Board Statement

Not applicable.

Informed Consent Statement

Not applicable.

Data Availability Statement

Not applicable.

Conflicts of Interest

The authors declare no conflict of interest.

References

  1. Kamińska, M.; Rymaniak, Ł.; Lijewski, P.; Szymlet, N.; Daszkiewicz, P.; Grzeszczyk, R. Investigations of Exhaust Emissions from Rail Machinery during Track Maintenance Operations. Energies 2021, 14, 3141. [Google Scholar] [CrossRef]
  2. Lijewski, P.; Szymlet, N.; Fuć, P.; Domowicz, A.; Rymaniak, Ł. The effect of start-stop systems on scooter exhaust emissions. Transp. Res. Part D Transp. Environ. 2021, 91, 102684. [Google Scholar] [CrossRef]
  3. Lijewski, P.; Merkisz, J.; Fuć, P. Research of exhaust emissions from a harvester diesel engine with the use of portable emission measurement system. Croat. J. For. Eng. 2013, 34, 113–122. [Google Scholar]
  4. Ohliger, T. Air Pollution and Noise. Factsheet on the European Union. 2017. Available online: http://www.europarl.europa.eu/atyourservice/pl/displayFtu.html?ftuId=FTU_5.4.5.html (accessed on 1 January 2018).
  5. Wang, D.; Liao, B.; Zheng, J.; Huang, G.; Hua, Z.; Gu, C.; Xu, P. Development of regulations, codes and standards on composite tanks for on-board gaseous hydrogen storage. Int. J. Hydrogen Energy 2019, 44, 22643–22653. [Google Scholar] [CrossRef]
  6. Eremina, T.; Nesterov, M.; Korolchenko, D.; Giletich, A. Problematic issues of quality, certification and tests of fire-fighting technical production. E3S Web Conf. 2020, 164, 14023. [Google Scholar] [CrossRef]
  7. Wei, D.; Li, S.; Wu, X.; Song, Y.; Tan, R. Design of electromagnetic compatibility test platform for transformer fire-fighting nitrogen injection extinguishing system. IOP Conf. Ser. Earth Environ. Sci. 2021, 687, 012121. [Google Scholar] [CrossRef]
  8. Kumm, M.; Bergqvist, A. Fire and rescue operations during construction of tunnels. In Proceedings of the ISTSS-Fourth International Symposium on Tunnel Safety and Security, Frankfurt am Main, Germany, 17–19 March 2010; pp. 383–394. [Google Scholar]
  9. Arca, V.J. Use of Positive Pressure Ventilation (PPV) Fans to Reduce the Hazards of Entering Chemically Contaminated Buildings; Edgewood Chemical Biological Center Aberdeen Proving Ground Md.: Washington, DC, USA, 2000. [Google Scholar]
  10. Lambert, K.; Welch, S.; Merci, B. The use of positive pressure ventilation fans during firefighting operations in underground stations: An experimental study. Fire Technol. 2018, 54, 625–647. [Google Scholar] [CrossRef] [Green Version]
  11. Li, M.; Gao, Z.; Ji, J.; Li, K. Modeling of positive pressure ventilation to prevent smoke spreading in sprinklered high-rise buildings. Fire Saf. J. 2018, 95, 87–100. [Google Scholar] [CrossRef]
  12. Mahalingam, A.; Patel, M.K.; Galea, E.R. Simulation of the flow induced by positive pressure ventilation fan under wind driven conditions. In Proceedings of the 12th International Fire Science & Engineering Conference, Interflam 2010, Nottingham, UK, 5–7 July 2010; Volume 1, pp. 913–924, ISBN 0955654874. [Google Scholar]
  13. Kerber, S.; Walton, W.D. Characterizing Positive Pressure Ventilation Using Computational Fluid Dynamics; US Department of Commerce, National Institute of Standards and Technology: Gaithersburg, MD, USA, 2003. [Google Scholar]
  14. Ezekoye, O.A.; Svensson, S.; Nicks, R. Investigating positive pressure ventilation. In Proceedings of the 11th International Fire Science and Engineering Conference (Interflam’07), London, UK, 3–5 September 2007. [Google Scholar]
  15. Panindre, P.; Mousavi, N.S.; Kumar, S. Improvement of Positive Pressure Ventilation by optimizing stairwell door opening area. Fire Saf. J. 2017, 92, 195–198. [Google Scholar] [CrossRef]
  16. Kaczmarzyk, P.; Klapsa, W.; Janik, P.; Krawiec, P. Identification and Evaluation of Technical and Operational Parameters of Mobile Positive Pressure Ventilation Fans Used during Rescue Operations. Saf. Fire Technol. 2021, 58, 74–91. [Google Scholar] [CrossRef]
  17. PN-EN 5801:2017-12; Wentylatory—Badanie Właściwości Użytkowych z Zastosowaniem Stanowisk znormalizowanych. Polski Komitet Normalizacyjny: Warszawa, Poland, 2017.
  18. ANSI/AMCA Standard 240-15; Laboratory Methods of Testing Positive Pressure Ventilators for Aerodynamic Performance Raing. AMCA: Arlington Heights, IL, USA, 2015.
  19. Fritsche, M.; Epple, P.; Delgado, A. Development of a Measurement Method for the Classification and Performance Evaluation of Positive Pressure Ventilation (PPV) Fans. In Proceedings of the Conference: ASME 2018 5th Joint US-European Fluids Engineering Division Summer Meetin, Montreal, QC, Canada, 15–18 July 2008. [Google Scholar] [CrossRef]
  20. Available online: https://www.fogo.pl/ (accessed on 1 January 2022).
  21. Available online: https://www.ramfan.com/ (accessed on 1 January 2022).
  22. Regulation (EU). On Requirements for Emission Limit Values of Gaseous and Particulate Pollutants and Type-approval with Respect to Internal Combustion Engines for Mobile Machines Non-road, Amending Regulations (EU) No 1024/2012 and (EU) No 167/2013 and Amending and Repealing Directive 97/68/WE. No 2016/1628 of the European Parliament and of the Council of 14 September 2016. Off. J. Eur. Union. 2016, 252, 53–117. [Google Scholar]
  23. Warguła, Ł.; Kukla, M.; Lijewski, P.; Dobrzyński, M.; Markiewicz, F. Impact of Compressed Natural Gas (CNG) Fuel Systems in Small Engine Wood Chippers on Exhaust Emissions and Fuel Consumption. Energies 2020, 13, 6709. [Google Scholar] [CrossRef]
  24. ISO 3966. Measurement of Fluid Flow in Closed Conduits—Velocity Area Method Using Pitot Static Tubes. Available online: http://driso.ir/standards/bs/BS_1042_2_4_1989_,_Measurement_of.pdf (accessed on 1 January 2022).
  25. Cimolino, U.; Emrich, C.; Svensson, S. Taktische Ventilation: Be-Und Entlüftungssysteme im Einsatz; Ecomed-Storck GmbH: Hamburg, Germany, 2012. [Google Scholar]
  26. Warguła, Ł.; Kukla, M.; Wieczorek, B.; Krawiec, P. Energy consumption of the wood size reduction processes with employment of a low-power machines with various cutting mechanisms. Renew. Energy 2022, 181, 630–639. [Google Scholar] [CrossRef]
  27. Kukla, M.; Wieczorek, B.; Warguła, Ł.; Górecki, J.; Giedrowicz, M. An Analytical Modelling of Demand for Driving Torque of a Wheelchair with Electromechanical Drive. Energies 2021, 14, 7315. [Google Scholar] [CrossRef]
  28. Rymaniak, Ł.; Lijewski, P.; Kamińska, M.; Fuć, P.; Kurc, B.; Siedlecki, M.; Kalociński, T.; Jagielski, A. The role of real power output from farm tractor engines in determining their environmental performance in actual operating conditions. Comput. Electron. Agric. 2020, 173, 105405. [Google Scholar] [CrossRef]
  29. Lijewski, P.; Fuc, P.; Dobrzynski, M.; Markiewicz, F. Exhaust emissions from small engines in handheld devices. In MATEC Web of Conferences; EDP Sciences: Les Ulis, France, 2017; Volume 118, p. 00016. [Google Scholar]
  30. Bleier, F.P. Fan Handbook: Selection, Application, and Design; McGraw-Hill: New York, NY, USA, 2018. [Google Scholar]
  31. Warguła, Ł.; Lijewski, P.; Kukla, M. Influence of non-commercial fuel supply systems on small engine SI exhaust emissions in relation to European approval regulations. Environ. Sci. Pollut. Res. 2022, 1–16. [Google Scholar] [CrossRef]
  32. Waluś, K.J.; Warguła, Ł.; Krawiec, P.; Adamiec, J.M. Legal regulations of restrictions of air pollution made by non-road mobile machinery—The case study for Europe: A review. Environ. Sci. Pollut. Res. 2018, 25, 3243–3259. [Google Scholar] [CrossRef] [PubMed] [Green Version]
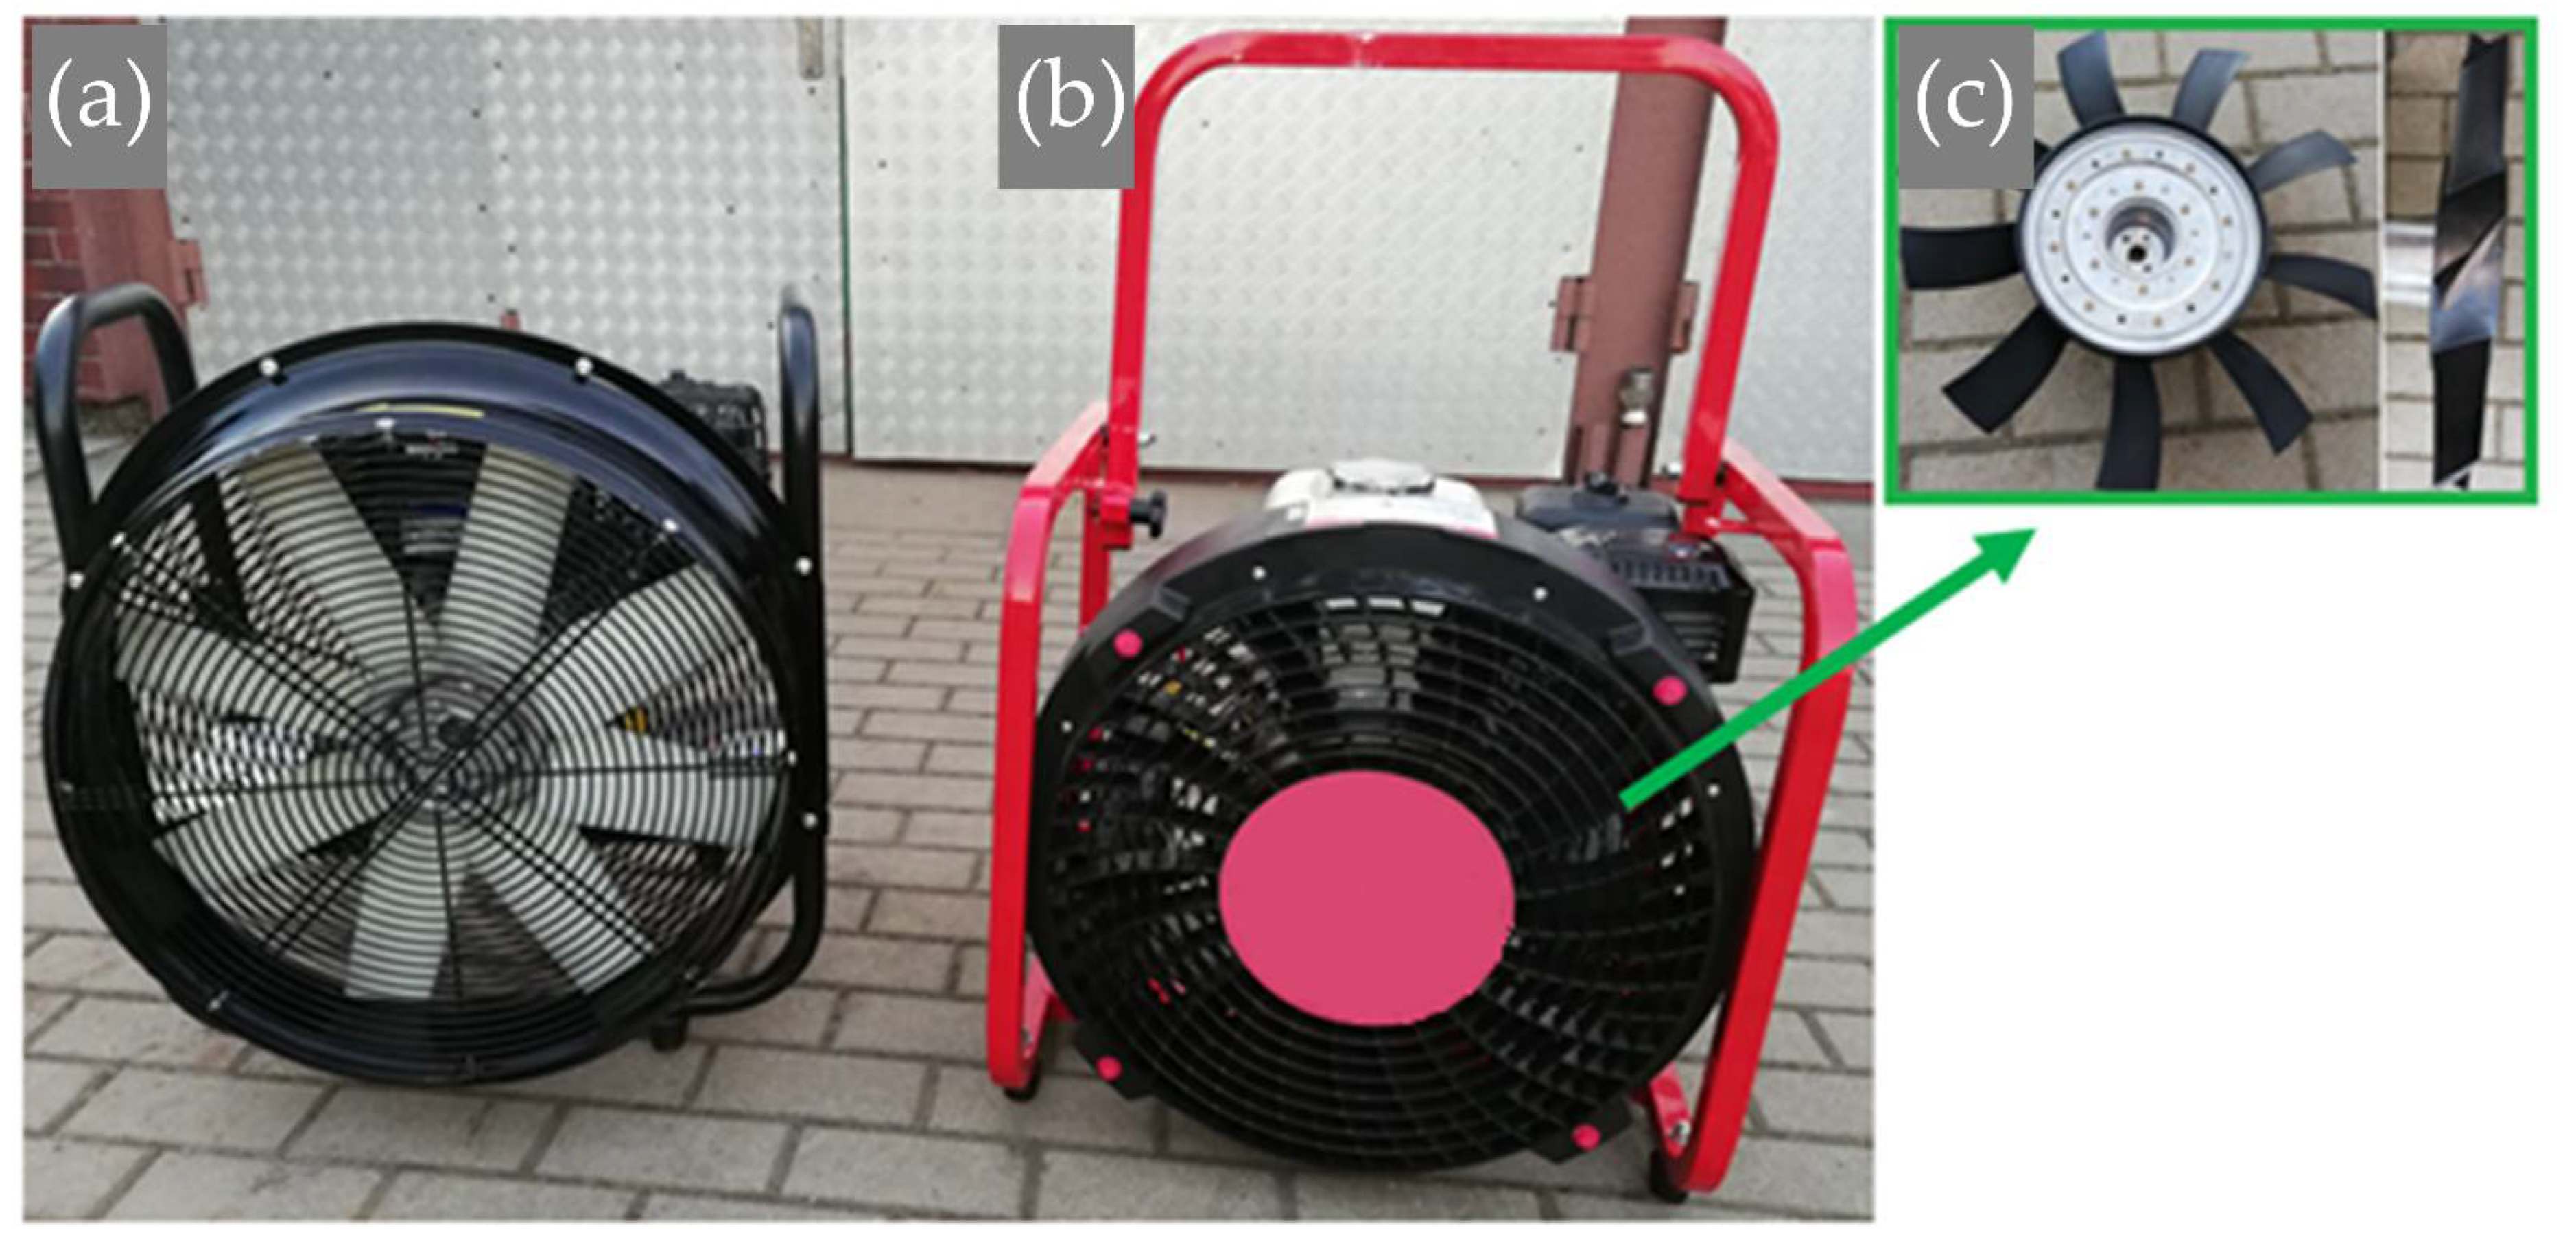
Figure 1. Mobile positive pressure fans used in rescue operations: (a) conventional fan, (b) turbo fan (W2), and (c) turbo fan impeller.
Energies 15 03953 g001
Figure 2. Schematic of the test station: 1, tested engine; 2, belt transmission (ratio 1:1); 3 and 7, intermediate shaft; 4 and 6, flexible coupling; 5, torque and rotational speed sensors; 8, fan impeller.
Energies 15 03953 g002
Figure 3. Mobile positive pressure fans during testing: (a) Method A (fan W1); (b) Method B (fan W1); (c) diagram of the measuring duct position in Method A, where 1—flow throttling section, 2—measurement area of static and dynamic pressure flow, 3—flow straightener, 4—static pressure measurement section (four-point ring), 5—duct confusor to match the fan impeller dimensions to the test duct diameter, and 6—fan positioning area; (d) Method B (fan W2).
Energies 15 03953 g003
Figure 4. Presentation of the flow throttling method, where the symbol P indicates the remaining flow area (P1—open flow).
Energies 15 03953 g004
Figure 5. Power, torque, and speed during tests of fan W1 using Method A (duct flow) with variable damper closure and Method B (open flow).
Energies 15 03953 g005
Figure 6. Power, torque, and speed during tests of fan W2 using Method A (duct flow) with variable damper closure and Method B (open flow).
Energies 15 03953 g006
Figure 7. Characteristics of changes in the average power, torque, and speed during tests of fan W1 using Method A (duct flow) with variable damper closure and Method B (open flow).
Energies 15 03953 g007
Figure 8. Characteristics of changes in the average power, torque, and speed during tests of fan W2 using Method A (duct flow) with variable damper closure and Method B (open flow).
Energies 15 03953 g008
Figure 9. Influence of the measurement method (Method A with open throttle or Method B) on the average values of (a) rotational speed, (b) torque and (c) power, where A/B denotes the difference in the measured values depending on the measurement method.
Energies 15 03953 g009
Figure 10. Characteristics of the volume of air flow as a function of static pressure, examined via Method A.
Energies 15 03953 g010
Table 1. Declared performance of the mobile fans.
Fan with Conventional Impeller Type (W1)
Type
Combustion engineBriggs and Stratton 750
Max. fan performance (AMCA 240-15)30,000 m3/h
Max. motor power at 3600 rpm4.4 kW
Displacement capacity163 cm3
Fan with a turbo impeller (W2)
Type
Combustion engineHonda GX 200
Max. fan performance (AMCA 240-15)31,799 m3/h
Max. motor power at 3600 rpm4.1 kW
Displacement capacity196 cm3
Table 2. Values of flow throttling.
Position of the Flow Throttling SectionP1P2P3P4P5P6P7P8P9P10
Surface area, mm2173,994160,576147,703134,919122,270112,05497,56874,00552,05432,303
Reduction of the outlet area, %-7.115.122.429.735.543.557.57081.4
Publisher’s Note: MDPI stays neutral with regard to jurisdictional claims in published maps and institutional affiliations.