Article

Optimization Study on Microwave-Assisted Hydrothermal Liquefaction of Malaysian Macroalgae Chaetomorpha sp. for Phenolic-Rich Bio-Oil Production

by
Mei Yin Ong
1,* and
Saifuddin Nomanbhay
2,*
1
AAIBE Chair of Renewable Energy, Universiti Tenaga Nasional (UNITEN), Jalan IKRAM-UNITEN, Kajang 43000, Selangor, Malaysia
2
Institute of Sustainable Energy (ISE), Universiti Tenaga Nasional (UNITEN), Jalan IKRAM-UNITEN, Kajang 43000, Selangor, Malaysia
*
Authors to whom correspondence should be addressed.
Energies 2022, 15(11), 3974; https://doi.org/10.3390/en15113974
Submission received: 15 April 2022 / Revised: 28 April 2022 / Accepted: 3 May 2022 / Published: 27 May 2022
(This article belongs to the Special Issue Bioprocessing Technologies for Biofuel Production)

Abstract

:
There are several methods of biomass conversion, including hydrothermal liquefaction (HTL). The implementation of microwave technology in the HTL process is still new, especially on the conversion of marine biomass into bio-crude. In this work, the macroalgae Chaetomorpha sp. was used as the biomass feedstock to produce phenolic-rich bio-oil through microwave-assisted HTL. Chaetomorpha sp. was abundantly found in Malaysia, creating a green tides issue. By utilizing these algae, the green tide issue can be solved and value-added bio-oil is obtained. However, bio-oil from macroalgae has a relatively low heating value, restricting its fuel application. Therefore, it is suggested to be used for bio-polymer synthesis, including bio-based phenol formaldehyde. In this study, the effect of different parameters, such as reaction temperature, preloaded pressure, water-to-algal biomass ratio, and holding time, on both the bio-oil yield and phenolic yield was evaluated. Folin–Ciocalteu method was introduced as the phenolic determination method and the optimal conditions were located by using Response Surface Methodology (RSM). As a results, an optimal biodiesel yield and phenolic yield of 21.47 wt% and 19.22 wt% Gallic Acid Equivalent was obtained at a reaction temperature of 226 °C, 42 bar preloaded pressure and 30:1 water-to-algal biomass ratio after 79 min. Sensitivity analysis also concluded that the water-to-algal biomass ratio is the most influential factor, followed by the preloaded pressure. The FTIR spectrum of the bio-oil produced indicated the presence of different functional group of compounds. In short, Chaetomorpha sp. has been successfully converted into valuable bio-oil through microwave-assisted HTL.

1. Introduction

Since a few decades ago, sustainable development has dominated the headlines and has gained interest among society. Sustainable development is defined as the economic development that is performed without exhaustion of natural resources, particularly fossil fuel. Fossil fuel is the primary energy source all around the world. Due to limited supply, the price of fossil fuel increases along with the energy demand. According to the International Energy Agency’s report, the energy demand in the Southeast Asia region has grown by more than 6% annually over the past two decades. Indonesia, Vietnam, Thailand, and Malaysia are the four largest contributors to this value, weighted more than 80% of the total energy demand in this region [1]. With the current consumption rate, the fossil fuels in the world are projected to run out in the next 50 years [2,3]. Other than the depletion issues, the negative impact of conventional fossil fuel on the environments and human health has driven the exploration of alternative renewable energy sources, such as solar, hydro, wind, ocean, and biomass. Among these, biomass is the most important renewable energy alternative at present, as biomass resources are common and widespread across the globe. Besides, biomass is the fourth largest energy source after coal, oil, and natural gas. Thus, the sustainability potential of biomass as conventional fossil fuel replacement has been recognized extensively [4,5,6].
Basically, the renewable biomass feedstock can be categorized into three groups, which are (i) first generation, mainly edible crops, (ii) second generation, i.e., non-edible crops, and (iii) third generation, e.g., waste cooking oil, algae, and manure. The development of third generation renewable feedstocks from algal biomass has been extensively developed over the last few years [7,8,9]. The advantages of algal biomass technologies are that they do not stand in direct competition to food production and generally have a better balance. Algae are truly remarkable organisms which have recently generated significant interest in their use for more sustainable practices. The immense biodiversity of algae has caused them to have several advantages over traditional crops. These advantages include their lack of the requirement for arable land, their capacity to create biomass rich in protein, carbohydrates, and lipids, high growth rates and long growing season in warm climates. Algae have capacity to create high value products, servicing a number of markets including foods, fuels, nutraceuticals, and plastics. In Malaysia, however, more attention is given to oil palm waste as Malaysia is the second largest palm oil exporter in the world. However, the potential of algae as biomass feedstock should also be taken into consideration as Malaysia is located near the Equator and surrounded by the sea. The climate is warm throughout the year, which might favor the growing of algae.
The most studied algae bio-fuel pathway is the lipid extraction and conversion into biodiesel through transesterification [10,11]. Algae lipid extraction by common methods (e.g., Bligh and Dyer method [12]) requires a dry substrate with <10% mass fraction of water, and organic solvents. An alternative pathway is the use of thermochemical processes to convert biomass through thermochemical methods, such as liquefaction, gasification, direct combustion, or pyrolysis technology. From these, pyrolysis and liquefaction have great advantages, as they convert the whole biomass into three different forms of products, namely biochar, liquid bio-oil and syngas. Nevertheless, the requirement of relatively dry biomass feedstock has limited the application of pyrolysis for naturally wet materials and various waste feedstocks that usually content up to 90% of water. Although drying can solve this limitation, it consumes a lot of energy, thus increasing the overall production cost. Hence, for wet biomass feedstock, like algal biomass, hydrothermal liquefaction (HTL) is recommended as this process uses water as a solvent, reactant, and catalyst (in microwave heating) simultaneously, and so, the costly drying process is eliminated. Basically, HTL is performed under a pressurized water condition (40–280 bar) at a relatively moderate temperature (200–450 °C) [13]. Numerous HTL related-studies have been done previously with the purpose of improving the bio-oil yield, such as through optimization of operating condition [14], utilization of different catalysts [15,16], addition of co-feedstock [17], and more recently, implementation of microwave processing technology [18,19].
Microwave heating was firstly introduced as a new heating technique in the 1970s. The very first group of researchers, Gedye et al., found that microwave irradiation could accelerate the organic reaction, and since then, the application of microwave technology in chemistry area has been reviewed [20]. Microwaves are the electromagnetic waves that are formed by coupling of electrical and magnetic fields perpendicularly, with a frequency range between 0.3 to 300 GHz. Most of the reported microwave chemistry experiments are carried out at 2.45 GHz [21,22,23,24]. Microwave heating has been considered as a promising technique for providing the energy required for the thermochemical process due to its volumetric and selective heating mechanism [25,26]. Hence, this allows rapid heating in a cold environment, and helps to preserve the product quality by limiting the secondary and tertiary condensation that causes excess char and tar formation during thermochemical process. It can also help to reduce the energy consumption as the energy is used to directly heat the biomass material, instead of the wall of the reactor. Moreover, a review done by Joo-Sik Kim reported that microwave-assisted system with activated carbon promotes the production of phenolic-rich bio-oil as compared to conventional method [27]. This conclusion is also supported by Gautam et al., in their work of investigating three different macroalgae through microwave-assisted pyrolysis [28]. Liu et al., also found that considerable aqueous products with higher saccharide yield were obtained with shorter reaction time under microwave assisted HTL as compared to the conventional HTL method [29]. Generally, it is concluded that that microwave irradiation can enhance the product yield and accelerate the reaction.
Microwave-assisted HTL of renewable biomass feedstock is a promising method for biocrude oil production. It involves the incorporation of green chemistry with the sustainable biorefinery. It aligns with three out of twelve main principles of green chemistry, which are (i) safer solvent as water is used as the solvent in this process, (ii) design for energy efficiency, in which microwave technology is implemented, and (iii) use of renewable feedstock [18]. However, there are only few attempts on microwave-assisted HTL done by previous researchers for the conversion of biomass such as Herbal crop and Fungus chaff [30], spent coffee grounds [31], maple sawdust [18], pine and spruce [32], microalgal Chlorella sp. [18], and macroalgal Ulva sp. [33]. In short, microwave assisted HTL is a new developed technology for biocrude production. Hence, more exploration should be done to gain more understanding in this technique.
To the best knowledge of the author, there is no information about the utilization of microwave-assisted HTL for macroalgal Chaetomorpha sp. conversion. Chaetomorpha sp. is one of the most common green algae that creates problematic green tide issues. Additionally, it has no direct conflict with other interests, high growth rate, no arable land consumption, and ability to survive in different environment conditions [34]. Therefore, the thermal conversion of macroalgae, Chaetomorpha sp., through microwave-assisted hydrothermal liquefaction was explored in this work. Response Surface Methodology (RSM), or more precisely, Box–Behnken Design was used to determine the effect of operating temperature, water-to-biomass ratio, preloaded pressure, and holding time on bio-oil yield. According to the previous works, macroalgae consists of lower high heating value as compared to other terrestrial biomass feedstock due to its lower carbon content. Hence, the bio-oil produced from macroalgae is not suitable for fuel application [35]. Nevertheless, it might be a suitable feedstock for bio-polymer synthesis, such as bio-based phenol formaldehyde [36,37]. Therefore, the effect of the studied parameters on the quality of bio-oil produced, particularly phenolic content, was also investigated in this study.

2. Materials and Methods

2.1. Materials

The studied algae, Chaetomorpha sp., used in this work was purchased from local market. Then, the algae species was identified through phylogenetic analysis, and cultivated at Institute of Sustainable Energy, UNITEN in order to get a sufficient amount of algal biomass for later experiments. Next, the wet algae were washed with deionized water several times to remove the sea salt, and then were dried for 24 h using a freeze-dryer. After that, the dried algae were pulverized, sealed and stored at 4 °C for further usage. The physiochemical properties of the algae can be found in Table 1. Chemicals, such as Dichloromethane (DCM), Folin–Ciocalteu (FC) reagent, Sodium Carbonate, Gallic Acid, and Acetone, of ACS reagent grade were purchased from Sigma-Aldrich Ltd.

2.2. Multi-Objective Optimization Study Using RSM, Design Expert Software

To achieve the objective of this study, a series of experimental work was conducted to determine the optimal condition for producing high phenolic-content bio-oil via microwave-assisted hydrothermal liquefaction process. Specifically, four different parameters, which are preloaded pressure, operating temperature, holding time, and water to biomass molar ratio, were chosen as the studied parameters in optimizing bio-oil yield and phenolic content simultaneously. The optimization study was performed by using Response Surface Methodology (RSM), or more precisely, the Box–Behnken Design.
The respective low, medium, and high levels of each studied parameters are shown in Table 2. It can be found that the medium level is always the mean of the high and low levels, which is also known as the center point of the experiment. Based on 4 parameters with 3 levels each, a total of 27 experimental runs are required for current optimization study, and the respective operating condition are shown in Table 3. From Table 3, it can also be observed that the center point was replicated three times in order to take the experimental errors into consideration. Then, the hydrothermal liquefaction process was conducted based on these condition settings, and the products was analyzed to measure the bio-oil yield and the phenolic content.

2.3. Microwave-Assisted Hydrothermal Liquefaction

Hydrothermal liquefaction was conducted in a customized microwave reactor. This customized microwave reactor was equipped with a continuous power supply from a 1 kW microwave magnetron. Besides, it is equipped with a 1L Teflon reaction cavity to hold the irradiated samples (water and algal biomass). The design working temperature and pressure for this Teflon cavity are 260 °C and 80 bar. Moreover, the modified microwave reactor consists of gas inlet and outlet, temperature probe, and pressure gauge, and burst disc. It also provides stirring ability by magnetic stirrer. A diagram of the customized microwave reactor is shown in Figure 1.
In this work, the hydrothermal liquefaction was started by preparing the sample, which is the mixture of water and dried algal biomass, at certain ratio. As stated before, one of the main reasons of using hydrothermal liquefaction for the high phenolic-content bio-oil production from marine algae is due its ability to treat naturally high-water content feedstock, and hence increase the cost effectiveness of the process as no energy-extensive drying process is needed. However, freeze-dried algae were used in this work to investigate the effect of water to biomass ratio on the bio-oil and phenolic yield in a more accurate way. Next, the mixture was put into the Teflon reactant cavity, and inserted into the microwave reactor. After that, the microwave system was purged with nitrogen gas (N2) three times to eliminate the residual air, and then was pressurized to the desired pressure before starting the heating process, creating a pressurized and inert reaction environment for the reaction to occur. Lastly, the microwave power and the magnetic stirrer were switched on and let the mixture to be heated to the required reaction temperature with a ramp time of 30 min and holds at the target temperature for certain period according to the operating condition needed. The parameter, holding time, is referred to the duration of the hydrothermal liquefaction process after the irradiated sample reached the target reaction temperature. Once the reaction was completed, the sample and the reactor were left overnight, to be cooled to room temperature. After that, the solid and liquid fraction of the products were collected after the gas releasing. The composition of gas produced during the hydrothermal liquefaction process was not analyzed in this study. The remaining HTL products include the bio-char, unreacted biomass, water that was used as the reaction media, and bio-oil produced during the HTL process. To recover the bio-oil produced, this HTL product mixture was firstly vacuum filtered and followed by a liquid–liquid extractions process.
First of all, dichloromethane (DCM) was added and mixed with the product mixture. Then, the solid portion, which is bio-char, was separated by vacuum filtration through a Whatman No. 5 filter paper. During the filtering process, more DCM was added in order to recover the bio-oil that remained on the bio-char. After that, the DCM-soluble bio-oil was separated from the aqueous phase using a separatory funnel. Lastly, DCM was removed from the bio-oil by rotary evaporation. The bio-oil yield was then calculated by using Equation (1). The bio-oil collected was then analyzed using Fourier Transform Infrared Spectrophotometer (FTIR). Moreover, the bio-oil also underwent a series of experiments to measure its phenolic content, which will be explained in the next section.
Bio - oil   Yield = Weight   of   bio - oil   produced Weight   of   dried   algal   biomass   used × 100 %

2.4. Phenolic Content Determination through Folin-Ciocalteu Method

To determine the total phenolic content, it requires a series of sample preparation procedures. Firstly, the HTL bio-oil sample was dissolved and diluted with ethanol at a known ratio to keep the absorption value within range of 0.06 to 0.6. The diluted bio-oil was then filtered with a 0.45 µm PTFE (hydrophilic) syringe filter. After that, 20 µL of the filtered bio-oil was placed in a 2 mL polystyrene cuvettes (UV absorbance cutoff at approximate 300 nm) [38]. Next, 1.58 mL of deionized water was added into the cuvettes, followed by 100 µL of Folin–Ciocalteu reagent. The solution was mixed thoroughly by pipetting and incubated for 1–8 min subsequently. Then, 300 µL of sodium carbonate solution was added, mixed, and incubated for 2 h at room temperature. A blank reference was also prepared by replacing the filtered bio-oil with deionized water. Lastly, the well-prepared samples were analyzed using a UV-Vis Spectrophotometer (Optizen POP, Mecasys Co. Ltd., Daejeon, Korea) at 765 nm. All readings were measured three times and its average value was calculated and recorded to improve the accuracy and ensure reproducibility of the results. Besides, the phenolic content of the bio-oil sample is presented in wt% gallic acid equivalent (GAE) throughout the work.

2.5. Construction of Calibration Curve for Phenolic Content Determination

Similar procedures with previous section were conducted for the construction of calibration curve by using different gallic acid standards before determining the phenolic content in the bio-oil sample. To prepare the gallic acid standards with different concentration, 5 g/L gallic acid stock solution was firstly made by dissolving 0.5 g of gallic acid in 10 mL of ethanol and then diluted to a final volume of 100 mL with deionized water. Then, the gallic acid standard with 50 mg/L, 100 mg/L, 250 mg/L, and 500 mg/L was done by diluting 1 mL, 2 mL, 5 mL, and 10 mL of gallic acid stock solution to a final volume of 100 mL with deionized water, correspondingly. These standards can be stored up to 2 weeks at 4 °C. Besides, the sodium carbonate solution used in the sample preparation was made by dissolving 200 g anhydrous sodium carbonate in 800 mL of deionized water. The mixture was boiled and stirred to make sure all the sodium carbonate crystal was dissolved. After cooling naturally to room temperature, a few sodium carbonate crystals were added to the solution. After 24 h storage at room temperature, the solution was then filtered with Whatman #42 filter paper and diluted to 1 L final volume with deionized water. This sodium carbonate solution can be stored for an indefinite period at room temperature.
Figure 2 plots the absorbance value for the respective gallic acid standards at 765 nm. The respective standard deviation was also shown as error bar in the figure. In addition, a best-fit line, with a correlation coefficient (R2) of 0.9855, was shown. A regression equation, that shows the relationship between absorbance value at 765 nm and the gallic acid concentration, was obtained (refer Equation (2)).
A b s 765   nm = 0.0006 × C 0.0255  
where Abs765 nm is the absorbance value of the sample solution (in this case, the diluted HTL bio-oil) at 765 nm, and C symbolizes the concentration of phenolic content in the sample solution in terms of Gallic Acid Equivalent (GAE mg/L). This equation was then used extensively in determining the phenolic yield in the later experiments. Lastly, the final phenolic yield was calculated according to the dilution ratio, and Equation (3) was used to convert it into wt% GAE.
P h e n o l i c   y i e l d s   wt %   GAE = C   mg L d e n s i t y   of   g a l i c o   a c i d   mg L × 100 %

2.6. Sensitivity Analysis

The importance of the studied variables (operating temperature, preloaded pressure, water-to-algal biomass ratio, and holding time) was explored through conducting the sensitivity analysis. In this analysis, Equation (4) is used with the “sum of squares” values obtained from the ANOVA table generated from response surface methodology (RSM).
s e n s i t i v i t y   % = S x S y × 100
where Sx and Sy indicate the sum of square of the individual variable and total sum of squares of all the variables, correspondingly.

2.7. Fourier Transform Infrared Spectrophotometer (FTIR)

Fourier Transform Infrared Spectrophotometer (FTIR) is well-known for the qualitative analysis of organic compounds [39,40]. In this work, a Shimadzu IRPrestige-21 FTIR, that equipped with temperature controlled DLATGS (deuterated, L-alanine doped triglycerine sulfate) detector was used to identify the functional groups of the bio-oil obtained. The FTIR scan of the sample was done under transmittance measurement mode (%T) for a scanned range of 4000–650 cm−1 at 4 cm−1 resolution and accumulation of 20 scans. To analyze the sample using FTIR, the Attenuated Total Reflectance (ATR) crystal disc (Diamond Type II crystal) was firstly wiped with acetone and a background analysis of air spectrum was run. Then, the sample was dropped onto the ATR crystal disc at ambient temperature (23 ± 1 °C) and the chromatogram of that particular sample, which was referenced against the background spectrum, was obtained. All the spectra obtained was analyzed using IR resolution software (IR solution-window based version 1.4-Shimadzu). After each run, the ATR crystal disc should always be cleaned with acetone and repeated for the next sample.

3. Results and Discussion

3.1. Multi-Objectuve Optimization Study

In order to optimize the yield of high phenolic-content bio-oil from algal Chaetomorpha sp. via microwave-assisted hydrothermal liquefaction, a series of experiments was conducted. Four parameters, including the temperature, preload pressure, water to algal biomass ratio, and reaction time, were investigated. A total of 27 experimental runs with different parameter settings were carried out based on the order suggested by the Design Expert software. Table 3 summarized the operating settings and the results for each experimental run.
In this study, there are two responses that need to be optimized, which are the bio-oil yield and the phenolic content of the bio-oil. Therefore, the raw data obtained must be analyzed first before conducting this multi-objective optimization study. Table 4 and Table 5 are the fit summary tables for two respective responses, the bio-oil yield and the phenolic yield. Fit summary table is usually used as an initial guideline in choosing a suitable mathematical model to express the responses. According to these tables, the suggested model for both bio-oil yield and phenolic yield is a quadratic model, which is the model with the highest order polynomial that can fit (not aliased) the responses. This selection is based on the few values, including sequential p-value, lack of fit p-value, and adjusted and predicted R-squared values. For both responses, the sequential p-value is very small, which is less than 0.0001. This indicates that the suggested model is good in explaining the trend of the response, rather than modeling the noise. Moreover, a lack of fit p-value of more than 0.1 (0.2166 for bio-oil yield and 0.1439 for phenolic yield) also shows that the quadratic model is fit with the response. Lastly, adjusted and predicted R-squared values that are near to 1 also justified that quadratic model is good in explaining the variation during analyzing the response. The higher the R-squared values, the better the model. Although the lack of fit p-value and the R-squared values for the cubic model are better than the quadratic model, however, the additional cubic model terms will cause the model to be aliased and hence, the quadratic model has been suggested as the most suitable model for both responses in this study.
The next useful statistic table is the ANOVA table. ANOVA is very important to evaluate the hypothesis on the parameters of the model. Important information can be obtained based on the ANOVA table (refer to Table 6 and Table 7), especially the p-value. The p-value indicates the importance of that particular term on the design model in explaining the response. The term with a p-value more than 0.05 is insignificant and has been removed to increase the suitability of the quadratic model to the results of this study. As shown in the ANOVE tables, the studied parameters: reaction temperature, preload pressure, water-to-algal biomass ratio, and holding time were presented as A, B, C, and D, respectively. For the bio-oil yield response, the AB, AD, BD, and CD were excluded from the quadratic model. By removing these insignificant terms, the F-value was increased from 204.87 to 337.52, as shown in Table 8. The F-value measures the comparison between the variance of the specific term with the residual variance. The larger the F-value, the more likely that the variance contributed by the model is significantly larger than random error. For phenolic yield response, however, the term AB, AC, AD, BC, BD, B2 and D2 are excluded from the quadratic model, and as a result, the F-value was improved from 58.33 to 87.91. Moreover, the particular lack of fit F-value, for bio-oil yield response and phenolic yield response, of 3.25 and 7.84 implies that the effect of “lack of fit” is negligible (not significant). In the order words, the respective reduced quadratic model is fit to be used for the responses for further analysis.
Furthermore, as shown in Table 8, the predicted and adjusted R-squared values also showed slight overall improvement as the result of design model reduction. The adequate precision, that measures the signal to noise ratio, shows a value of 58.233 and 33.525 for bio-oil yield and phenolic yield response correspondingly. This has in turn proved that the respective reduced quadratic model is adequate (more than 4) and strong enough to be used for optimization.
Furthermore, diagnostics plots (Figure 3 and Figure 4) were drawn and analyzed before further proceed with optimization to ensure all the experimental data obtained can be well-explained by the selected model. s a and a plot the residual against experimental run order. Residual is defined as the difference between experimental data (actual response) and the predicted data (predicted response based on the selected model). As shown in these figures, both plots are in a random pattern and all data points are within the range. This indicates that the analysis is reasonable, and no outlier or influential value is observed. Influential value is a data point that is powerful and can greatly affect the results of regression analysis. The present of influential value might be caused by the measurement error. The next diagnostic plots, as plotted in s b and b, show the relationship between normal probability and residuals. This type of graph is commonly used to identify whether the residuals follow a normal distribution. For both responses, it can be observed that all the points are scattered evenly with the normal data line. Hence, it can be concluded that the respective reduced quadratic model has high capability and is sufficient to predict and describe the result obtained. In short, no experimental run was needed to be re-conducted, and the final mathematical model used to describe the bio-oil yield and phenolic yield are as below:
Predicted   Bio-oil   Yield =   223.18 + 1.5940 × Temperature + 2.8050 × Preload   pressure +   0.2050 × Water   to   algal   biomass   ratio + 0.1736 × Reaction   time +   0.0011 × Temperature   ×   Water   to   algal   biomass   ratio +   0.0077 × Preload   pressure   ×   Water   to   algal   biomass   ratio 0.0036 × Temperature 2   0.0042 ×   Preload   pressure 2     0.0109   ×   Water   to   algal   biomas   ratio 2   0.0014   ×   Reaction   time 2
Predicted   Phenolic   Yield =   193.02 + 1.6961 × Temperature + 0.2586 × Preload   pressure +   0.3761 × Water   to   algal   biomass   ratio 0.0505 × Reaction   time +   0.0046 × Water   to   algal   biomass   ratio × Reaction   time 0.0037 × Temperature 2   0.0095 × Water   to   algal   biomass   ratio 2
Equations (5) and (6) were then used for the multi-objective optimization study, optimizing bio-oil yield and phenolic yield at the same time.
Table 9 reports the constraints set in the Design Expert software for optimization purpose. Based on the solutions suggested by the software, the combination with reaction temperature of 226 °C, 42 bar of preload pressure, 30 water to algal biomass ratio and a reaction time of 79 min able to achieve optimal bio-oil yield and phenolic yield of 20.94% and 19.15 wt% GAE, respectively. Based on this suggested optimal condition, a series of experiments was conducted to validate the results. As a results, the average experimental bio-oil yield and phenolic yield obtained under the suggested optimal condition was 21.47% and 19.22 wt% GAE, respectively. The comparison between the best results obtained before optimization study and the predicted optimized results was summarized in Table 10. As shown, a higher bio-oil yield with better quality (higher phenolic content) can be obtained at lower temperature and shorter holding time, by only increasing the preloaded pressure by 7 bar. This eventually validates the effectiveness of the optimization study using Box–Behnken Design.

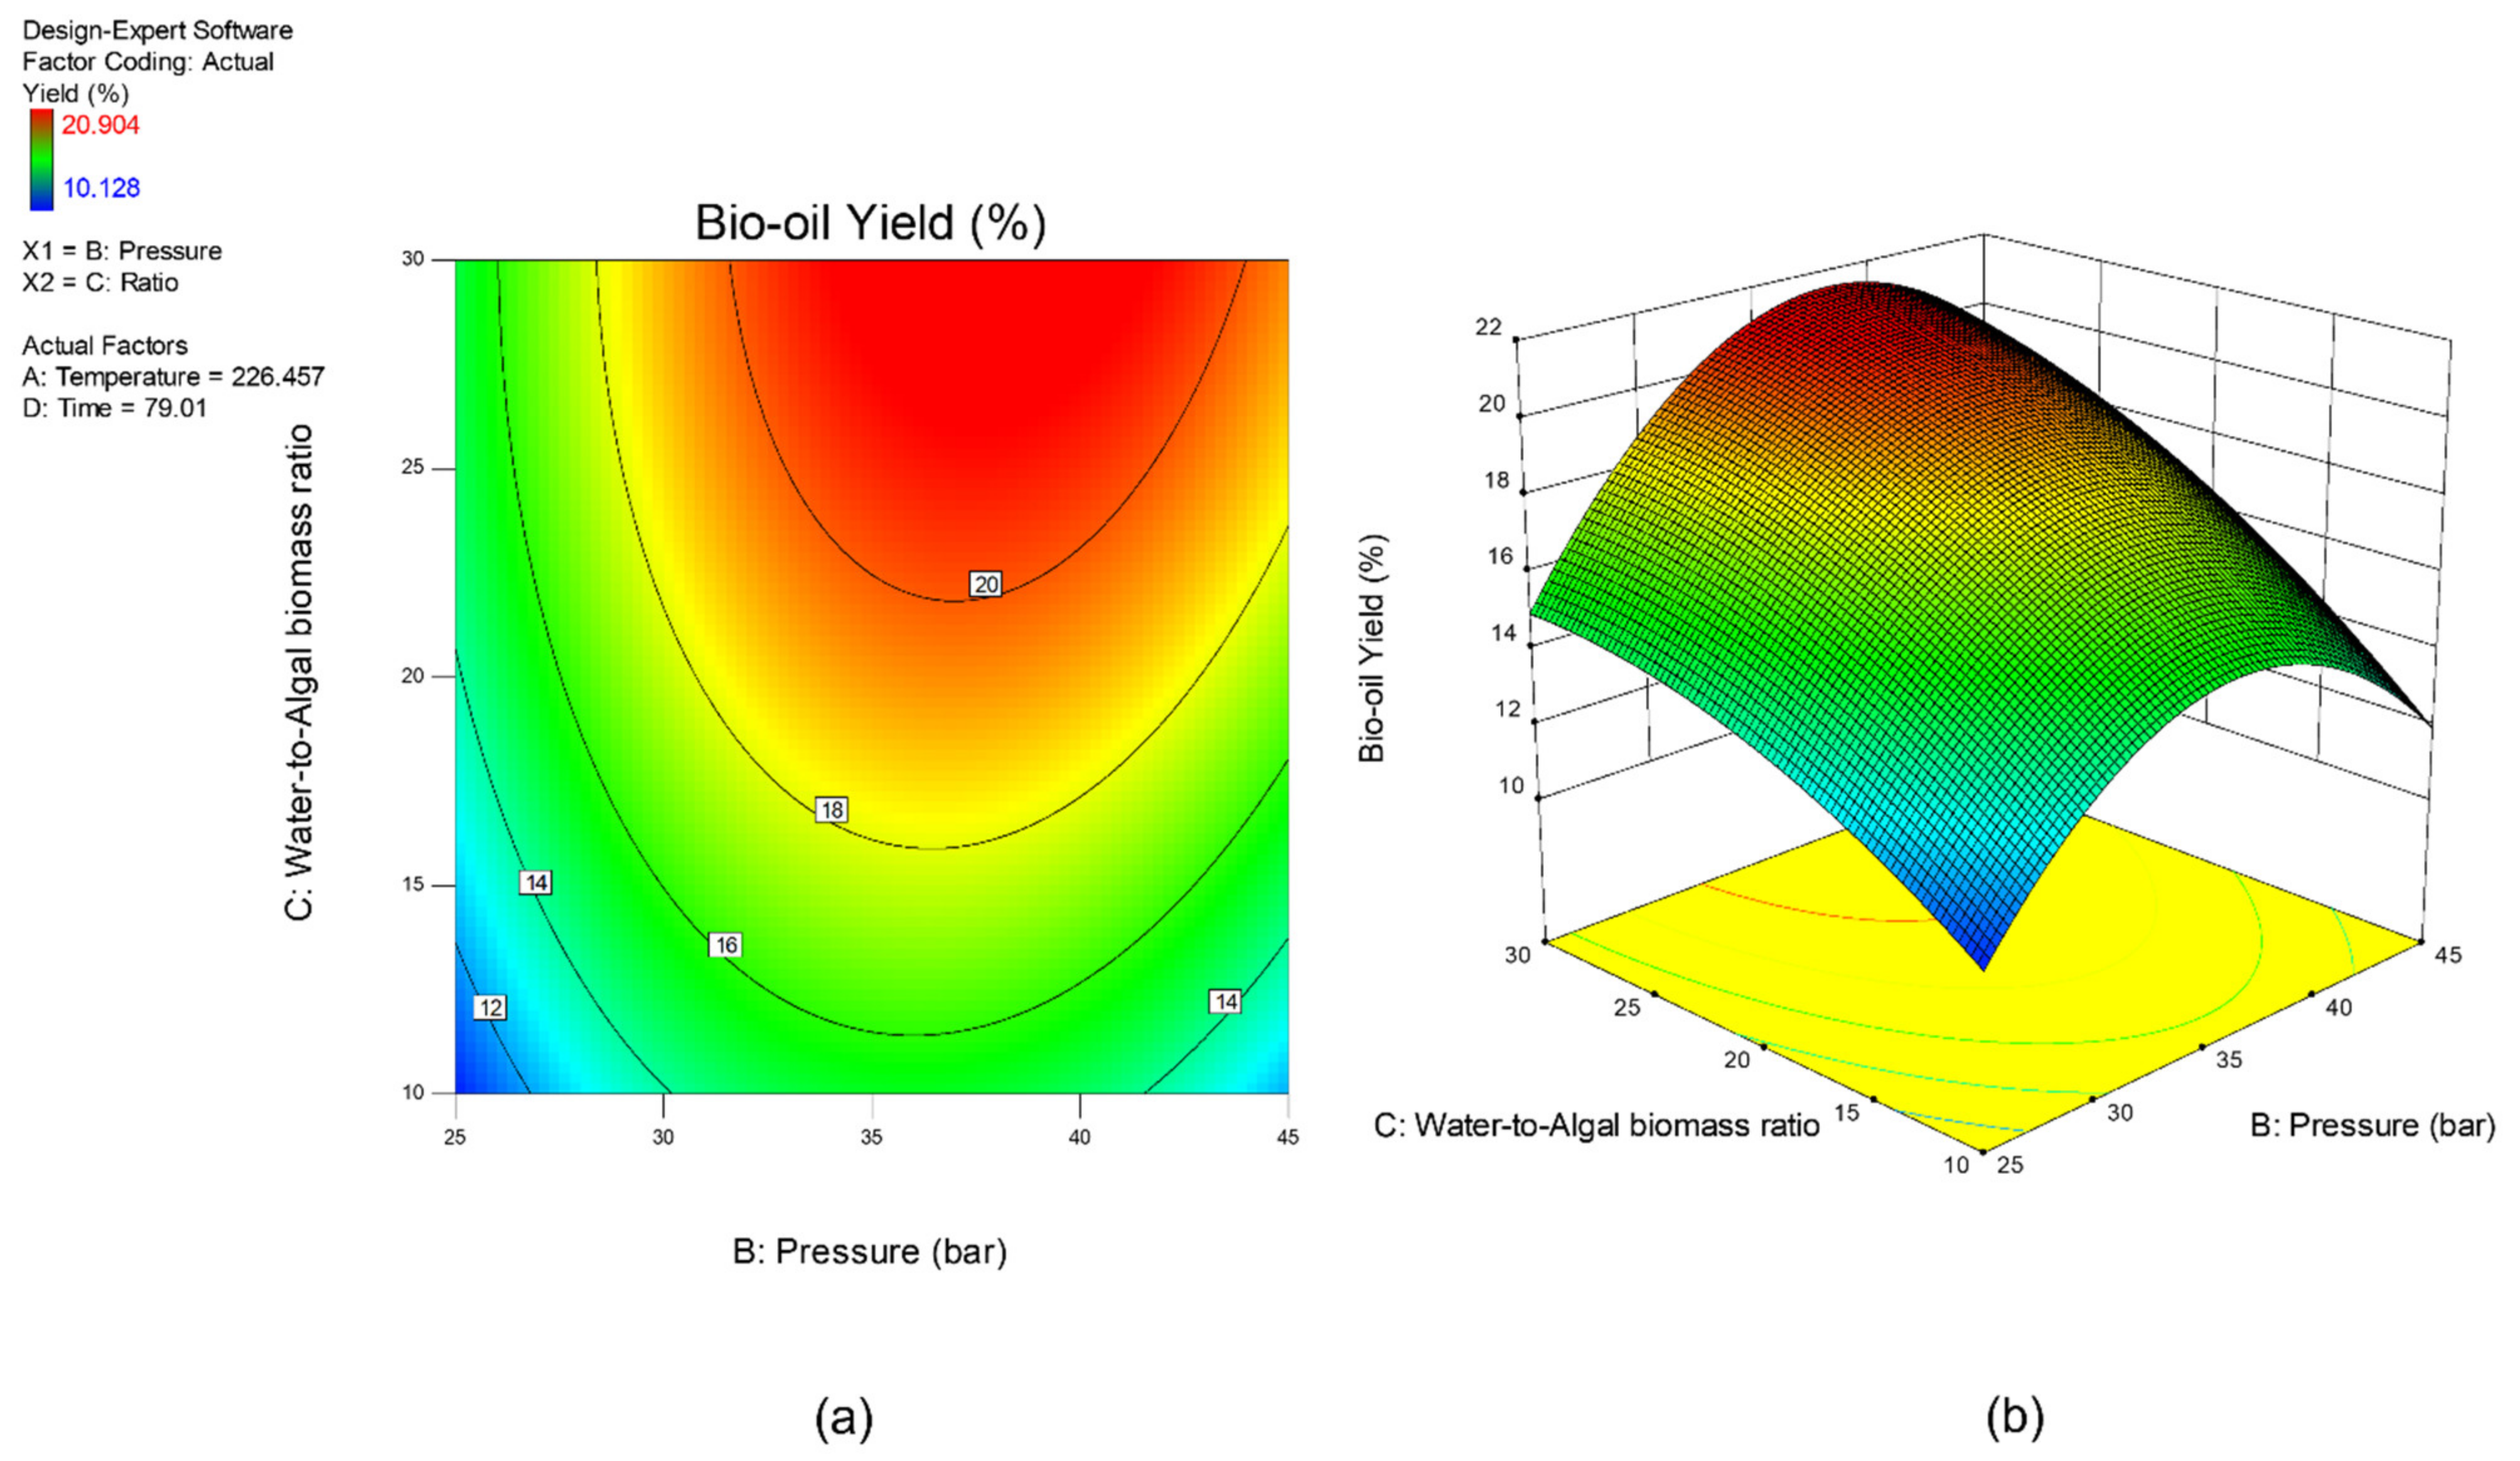
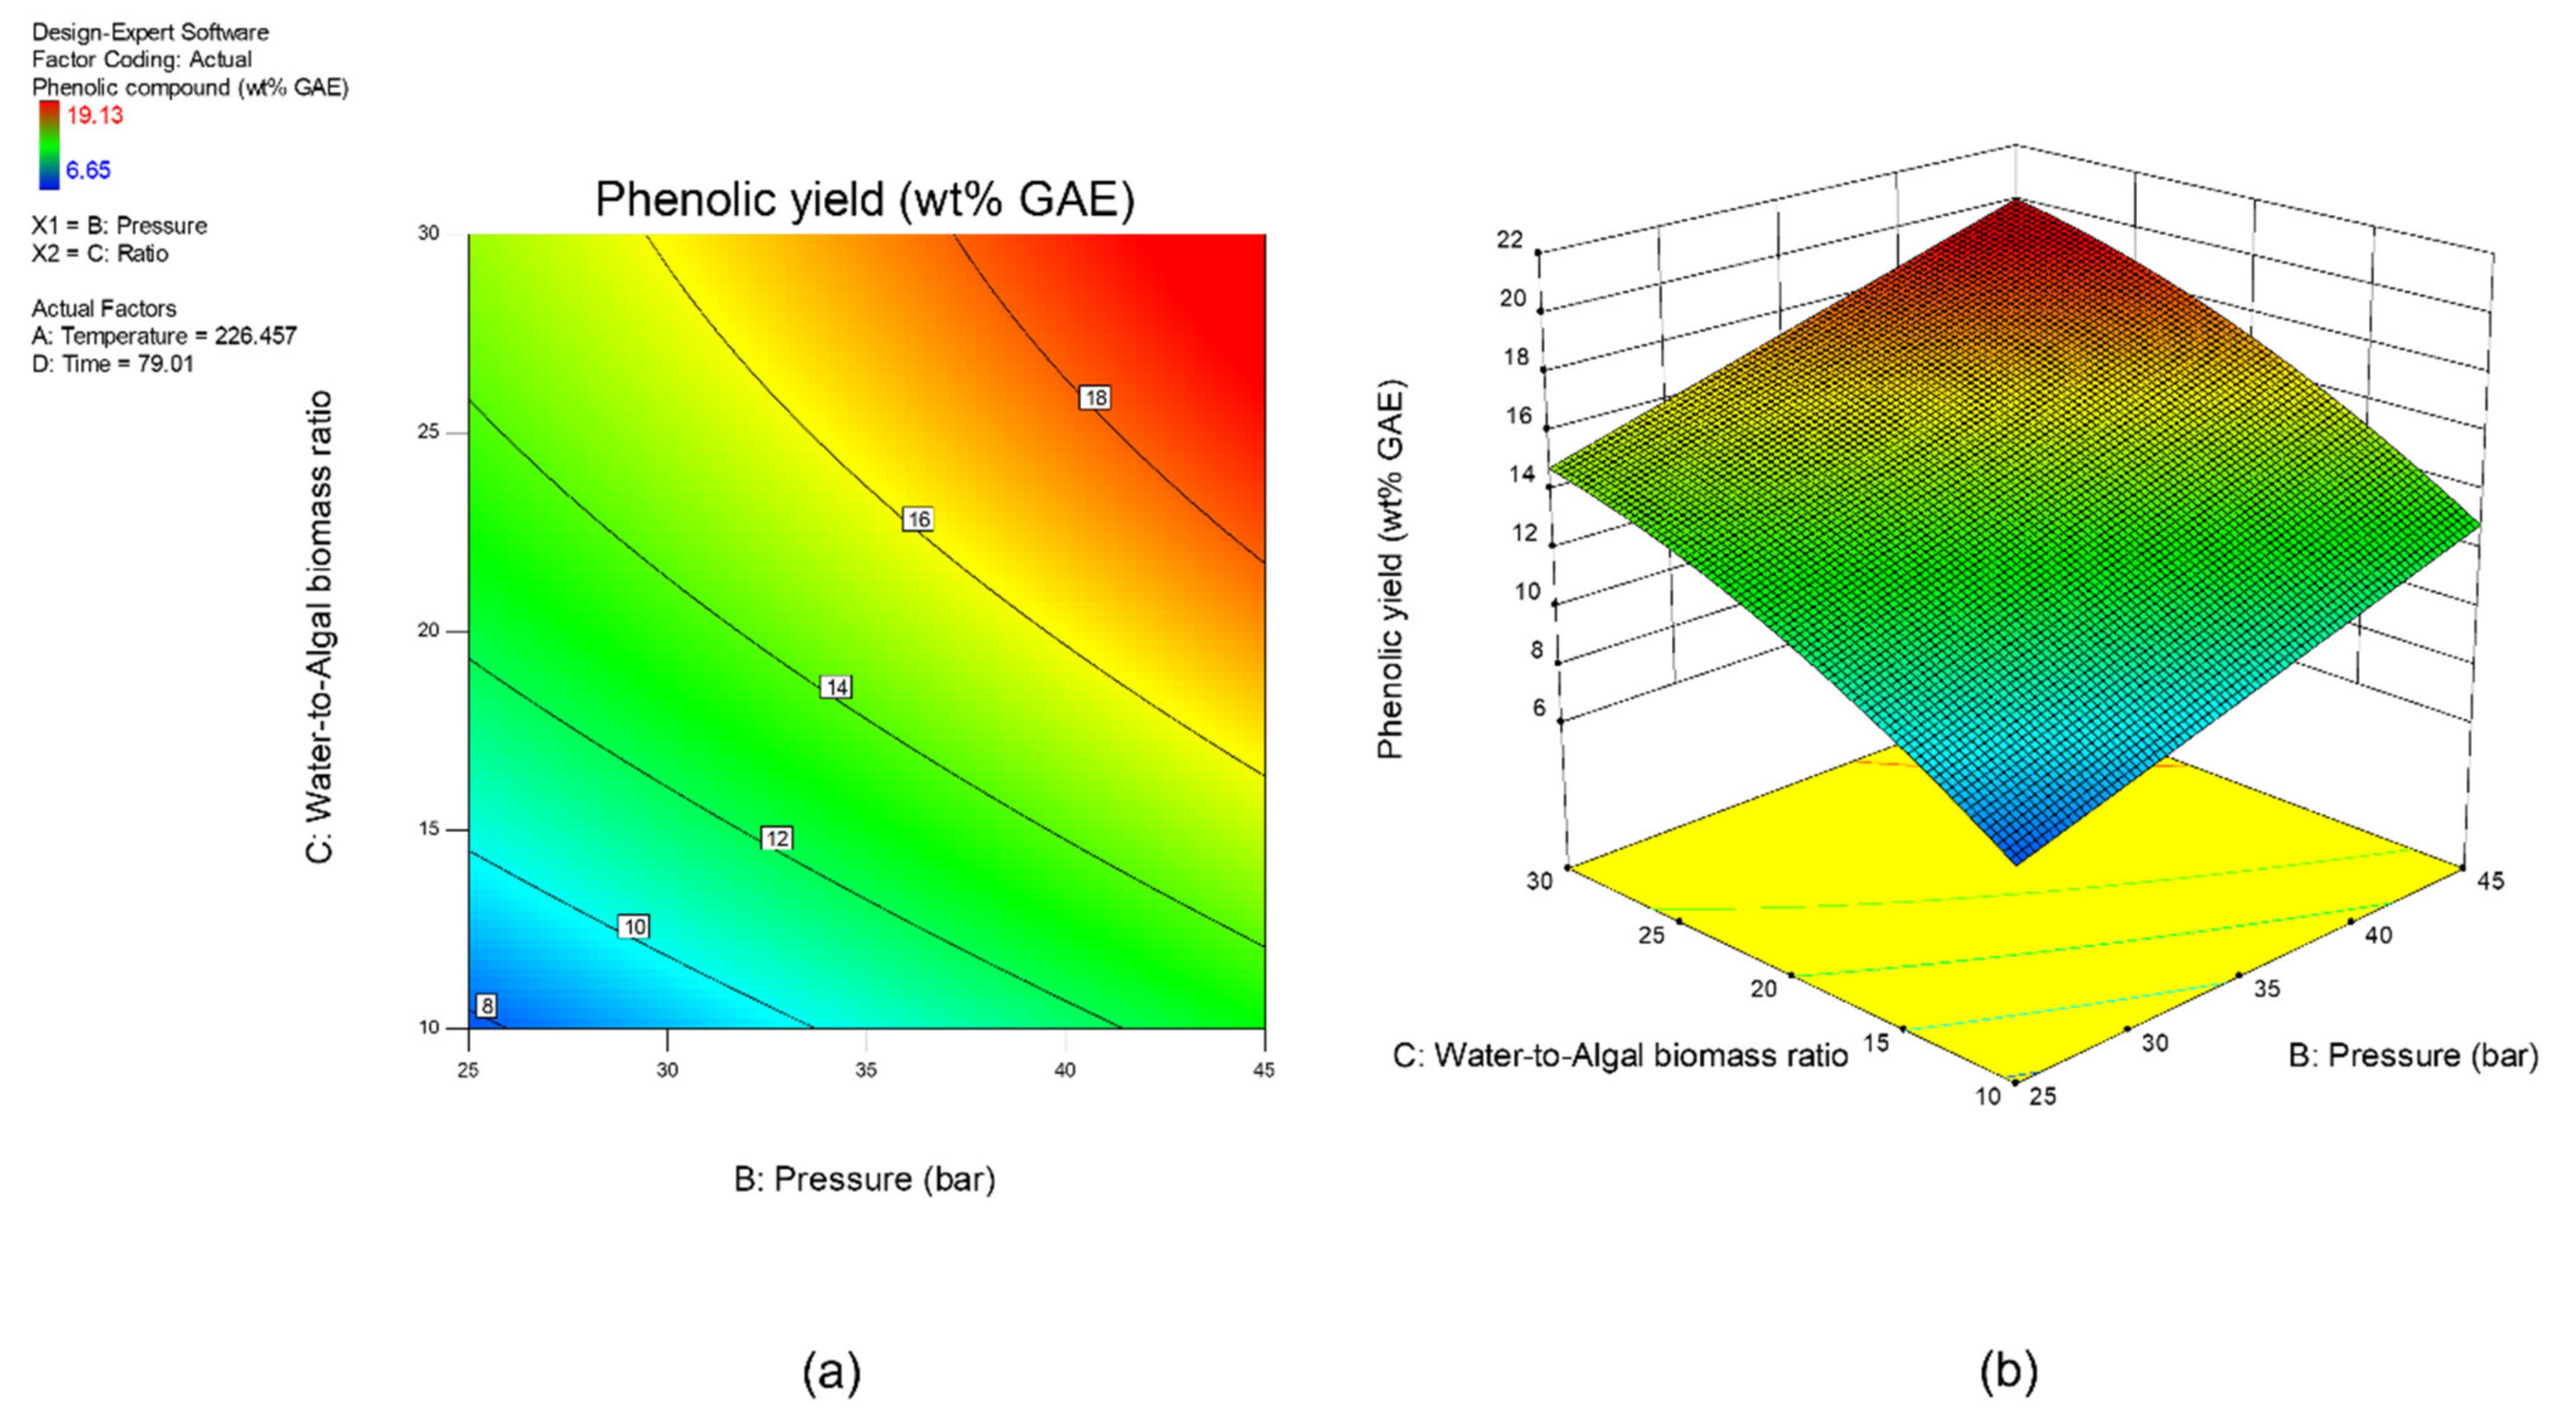
3.2. Effect of Studied Parameters on the Results & Sensitivity Analysis

Sensitivity analysis was conducted to further identify the most influential variables for both responses. As shown in Figure 5, the parameter water to algal biomass ratio has the most significant impact on both bio-oil yield and phenolic yield, followed by the parameter preload pressure. Lastly, reaction time and reaction temperature are the least influential variables for both bio-oil and phenolic yield. The perturbation plot for responses, bio-oil yield, and phenolic yield are also plotted as presented in Figure 6 and Figure 7, to provide a clearer view on the individual impacts of the studied parameters. Moreover, contour plot and three-dimensional diagram for bio-oil yield (Figure 8) and phenolic yield (Figure 9) were also generated to illustrate the relationship between the two most influential independent variables (others were kept constant) and the responses.
Many researchers have investigated the potential effect of water/biomass loading on hydrothermal liquefaction [41,42,43]. Unlike other research work [14,44], the water-to-algal biomass ratio was found to have the most significant impacts on bio-oil and phenolic yield for microwave-assisted HTL conversion of algae Chaetomorpha sp. in this work. In the other words, slightly changes in the water to algal biomass ratio will bring larger variations to the results in comparison to other studied factors. This might be due to the different processing technique used as the HTL process was intensified by microwave technology in this work. Microwave processing technique is well-known as a better heating method as compared to the conventional heating due to its unique thermal and non-thermal effects [45]. In the work done by the early researchers, they found that the microwave heating can improve the reaction rate by a factor of 5 to 1000 [20]. Other than this, microwave heating also offers advantages, including rapid heating, lower relative energy consumption, greener production method, higher and cleaner product yield and others [46]. Besides that, some studies reported that microwave energy can revolutionize the reactions, making them to be performed with unexplainable results. Hence, the whole scientific and industrial community is interested with the application of microwave technology in different areas [46,47,48]. On the other hand, microwave processing technology consist of certain drawbacks such as higher initial investment cost and maintenance cost, especially for a commercial scale setting as it requires the replacement of the current conventional system with the microwave reactor [49,50]. Furthermore, the microwave irradiation has limited penetration depth. In the other words, the solvents/reactants in the center of large microwave reactor are heated by convection, instead of direct microwave heating [51]. This might forfeit the advantages of microwave processing, and so microwave scaling-up technology is challenging.
From the perspective of microwave technology, materials can be divided into three categories, which are microwave-transparent, microwave absorber, and microwave reflector, based on their electrical and magnetic properties. As their name implies, microwave-transparent material allows microwave energy to penetrate through them completely with no energy transfer. Microwave absorber, however, absorbs the microwave energy that passes through it and transforms it into heat energy. Lastly, the microwave reflector material is opaque to microwave energy and does not allow the microwave energy to penetrate through. In the case of microwave-assisted HTL, microwave energy is used as the heating source, and so, microwave absorber, especially the water with high dielectric constant, plays an important role in absorbing the microwave energy and transforming it into heat energy. Moreover, water could act as a catalyst during the microwave-assisted reaction [52,53]. Therefore, the ratio of water to algal biomass has become the most influential factors as shown in the result of sensitivity analysis. The higher the ratio (water: algal biomass), the higher the amount of water, the more the microwave energy is being absorbed, and resulting in higher bio-oil yield and phenolic yield (Figure 6 and Figure 7).
The next influential factors are the preloaded pressure, followed by the reaction temperature for bio-oil yield, and holding time for phenolic yield. These three parameters have been suggested by some researchers to be the most influential factor that effecting the HTL product [54,55]. However, they are found to have less impact as compared to water-to-algal biomass ratio in this work. This might because the HTL process was intensified by the microwave technology in this study and the water is the dominant microwave absorber as mentioned before. The preloaded pressure in this work refer to the pressure loaded to the reactant cavity before the HTL process. This pressure is important to achieve the desirable final pressure of around 60–80 bar. The results showed that higher pressure resulted in higher bio-oil yield, but decreases after certain optimal point. For the phenolic yield, the phenolic content increases along with pressure. Higher pressure is important to ensure the water is always in the liquid form for the complete conversion of algal biomass into bio-oil [56]. Generally, temperature and pressure are interlinked parameters as the rise in temperature will result in pressure increment. The typical operating temperature of the conventional HTL are within the range of 200–450 °C and under pressure 50–250 bar [32,54]. Most of the works reported that the bio-oil yield increases along with temperature until it reaches an optimal temperature. Further temperature increment after the optimal temperature, however, causes lower bio-oil yield [16,54,57]. This is because water properties vary in different condition stages, as shown in Table 11.
As the temperature and pressure increases, the density of water reduces, which in turn promotes fast and uniform reactions which ideal for accommodating biomass particles. Moreover, the ionic product of water increases along with temperature and pressure under subcritical conditions. Ionic product of water is the product of H+ and OH concentrations. It shows the number of available hydronium and hydroxide ions presents in the water. The increased of ionic product of water can accelerate the biomass hydrolysis, in which the complex macromolecules, such as protein, lipid, and carbohydrate undergo isomerization, depolymerization and condensation reaction, and eventually form bio-oil [59]. When the temperature increases beyond the critical temperature, the ionic product decreases, and free radical reactions, that promote char formation, dominate the HTL process [60]. Jayathilake et al., reported that the HTL conversion of alkali lignin into bio-char increased drastically, from 11.02% to 33%, when the temperature increased from 300 to 350 °C [61]. Additionally, high operating temperature and pressure of HTL process might also enhance the bio-gas formation (carbon dioxide CO2, ammonia NH3, and methane CH4) as the secondary decomposition of certain water-soluble molecules, including cellohexaose, furfural, and protein-derived amino acid, become active. Therefore, the bio-oil yield turns out to be lower at temperature beyond the critical point [62,63,64]. Similar trend was also observed in this study. The results showed that the bio-oil production from Chaetomorpha sp. via microwave-assisted hydrothermal liquefaction increases with reaction temperature, and began to decline at temperature above 230 °C. In the work done by Diego et al., the bio-oil yield from brown algae Alaria esculenta decreases as the temperature is further increase above 360 °C [65]. Yang et al. and Zhou et al., however, reported that the bio-oil production from Enteromorpha prolifera started to decrease at a lower temperature of 290 and 300 °C, respectively [57,66]. As notice, the optimal temperature found in this study was lower than the other research works. One of the reasons might be different algal species was used. The biochemical components of the biomass feedstock consist of considerable impact on the bio-oil yield and quality [30]. Besides, microwave technology was implemented in this work. Hence, the unique volumetric heating mechanism might create certain non-thermal effect and brings down the optimal temperature [45,67,68]. This phenomenon is also possibly cause by the higher efficiency of energy transmission during microwave-assisted liquefaction [69]. In addition, the dielectric constants of the water reduce as the temperature increases, causing the water transformed from highly hydrogen-bonded solvent to non-polar solvent (refer Table 11). This phenomenon is good for the solubility of non-polar hydrophobic organic compound such as lipid, but this will eventually reduce the microwave absorption ability of the water in microwave-assisted process [70]. Hence, the compromise between dielectric properties and solubility within the subcritical stage might bring down the optimal temperature for a microwave assisted HTL in comparison to conventional HTL. Moreover, similar result was reported by Zhuang et al., in which the maximum bio-oil yield was achieved at temperature around 240 °C, which is lower than that of conventional HTL at around 300 °C [30].
Besides, the effect of holding/reaction time was also investigated in this work. The reaction time plays an important role in defining the composition of products [71]. Figure 7 showed that longer holding time results in higher phenolic yield. This might be due to the conversion of heavier intermediates took places at longer reaction time [60]. This finding has high agreement with the research work done by Pinkowska and Wolak, who reporting that highest phenolic content was measured at the longest residence time [72]. On the other hand, the bio-oil yield increases as the holding time increases, and then decreases after 60 min of reaction time. This is because longer residence time could promote gas (via decarboxylation, cracking, and pyrolysis) and char formation (by condensation, crystallization and repolymerization), and eventually results in lower bio-oil yield [32,73,74].

3.3. FTIR Results

The FTIR spectra of bio-oil collected from the microwave assisted hydrothermal liquefaction of macroalgae Chaetomorpha sp. was obtained and presented in Figure 10. Few main peaks were identified, and their respective possible assignment are highlighted in Table 12. The board vibrational band noticed at 3298 cm−1 might be explained by the presence of –OH functional group in phenols or water [75]. Besides, the significant peaks observed at 2926 cm−1 and 2858 cm−1 are corresponding to the C–H asymmetric and symmetric band of alkyl groups, indicating the presence of methyl and methylene groups of hydrocarbons in the sample [30,76,77,78]. Moreover, there was also a strong absorbance peak at 1674 cm−1 that attributed to C=O stretching of ketones, aldehydes, esters, and/or acids [41]. The peak at 1361 cm−1, however, indicates the primary and secondary O–H bending (in-plane), and/or O–H bending of phenol or tertiary alcohol. It also can be caused by the presence of CH3 and CH2 in the aromatic ring. Furthermore, the C–H stretching bending at 1460 cm−1 and 1388 cm−1 with the C–O bending at 1000–1300 cm−1 suggests the presence of fats and ester group in the sample [79]. Lastly, the aromatic C=C stretching observed at 1521 cm−1 and the peaks appearing at band <1000 cm−1 are ascribed to aromatic compound [80]. In short, different functional group of compounds was observed based on the FTIR analysis of the bio-crude obtained. In the other words, hydrocarbon exists in the bio-oil produced with some oxygenated compounds. Hence, it can be concluded that the macroalgae Chaetomorpha sp. has been successfully broken into valuable bio-crude via the microwave-assisted hydrothermal liquefaction process.

4. Conclusions

In this work, RSM–Box–Behnken design was deployed to locate the optimal conditions for both bio-oil and phenolic yield based on the variables: (i) reaction temperature, (ii) preloaded pressure, (iii) water-to-algal biomass ratio, and (iv) holding time, from marine algal Chaetomorpha sp. through microwave-assisted hydrothermal liquefaction (HTL). The optimization result predicted that the combination with reaction temperature of 226 °C, 42 bar of preload pressure, 30 water to algal biomass ratio and a reaction time of 79 min able to achieve optimal bio-oil yield and phenolic yield of 20.94% and 19.15 wt% GAE, respectively. Based on this suggested optimal condition, a series of experiments was conducted to validate the results and the experimental results obtained was 21.47% and 19.22 wt% GAE. Besides, two mathematical models were generated successfully to describe the responses, in this case, bio-oil yield and phenolic yield. Based on the sensitivity analysis, “water-to-algal biomass ratio” has the highest impact on the responses, followed by the “preloaded pressure”. This might because the HTL process was intensified by the microwave technology in this work and the water is the dominant microwave absorber. Moreover, it was found that the bio-oil yield increases with reaction temperature and holding time, and began to decline at temperature above 230 °C and 60 min, correspondingly. This is because higher reaction temperature and/or longer residence time could promote gas (via decarboxylation, cracking, and pyrolysis) and char formation (by condensation, crystallization and repolymerization), and eventually results in lower bio-oil yield. On the other hand, the highest phenolic yield was observed at the longest residence time. FTIR results showed the presence of hydrocarbon in the bio-oil produced. In short, the macroalgae Chaetomorpha sp. has been successfully broken into valuable bio-crude via the microwave-assisted hydrothermal liquefaction process. The results of this work might serve as a good starting to evaluate the potential of Malaysian marine biomass in the bio-oil production for bio-polymer synthesis.

Author Contributions

Conceptualization, M.Y.O. and S.N.; methodology, M.Y.O. and S.N.; software, M.Y.O.; validation, M.Y.O.; writing—original draft preparation, M.Y.O.; writing—review and editing, M.Y.O. and S.N.; supervision, S.N.; funding acquisition, S.N. All authors have read and agreed to the published version of the manuscript.

Funding

This research was funded by AAIBE Chair of Renewable Energy with grant number 202006KETTHA, under the management of iRMC, Universiti Tenaga Nasional (UNITEN). The APC was funded by IC-6 BOLDREFRESH2025—CENTRE OF EXCELLENCE (J510050002).

Institutional Review Board Statement

Not applicable.

Informed Consent Statement

Not applicable.

Acknowledgments

The authors would like to thank Universiti Tenaga Nasional (UNITEN) for the research facilities. M.Y.O. would also like to express her gratitude to UNITEN for the UNITEN Postgraduate Excellence Scholarship 2019 (YCU-COGS).

Conflicts of Interest

The authors declare no conflict of interest.

References

  1. IEA. 2020 Regional Focus: Africa—Electricity Market Report. Available online: https://www.iea.org/reports/electricity-market-report-december-2020/2020-regional-focus-southeast-asia (accessed on 8 April 2022).
  2. Chen, W. Oil and Gas and Then? Available online: https://fdocuments.net/document/oil-and-gas-and-then-wong-petronas-dagangan-bhd-and-petronas-gas-bhd-a-feature.html (accessed on 5 May 2022).
  3. Sánchez-Borrego, F.J.; Álvarez-Mateos, P.; García-Martín, J.F. Biodiesel and other value-added products from bio-oil obtained from agrifood waste. Processes 2021, 9, 797. [Google Scholar] [CrossRef]
  4. Abdul Malek, A.B.M.; Hasanuzzaman, M.; Rahim, N.A. Prospects, progress, challenges and policies for clean power generation from biomass resources. Clean Technol. Environ. Policy 2020, 22, 1229–1253. [Google Scholar] [CrossRef]
  5. Nima, S.; Sutheravut, P.; Homket, Y. A Novel Community Health Impact Assessment towards a Public Policy: A Case Study of Biomass Power Plants in Southern Thailand. J. Southwest Jiaotong Univ. 2021, 56, 361–371. [Google Scholar] [CrossRef]
  6. Salinas, L.F.C.; Ochoa, G.V.; Escorcia, Y.C. A Scientometric Analysis of the Investigation of Biomass Gasification Environmental Impacts from 2001 to 2017. Int. J. Energy Econ. Policy 2018, 8, 223–229. [Google Scholar]
  7. He, W.; Luo, J.; Xing, L.; Yu, X.; Zhang, J.; Chen, S. Effects of temperature-control curtain on algae biomass and dissolved oxygen in a large stratified reservoir: Sanbanxi Reservoir case study. J. Environ. Manag. 2019, 248, 109250. [Google Scholar] [CrossRef]
  8. Wahlen, B.D.; Wendt, L.M.; Murphy, J.A.; Seibel, F. Mitigation of variable seasonal productivity in algae biomass through blending and ensiling: An assessment of compositional changes in storage. Algal Res. 2019, 42, 101584. [Google Scholar] [CrossRef]
  9. Carpio, R.B.; Zhang, Y.; Kuo, C.T.; Chen, W.T.; Schideman, L.C.; de Leon, R.L. Characterization and thermal decomposition of demineralized wastewater algae biomass. Algal Res. 2019, 38, 101399. [Google Scholar] [CrossRef]
  10. Teo, S.H.; Islam, A.; Taufiq-Yap, Y.H. Algae derived biodiesel using nanocatalytic transesterification process. Chem. Eng. Res. Des. 2016, 111, 362–370. [Google Scholar] [CrossRef]
  11. Chamola, R.; Khan, M.F.; Raj, A.; Verma, M.; Jain, S. Response surface methodology based optimization of in situ transesterification of dry algae with methanol, H2SO4 and NaOH. Fuel 2019, 239, 511–520. [Google Scholar] [CrossRef]
  12. Bligh, E.G.; Dyer, W.J. A Rapid Method of Total Lipid Extraction and Purification. Can. J. Biochem. Physiol. 1959, 37, 911–917. [Google Scholar] [CrossRef]
  13. Zhou, Y.; Hu, C. Catalytic thermochemical conversion of algae and upgrading of algal oil for the production of high-grade liquid fuel: A review. Catalysts 2020, 10, 145. [Google Scholar] [CrossRef] [Green Version]
  14. Hadhoum, L.; Loubar, K.; Paraschiv, M.; Burnens, G.; Awad, S.; Tazerout, M. Optimization of oleaginous seeds liquefaction using response surface methodology. Biomass Convers. Biorefin. 2021, 11, 2655–2667. [Google Scholar] [CrossRef]
  15. Erdem, M.; Akdogan, E.; Bekki, A. Optimization and characterization studies on ecopolyol production from solvothermal acid-catalyzed liquefaction of sugar beet pulp using response surface methodology. Biomass Convers. Biorefin. 2021. [Google Scholar] [CrossRef]
  16. Jazie, A.A.; Hydary, J.; Abed, S.A.; Al-Dawody, M.F. Hydrothermal liquefaction of Fucus vesiculosus algae catalyzed by Hβ zeolite catalyst for Biocrude oil production. Algal Res. 2022, 61, 102596. [Google Scholar] [CrossRef]
  17. Guo, B.; Yang, B.; Su, Y.; Zhang, S.; Hornung, U.; Dahmen, N. Screening and Optimization of Microalgae Biomass and Plastic Material Coprocessing by Hydrothermal Liquefaction. ACS EST Eng. 2021, 2, 65–77. [Google Scholar] [CrossRef]
  18. Yang, J.; He, Q.S.; Niu, H.; Dalai, A.; Corscadden, K.; Zhou, N. Microwave-assisted hydrothermal liquefaction of biomass model components and comparison with conventional heating. Fuel 2020, 277, 118202. [Google Scholar] [CrossRef]
  19. Gao, Y.; Remón, J.; Matharu, A.S. Microwave-assisted hydrothermal treatments for biomass valorisation: A critical review. Green Chem. 2021, 23, 3502–3525. [Google Scholar] [CrossRef]
  20. Gedye, R.; Smith, F.; Westaway, K.; Ali, H.; Baldisera, L.; Laberge, L.; Rousell, J. The use of microwave ovens for rapid organic synthesis. Tetrahedron Lett. 1986, 27, 279–282. [Google Scholar] [CrossRef]
  21. Saleh, A.A.; Islam, M.S.; Banggan, M.A.M.A. Production of Bio-Fuels by Microwave-Assisted Rapid Hydrothermal Liquefaction of Palm Kernel Shells Biomass. 2021. Available online: https://assets.researchsquare.com/files/rs-409704/v1/dbe4fac1-900c-49d8-8821-e9b2e38492b9.pdf?c=1631880993 (accessed on 5 April 2022).
  22. Huang, Y.-F.; Chiueh, P.-T.; Lo, S.-L. A review on microwave pyrolysis of lignocellulosic biomass. Sustain. Environ. Res. 2016, 26, 103–109. [Google Scholar] [CrossRef] [Green Version]
  23. Chen, H.-Y.; Cui, Z.-W. A Microwave-Sensitive Solid Acid Catalyst Prepared from Sweet Potato via a Simple Method. Catalysts 2016, 6, 211. [Google Scholar] [CrossRef] [Green Version]
  24. Arshanitsa, A.; Akishin, Y.; Zile, E.; Dizhbite, T.; Solodovnik, V.; Telysheva, G. Microwave treatment combined with conventional heating of plant biomass pellets in a rotated reactor as a high rate process for solid biofuel manufacture. Renew. Energy 2016, 91, 386–396. [Google Scholar] [CrossRef]
  25. Nomanbhay, S.; Salman, B.; Hussain, R.; Ong, M.Y. Microwave pyrolysis of lignocellulosic biomass—A contribution to power Africa. Energy Sustain. Soc. 2017, 7, 23. [Google Scholar] [CrossRef] [Green Version]
  26. Abdul Latif, N.I.S.; Ong, M.Y.; Nomanbhay, S. Hydrothermal liquefaction of Malaysia’s algal biomass for high-quality bio-oil production. Eng. Life Sci. 2019, 19, 246–269. [Google Scholar] [CrossRef] [PubMed] [Green Version]
  27. Kim, J.S. Production, separation and applications of phenolic-rich bio-oil—A review. Bioresour. Technol. 2015, 178, 90–98. [Google Scholar] [CrossRef]
  28. Gautam, R.; Shyam, S.; Reddy, B.R.; Govindaraju, K.; Vinu, R. Microwave-assisted pyrolysis and analytical fast pyrolysis of macroalgae: Product analysis and effect of heating mechanism. Sustain. Energy Fuels 2019, 3, 3009–3020. [Google Scholar] [CrossRef]
  29. Liu, C.; Zhao, Q.; Lin, Y.; Hu, Y.; Wang, H.; Zhang, G. Characterization of Aqueous Products Obtained from Hydrothermal Liquefaction of Rice Straw: Focus on Product Comparison via Microwave-Assisted and Conventional Heating. Energy Fuels 2018, 32, 510–516. [Google Scholar] [CrossRef]
  30. Zhuang, X.; Liu, J.; Wang, C.; Zhang, Q.; Ma, L. Microwave-assisted hydrothermal liquefaction for biomass valorization: Insights into the fuel properties of biocrude and its liquefaction mechanism. Fuel 2022, 317, 123462. [Google Scholar] [CrossRef]
  31. Yang, J.; Niu, H.; Corscadden, K.; He, Q.; Zhou, N. MW-assisted hydrothermal liquefaction of spent coffee grounds. Can. J. Chem. Eng. 2021. [Google Scholar] [CrossRef]
  32. Remón, J.; Randall, J.; Budarin, V.L.; Clark, J.H. Production of bio-fuels and chemicals by microwave-assisted, catalytic, hydrothermal liquefaction (MAC-HTL) of a mixture of pine and spruce biomass. Green Chem. 2019, 21, 284–299. [Google Scholar] [CrossRef]
  33. Tsubaki, S.; Onda, A.; Ueda, T.; Hiraoka, M.; Fujii, S.; Wada, Y. Microwave-Assisted Hydrothermal Processing of Seaweed Biomass. In Hydrothermal Processing in Biorefineries; Ruiz, H., Hedegaard Thomsen, M., Trajano, H., Eds.; Springer: Berlin/Heidelberg, Germany, 2017; pp. 443–460. [Google Scholar]
  34. Tsutsui, I.; Miyoshi, T.; Aue-Umneoy, D.; Songphatkaew, J.; Meeanan, C.; Klomkling, S.; Sukchai, H.; Pinphoo, P.; Yamaguchi, I.; Ganmanee, M.; et al. High tolerance of Chaetomorpha sp. to salinity and water temperature enables survival and growth in stagnant waters of central Thailand. Int. Aquat. Res. 2015, 7, 47–62. [Google Scholar] [CrossRef] [Green Version]
  35. Ong, M.Y.; Abdul Latif, N.I.S.; Leong, H.Y.; Salman, B.; Show, P.L.; Nomanbhay, S. Characterization and analysis of Malaysian macroalgae biomass as potential feedstock for bio-oil production. Energies 2019, 12, 3509. [Google Scholar] [CrossRef] [Green Version]
  36. Celikbag, Y.; Nuruddin, M.; Biswas, M.; Asafu-Adjaye, O.; Via, B.K. Bio-oil-based phenol–formaldehyde resin: Comparison of weight- and molar-based substitution of phenol with bio-oil. J. Adhes. Sci. Technol. 2020, 34, 2743–2754. [Google Scholar] [CrossRef]
  37. Cui, Y.; Hou, X.; Wang, W.; Chang, J. Synthesis and characterization of bio-oil phenol formaldehyde resin used to fabricate phenolic based materials. Materials 2017, 10, 668. [Google Scholar] [CrossRef] [PubMed] [Green Version]
  38. Raja, P.M.V.; Barron, A.R. UV-Visible Spectroscopy. In Physical Methods in Chemistry and Nano Science (Barron); Rice University: Houston, TX, USA, 2021. [Google Scholar]
  39. Lazzari, E.; Schena, T.; Marcelo, M.C.A.; Primaz, C.T.; Silva, A.N.; Ferrão, M.F.; Bjerk, T.; Caramão, E.B. Classification of biomass through their pyrolytic bio-oil composition using FTIR and PCA analysis. Ind. Crops Prod. 2018, 111, 856–864. [Google Scholar] [CrossRef]
  40. Sugumaran, V.; Prakash, S.; Ramu, E.; Arora, A.K.; Bansal, V.; Kagdiyal, V.; Saxena, D. Detailed characterization of bio-oil from pyrolysis of non-edible seed-cakes by Fourier Transform Infrared Spectroscopy (FTIR) and gas chromatography mass spectrometry (GC-MS) techniques. J. Chromatogr. B Analyt. Technol. Biomed. Life Sci. 2017, 1058, 47–56. [Google Scholar] [CrossRef]
  41. Wei, X.; Jie, D. Optimization to Hydrothermal Liquefaction of Low Lipid Content Microalgae Spirulina sp. Using Response Surface Methodology. J. Chem. 2018, 2018, 2041812. [Google Scholar] [CrossRef] [Green Version]
  42. Chan, Y.H.; Quitain, A.T.; Yusup, S.; Uemura, Y.; Sasaki, M.; Kida, T. Optimization of hydrothermal liquefaction of palm kernel shell and consideration of supercritical carbon dioxide mediation effect. J. Supercrit. Fluids 2018, 133, 640–646. [Google Scholar] [CrossRef]
  43. Zhu, Z.; Rosendahl, L.; Toor, S.S.; Chen, G. Optimizing the conditions for hydrothermal liquefaction of barley straw for bio-crude oil production using response surface methodology. Sci. Total Environ. 2018, 630, 560–569. [Google Scholar] [CrossRef]
  44. Hossain, F.M.; Kosinkova, J.; Brown, R.J.; Ristovski, Z.; Hankamer, B.; Stephens, E.; Rainey, T.J. Experimental investigations of physical and chemical properties for microalgae HTL bio-crude using a large batch reactor. Energies 2017, 10, 467. [Google Scholar] [CrossRef] [Green Version]
  45. Nomanbhay, S.; Ong, M.Y. A Review of Microwave-Assisted Reactions for Biodiesel Production. Bioengineering 2017, 4, 57. [Google Scholar] [CrossRef] [Green Version]
  46. Guzik, P.; Kulawik, P.; Zając, M.; Migdał, W. Microwave applications in the food industry: An overview of recent developments. Crit. Rev. Food Sci. Nutr. 2021, 1–20. [Google Scholar] [CrossRef] [PubMed]
  47. Peng, Y.; Fang, Z.; Wang, B.; Xu, Z. Study on Microwave Sintering Process and Surface Texture Characteristics of Ceramic Materials. IOP Conf. Ser. Mater. Sci. Eng. 2019, 677, 022078. [Google Scholar]
  48. Rosyadi, I.; Suyitno, S.; Ilyas, A.X.; Faishal, A.; Budiono, A.; Yusuf, M. Producing hydrogen-rich syngas via microwave heating and co-gasification: A systematic review. Biofuel Res. J. 2022, 9, 1573–1591. [Google Scholar] [CrossRef]
  49. Priecel, P.; Lopez-Sanchez, J.A. Advantages and Limitations of Microwave Reactors: From Chemical Synthesis to the Catalytic Valorization of Biobased Chemicals. ACS Sustain. Chem. Eng. 2019, 7, 3–21. [Google Scholar] [CrossRef] [Green Version]
  50. Chandra, R.; Vishal, G.; Sánchez, C.E.G.; Uribe, J.A.G. Bioreactor for algae cultivation and biodiesel production. In Bioreactors Sustainable Design and Industrial Applications in Mitigation of GHG Emission; Singh, L., Yousuf, A., Mahapatra, D.M., Eds.; Elsevier: Amsterdam, The Netherlands, 2020; pp. 289–307. [Google Scholar]
  51. De La Hoz, A.; Alczar, J.; Carrillo, J.; Herrero, M.A.; Muñoz, J.D.M.; Prieto, P.; De Cózar, A.; Diaz-Ortiz, A. Reproducibility and Scalability of Microwave-Assisted Reactions. In Microwave Heating; Chandra, U., Ed.; IntechOpen: London, UK, 2011. [Google Scholar]
  52. Inaba, S. Catalytic role of H2O molecules in oxidation of CH3OH in water. Catalysts 2018, 8, 157. [Google Scholar] [CrossRef] [Green Version]
  53. Jiang, S.; Daly, H.; Xiang, H.; Yan, Y.; Zhang, H.; Hardacre, C.; Fan, X. Microwave-assisted catalyst-free hydrolysis of fibrous cellulose for deriving sugars and biochemicals. Front. Chem. Sci. Eng. 2019, 13, 718–726. [Google Scholar] [CrossRef] [Green Version]
  54. Raikova, S.; Allen, M.J.; Chuck, C.J. Hydrothermal liquefaction of macroalgae for the production of renewable biofuels. Biofuels Bioprod. Biorefin. 2019, 13, 1483–1504. [Google Scholar] [CrossRef]
  55. Xiu, S.N.; Shahbazi, A.; Croonenberghs, J.; Wang, L.J. Oil production from duckweed by thermochemical liquefaction. Energy Sources Part A Recover. Util. Environ. Eff. 2010, 32, 1293–1300. [Google Scholar] [CrossRef]
  56. Venkatachalam, C.D.; Ravichandran, S.R.; Sengottian, M. Lignocellulosic and algal biomass for bio-crude production using hydrothermal liquefaction: Conversion techniques, mechanism and process conditions: A review. Environ. Eng. Res. 2022, 27, 200555. [Google Scholar] [CrossRef]
  57. Zhou, D.; Zhang, L.; Zhang, S.; Fu, H.; Chen, J. Hydrothermal Liquefaction of Macroalgae Enteromorpha prolifera to Bio-oil. Energy Fuels 2010, 24, 4054–4061. [Google Scholar] [CrossRef]
  58. Toor, S.S.; Rosendahl, L.; Rudolf, A. Hydrothermal liquefaction of biomass: A review of subcritical water technologies. Energy 2011, 36, 2328–2342. [Google Scholar] [CrossRef]
  59. Ghavami, N.; Özdenkçi, K.; Salierno, G.; Björklund-Sänkiaho, M.; De Blasio, C. Analysis of operational issues in hydrothermal liquefaction and supercritical water gasification processes: A review. Biomass Convers. Biorefin. 2021, 1, 1–28. [Google Scholar] [CrossRef]
  60. Akhtar, J.; Amin, N.A.S. A review on process conditions for optimum bio-oil yield in hydrothermal liquefaction of biomass. Renew. Sustain. Energy Rev. 2011, 15, 1615–1624. [Google Scholar] [CrossRef]
  61. Jayathilake, M.; Rudra, S.; Akhtar, N.; Christy, A.A. Characterization and evaluation of hydrothermal liquefaction char from alkali lignin in subcritical temperatures. Materials 2021, 14, 3024. [Google Scholar] [CrossRef]
  62. Posmanik, R.; Martinez, C.M.; Cantero-Tubilla, B.; Cantero, D.A.; Sills, D.L.; Cocero, M.J.; Tester, J.W. Acid and Alkali Catalyzed Hydrothermal Liquefaction of Dairy Manure Digestate and Food Waste. ACS Sustain. Chem. Eng. 2018, 6, 2724–2732. [Google Scholar] [CrossRef]
  63. Watson, J.; Wang, T.; Si, B.; Chen, W.T.; Aierzhati, A.; Zhang, Y. Valorization of hydrothermal liquefaction aqueous phase: Pathways towards commercial viability. Prog. Energy Combust. Sci. 2020, 77, 100819. [Google Scholar] [CrossRef]
  64. Bayat, H.; Dehghanizadeh, M.; Jarvis, J.M.; Brewer, C.E.; Jena, U. Hydrothermal Liquefaction of Food Waste: Effect of Process Parameters on Product Yields and Chemistry. Front. Sustain. Food Syst. 2021, 5, 160. [Google Scholar] [CrossRef]
  65. López Barreiro, D.; Beck, M.; Hornung, U.; Ronsse, F.; Kruse, A.; Prins, W. Suitability of hydrothermal liquefaction as a conversion route to produce biofuels from macroalgae. Algal Res. 2015, 11, 234–241. [Google Scholar] [CrossRef]
  66. Yang, W.; Li, X.; Liu, S.; Feng, L. Direct hydrothermal liquefaction of undried macroalgae Enteromorpha prolifera using acid catalysts. Energy Convers. Manag. 2014, 87, 938–945. [Google Scholar] [CrossRef]
  67. Kapcsándi, V.; Kovács, A.J.; Neményi, M.; Lakatos, E. Investigation of a non-thermal effect of microwave treatment. Acta Aliment. 2016, 45, 224–232. [Google Scholar] [CrossRef] [Green Version]
  68. Yang, X.; Cheng, K.; Jia, G. Microwave heating and non-thermal effects of sodium chloride aqueous solution. Mol. Phys. 2020, 118, e1662505. [Google Scholar] [CrossRef]
  69. Fan, J.; De Bruyn, M.; Budarin, V.L.; Gronnow, M.J.; Shuttleworth, P.S.; Breeden, S.; Macquarrie, D.J.; Clark, J.H. Direct microwave-assisted hydrothermal depolymerization of cellulose. J. Am. Chem. Soc. 2013, 135, 12728–12731. [Google Scholar] [CrossRef] [PubMed]
  70. King, J.W.; Holliday, R.L.; List, G.R. Hydrolysis of soybean oil: In a subcritical water flow reactor. Green Chem. 1999, 1, 261–264. [Google Scholar] [CrossRef]
  71. Anastasakis, K.; Ross, A.B. Hydrothermal liquefaction of the brown macro-alga Laminaria Saccharina: Effect of reaction conditions on product distribution and composition. Bioresour. Technol. 2011, 102, 4876–4883. [Google Scholar] [CrossRef]
  72. Pińkowska, H.; Wolak, P. Hydrothermal decomposition of rapeseed straw in subcritical water. Proposal of three-step treatment. Fuel 2013, 113, 340–346. [Google Scholar] [CrossRef]
  73. Gollakota, A.R.K.; Kishore, N.; Gu, S. A review on hydrothermal liquefaction of biomass. Renew. Sustain. Energy Rev. 2018, 81, 1378–1392. [Google Scholar] [CrossRef]
  74. Dimitriadis, A.; Bezergianni, S. Hydrothermal liquefaction of various biomass and waste feedstocks for biocrude production: A state of the art review. Renew. Sustain. Energy Rev. 2017, 68, 113–125. [Google Scholar] [CrossRef]
  75. Thummajitsakul, S.; Samaikam, S.; Tacha, S.; Silprasit, K. Study on FTIR spectroscopy, total phenolic content, antioxidant activity and anti-amylase activity of extracts and different tea forms of Garcinia schomburgkiana leaves. LWT 2020, 134, 110005. [Google Scholar] [CrossRef]
  76. Ma, C.; Geng, J.; Zhang, D.; Ning, X. Hydrothermal liquefaction of macroalgae: Influence of zeolites based catalyst on products. J. Energy Inst. 2020, 93, 581–590. [Google Scholar] [CrossRef]
  77. Abdelsayed, V.; Shekhawat, D.; Smith, M.W.; Link, D.; Stiegman, A.E. Microwave-assisted pyrolysis of Mississippi coal: A comparative study with conventional pyrolysis. Fuel 2018, 217, 656–667. [Google Scholar] [CrossRef]
  78. Ouyang, X.; Zhu, G.; Huang, X.; Qiu, X. Microwave assisted liquefaction of wheat straw alkali lignin for the production of monophenolic compounds. J. Energy Chem. 2015, 24, 72–76. [Google Scholar] [CrossRef]
  79. Zou, S.; Wu, Y.; Yang, M.; Li, C.; Tong, J. Thermochemical Catalytic Liquefaction of the Marine Microalgae Dunaliella tertiolecta and Characterization of Bio-oils. Energy Fuels 2009, 23, 3753–3758. [Google Scholar] [CrossRef]
  80. Chen, J.; Li, S. Characterization of biofuel production from hydrothermal treatment of hyperaccumulator waste (Pteris vittata L.) in sub- and supercritical water. RSC Adv. 2020, 10, 2160–2169. [Google Scholar] [CrossRef] [PubMed] [Green Version]
  81. Topală, C.M.; Tătaru, L.D.; Ducu, C. ATR-FTIR Spectra Fingerprinting of Medicinal Herbs Extracts Prepared Using Microwave Extraction. Arab. J. Med. Aromat. Plants 2017, 3, 1–9. [Google Scholar]
  82. Zhang, Y.; Chen, D.Y.; Zhang, D.; Zhu, X.F. TG-FTIR analysis of bio-oil and its pyrolysis/gasification property. J. Fuel Chem. Technol. 2012, 40, 1194–1199. [Google Scholar] [CrossRef]
  83. Caunii, A.; Pribac, G.; Grozea, I.; Gaitin, D.; Samfira, I. Design of optimal solvent for extraction of bio–active ingredients from six varieties of Medicago sativa. Chem. Cent. J. 2012, 6, 123. [Google Scholar] [CrossRef] [Green Version]
  84. Çulcuoglu, E.; Ünay, E.; Karaosmanoglu, F.; Angin, D.; Şensöz, S. Characterization of the Bio-Oil of Rapeseed Cake. Energy Sources 2006, 27, 1217–1223. [Google Scholar] [CrossRef]
Figure 1. Customized microwave reactor used in this work.
Energies 15 03974 g001
Figure 2. Gallic acid calibration curve.
Energies 15 03974 g002
Figure 3. Diagnostic plot (a) residual versus experimental run and (b) normal plot of residuals for response, bio-oil yield.
Energies 15 03974 g003
Figure 4. Diagnostic plot (a) residual versus experimental run and (b) normal plot of residuals for response, phenolic yield.
Energies 15 03974 g004
Figure 5. Results of sensitivity analysis.
Energies 15 03974 g005
Figure 6. Perturbation plot for response, bio-oil yield.
Energies 15 03974 g006
Figure 7. Perturbation plot for response, phenolic yield.
Energies 15 03974 g007
Figure 8. (a) Contour plot, and (b) 3-dimensional plot for response, bio-oil yield.
Energies 15 03974 g008
Figure 9. (a) Contour plot, and (b) 3-dimensional plot for response, phenolic yield.
Energies 15 03974 g009
Figure 10. FTIR spectrum of the HTL bio-oil obtained.
Energies 15 03974 g010
Table 1. Physiochemical properties of the studied algae, Chaetomorpha sp.
PropertiesValue
Moisture content (%)81.9
Elemental composition
Carbon, C (%)30.21
Hydrogen, H (%)4.42
Nitrogen, N (%)2.02
Oxygen, O (%)61.73
Sulphur, S (%)1.62
Protein content (wt%) *12.63
Lipid content (wt%) *8.88
Ash content (wt%) *36.3
Total Carbohydrate content (wt%) *42.19
Crude fibre content (wt%) *1.7
Nitrogen-Free Extract content (wt%) *40.49
High Heating Value (MJ/kg)9.17
* in dry basis.
Table 2. Studied parameters with respective levels.
LevelOperating Temperature (°C)Preloaded Pressure (bar)Water-to-Algal Biomass RatioHolding Time (min)
Low (−1)200251030
Medium (0)230352060
High (+1)260453090
Table 3. Experimental results for optimization study.
Experimental RunTemperature (°C)Preload Pressure (bar)Water to Algal Biomass RatioReaction Time (min)Experimental Bio-oil Yield (%)Experimental Phenolic Yield (wt% GAE)
123035303020.56213.22
223025209013.3511.68
326045206013.3512.16
4 *23035206019.51214.62
523025106010.9568.55
626035306017.90410.96
723035109014.31610.43
826035106011.6886.65
923035309020.90419.13
1020035203015.87610.91
1123045203015.68414.42
1226035209014.53210.48
1323035103013.7229.38
1420025206011.8687.96
15 *23035206019.69814.38
1620035209015.91812.57
1720045206014.62214.83
1823025306015.35413.21
1923045106012.22212.75
2023045209016.0518.22
2123025203012.4510.19
2220035106013.5066.53
2326025206010.1287.43
2426035203014.499.22
2523045306019.70417.67
26 *23035206019.8314.12
2720035306018.34813.56
* The center point of the experiment was replicated three times.
Table 4. Fit summary table for response, bio-oil yield.
SourceSequential p-ValueLack of Fit p-ValueAdjusted R-SquaredPredicted R-SquaredRemarks
Linear0.00110.00440.46900.3967
2 Factor Interaction (2FI)0.99820.00320.28880.0133
Quadratic<0.00010.21660.99100.9767Suggested
Cubic0.03610.74310.99830.9897Aliased
Table 5. Fit summary table for response, phenolic yield.
SourceSequential p-ValueLack of Fit p-ValueAdjusted R-SquaredPredicted R-SquaredRemarks
Linear<0.00010.01390.62650.5294
2 Factor Interaction (2FI)0.88150.01120.55030.1997
Quadratic<0.00010.14390.96860.9181Suggested
Cubic0.16970.20040.98560.7444Aliased
Table 6. ANOVA table for response, bio-oil yield.
SourceSum of SquaresDegree of Freedom (df)Mean SquaredF-Valuep-Value
Prob > F
Remarks
Model255.971025.60337.52<0.0001significant
A
-Temperature
5.3915.3971.14<0.0001
B
-Preload Pressure
25.60125.60337.52<0.0001
C
-Water to Algal Biomass Ratio
110.211110.211453.19<0.0001
D
-Reaction Time
0.4410.445.740.0291
AC0.4710.476.220.0239
BC2.3812.3831.35<0.0001
A254.86154.86723.40<0.0001
B286.14186.141135.77<0.0001
C26.3116.3183.21<0.0001
D28.3918.39110.63<0.0001
Residual1.21160.076
Lack of Fit1.16140.0833.250.2598not significant
Pure Error0.05120.026
Corrected Total Sum of Squares (Cor Total)257.1826
Table 7. ANOVA table for response, phenolic yield.
SourceSum of SquaresDegree of Freedom (df)Mean SquaredF-Valuep-Value
Prob > F
Remarks
Model273.87739.1287.91<0.0001significant
A
-Temperature
8.4318.4318.950.0003
B
-Preload Pressure
80.24180.24180.29<0.0001
C
-Water to Algal Biomass Ratio
86.73186.73194.87<0.0001< 0.0001
D
-Reaction Time
17.69117.6939.75<0.0001
CD7.4517.4516.750.0006
A272.82172.82163.62<0.0001
C25.7815.7813.000.0019
Residual8.46190.45
Lack of Fit8.33170.497.840.1190not significant
Pure Error0.1320.06
Corrected Total Sum of Squares (Cor Total)282.3226
Table 8. Comparison between quadratic model and reduced quadratic model.
ResponseBio-Oil YieldPhenolic Yield
Quadratic ModelReduced Quadratic ModelQuadratic ModelReduced Quadratic Model
F-value204.87337.5258.3387.91
Predicted R-squared value0.97670.98450.91810.9352
Adjusted R-squared value0.99100.99230.96860.9590
Adequate Precision46.20158.23326.63433.525
Table 9. Constraints for multi-objective optimization study.
NameGoalLower LimitUpper LimitLower WeightUpper WeightImportance
A: Temperatureis in range 200260113
B: Preload Pressureis in range 2545113
C: Water to Algal Biomass Ratiois in range 1030113
D: Reaction Timeis in range 3090113
Bio-oil Yieldmaximize 10.1320.91113
Phenolic Yieldmaximize 6.6519.13113
Table 10. Comparison of results before and after optimization.
Best Result before Optimization StudyAfter OptimizationPercentage Difference (%)
Operating Temperature (°C)230226↓1.74
Preloaded Pressure (bar)3542↑20
Water-to-Algal Biomass Ratio30:130:1-
Holding Time (min)9079↓12.22
Experimental Bio-oil Yield (%)20.90421.47↑2.71
Experimental Phenolic Yield (wt% GAE)19.1319.22↑0.47
Table 11. Properties of water at different conditions. Adapted with permission from [58]; published by Elsevier, 2011.
PropertiesAmbient WaterSubcritical WaterSupercritical Water
Temperature (°C)25250400
Pressure (bar)150250
Density, ρ (g/cm3)10.80.17
Dielectric constant, ε (F/m)78.527.105.9
Ionic product, log10Kw−14.0−11.2 −19.4
Heat capacity, Cp (kJ/kg·K)4.224.8613.0
Dynamic viscosity, η (mPA·s)0.890.110.03
Table 12. Identification of main peaks and their respective possible assignment.
Wavenumber Range (Reference, cm−1)Wavenumber Range
(Observed in This Work, cm−1)
Possible AssignmentReferences
3000–36003298O-H stretching[75]
2800–30002926CH2 and CH3 stretching vibrations[41]
2858
1640–16801674Primary and secondary amide C=O
stretching
[41,81]
1600–1760N–H bending vibrations
1500–16001521Aromatic C=C, C=O and N–H bending
vibrations
[80]
1500–1540Aromatic nitro compound NO2 asymmetric stretching[41,82]
1380–14651460CH3 lipids/proteins and COO– of amino
acids
[79,83]
1388
Primary and secondary O-H bending
(in-plane), and phenol or tertiary alcohol (O-H bend)
1350–13701361
CH3 and CH2 in rings[84]
1100–13001265C–O stretching, vibration[41,79]
1201
1109
1003–12301018C–O stretch, C–C stretch, C–H bend
<1000965–930939C-H
bending vibration
Oxime N–O stretching[41,80]
915–650891O–H bending
750–650731Secondary amid N–H wagging
Publisher’s Note: MDPI stays neutral with regard to jurisdictional claims in published maps and institutional affiliations.

