Abstract
Increased efforts toward climate change mitigation and achieving net zero (NZ) are occurring globally. This research addresses three challenges to meeting the target NZ goals: (1) quantifying energy use reduction approaches, including energy efficiency and renewable power; (2) obtaining measured data to verify NZ achievements; and (3) providing NZ definitions to a globally understandable concept. To do so, a reorganized NZ concept (NZX%(ORG)) is proposed that is practical, measurable, and adaptable to different regions and requirements. The “X%” presents the fraction of renewable energy to the total energy used, and the “ORG” defines the organization’s NZ definition that a project uses. The objective of this proposal is to create a universally NZ concept and method, using measured utility power data, by (1) determining a baseline NZX%(ORG); (2) projecting an optimized NZX%(ORG); (3) measuring and reporting the actual NZX%(ORG). This application is extendable from a building level to the community, city, and country levels (NZCX%(ORG)). The Serenbe community, a monitored case study in Georgia, was analyzed. The baseline NZ rating using metered data was NZC16%(ASHRAE). The analysis showed that improved energy efficiency measures (lighting, windows glazing, air sealing) along with increased on-site solar power generation (from 10% to 25% of all roof space), provided a projected NZC80%(ASHRAE). In addition, publicly available documentation of the measured utility power is required for reporting the actual NZCX%(ORG) in Serenbe. Using NZX%(ORG) provides recognition of partial success in moving toward 100% renewable power.
1. Introduction
In 1988, the Internal Governmental Panel on Climate Change (IPCC) was formed by the United Nations Environment Programme (UNEP) and the World Meteorological Organization (WMO) to provide scientific evaluations on climate change to policymakers [1]. Accordingly, the USA ratified the Montreal Protocol of 1987 in a 1990 amendment to the Clean Air Act [2]. In 2015, 196 parties adopted the Paris Agreement to combat climate change through greenhouse gas (GHG) mitigations with consistent finance fellow pathway [3]. On 3 August 2015, President Obama and the U.S. Environmental Protection Agency (EPA) announced the Clean Power Plan to cut the carbon emissions from the U.S. electrical power plants by 32% below 2005 levels by 2030 [2,4]. Further, on 22 April 2021, President Biden pledged that the USA would cut its GHG emissions by at least 50% from the 2005 level by 2030 [5]. Teske stated two objectives in response to the Paris Agreement: energy efficiency measures and transition to 100% renewables [6]. Studies presented net zero energy (NZ) or carbon-free adoptions as the primary solution to GHG reduction goals [7,8,9,10,11]. On 23 April 2021, the European Union and 44 countries pledged to accomplish the NZ emissions reduction targets by 2050, with individual commitments varying in scope and timescale [12]. Table 1 presents variations in NZ targets between different states in the USA.

Table 1.
States with net zero targets. Source: modified from the Clean Energy States Alliance [13].
To accelerate achieving NZ targets, this paper covers: (1) a consensus definition, (2) a clear route for NZ implementation with its energy performance quantification, and (3) publicly available measured data to track the progress. Table 2 highlights current NZ limitations in the above-mentioned three categories.
Table 2.
Selected peer-review publications on NZ approaches and limitations.
There are numerous NZ definitions. The authors have identified NZ variations and differing source and supply requirements through a comprehensive literature review [14]. Table 3 presents NZ variations defined by different organizations.
Table 3.
Variations in NZ requirements.
As a result of NZ literature, the authors concluded lack of scientific publications on measured energy data as a major cause of failure to validate the NZ performance of a project [15]. Similarly, other studies highlighted the importance of utility energy data to track the NZ’s progress and achieve its objectives [12,27,28,29].
To meet NZ emission targets, buildings need to follow zero carbon policies and strategies such as energy efficiency measures (EEMs), renewables, and electrification of end uses. Yet, the existing building codes and regulations are either insufficient to address the current NZ targets or lack firm routes for implementation [12]. According to Kumar and Alok, codes and regulations need to promote electrification and renewables in buildings and transport sectors [30]. Economidou et al. reviewed the impact of European Union (EU) policies on the buildings’ energy efficiency improvements and recommended additional policies with higher energy performance requirements; extension from building level to district level; use of electrification and smart technologies; and targeted financial mechanisms on energy efficiency in addressing decarbonization targets [18].
The existing variety in optimization strategies and challenges in addressing net zero building (NZB) and net zero community (NZC) targets complicate achieving its objectives. There are many studies on different aspects of NZ. For example, Zhang et al. presented a systematic methodology to assess and optimize the economic performance of NZBs by including the application of life cycle cost, benefit–cost analysis, and building performance simulation [23]. Wills et al. proposed a hybrid statistical and engineering-based model to retrofit a community with improved envelope, mechanical, and district renewable energy systems to achieve NZC [21]. Ceglia et al. examined the concept of a “smart energy community” and concluded control strategies, sustainable renewable systems, and storage systems as important factors for exploiting economically efficient sources [24]. Fournier et al. summarized that a building’s peak load and energy costs need to be managed by disincentivizing energy use during peak loads, time balancing between energy usage and delivered energy, and policy plans for decarbonization [20]. Kelly et al. showed that load shifting with thermal storage could add flexibility to the energy demand to meet the supply and suggested heat pumps as responsive options to variations of electrified heating systems [22]. Guillen et al. presented the importance of occupant settings, construction, and HVAC settings in energy modeling on the variations in thermal comfort, energy use, and payback periods of design upgrades [25].
To the best knowledge of the authors, NZ methods are still complicated to quantify its performance, and the lack of published measured data on the projects’ energy performance complicates tracking its progress. Although many studies have recently investigated this issue, they are more focused on specific measures that will help in achieving a higher NZ number. This paper, however, comes up with NZX%(ORG) and a straightforward methodology to encapsulate different methods for NZ projects so that they can be compared and aggregated to see how the world is advancing quantitatively toward NZ. Further, NZX%(ORG) can be reported once a full set of measured data is available.
In this paper, the NZ concept is organized such that the ability to understand the assumptions made would be clear. The NZX%(ORG) is measurable, where “X%” presents the fraction of renewable energy to the total energy used, and the “ORG” defines the organization’s NZ definition that a project uses. This proposal can be expanded to include larger sites, i.e., communities, cities, and countries (NZCX%(ORG)). This model gives other organizations that are compiling this information (i.e., the IEA) the ability to perform a cleaner job of combining the savings from different projects. The main goal of this research is to create a universally NZ concept and method, using measured utility power data.
The proposed NZX%(ORG) is practical and adaptable to different regions and requirements. It follows straightforward methods in three steps: (1) obtain the baseline energy use of the facility or community; (2) determine the non-renewable energy reductions that will be implemented by simulation; and (3) measure the yearly renewable and non-renewable energy consumption, and publicly report the NZX%(ORG) value with the supporting data. Note that step (2) provides the intent and path to accelerate the NZ optimization approach, while step (3) is the measured value of the NZX%(ORG) that will be used for NZ reporting.
The main argument of this study is the need for (1) measured data to be able to accurately verify a project’s NZ performance, and (2) NZ that allows for both on-site and off-site renewable power. On the basis of NZX%(ORG), the projects are required to have publicly available reports to show committed NZ plans, measured utility energy performance, and renewable generation. The outcome of this research will provide stakeholders with design guidelines and systematic approaches to estimate the expected savings in energy and CO2 emissions and then measure and verify NZ achievements on a project.
This paper covers:
- An adaptable net zero model;
- A comparative energy analysis of a monitored building’s total electrical use versus two (2) simulated models (improved EEMs and improved EEMs plus increased PV);
- A comparative energy analysis of a monitored community’s total electrical use versus two (2) simulated models (improved EEMs and improved EEMs plus increased PV);
- A comparative analysis of the community solar field versus rooftop PV systems in regard to the design limitations and installation cost.
2. Proposed Model
A monitored case study of Serenbe, a sustainable community in Atlanta, Georgia, is analyzed to quantify its energy performance and report its NZC achievements. The main energy indicators used for the analysis include (1) energy efficiency measures (EEMs) and (2) renewable power production.
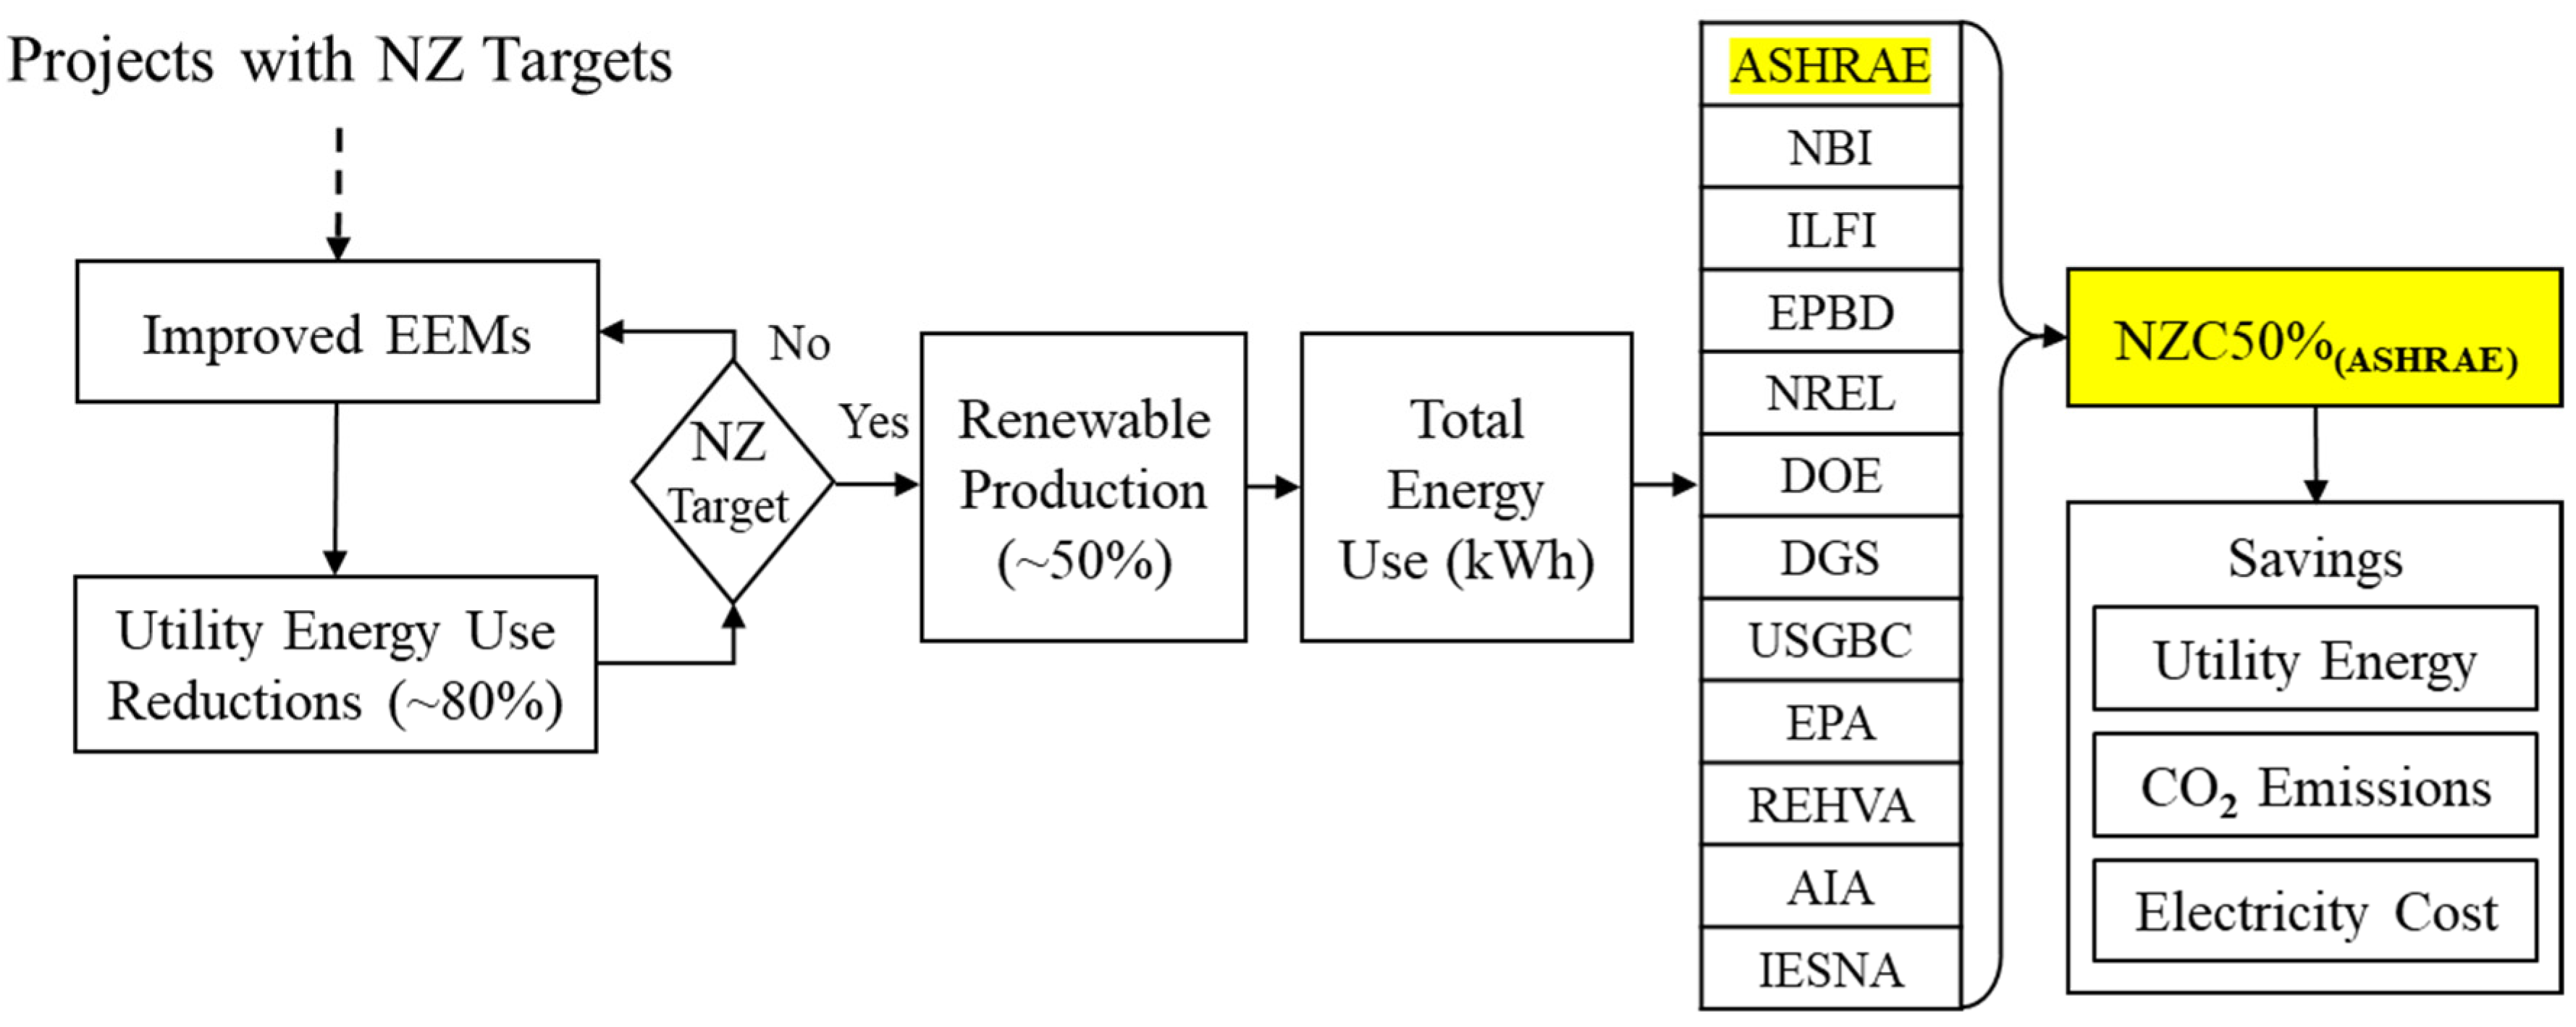
The state of Georgia has targeted to reduce its GHG emissions by 80% below the 2001 level by 2050. According to Nygren, Serenbe’s founder and developer, the project aim is to become NZC by reducing the fossil-fuel-based energy use in buildings by 50% for the existing buildings and by 70% in the newer sections [31]. If Serenbe uses ASHRAE’s NZ definition and measures 50% of its total energy from renewables, then the model becomes NZC50%(ASHRAE). The improved EEMs will be analyzed to estimate the long-term energy savings and CO2 emissions reductions for the community. Figure 1 presents a systematic approach for the proposed NZCX%(ORG) model applicable to different projects.

Figure 1.
NZCX%(ORG), adaptable to different regions with different requirements.
3. Monitored Case Study
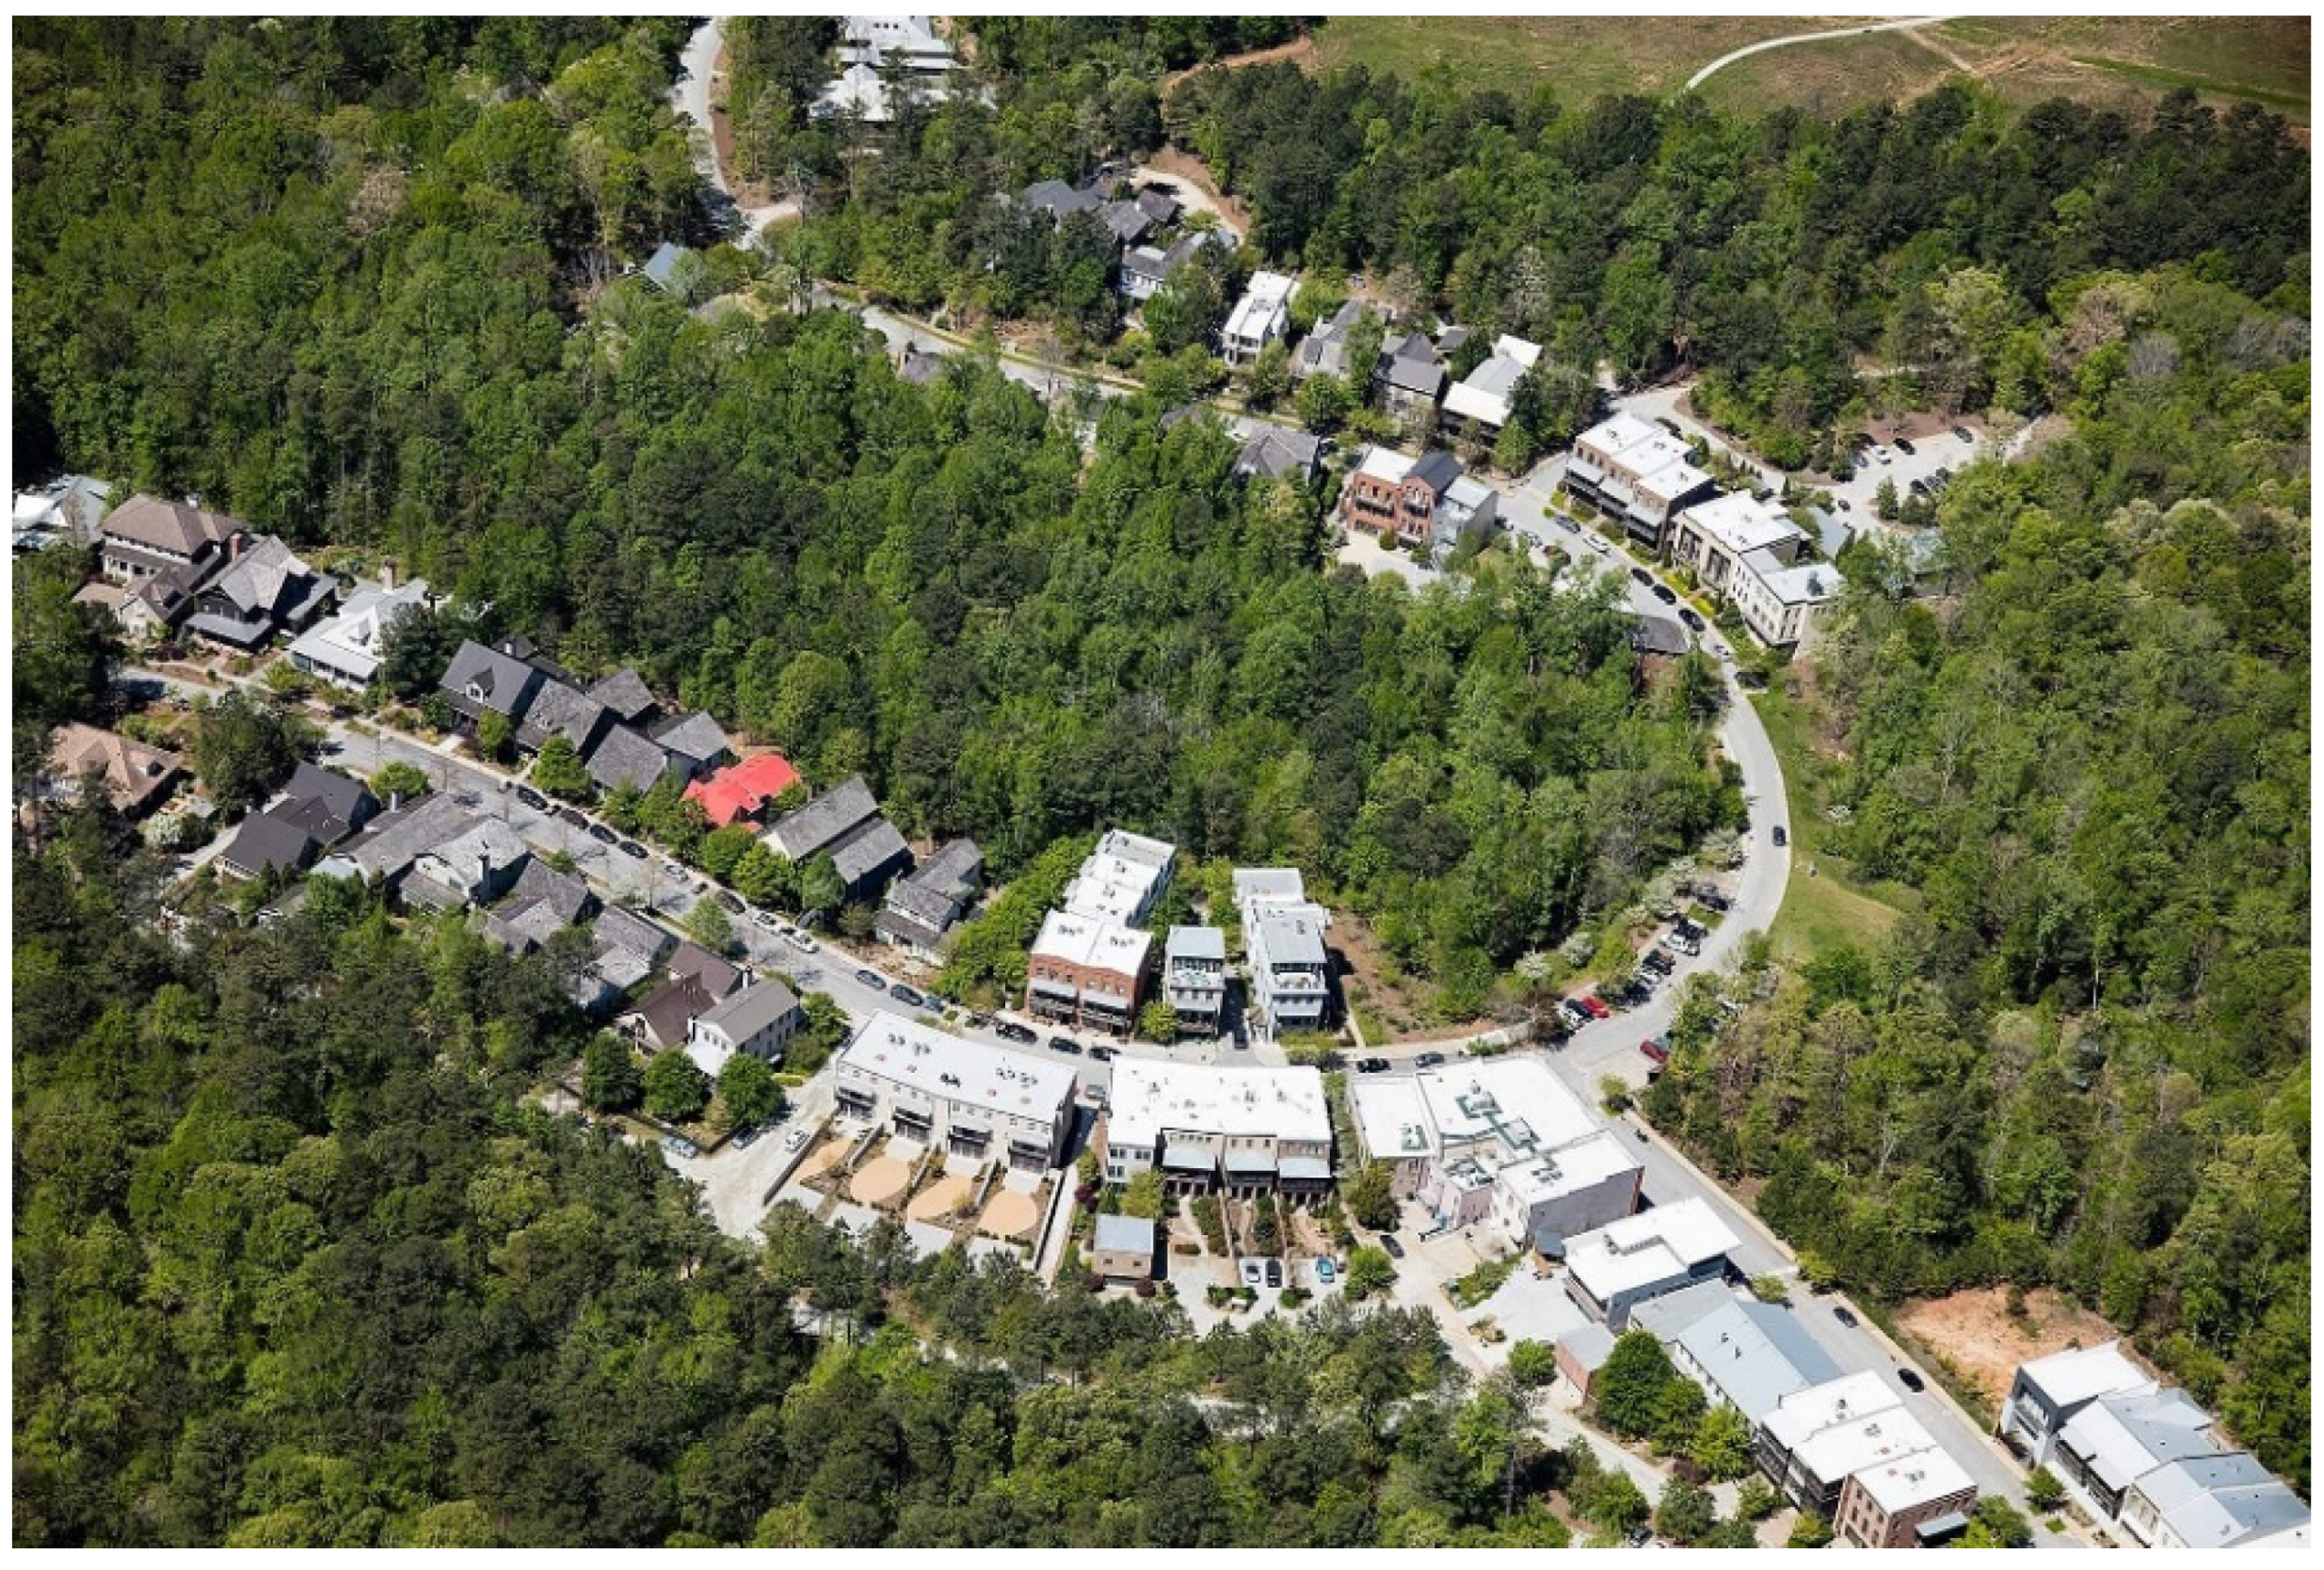
The Serenbe community, located 30 miles southwest of Atlanta, Georgia, USA, is a sustainable project with NZC plans. Serenbe was initially planned in 2001, and construction began in 2004. The project is a 486-hectare (1200-acre), mixed-use residential community with 70% open space (natural reserve area). Serenbe is designed for an eventual 1800 dwellings and a population of 3000. The average density is 12 dwellings per hectare (5 dwellings per acre)—the open space is excluded from the density [32]. Serenbe’s land plan is composed of five omega “Ω”-shaped hamlets, which are about 30% complete and occupied, as shown in Figure 2 [33].

Figure 2.
Arial view of Selborne hamlet in the Serenbe community. Source: Serenbe Development.
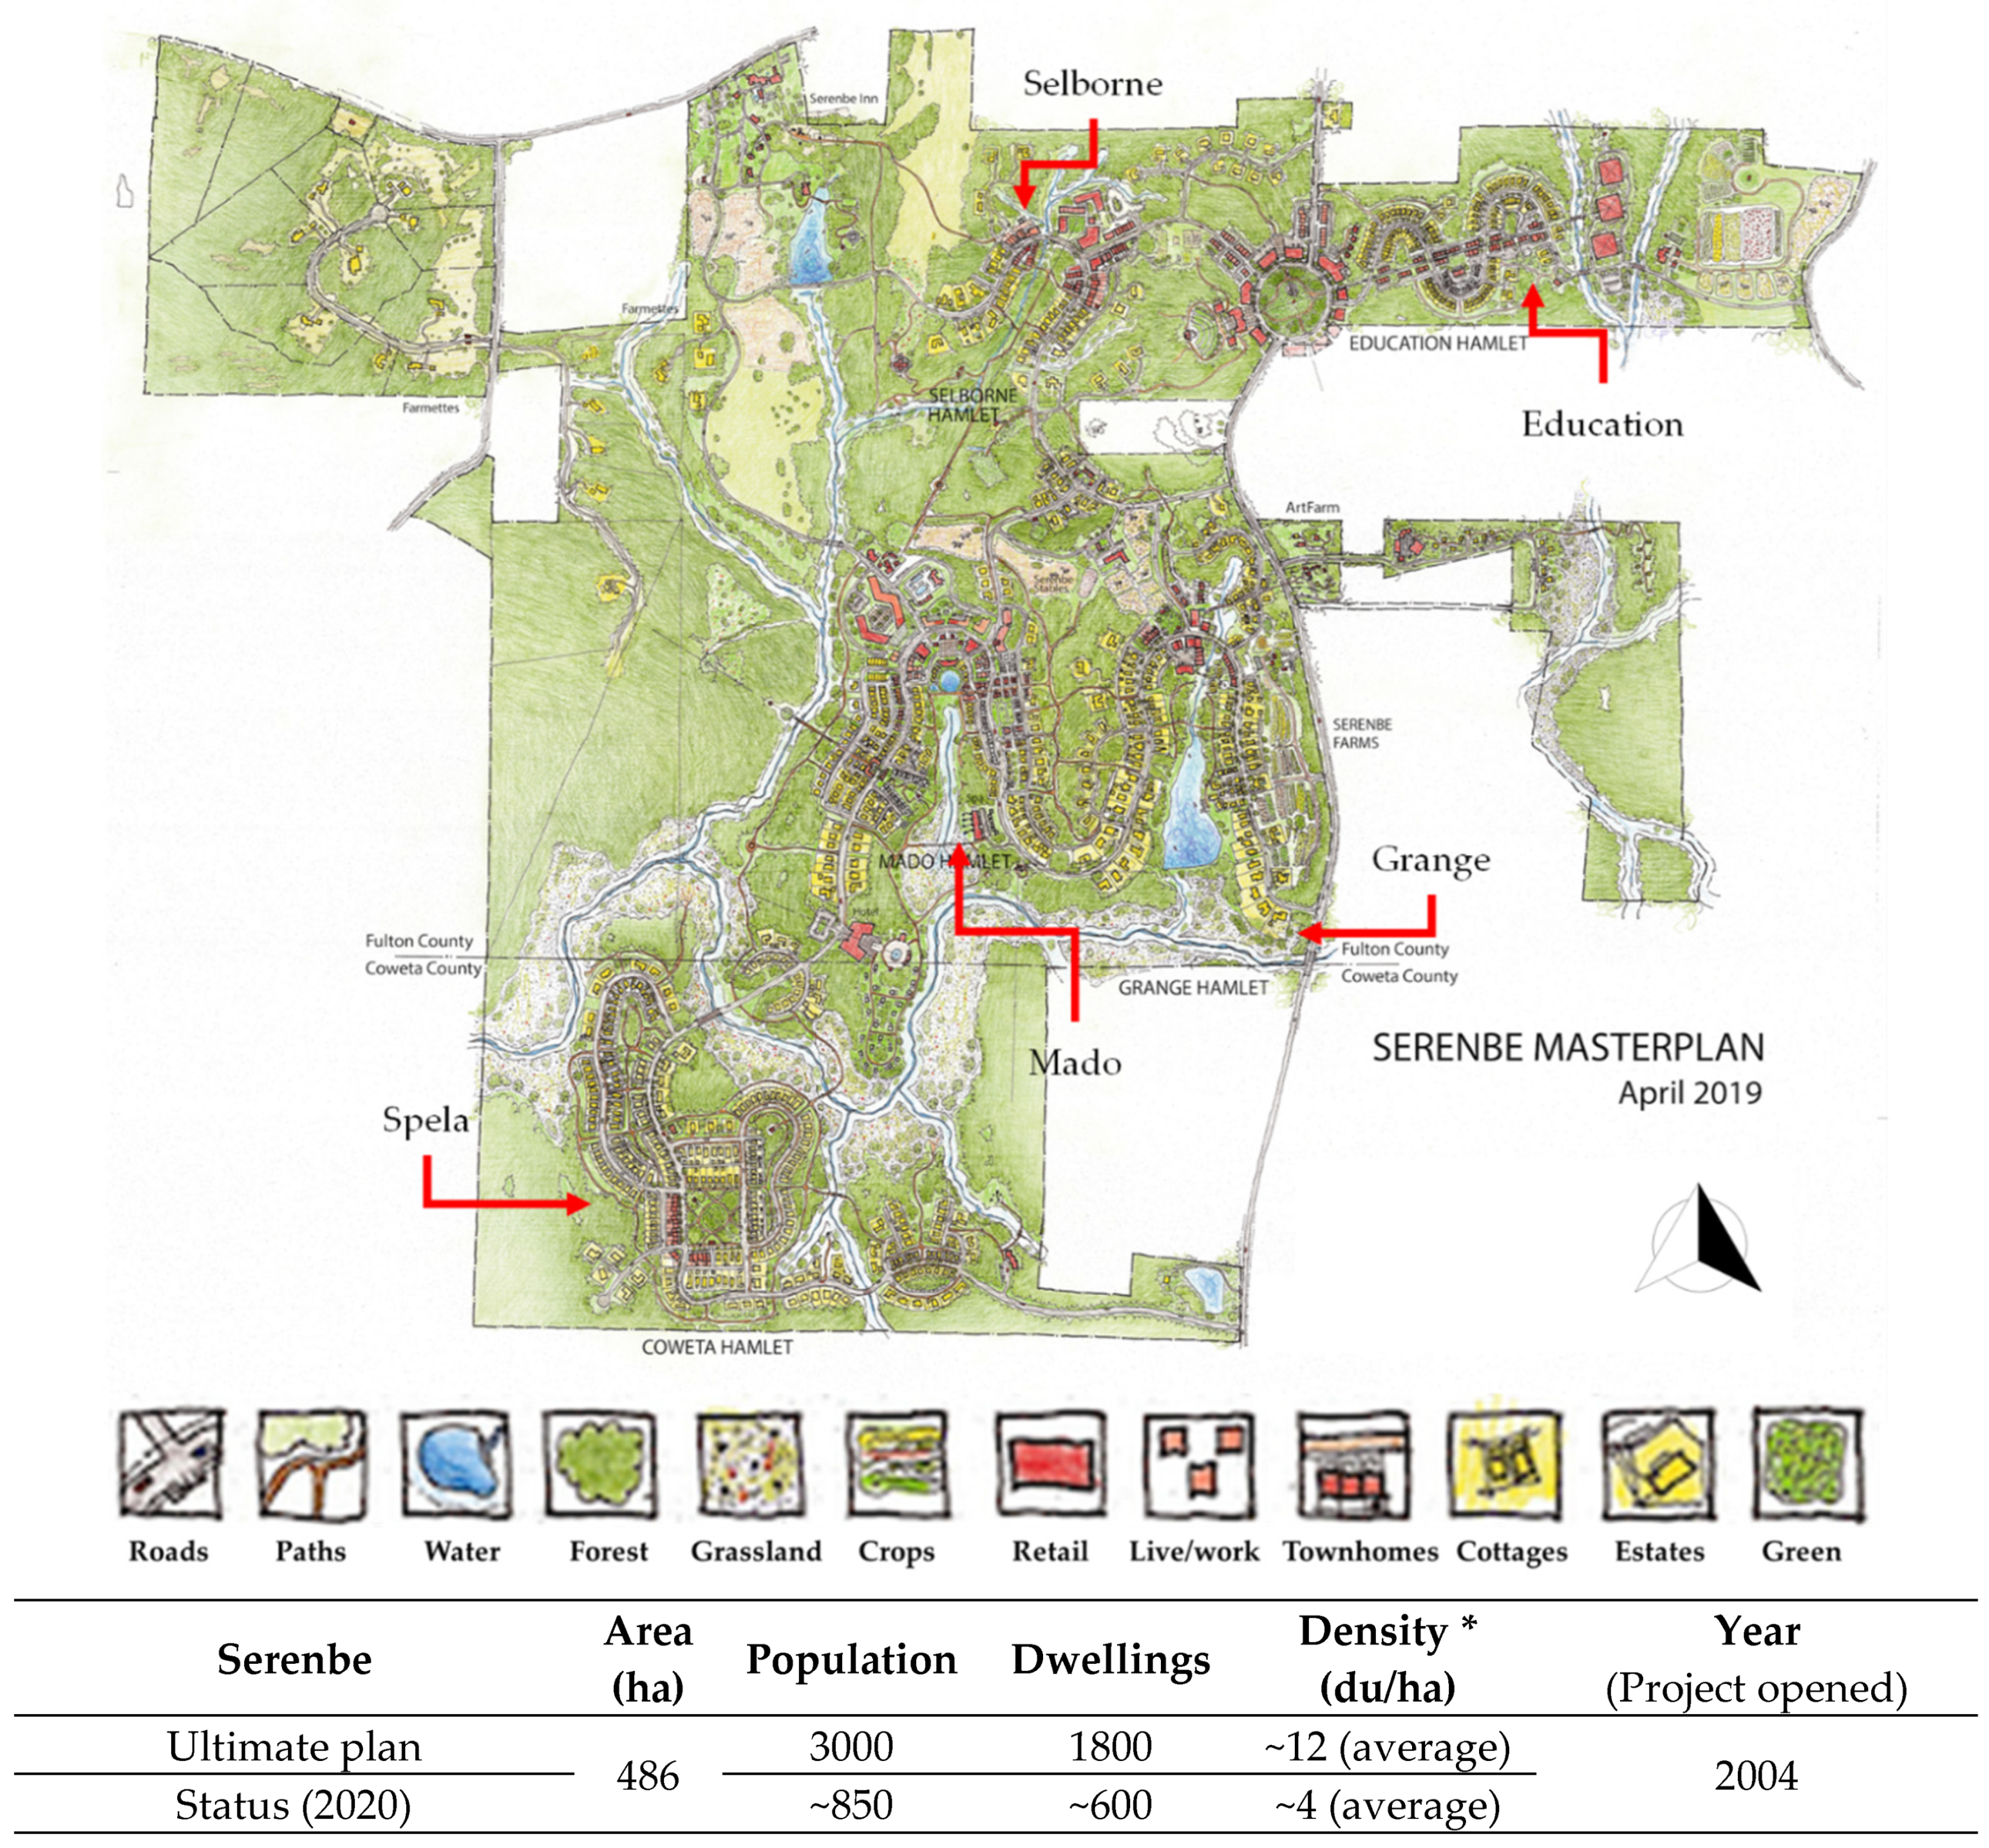
Primary energy strategies in buildings in Serenbe included (1) rooftop solar PV systems; (2) mandated geothermal heating and cooling systems to save electrical energy use and reduce utility costs; and (3) mandated EarthCraft certification—a green building program that “[saves] homeowners a projected 30 percent on their energy bills, relative to comparable buildings that use standard construction methods” [34]. EarthCraft is a regional efficient-homes certification program that is developed and supervised by the DOE Building America research partner Southface Energy Institute. EarthCraft focuses on energy and resource-efficient criteria, including ENERGY STAR Certified Homes Version 3.0 for its gold and platinum levels [35]. Further energy strategies in the Serenbe community include passive solar heating, natural ventilation, efficient lighting/HVAC/windows/appliances, and agricultural activities. Regarding transportation energy use, Serenbe encourages pedestrian and biking networks, the use of electric golf carts, and mixes of use for daily requirements. Figure 3 summarizes Serenbe’s planning characteristics.

Figure 3.
Planning characteristics in the case study of the Serenbe community. Serenbe Community Masterplan (2019). Source: Serenbe Development; modified from Phillip Tabb’s Masterplan (April 2019). * du/ha = dwelling units/hectare. The open space (70% of the land) is excluded from the density (du/ha).
4. Methodology
The methodology includes three steps: (1) obtain the baseline energy use of the facility or community; (2) determine the non-renewable energy reductions that will be implemented by simulation (provide a path and intent to NZ); (3) measure the yearly renewable and non-renewable energy consumption, and publicly report the NZX%(ORG) value with the supporting data. This paper shows that NZX%(ORG) is a projected number that provides a chance to evaluate different options to optimize the NZ rating, which could be validated when a full set of measured data is available.
To quantify the NZC performance of the case study of Serenbe, the energy analysis was conducted at two levels: (1) building, to minimize utility energy use with improved EEMs and rooftop PV systems, and (2) community, to optimize on-site renewable generations. At the building level, a comparative analysis was conducted between three types of buildings in Serenbe as follows:
- Nest Cottage, by DOE in 2012;
- DOE Zero Energy Ready Home, by DOE in 2014;
- A typical (average-size) single-family building in Serenbe, by the authors in 2020,
- Baseline: total building electrical use (measured electricity data plus PV generation);
- Simulated models: calibrated base case; improved EEMs; improved EEMs plus increased PV.
DesignBuilder v7 (DB), an energy modeling software that works with EnergyPlus 9.4 (EPlus), was used to evaluate the building’s energy performance. The built-in EEMs were used from building A and B, and then they were improved in building C. A comparative analysis was conducted in three steps: (1) calibrate a base case by simulating the total building electrical use; (2) simulate the improved EEMs to estimate the energy savings; and (3) increase rooftop PV coverage to lower the utility energy consumption in building C in 2020. Next, an analysis extrapolated the single home (building C) to estimate the energy savings of total buildings in the Serenbe community in 2020. The results are presented as savings in utility energy, electricity bills, and CO2 emissions at the community level. The calculated savings will be approximate and can be used to estimate the planned reductions and planned NZC level. Monitoring and reporting will provide the actual NZC levels achieved year by year.
4.1. Building A: Nest Cottage by DOE (2012)
The Nest Cottage subdivision in Selborne Hamlet was built as a new construction test house (NCTH) by DOE’s Building America (BA), Southface, and Martin Dodson Builders [36]. There are 15 cottage-style buildings with an average size of 120 m2 (1292 SF). The buildings are targeted to meet the DOE BA’s 30% energy saving goal compared to constructions that meet the 2009 IECC [36]. The main EEMs used in Nest Cottages were a ground source heat pump (GSHP) and improved insulation using open-cell spray foam (Wall R-20; Ceiling R26) [36]. In the Nest Cottages, building A was selected for the DOE’s energy analysis purposes. Figure 4 summarizes the characteristics of building A.

Figure 4.
Planning characteristics of building A. Source: Butler et al. [36].
The design goal for the Nest Cottage was saving energy use while minimizing cost increases and maintaining metrics of comfort, durability, and indoor air quality. The specification for building A is detailed in Table 4.
Table 4.
Building A (Nest Cottage) Specifications. Data from Butler et al. [36].
As shown in Table 3, the main EEMs were improved in envelope measures and HVAC systems (GSHPs). In addition, air sealing measures and insulation installation followed the EarthCraft and ENERGY STAR programs’ requirements. High-performance glazing windows with 0.31 solar heat gain coefficients (SHGC) were utilized. The building includes a lighting package of 80% compact fluorescent lamps (CFL) and 20% incandescent bulbs with ENERGY STAR appliances. The efficient GSHPs are used with a rating of 16 energy efficiency ratio (EER) at full load and 18.6 EER at part load, 5.5 coefficient of performance (COP) at full load, and 6.3 COP at part load [36]. A gas storage water heater was utilized with an energy factor (EF) of 0.67, which meets the ENERGY STAR Requirements [37,38,39].
4.2. Building B: Zero Energy Ready Home by DOE (2014)
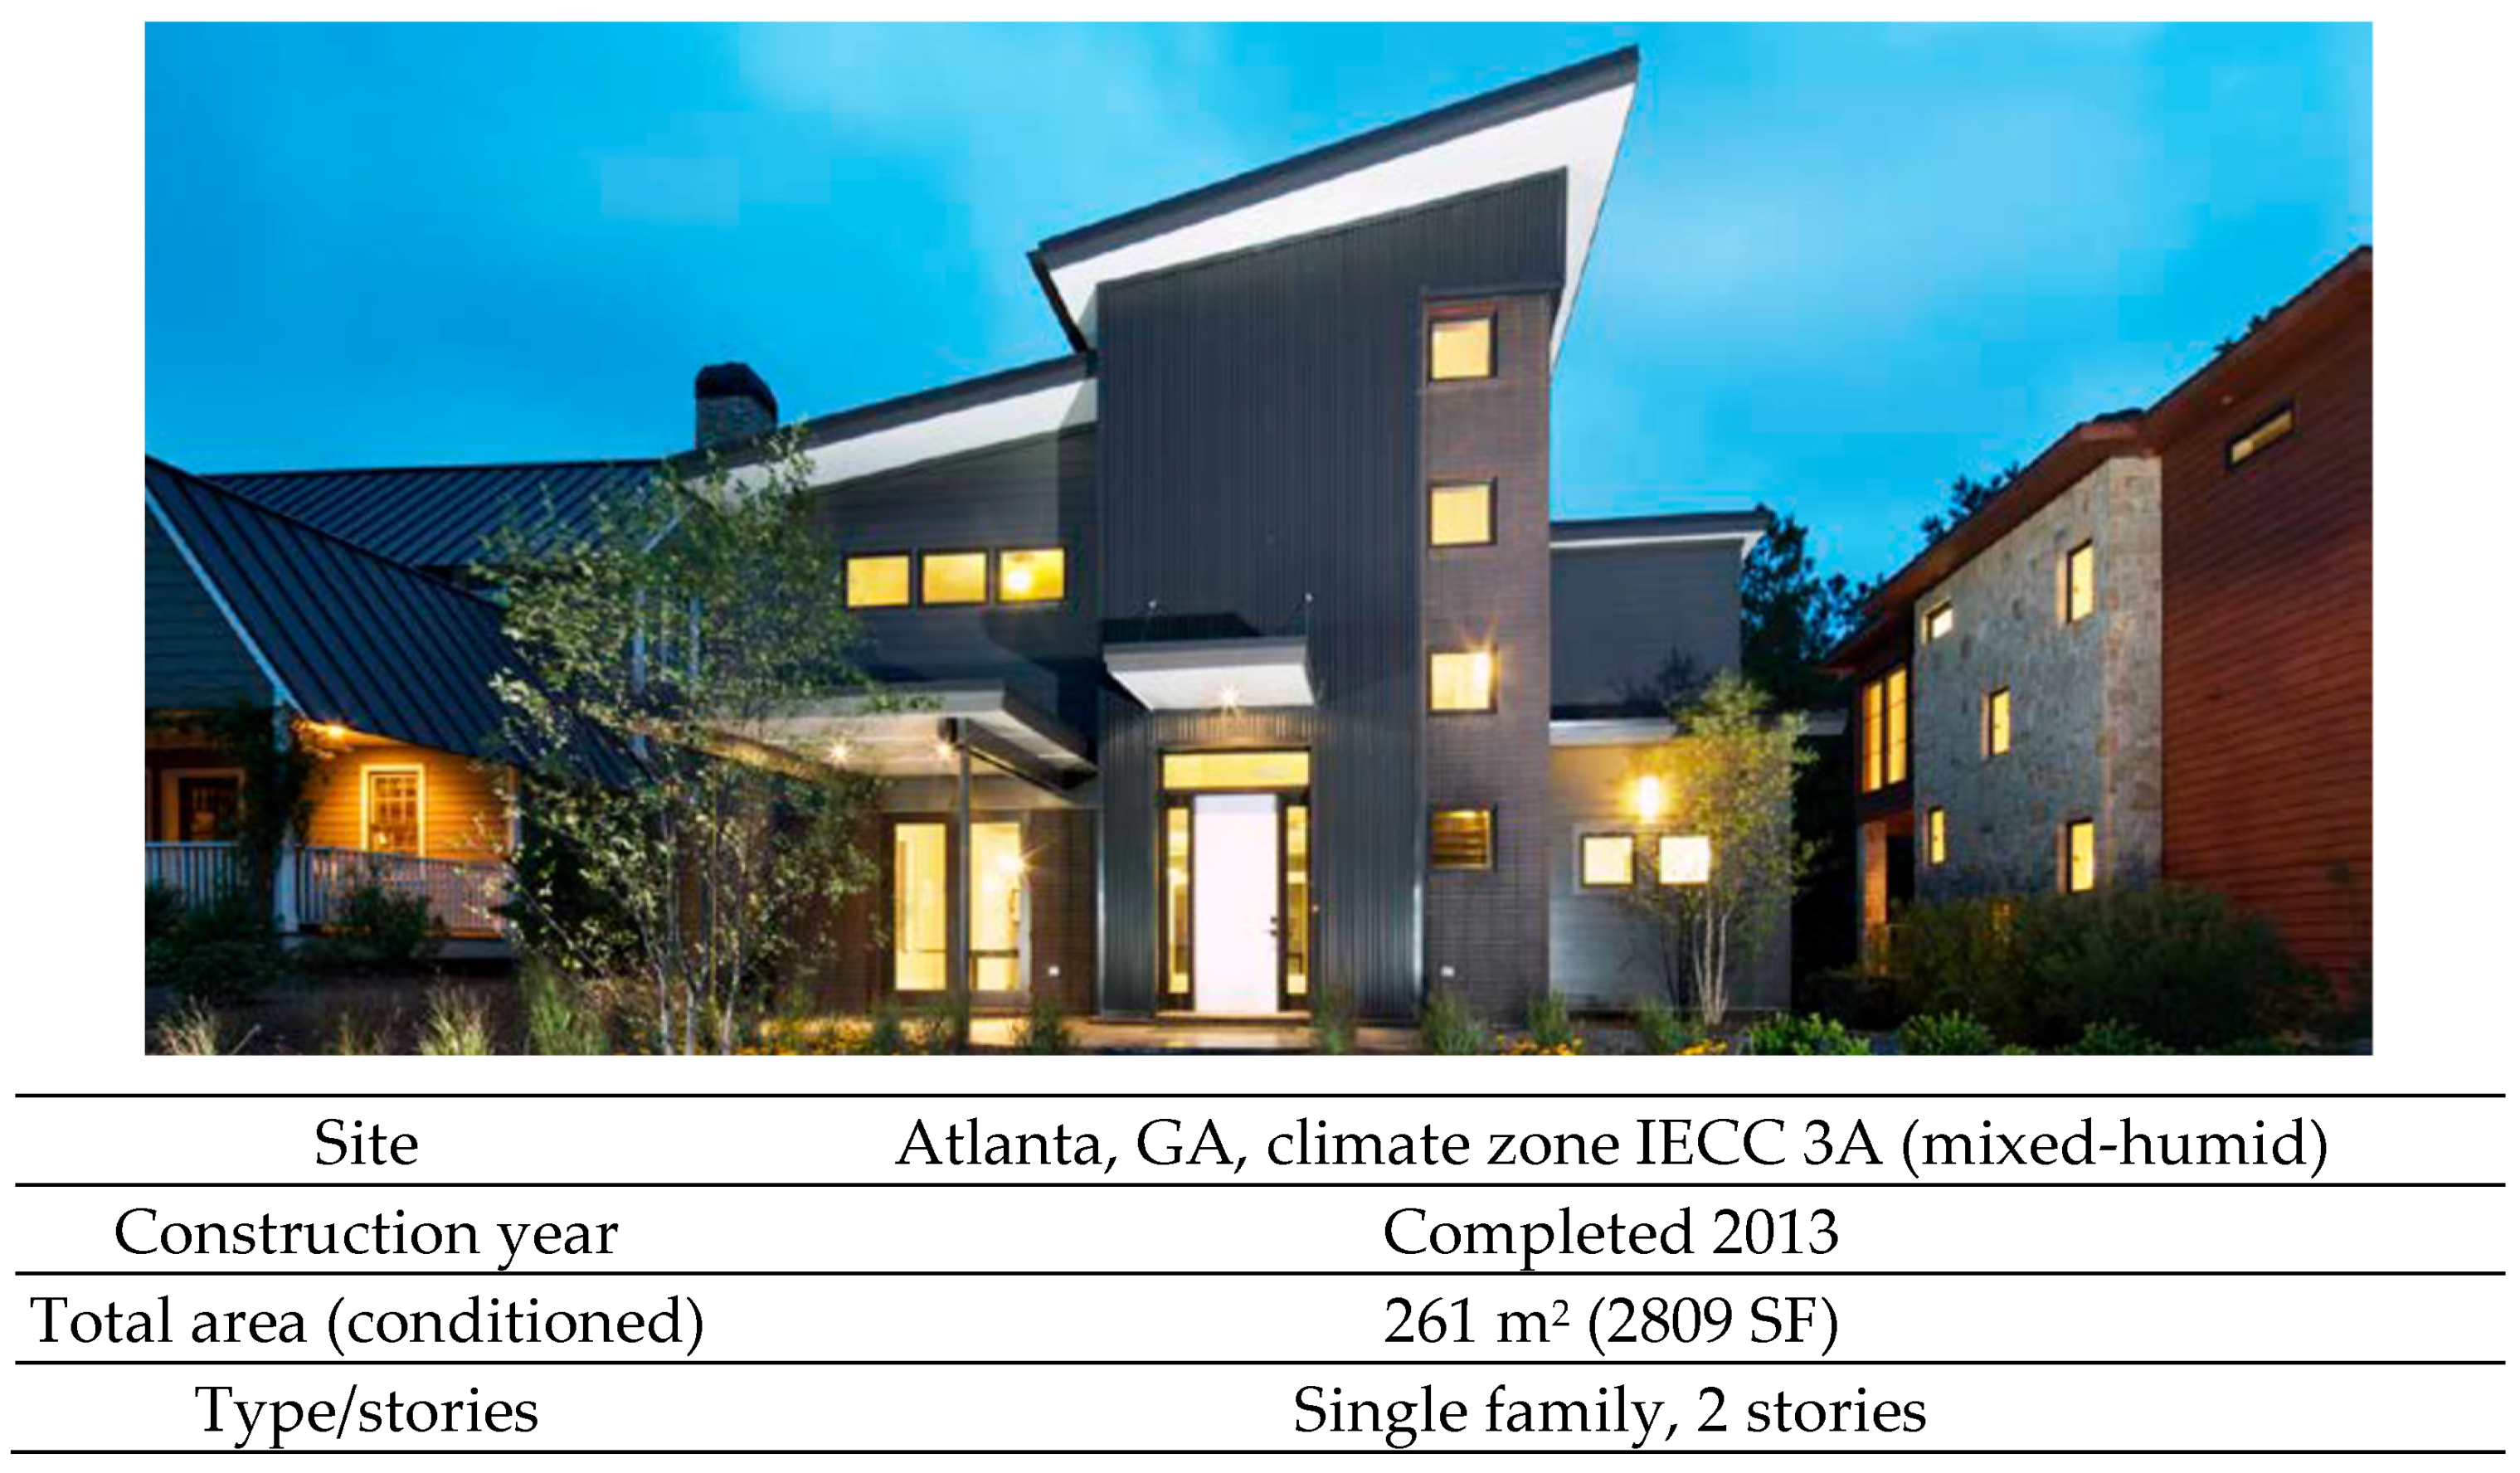
The Proud Green Home is the first DOE Zero Energy Ready Home certified by the Georgia Department of Energy in 2014. The building is a 261 m2 (2809 SF) single-family house, constructed in 2013. Figure 5 summarizes the planning characteristics of building B.

Figure 5.
Planning characteristics of building B. Source: DOE (2014) [35].
Building B meets the requirements of EarthCraft, the EPA’s Indoor airPlus, the EPA’s WaterSense guidelines on the hot water distribution criteria, high insulation level (beyond the 2012 IECC), and efficient lighting/construction/window performance. As a result, the building improved energy savings by 60% when compared to a conventional building in Georgia that meets the 2009 IECC [35]. Table 5 details building B’s specifications.
Table 5.
Building B (Zero Energy Ready Home) specifications. Source: DOE (2014) [35].
The main utilized EEMs in building B included HVAC systems with heat recovery ventilator (HRV), solar thermal water heater, and improved air sealing. Mini-split heat pumps (with variable speed compressors and fans) were used to cover a total 6.5 kW (22,179 Btu/h) heating load of the building. Moreover, with the air sealing value of 0.21ACH50, energy recovery ventilators (ERVs) were required to exchange heat, fresh air, and humidity in the building. Further, a solar thermal heater was utilized to provide 100% of the building’s hot water demand.
4.3. Building C: Typical Building in the Serenbe Community (2020)
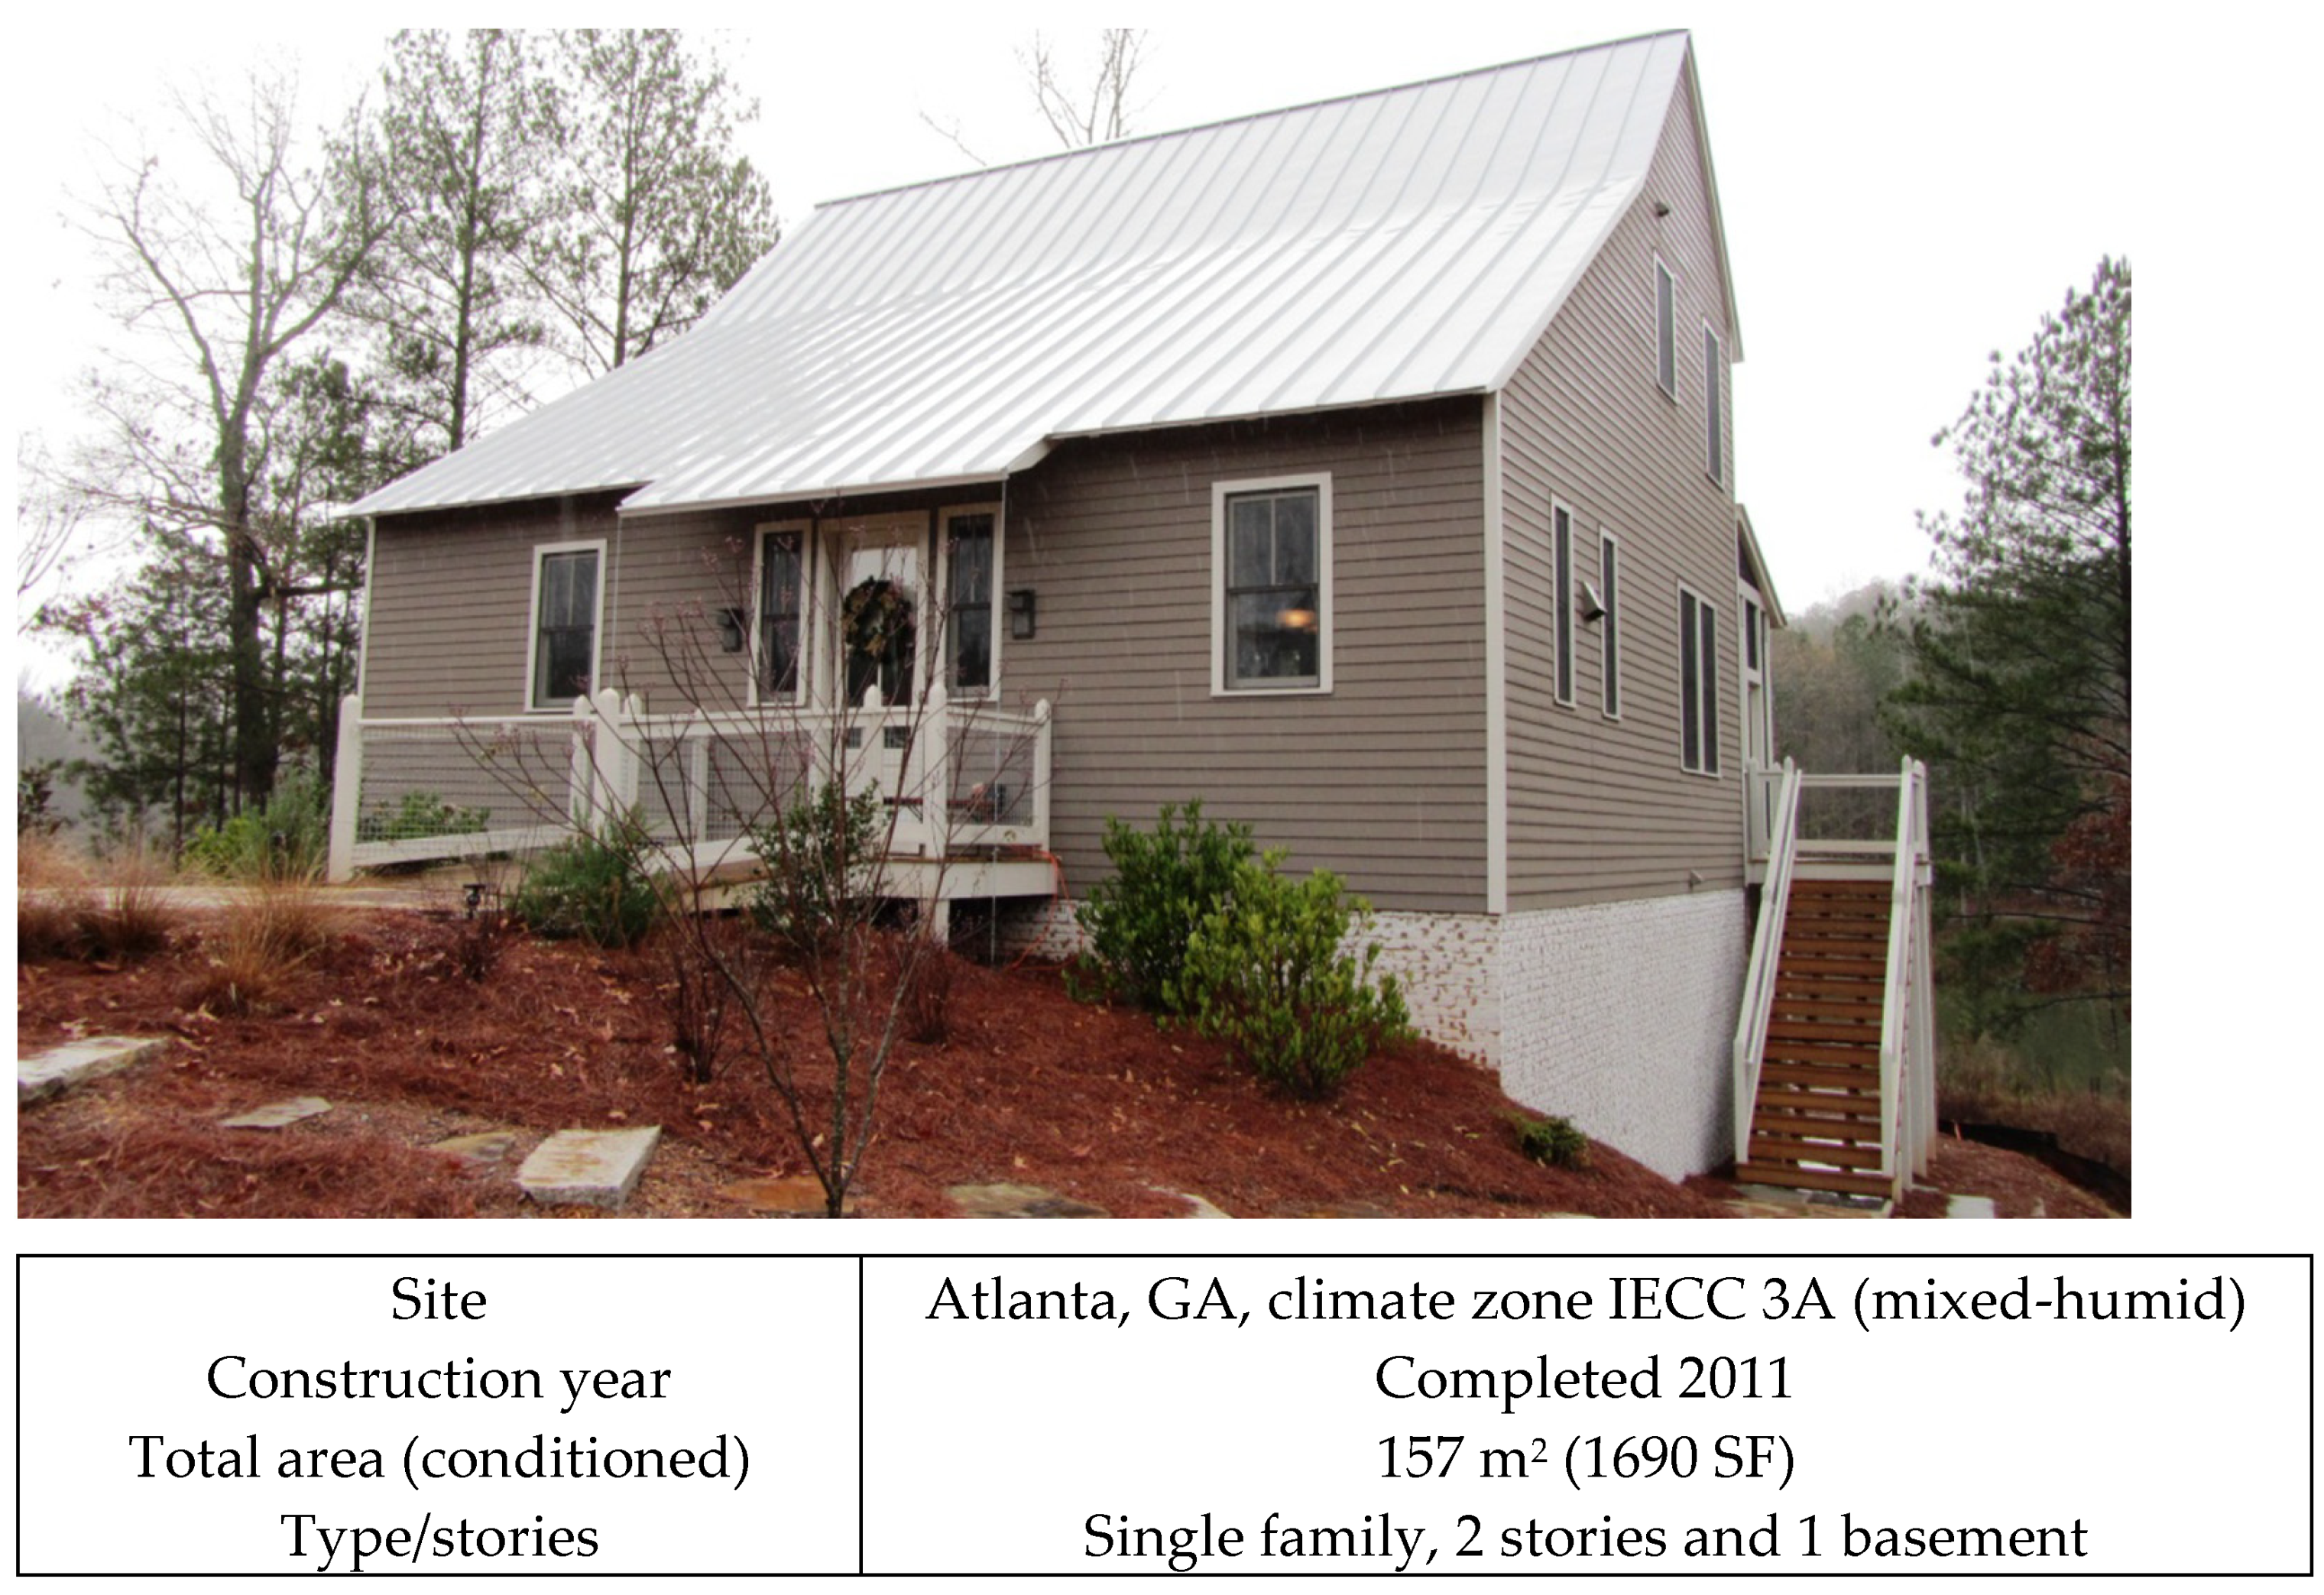
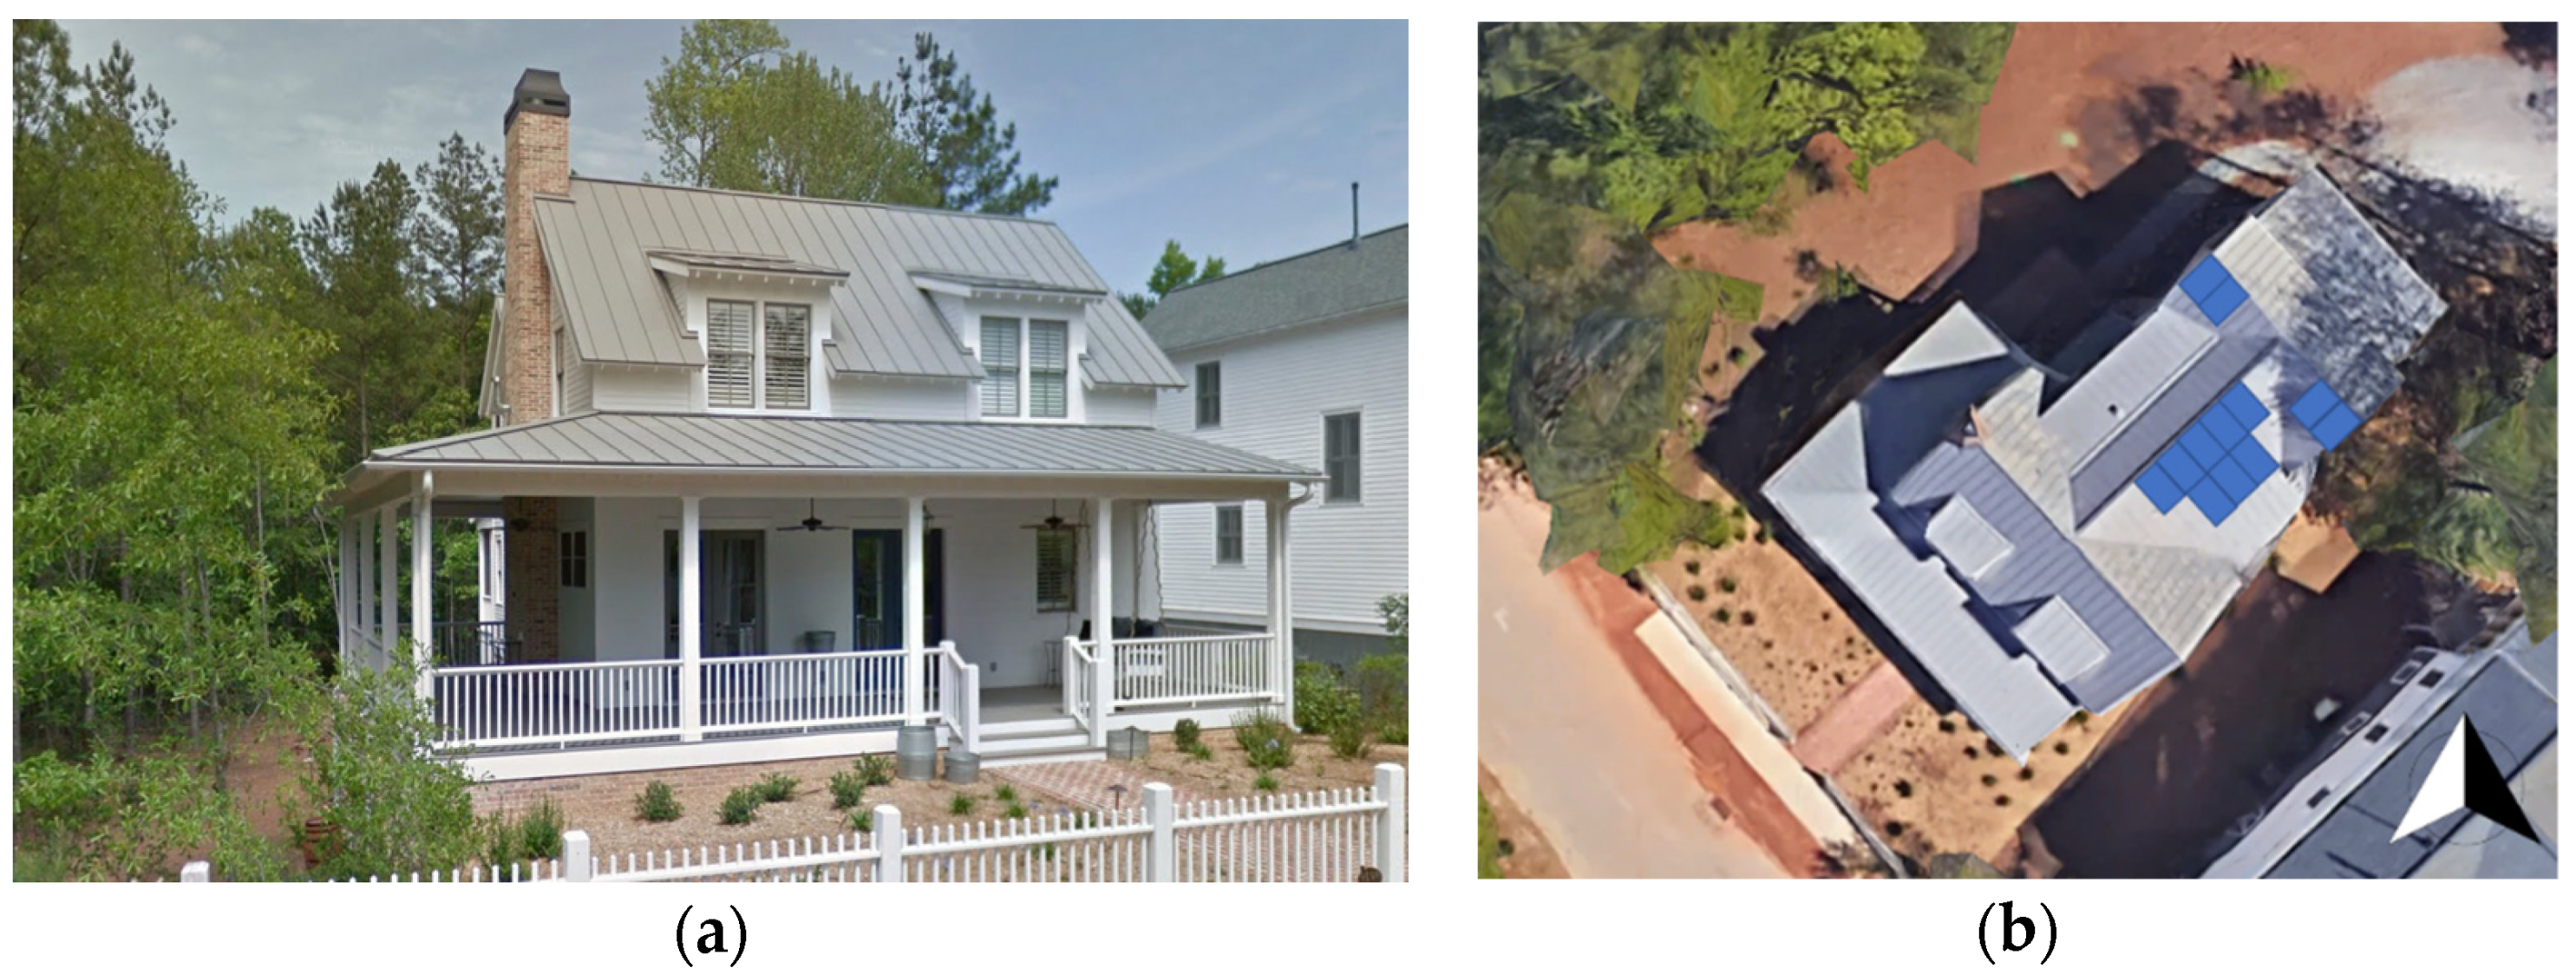
For the purpose of this study, building C with 228 m2 (2454 SF) was selected as an average size building in Serenbe and a basis of design to estimate the community’s energy performance. To do so, energy analysis was conducted to (1) calibrate the simulated utility electrical use with a base level of PV coverage (10% of the roof space) to create a base case model; (2) improve EEMs in the base case and determine EEM generated savings; and (3) increase PV coverage to 25% of the roof space with improved EEMs to calculate an NZC level. The building used double-glazing windows, LED lighting (50% of the total light bulbs), a geothermal (heating/cooling) system, high-standard construction materials and insulation (Earth Craft Certified), and domestic hot water (standalone gas boiler). The building’s baseline, with 12 PV solar panels (4.7 kW) on the roof, is shown in Figure 6.

Figure 6.
Building C in the Serenbe Community. (a) Front view (southwest); (b) roof view (PV covers 10% of the roof space). Source: modified from Google Maps 2021.
Four batteries are installed in building C. Each battery has a total energy capacity of 13.5 kWh with 11.4 kWh of usable energy [41].
4.3.1. Measured Data plus Produced Solar PV (Base Case)
Building C is a single-family detached house. The building was constructed in 2016 and is EarthCraft certified. Table 6 shows the planning characteristics of building C.
Table 6.
Planning characteristics of building C. Source: architectural drawing [42].
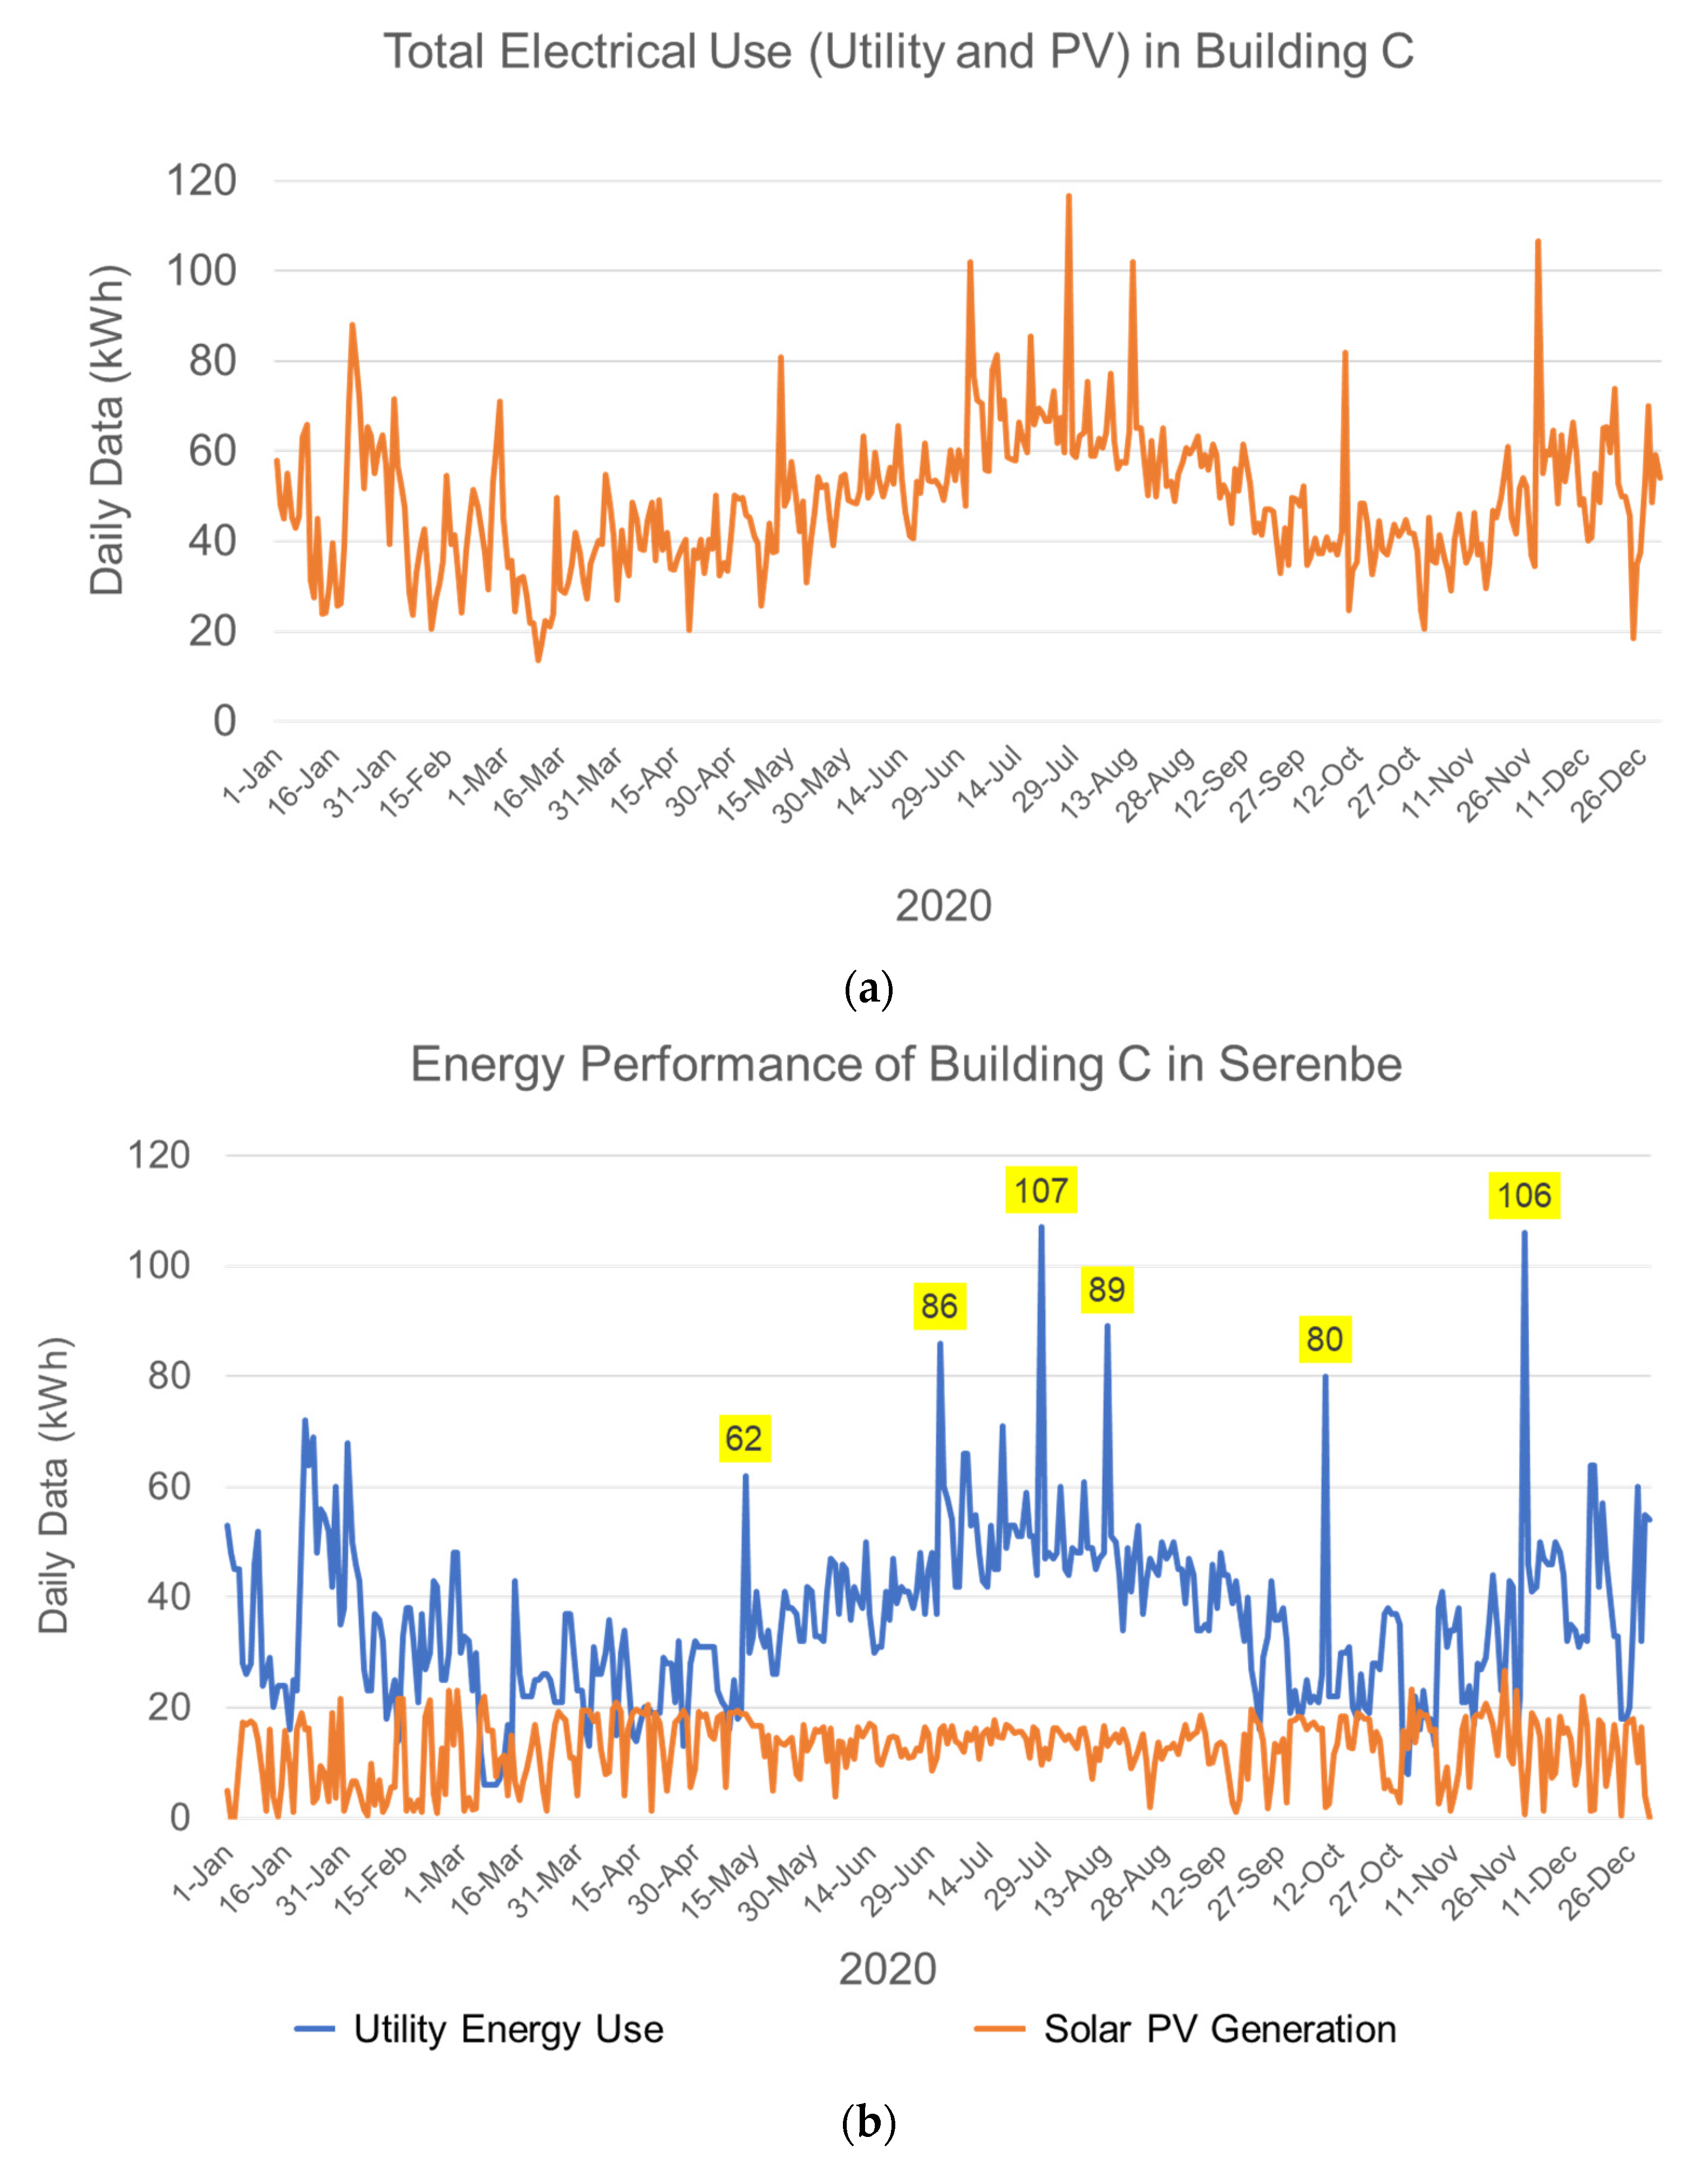
Figure 7 shows the daily electrical performance in building C from 1 January 2020 to 30 December 2020.

Figure 7.
(a) Daily electrical use (utility electricity data plus PV generation) in building C from 1 January 2020 to 30 December 2020. (b) Daily utility electricity supplied and solar PV generation (from the City Utility Power) in building C from 1 January 2020 to 30 December 2020.
The analysis showed that the rooftop PV systems provided 26% of the total electricity use in building C (17,641 kWh) in 2020. Figure 7b shows six dates with unusual energy peak loads that have occurred due to the occupant using a pottery kiln during the COVID-19 pandemic.
4.3.2. Improved EEM Simulations
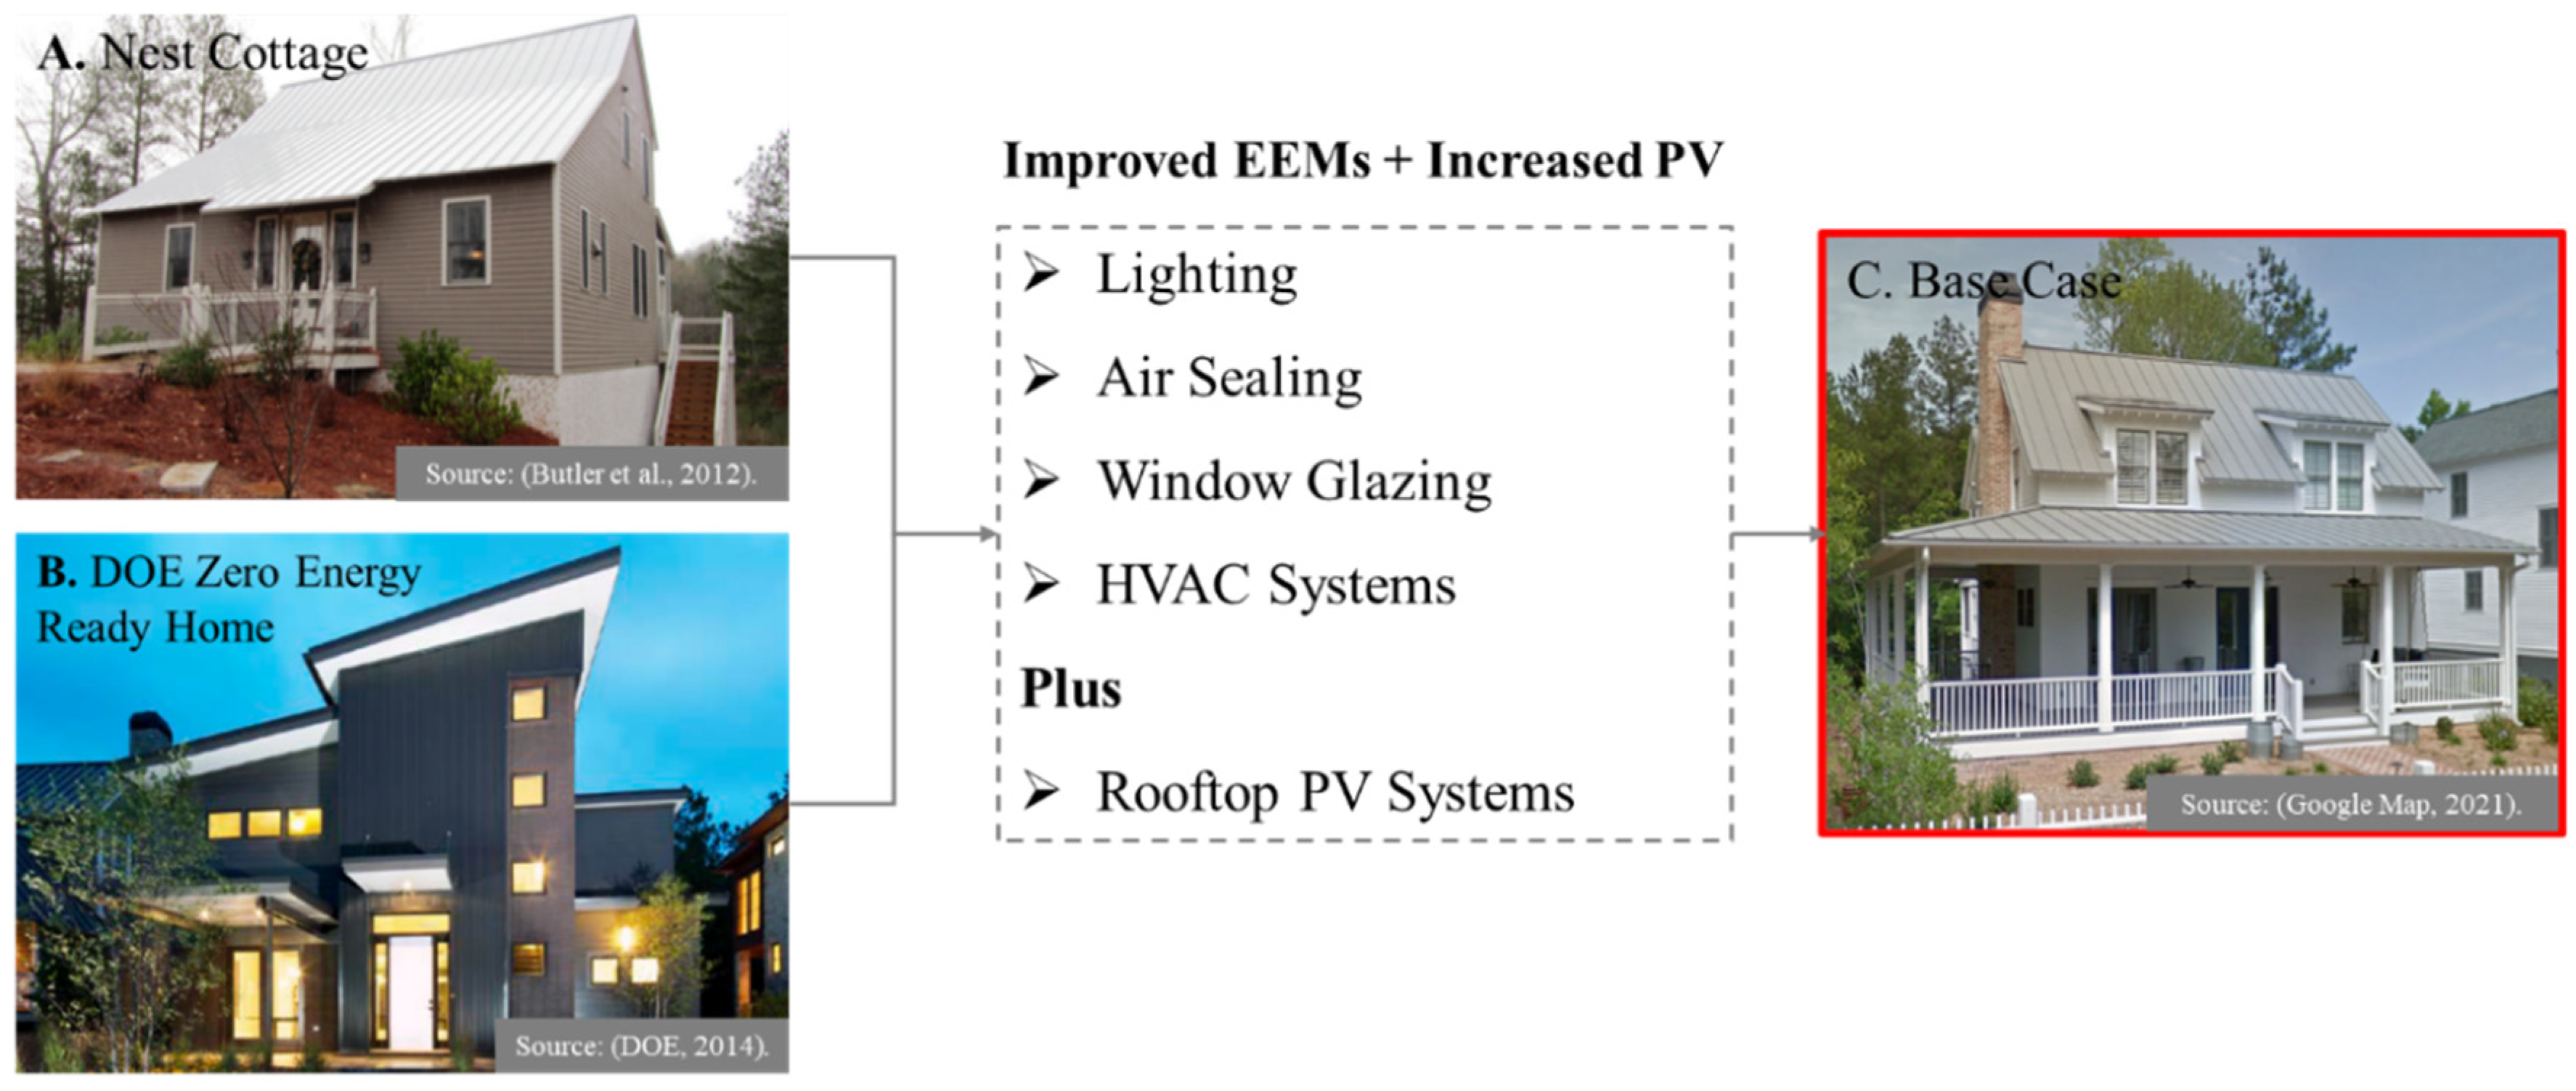
Buildings A and B showed that with improving EEMs in HVAC systems, building air sealing, lighting, and window glazing, energy savings could improve by 30% to 60% when compared to a similar construction that meets the 2009 IECC. These parameters were improved in building C to evaluate the energy savings, as shown in Figure 8.

Figure 8.
Main parameters in energy efficient buildings in Serenbe. Source: Butler et al. [36], DOE (2014) [35], modified from Google Maps 2021.
Table 7 presents specifications for the calibrated base case and improved EEMs used in the simulations in building C.
Table 7.
Specification for building C and the improved EEMs used in the simulation.
4.4. Optimization Variables
The simulation was conducted to optimize (1) the loads (window, construction material, air sealing); (2) the systems (HVAC, lighting); and (3) the renewable generations (rooftop PV, solar field) to attain NZC. The primary EEMs that improved energy savings in building C are summarized as follows:
4.4.1. Lighting
In building B, 63% LED technology with lighting controls was utilized, while in building C, 50% LED and 50% incandescent lights were used. According to the DOE, residential LED lightings use 75% less energy than incandescent lighting and last 25 times longer [44]. During the simulation analysis, LED with linear control lighting technology was selected for all 66 lighting bulbs.
4.4.2. Window Glazing
Building B used coated aluminum-clad, dual pane, and low-E glazing windows. In the simulation analysis, the closest glazing type to the ones measured in buildings A and B (with SHGC-0.2-0.31) was selected with SHGC-0.27 in building C.
4.4.3. Air Sealing
In building B, the above-grade 2 × 6 walls were constructed with advanced framing techniques and were filled with R-20 open-cell spray foam. Moreover, the underside of the roof deck was covered with the R-32 open-cell spray foam (0.21ACH50). The closest parameters selected for building C resulted in air sealing of 0.2ACH50.
4.4.4. HVAC Systems
An important energy measure in both buildings A and B was the use of ground source heat pumps (GSHPs). Building C, also used a GSHP with a 13.7 heating seasonal performance factor (HSPF) and 30 seasonal energy efficiency ratio (SEER). As the current HVAC system is highly efficient, the same efficiency rate was used for the simulation. The SEER rating of the GSHP is improving steadily [45]. It is expected that with the updated efficiency rate for newer systems, the savings in source energy and CO2 emissions increase above the estimated levels.
Moreover, it is recommended that the gas district water heater be shifted to a solar thermal water heater. According to the IEA, energy-related building codes and retrofits need to be adjusted with renewables, where buildings with available roof space and solar insulation get equipped with solar thermal water heaters as they are energy efficient and cost effective [12].
4.5. Results from Energy Analysis of Building C
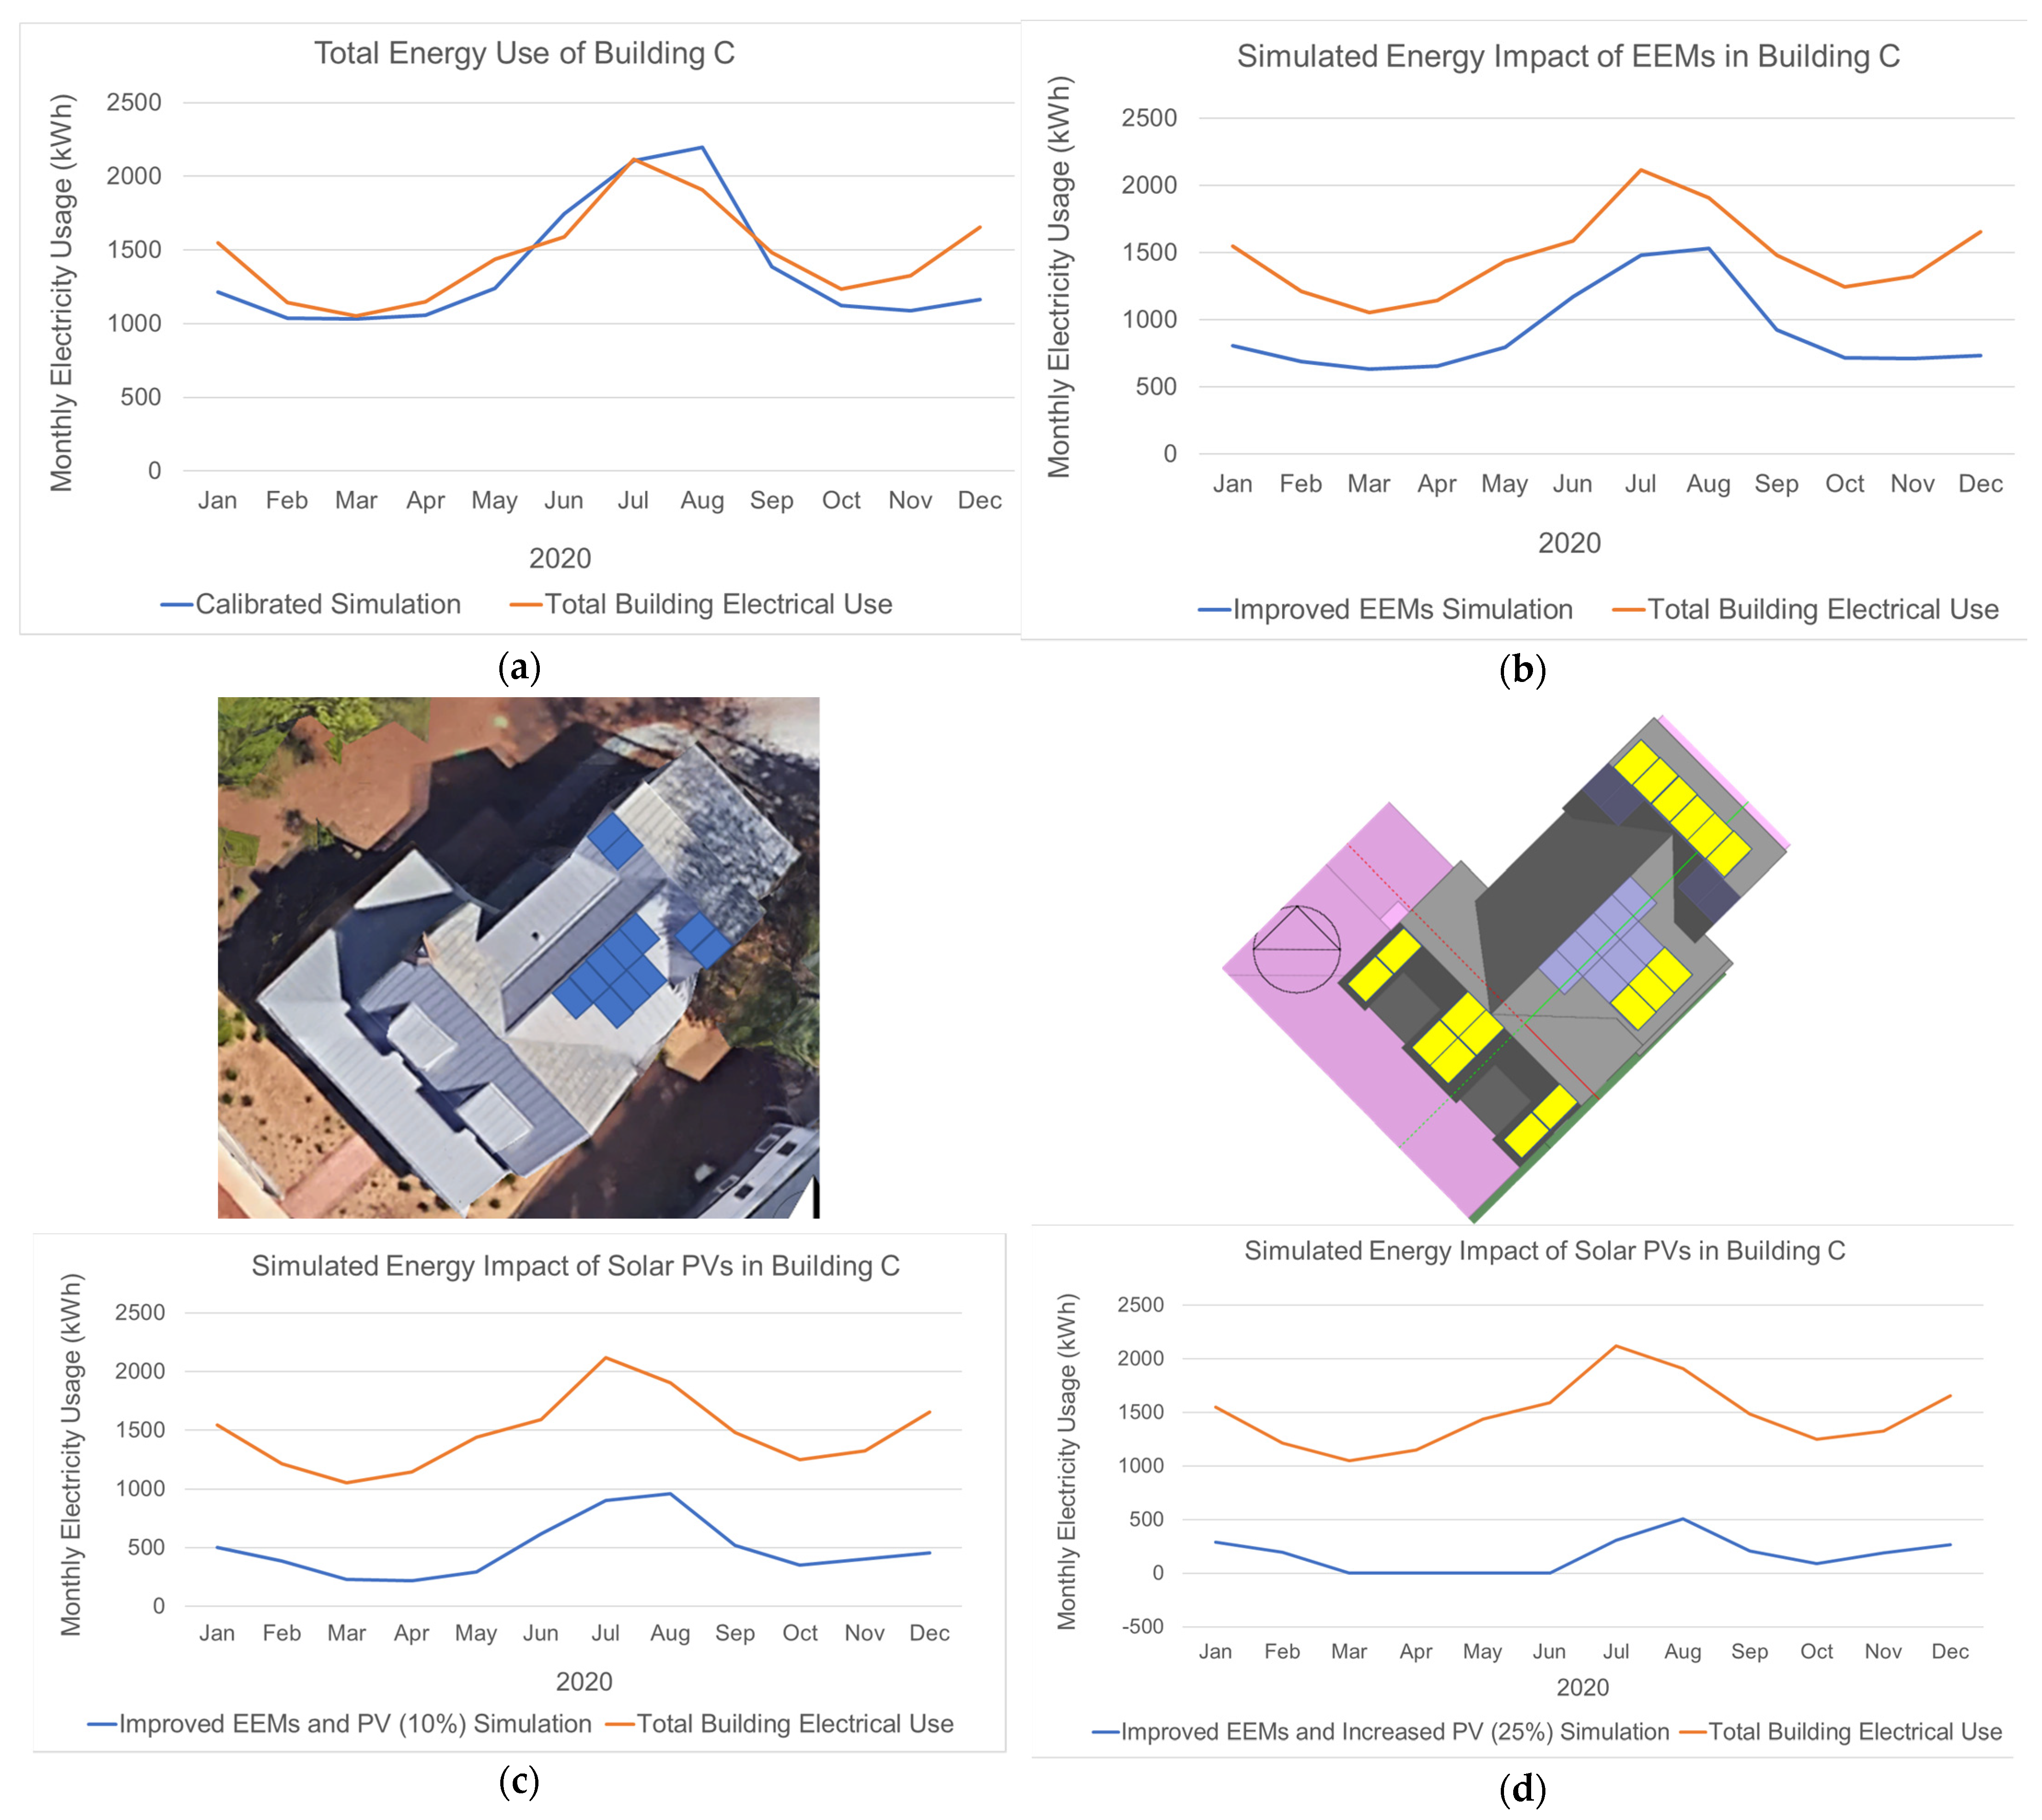
Building C is typical of other buildings that will be built in Serenbe. To analyze the energy performance of this building, calibration analysis was conducted using total building electrical use (utility electricity data and PV generation) versus the simulated model in 2020, as shown in Figure 9a. The “calibrated simulation” acts as a base case for all simulation analyses, and “total building energy use” is the baseline that represents the actual energy use of buildings C. Two scenarios were analyzed and compared with the baseline: (1) improved EEMs, and (2) improved EEMs plus increased PV coverage from 10% (24 m2/258 SF) to 25% (58 m2/624 SF) of the roof space, as shown in Figure 9b–d.

Figure 9.
Systematic analysis to verify net zero in building C. (a) Calibrated base case vs. measured baseline. (b) Energy use reductions from improved EEM simulation vs. measured baseline. (c) Utility energy use reductions with improved EEMs and PV (10%) simulation vs. measured baseline. (d) Utility energy use reductions with improved EEMs and PV (25%) simulation vs. measured baseline.
Figure 9a–d summarize the monthly energy consumption of building C in each scenario. In the base building, the solar PVs provide 26% of the building’s total electrical use and make the building NZ26%(ASHRAE). The results showed that improving EEMs could reduce the building’s annual energy use by 34% (Figure 9b). The existing rooftop PV (10% of the roof space) could cover 46% of the rest of the energy demand and help the building become 46% net zero (Figure 9c). With increasing rooftop PV to 25% of the roof space, the building would generate 80% of its total energy from the solar system and become 80% net zero (Figure 9d). The NZX%(ORG) value would be reported once the measured data are available, and the rating would be based on the measured utility use and renewable generations. Table 8 summarizes the percentage of total energy covered by renewables and utility energy savings in each scenario.
Table 8.
Comparative analysis of the measured baseline and two simulated scenarios in building C in 2020.
By analyzing building C, it is inferred that by retrofitting buildings with improved EEMs and rooftop solar PV systems (25% of the roof space), the building’s utility electrical use could reach zero in some months. It could be concluded that achieving NZ at the community level needs (1) improvement in energy efficiency to minimize energy demand; (2) solar generation at the building level; and (3) an optimized NZ path for the community to achieve its objectives. Since Serenbe is at 30% completed construction (2020), using building C as a basis of design for the other 70% would further increase energy savings at the community level. Reducing energy use by around 34% in a community of 1800 dwellings allows for smaller size renewable power systems. Energy performance and savings in three energy-efficient buildings in the Serenbe community are summarized in Table 9.
Table 9.
Energy analysis of the three types of energy-efficient, single-family buildings in Serenbe.
As shown in Table 8, all three buildings improved their energy savings when compared to conventional buildings in Georgia. However, the analyses for buildings A and B were conducted only one year after the buildings’ construction in 2012 and 2014, respectively. Moreover, the saving results in building A were reported on the basis of calculated methods rather than measured data. Therefore, updated reports on the total electrical use (utility energy data and PV generation) are needed to be available for all buildings for the researcher to quantify and verify the projects’ NZ progress.
4.6. Community Energy Analysis
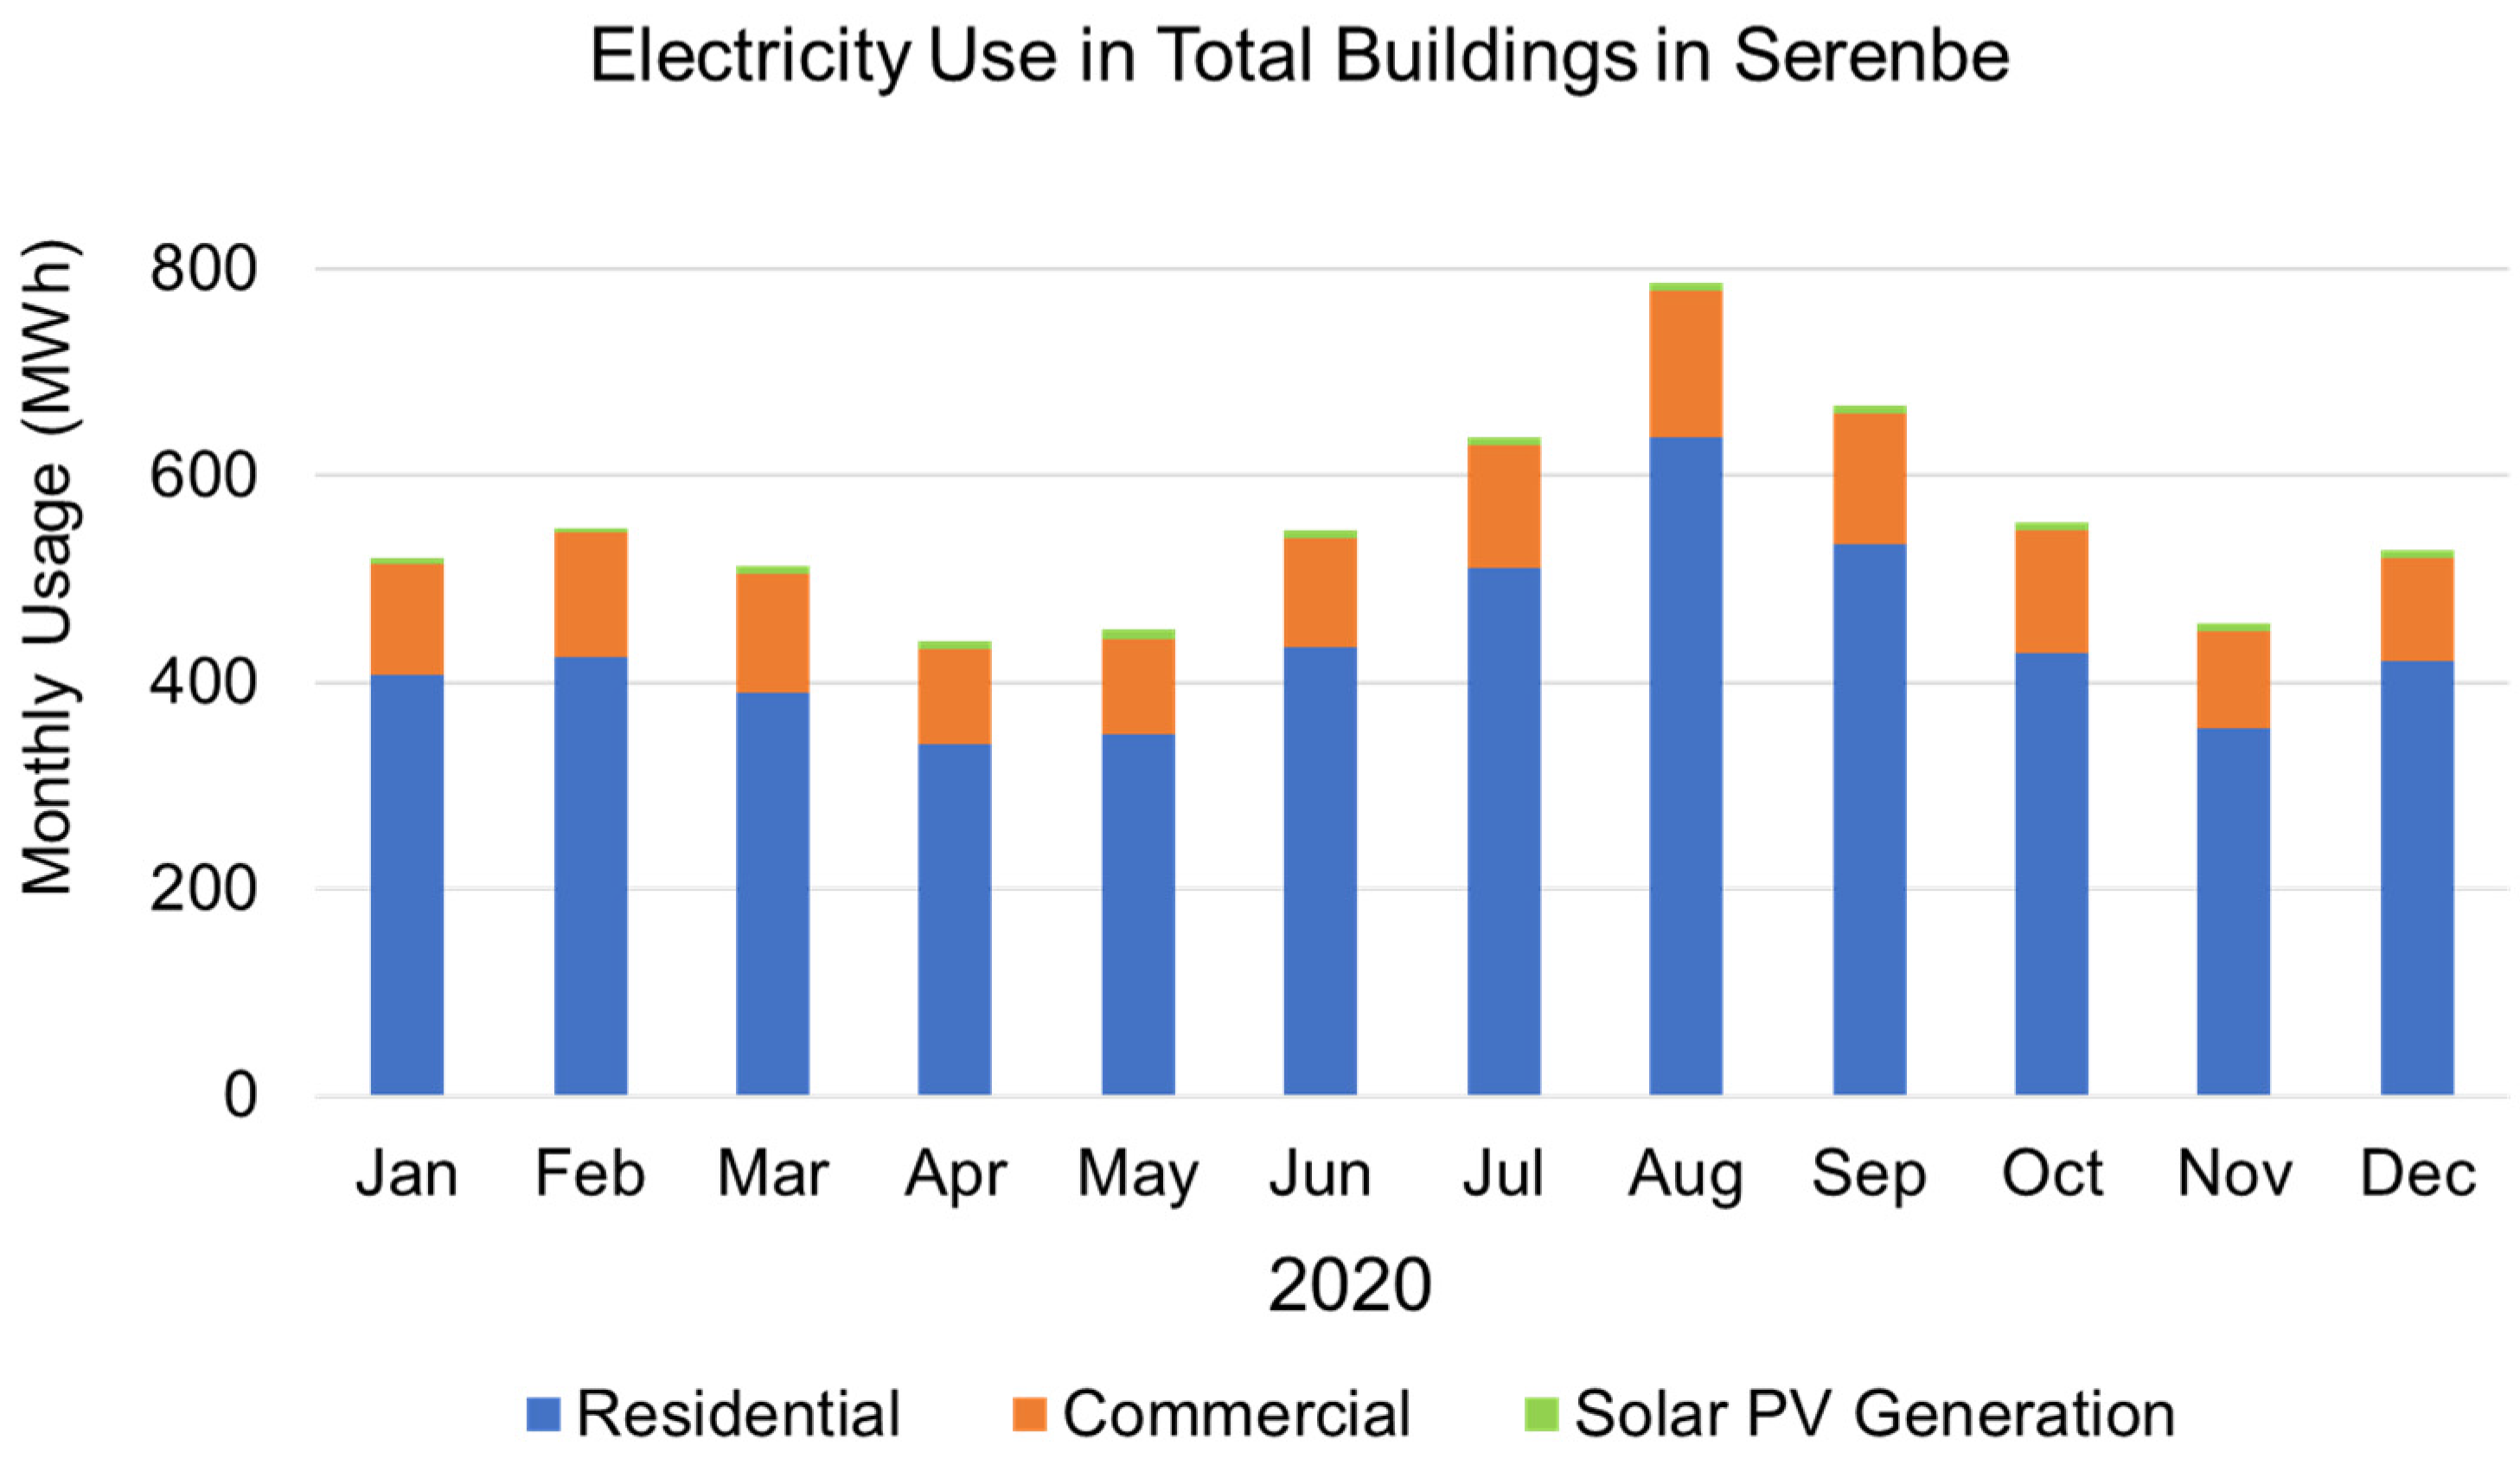
The Serenbe community mandated EarthCraft certification for all buildings, use of geothermal for all new construction built after 2011, and rooftop PV systems for all buildings that are constructed after 2022. Figure 10 shows the total electrical use of the existing 600 buildings (residential and commercial) and the current solar PV generation (19 buildings with rooftop PVs) in the Serenbe community in 2020.

Figure 10.
Utility electricity use and solar PV generations in buildings (residential and commercial) in the Serenbe community in 2020.
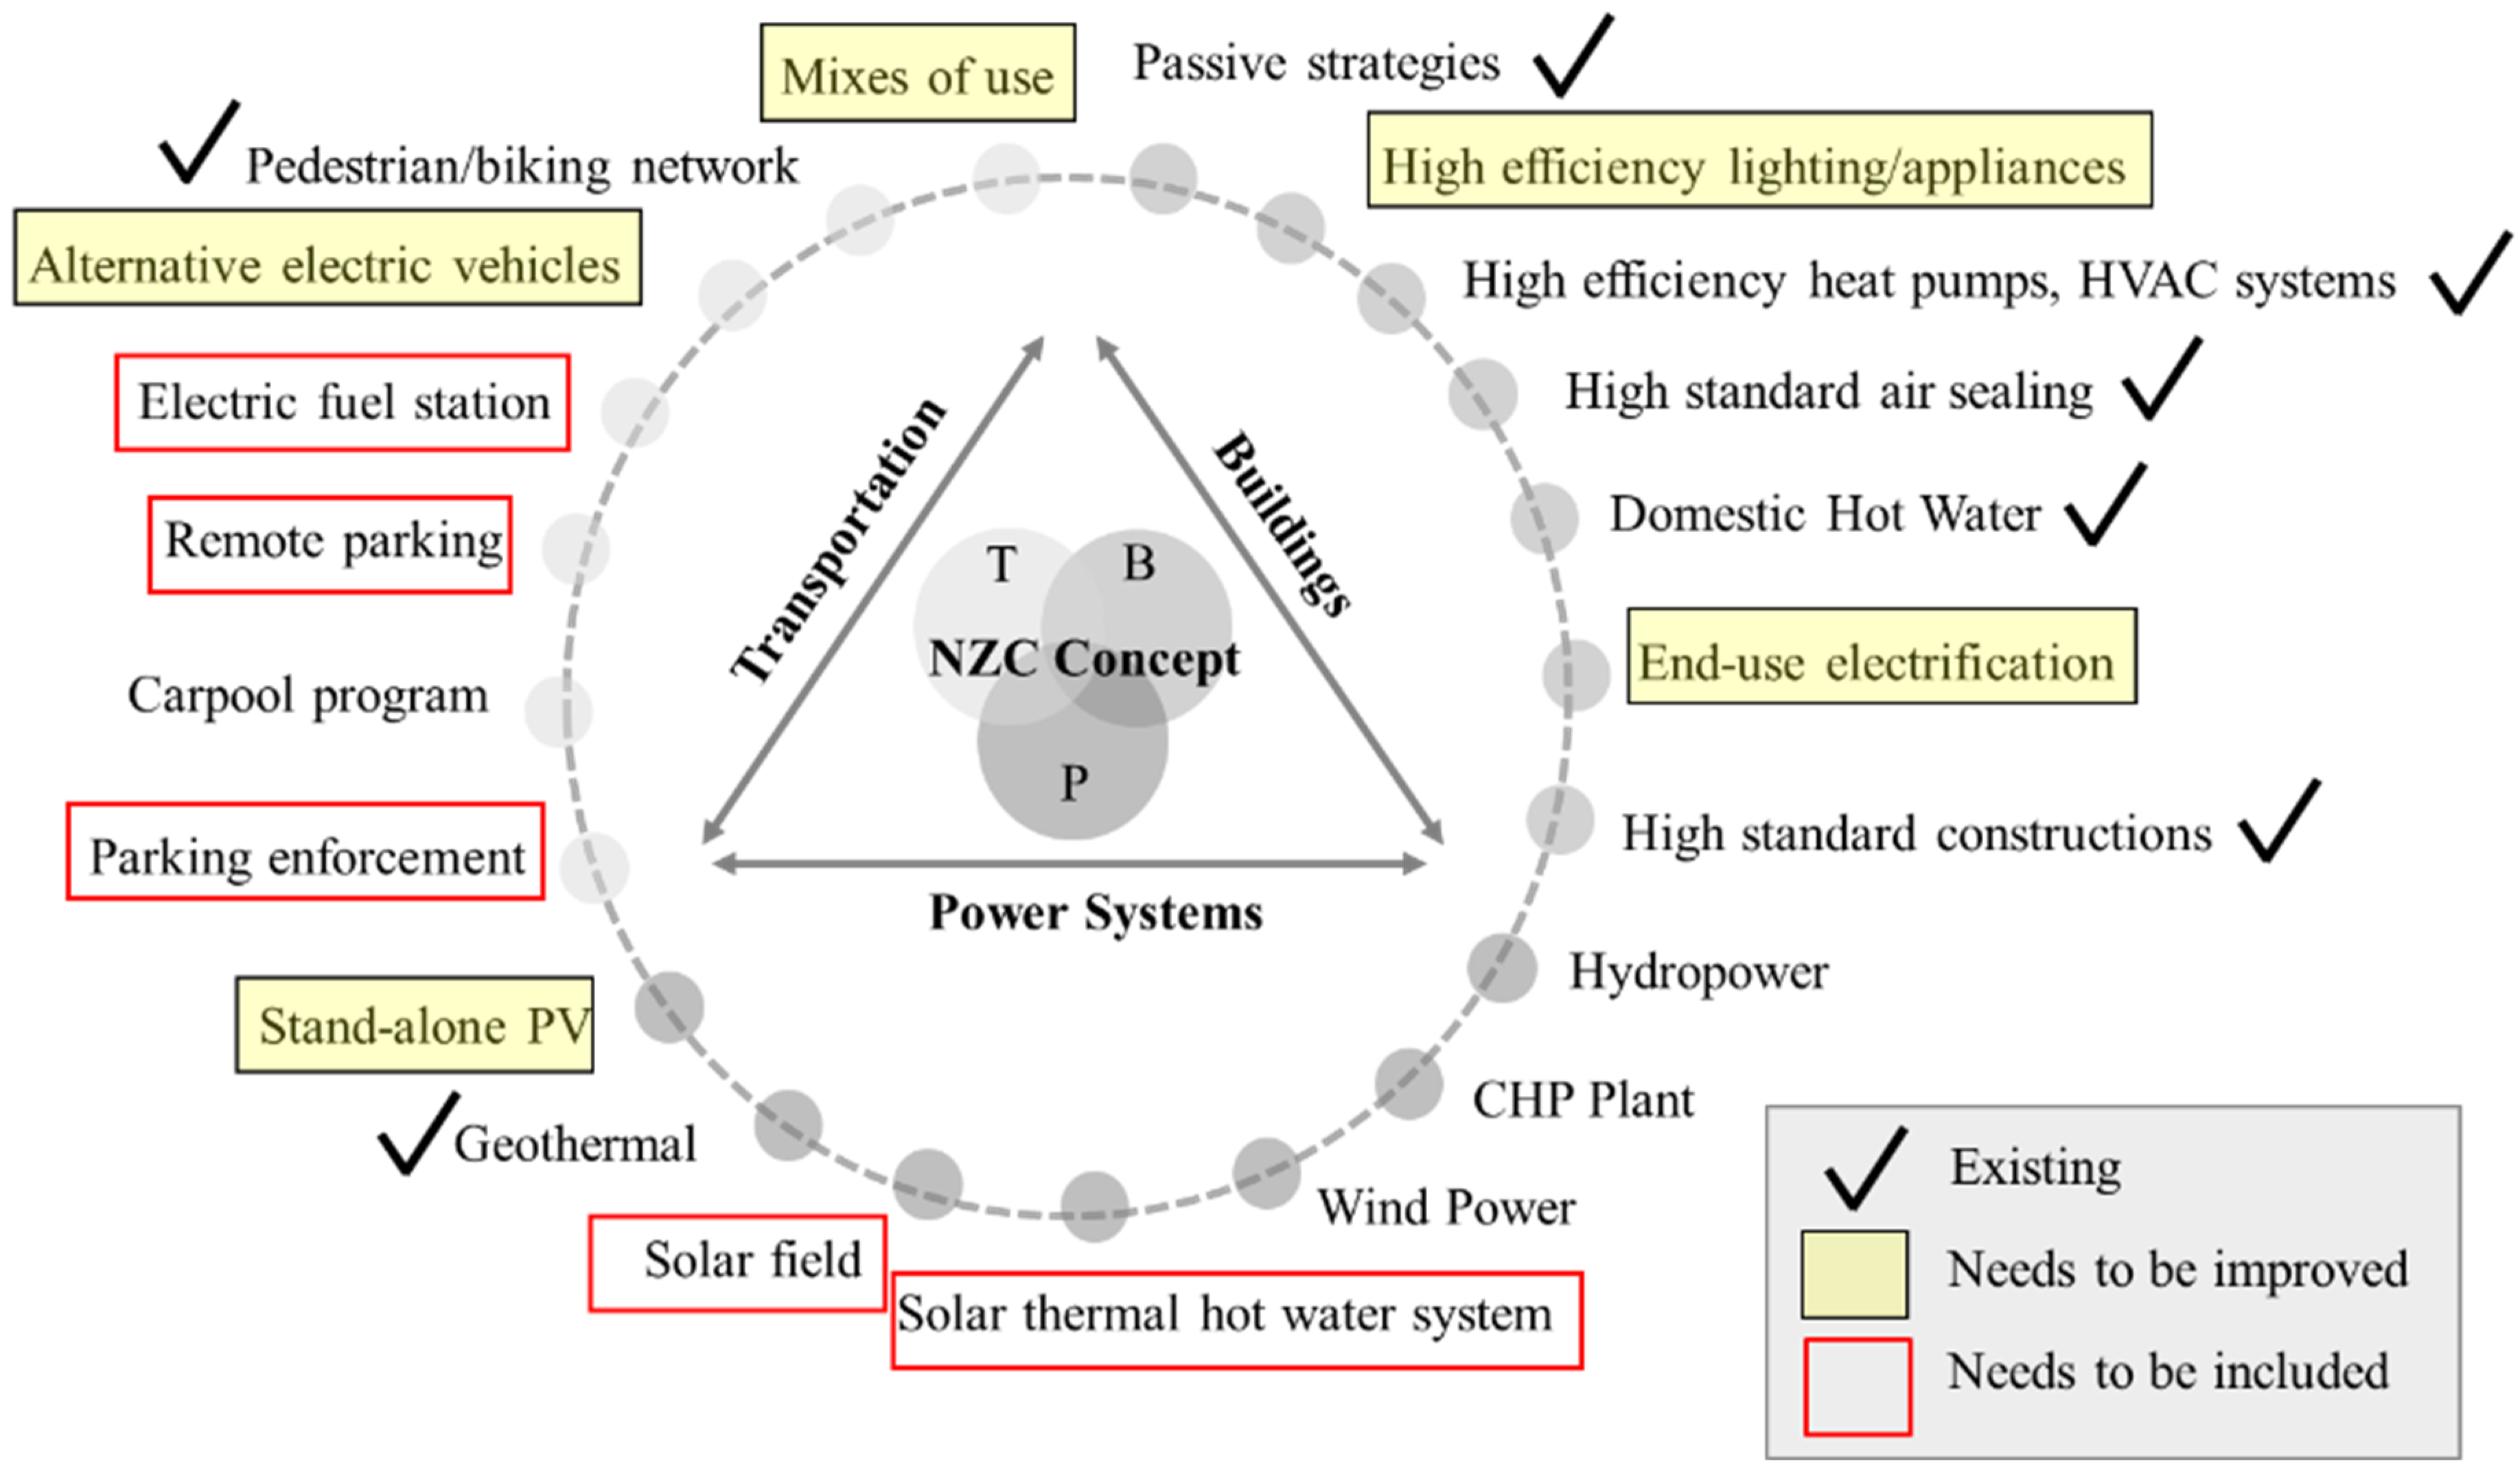
To improve the NZC, Serenbe needs to further reduce fossil-fuel-based energy use and increase renewable generation. Community design guidelines were previously developed by the authors to accelerate achieving NZC targets through improved EEMs, electrification, and renewables in power systems, buildings, and transport sectors (PBT) [15]. Applying these methods to the Serenbe community will reduce peak loads, where renewable technologies could generate the rest of the energy demand. Figure 11 highlights the parameters in PBT sectors in Serenbe that need to be improved or included to speed up the community’s NZC achievements.

Figure 11.
Energy parameters in power systems, buildings, and transport sectors in the Serenbe community that accelerate the community’s NZC achievements. Note: (P) community power production through renewable sources; (B) energy use in buildings; (T) energy use in transportation. Source: modified from Moghaddasi et al. [15].
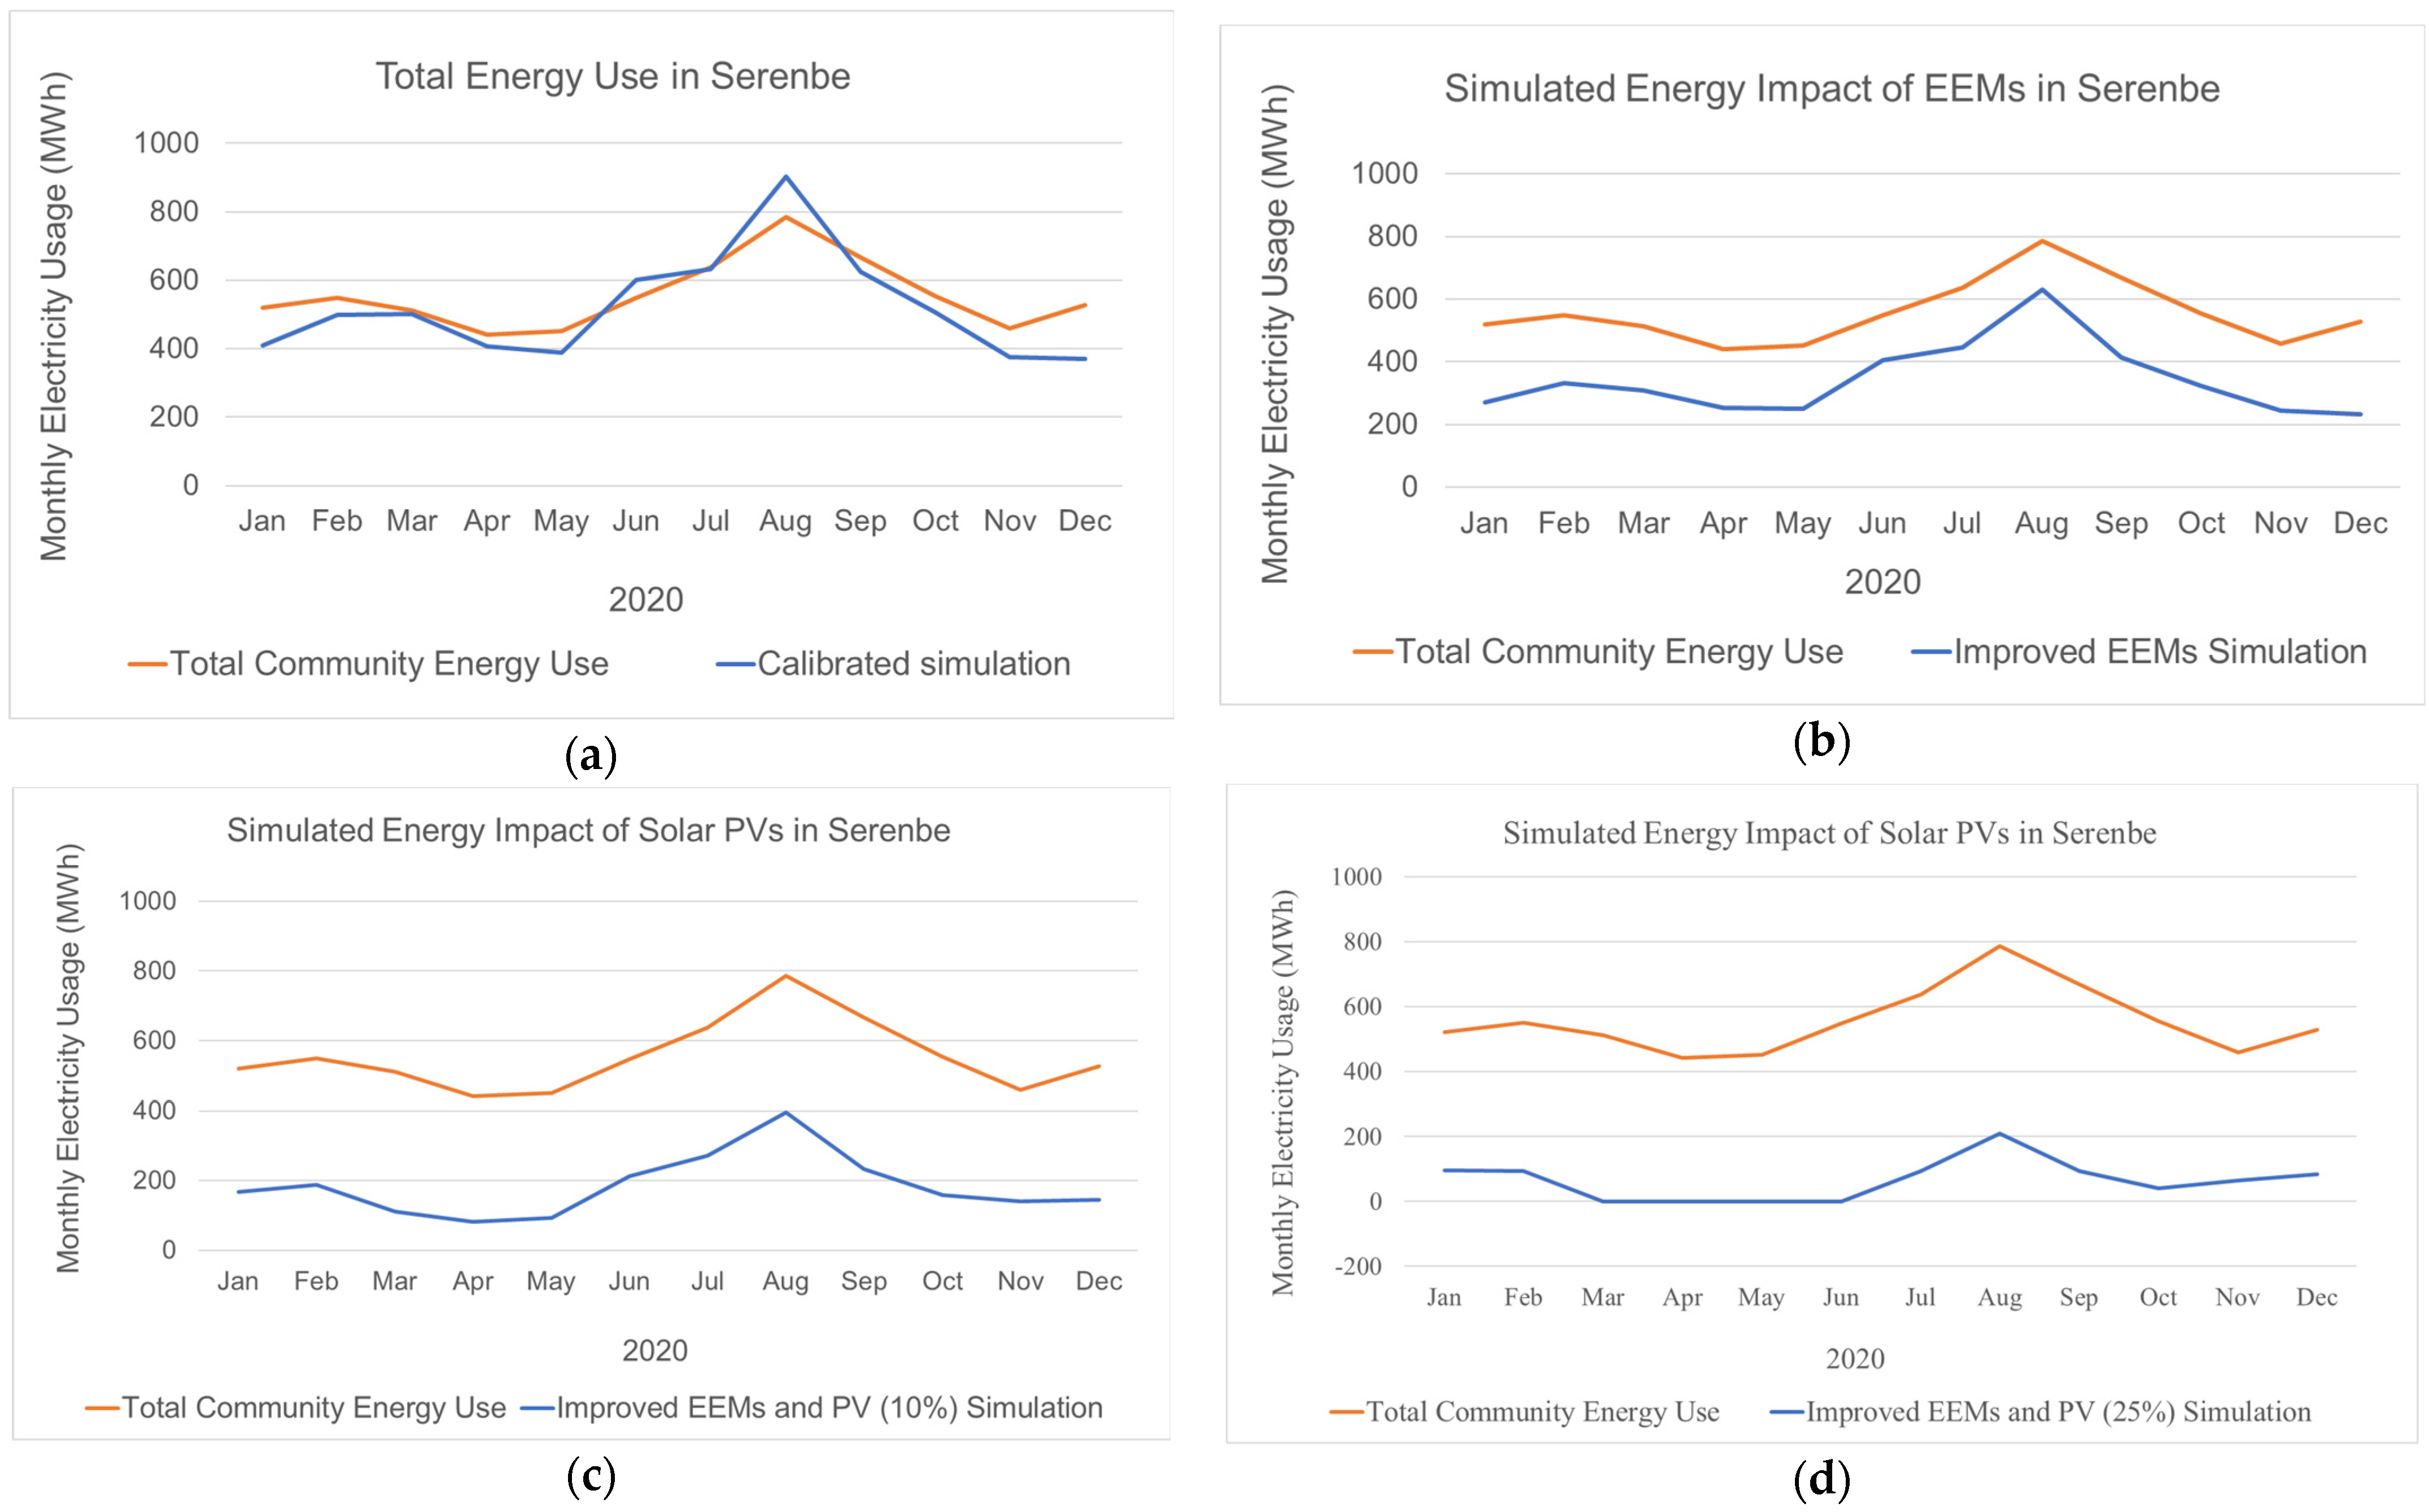
The community energy analysis was conducted on a square meter basis, as shown in Figure 12: (a) improved EEMs and PV (25%) simulation Vs. measured baseline, base case calibrated model with extending building C to the Serenbe scale (600 buildings) and use of the total community electrical use (utility energy use and PV generation); (b) improved EEM simulation; (c) improved EEMs and increased rooftop PV (10% of the roof space) in all buildings; and (d) improved EEMs and increased rooftop PV (25% of the roof space) in all buildings.

Figure 12.
Systematic energy analysis for the Serenbe community to become NZC. (a) Calibrated base case vs. measured baseline (utility and PV generation). (b) Improved EEM simulation vs. measured baseline. (c) Improved EEMs and PV (10%) simulation vs. measured baseline. (d) Improved EEMs and PV (25%) simulation vs. measured baseline. Note: 1Megawatt hour (MWh) = 1000 kilowatt-hours (kWh).
In Serenbe (2020), 19 buildings with PV rooftops provided 16% of the total electrical use of the entire community, which verifies an NZC16%(ASHRAE) for base Serenbe. Figure 12 shows 34% community energy saving as a result of improving EEMs compared to the baseline (measured data). The results show that the community could either become 46% NZC and increase its utility energy savings by 65% by retrofitting the existing buildings with rooftop PV (10% of roof space), or it could become 80% NZC and increase its utility energy savings by 88% by covering 25% of roof spaces with rooftop PV systems in all 600 buildings. Once the data are obtained and made publicly available, the NZCX%(ORG) value should be reported.
By reducing the total community’s utility energy use (≈30–50%), a community power production system could generate the rest of the energy demand (≈50–80%) from renewables. Building C showed that 12 rooftop PV systems (4.7 kW) provided 26% of the total electricity use of the building. Considering the Serenbe’s area, density, and available vacant land, a solar field would be a potential solution to generate on-site energy.
5. Community Solar and Economic Analysis
According to IEA, as of 2021, on-site solar PVs are installed on 25 million rooftops worldwide and are projected to increase to 100 million by 2030 and 240 million by 2050 [12]. Community solar projects have become increasingly affordable in the USA over the past years. Reduction in the cost of PV systems, the availability of consumer-friendly finance options, and increased consumer demand are the credited reasons. This presents an opportunity for multifamily houses or other structures to obtain solar-ready roofs. The National Renewable Energy Laboratory (NREL) predicts that appropriate and supportive regulatory frameworks set up by federal, state, or local governments could result in significant uptake of community solar to potentially cover all homes and businesses [46].
According to Feldman et al., it is estimated that 49% of households are unable to install PV systems when accounting for renters, inability to access roofs in high rises and multi-unit houses, or insufficient roof space [46]. It is also estimated that 48% of businesses cannot accommodate PV systems due to similar exclusions as in the household sector such as insufficient roof space to install a PV system with an adequate capacity that meets the energy needs of the business. By catering to customers who meet the criterion, the share of community solar could reach between 32% and 49% of the distributed PV market [46]. This would imply an additional deployment of 5.5–11.0 GW of solar PV, representing USD 8.2–16.3 billion in added investment [46].
Savings to investment ratio (SIR) is a metric that is often used to investigate projects’ affordability [47]. The metric captures the ability to recover one’s investment in solar on the basis of the utility bill savings resulting from the solar energy generated by a given solar energy system. After conducting a SIR analysis for all 50 states with the assumption that individual residential PV systems cost between USD 3.00 to USD 3.50 per watt and have a life span between 25 to 35 years, NREL recommended a shift to solar as a cost-effective option for households in 12 to 25 states [48]. In contrast to individual solar, community solar projects are more significant, benefiting from the wholesale pricing and reducing the cost of commercial solar (USD 1.91 per wattAC) or utility solar (USD 1.35 per wattAC) [49]. At that level, community solar projects will be a financially viable option in every state except Alaska [48].
6. Results and Discussion
This paper estimated the potential for electricity generation and saving for the Serenbe case study. The area of the typical building C in Serenbe is 228 m2 (2454 SF) with a pitch roof surface area of 193 m2 (2077 SF). According to NREL, 25% of the total rooftop area in residential is suitable for PV [48], which provides 58 m2 (624 SF) of PV per house (with average size) in Serenbe. Atlanta has a solar irradiance of 4.75 KWh/m2/day [50,51]. Assuming a panel efficiency of 19%, common for home solar installations, solar panel installations in Serenbe can produce an average of 0.95 kWh/m2/day or around 16.7 MWh per house per year when it is fully developed [52]. Given the average retail price of electricity in Georgia of 9.93c per KWh and average CO2 emission of 725 g/kWh [53], this would imply an annual saving of $871 in electricity cost and six tonnes of CO2 per building in Serenbe. As Table 10 shows, Serenbe (1800 buildings) would generate a total of 16 GWh of electricity per year with an estimated CO2 saving of 11.5 k tonnes (equivalent to the annual emission of 829 vehicles) [54].
Table 10.
Savings from the community solar (Serenbe).
Higher availability of roof area combined with higher efficiency panels could push this number higher. Table 11 shows three scenarios for community solar: (1) all 1800 buildings install rooftop PV; (2) half of the buildings (900) install rooftop PV and include 5 ha (13 acres) of the solar field; and (3) 20% of the buildings (360) install rooftop PV and include 8 ha (20 acres) of the solar field.
Table 11.
Optimized community solar solution for Serenbe.
It was assumed that the cost of rooftop PV is USD 3 per Watt and that of the solar field is USD 1.90 per watt. With 19% PV efficiency and solar irradiance of 4.75 KWh/m2/day or 4.75/24 KWh/m2/h, the cost of rooftop PV was calculated to be USD 3 × 4.75/24 × 0.19 × 1000/m2 or USD 112.8/m2. Similarly, the cost of the solar field will be USD 1.90 × 4.75/24 × 0.19 × 1000/m2 or USD 71.5/m2. The total installation cost was calculated for the three scenarios described above, as illustrated in Table 11. As the Serenbe community is composed of five separate hamlets, the solar field could be distributed either in one or multiple locations depending on the available vacant land. Table 11 compares the price of three scenarios, and given the lower cost of scenario 3 (29% less than scenario 1 and 13% less than scenario 2), it shows a preference for a solar field and retrofitting 20% of the buildings (360 buildings) with rooftop PVs. Moreover, scenario 3 is a more practical solution due to the limitations in rooftop PV installations (i.e., design, orientation, space, accessibility).
NZCX%(ORG) Projections in Serenbe 2020
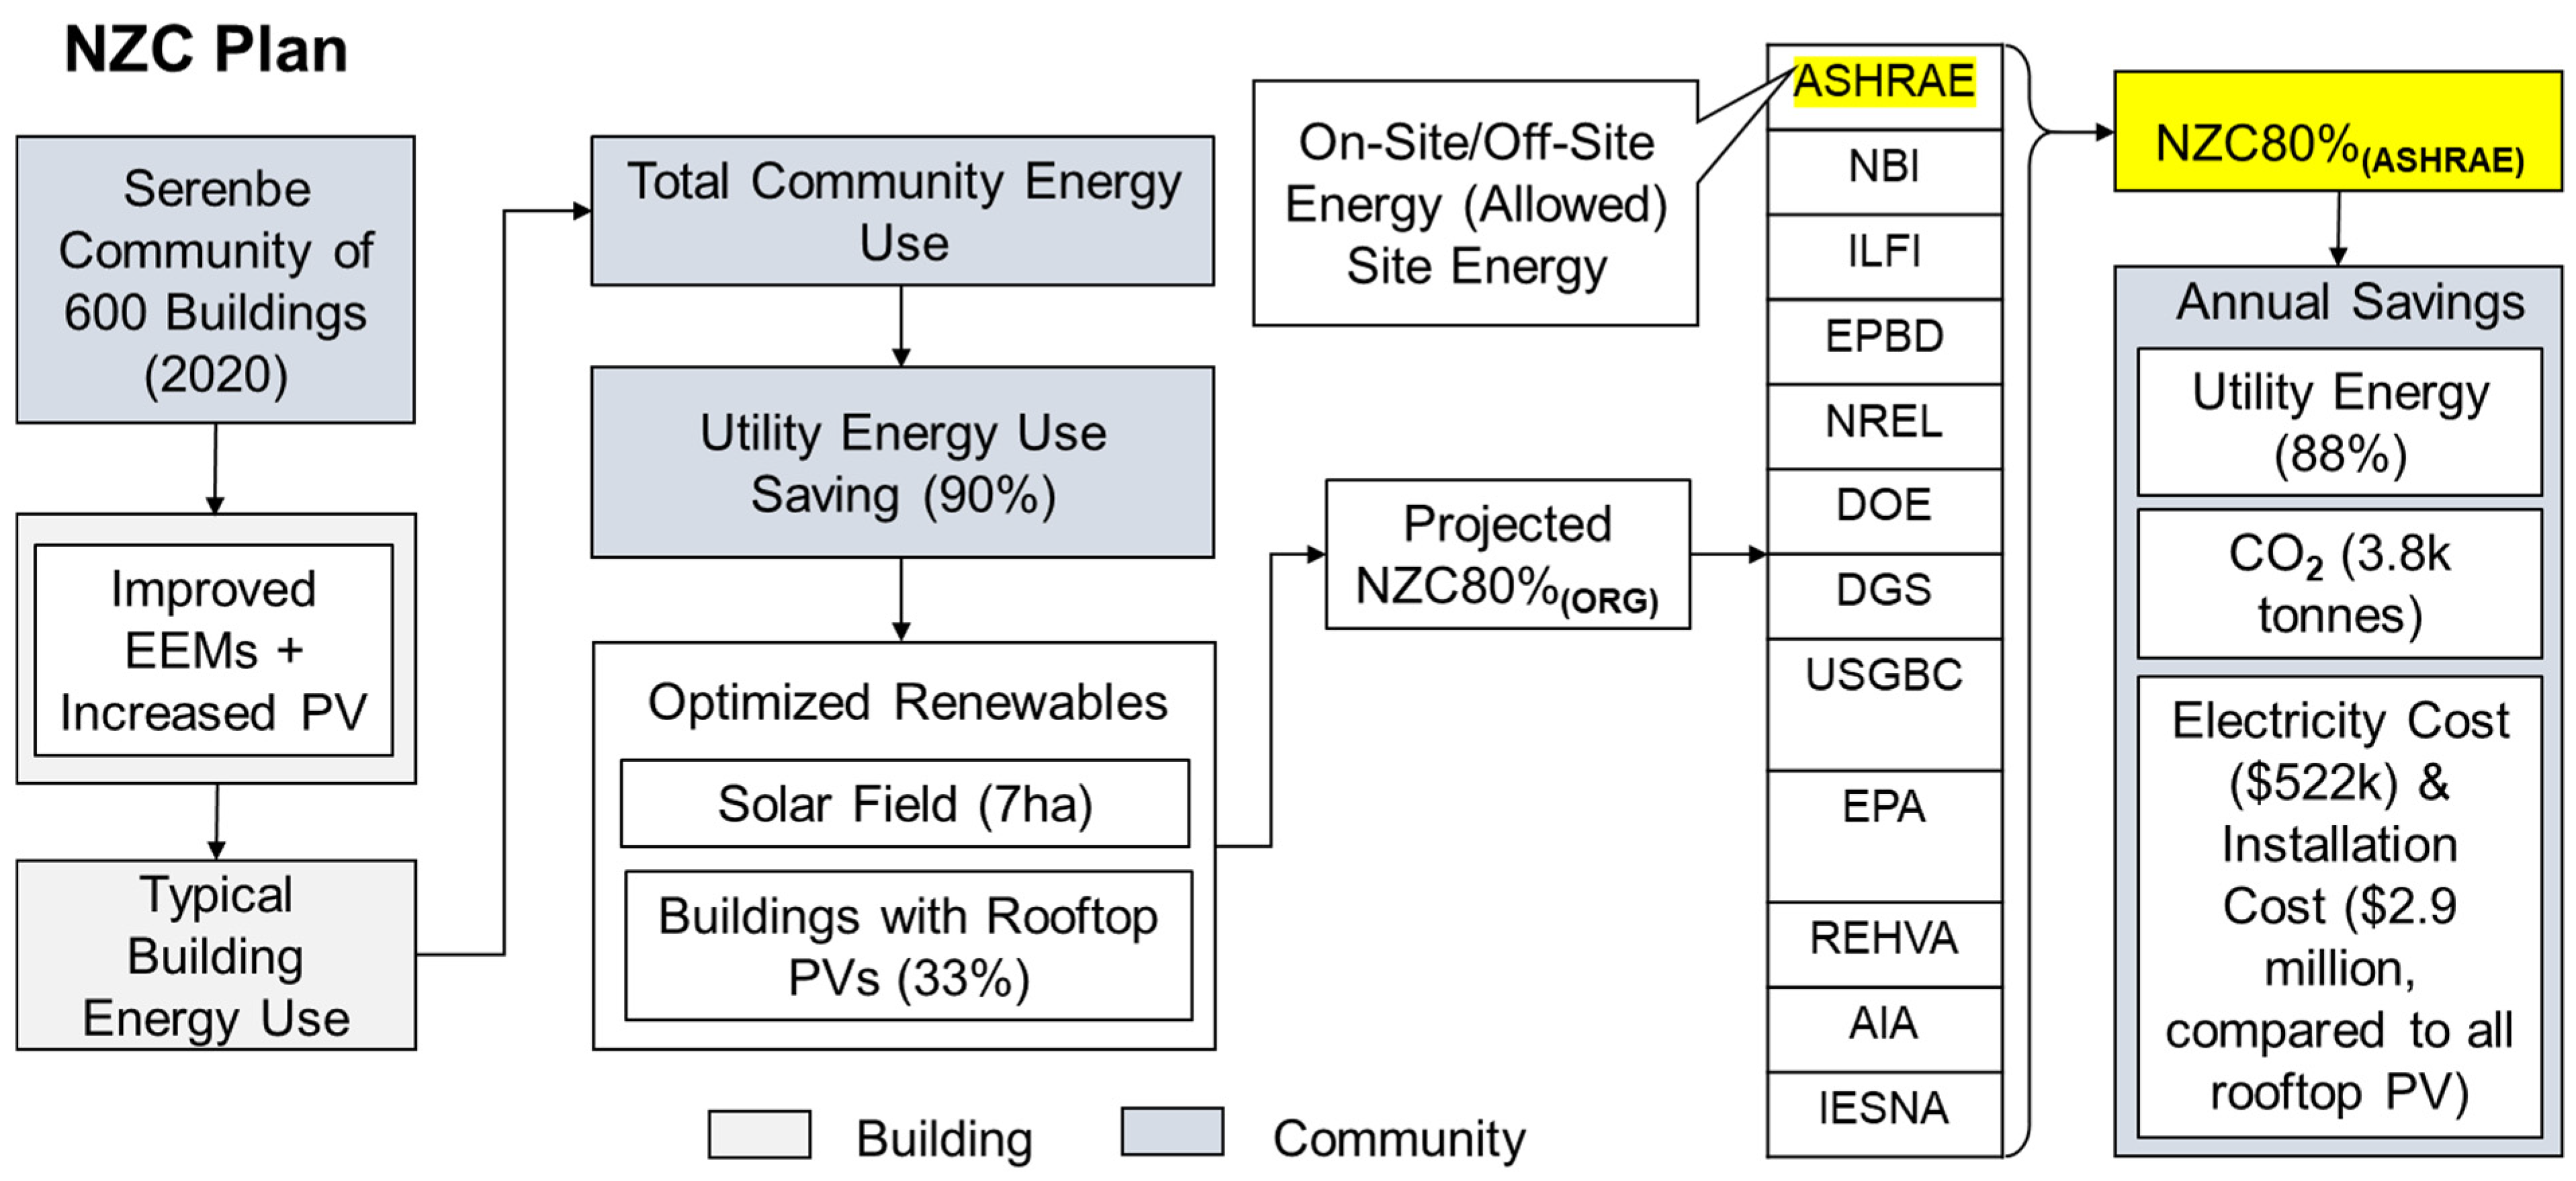
The results from energy analyses show that for Serenbe to become NZC, total peak loads need to be balanced with on-site renewable supplies. The analyses showed that with improved EEMs and increased PV systems on the roof, both building C and the community of 600 buildings could reduce their utility energy use by around 65–90%. Moreover, it was calculated that by providing a 7ha (17 acres) solar field, only 33% of the 600 buildings need to be covered with rooftop PVs for Serenbe to become NZC80%(AHRAE). As an outcome of this solution, the installation cost could be reduced by $2.9 million compared to if all the 600 buildings have rooftop PV systems.
Moreover, with Serenbe generating from on-site sources; calculating site energy in quantifying its NZC practices; and allowing for combustion fuels, the NZ definition by the EPA, NBI, AIA, ASHRAE, and IESNA organizations could be selected by the project. In this paper, it was assumed that Serenbe uses ASHRAE’s NZ. Figure 13 summarizes the process of becoming NZC80%(ASHRAE) in the Serenbe community in 2020.

Figure 13.
Adapting the NZCX%(ORG) model to the Serenbe community with 600 buildings in 2020.
Regarding transportation energy use, various mix-use options are accessible through pedestrian networks, including restaurants, cafés, community centers, stores, groceries, health centers, spa centers, and schools. Moreover, electric golf carts are used for in-place transportation. Yet, further improvements are needed, including:
- Providing solutions that reduce trip distances.
- ○
- integration of mixes of use daily requirements (i.e., groceries, cultural center, library).
- Encouraging pedestrian movement.
- ○
- comprehensive path system and sidewalks;
- ○
- remote parking lots for the gasoline-powered vehicles at the site boundary;
- ○
- parking enforcement.
- Promoting alternative electric vehicles.
- ○
- solar-powered charging stations in individual buildings;
- ○
- electric fuel stations;
- ○
- autonomous electric shuttles [55].
Buildings in Serenbe are EarthCraft certified with a geothermal system (heating and cooling) and district hot water. Facilities are partially equipped with rooftop PVs, efficient lighting/HVAC systems/windows/appliances, and improved constructed standards. To accelerate achieving NZC, Serenbe needs to further (1) improve EEMs (i.e., retrofit existing buildings with LED lighting technology and mandate it for the new construction); (2) use solar thermal water heaters and electrified end uses and stoves; (3) incorporate renewable energy power sources and renewable infrastructure systems; (4) promote/mandate electric vehicles and boost pedestrian/biking networks for in-place transportation; and (5) provide remote parking lots at the site boundary and alternative electric vehicles (i.e., autonomous shuttles) for between-place transportation.
7. Conclusions
This paper presents a reorganized Net Zero concept through a systematic methodology that combines measured data and simulated models. The NZX%(ORG) is a straightforward concept that is based on (1) measuring the baseline to the project’s initial NZ; (2) conducting different approaches/simulations to create a projected NZX%(ORG); and (3) publishing the measured NZX%(ORG) with supporting data after a year of metering. This is a very simple process defined by this paper, providing a proposed number that accelerates the optimization approach and enabling the selection of high-value EEM or generation. Once measured data exist, NZX%(ORG) defines the current status of renewable content, which helps a community decide on their next steps to reduce using non-renewable energy. To test the validity of this proposal, it was applied to a monitored case study of the Serenbe community and a single-family building in Serenbe. The results from the analysis showed that by improving energy efficiency and increasing rooftop solar PV systems, the project could save around 65–90% in utility energy use compared to the baseline–total electrical use (utility electricity use and PV generation) in 2020. The EEMs with the highest impacts on energy savings included GSHP, lighting, building air sealing, and window glazing.
The analysis provided guidance on the specific improvements to implement and serves to encourage achieving higher levels of NZ. Assuming Serenbe uses ASHRAE’s NZ definition, the base community (2020) with a measured NZC16%(ASHRAE) was projected to achieve 80% renewable power. After a year of recording measured power from utility bills, if Serenbe achieved a measured 72% savings from the measures and then added 28% off-site renewable power, their rating would become NZ100%(ASHRAE). However, considering the availability of vacant land in Serenbe and economic point of view, combined rooftop PV systems with a solar field were concluded as a practical solution.
Reorganizing the NZC to an adaptable concept along with design guidelines enables key stakeholders, including developers, engineers, and building and grid designers, to accelerate achieving their projects’ NZ objectives. Analyzing the case study of Serenbe showed that (1) the NZ energy practices can be quantified and verified at the community scale; (2) savings in energy and CO2 emissions need foresight both in the early phase of design and planning with careful implementation of the strategies; (3) documented annual reports on the monitored hourly and monthly utility data is necessary to track the NZ progress; and (4) the adaptable NZ is a practical concept that motivates stakeholders to take the first steps and improve. This paper concludes that incorporating a community with improved EEMs and renewables are key elements in optimizing energy use and achieving NZC targets. The results from NZX%(ORG) present a promising plan that Serenbe can apply and estimate its NZC by 2050, which is measurable, trackable, and adaptable to different regions and requirements. This paper conducted calculations on the basis of a monitored case study analysis, measured utility electricity data and PV generation, and simulated assumptions on a square meter basis.
The limits of this research are (1) access to the utility energy and PV generation data; (2) sample size (one typical building) being relatively small; and (3) use of Typical Meteorological Year (YMY) weather data versus actual data. One problematic difference in NZ reporting is that some methods allow only on-site renewable generation and others allow for off-site renewable generation. Since the primary intent of all NZ methods is to reduce carbon in the atmosphere, it is recommended that all NZ processes allow both on-site and off-site renewable generation as counting toward the net zero. This will (1) motivate a higher use of solar and wind farms by a variety of communities that lack the land needed for renewable generations and (2) accelerate achieving an NZ by enabling the growth of off-site renewable power. Moreover, purchasing renewable energy will be important for major cities since they lack the surface area to apply large wind or solar renewable installations. For example, if Serenbe was located in NYC, the NZC80%(On&Off-SiteOK) would have decreased to NZC46%(On-SiteOnly), unless it chooses an organization’s NZ that allows the use of purchased off-site power, i.e., ASHRAE, NBI, or AIA (Table 3). Ongoing metering of power used, purchased, and generated is another factor that must be conducted in order to validate NZ achievements. In future research, (1) calculations in the methodologies will be improved for a better simulation outcome, and (2) a significant increase in the use of real data and continuous reporting will be promoted. If a system is measured, it is controllable.
Author Contributions
Conceptualization, H.M. and C.C.; methodology, H.M. and C.C.; software, H.M.; validation, H.M., C.C. and M.E.; formal analysis, H.M.; investigation, H.M.; resources, H.M., C.C., J.V., S.D. and M.E.; data curation, H.M., C.C. and M.E.; writing—original draft preparation, H.M.; writing—review and editing, H.M., C.C., J.V., S.D. and M.E.; visualization, H.M.; supervision, J.V. and C.C.; funding acquisition, J.V. All authors have read and agreed to the published version of the manuscript.
Funding
This research received no external funding.
Acknowledgments
Steve Nygren, the founder and developer of Serenbe; Culter’s Family, Serenbe’s residents; and Serenbe Development’s team, for providing access to the energy data at the building and community levels; Benjamin Welle, the director of Energy Lab at Pekins and Will, for advising on the building modeling methods.
Conflicts of Interest
The authors declare no conflict of interest.
Nomenclature
| ACH50 | air changes per hour at 50 Pascals pressure |
| AIA | American Institute of Architects |
| BA | Building America |
| CHP | combined heat and power plant |
| CFIS | central fan integrated supply |
| CFL | compact fluorescent lamp |
| COP | coefficient of performance |
| DGS | Department of General Services |
| DOE | Department of Energy |
| EEMs | energy efficiency measures |
| EER | energy efficiency ratio |
| EF | energy factor |
| EIA | Energy Information Administration |
| EPA | Environmental Protection Agency |
| EPBD | European Performance of Buildings Directive |
| ERV | energy recovery ventilator |
| EU | European Union |
| GHG | greenhouse gas |
| GSHP | ground source heat pump |
| HRV | heat recovery ventilator |
| HVAC | heating, ventilation, and air conditioning |
| IEA | International Energy Agency |
| IECC | International Energy Code Council |
| IESNA | Illumination Engineering Society of North America |
| ILFI | International Living Future Institute |
| IPCC | Intergovernmental Panel on Climate Change |
| LED | light-emitting diode |
| NBI | New Buildings Institute |
| NCTH | new construction test house |
| NREL | National Renewable Energy Laboratory |
| NZ | net zero energy |
| NZB/NZEB/ZNEB/ZEB/NZE/ZE | net zero energy building |
| NZC | net zero energy community |
| NZE2050 | net zero CO2 emissions by 2050 |
| PV | photovoltaic |
| RE | renewable energy |
| REHVA | Federation of European Ventilation and Air-Conditioning Associations |
| SEER | seasonal energy efficiency ratio |
| SHGC | solar heat gain coefficients |
| SIR | savings to investment ratio |
| TMY | typical meterological year |
| UNEP | United Nations Environment Programme |
| USGBC | Green Building Council |
| WMO | World Meterologial Organization |
References
- The Intergovernmental Panel on Climate Change (IPCC). Available online: https://www.ipcc.ch/about/history/ (accessed on 14 March 2021).
- Pischke, E.C.; Solomon, B.D.; Wellstead, A.M. A historical analysis of US climate change policy in the Pan-American context. J. Environ. Stud. Sci. 2018, 8, 225–232. [Google Scholar] [CrossRef]
- United Nations Framework Convention on Climate Change (UNFCCC). Available online: https://unfccc.int/process-and-meetings/the-paris-agreement/the-paris-agreement/key-aspects-of-the-paris-agreement (accessed on 14 March 2021).
- US Environmental Protection Agency (EPA). FACT SHEET: Overview of the Clean Power Plan. Available online: https://archive.epa.gov/epa/cleanpowerplan/fact-sheet-overview-clean-power-plan.html (accessed on 22 December 2021).
- Newburger, E. Biden Pledges to Slash Greenhouse Gas Emissions in Half by 2030. Available online: https://www.cnbc.com/amp/2021/04/22/biden-pledges-to-slash-greenhouse-gas-emissions-in-half-by-2030.html (accessed on 22 April 2021).
- Teske, S. Achieving the Paris Climate Agreement Goals: Global and Regional 100% Renewable Energy Scenarios with Non-Energy GHG Pathways For+ 1.5 C And+ 2 C; Springer Nature: Berlin/Heidelberg, Germany, 2019. [Google Scholar]
- Sun, Y.; Huang, P.; Huang, G. A multi-criteria system design optimization for net zero energy buildings under uncertainties. Energy Build. 2015, 97, 196–204. [Google Scholar] [CrossRef]
- Aelenei, L.; Gonçalves, H. From Solar Building Design to Net Zero Energy Buildings: Performance Insights of an Office Building. Energy Procedia. 2014, 48, 1236–1243. [Google Scholar] [CrossRef] [Green Version]
- Gupta, S.; Smith, J. Research Gap Analysis for Zero-Net Energy Buildings: Final Project Report. Available online: https://ww2.energy.ca.gov/2019publications/CEC-500-2019-031/CEC-500-2019-031.pdf (accessed on 3 February 2021).
- Lucon, O.; Vorsatz, D.; Ahmed, A.Z.; Akbari, H.; Bertoldi, P.; Cabeza, L.; Eyre, N.; Gadgil, A.; Harvey, D.; Jiang, Y.; et al. Mitigation of Climate Change: Contribution of Working Group III to the Fifth Assessment Report of the Intergovernmental Panel on Climate Change; Cambridge University Press: Cambridge, UK; New York, NY, USA, 2014. [Google Scholar]
- International Energy Agency and United Nations Environment Programme (UNEP). Global Status Report towards a Zero-Emission, Efficient and Resilient Buildings and Construction Sector. Available online: http://hdl.handle.net/20.500.11822/27140 (accessed on 2 February 2021).
- International Energy Agency (IEA). Net Zero by 2050: A Roadmap for the Global Energy Sector. Available online: https://iea.blob.core.windows.net/assets/4482cac7-edd6-4c03-b6a2-8e79792d16d9/NetZeroby2050-ARoadmapfortheGlobalEnergySector.pdf (accessed on 30 May 2021).
- Clean Energy States Alliance. 100% Clean Energy Collaborative–Table of 100% Clean Energy States. Available online: https://www.cesa.org/projects/100-clean-energy-collaborative/guide/table-of-100-clean-energy-states/ (accessed on 30 August 2021).
- Moghaddasi, H.; Culp, C.; Vanegas, J.; Ehsani, M. Net Zero Energy Buildings: Variations, Clarifications, and Requirements in Response to the Paris Agreement. Energies 2021, 14, 3760. [Google Scholar] [CrossRef]
- Moghaddasi, H.; Culp, C.; Vanegas, J. Net Zero Energy Communities: Integrated Power System, Building and Transport Sectors. Energies 2021, 14, 7065. [Google Scholar] [CrossRef]
- Wells, L.; Rismanchi, B.; Aye, L. A review of Net Zero Energy Buildings with reflections on the Australian context. Energy Build. 2018, 158, 616–628. [Google Scholar] [CrossRef]
- Wei, W.; Skye, H.M. Residential net-zero energy buildings: Review and perspective. Renew. Sustain. Energy Rev. 2021, 142, 110859. [Google Scholar] [CrossRef]
- Economidou, M.; Todeschi, V.; Bertoldi, P.; D′Agostino, D.; Zangheria, P.; Castellazzia, L. Review of 50 years of EU energy efficiency policies for buildings. Energy Build. 2020, 225, 110322. [Google Scholar] [CrossRef]
- Bertoldi, P.; Economidou, M. EU Member States Energy Efficiency Policies for the Industrial Sector Based on the NEEAPs Analysis. 2018, pp. 117–127. Available online: https://www.eceee.org/library/conference_proceedings/eceee_Industrial_Summer_Study/2018/1-policies-and-programmes-to-drive-transformation/eu-member-states-energy-efficiency-policies-for-the-industrial-sector-based-on-the-neeaps-analysis/ (accessed on 26 May 2022).
- Fournier, E.D.; Cudd, R.; Federico, F.; Pincetl, S. Implications of the timing of residential natural gas use for appliance electrification efforts. Environ. Res. Lett. 2020, 15, 124008. [Google Scholar] [CrossRef]
- Wills, A.D.; Beausoleil-Morrison, I.; Ugursal, V.I. A modelling approach and a case study to answer the question: What does it take to retrofit a community to net-zero energy? J. Build. Eng. 2021, 40, 102296. [Google Scholar] [CrossRef]
- Kelly, N.; Cowie, A.; Flett, G. Assessing the ability of electrified domestic heating in the UK to provide unplanned, short-term responsive demand. Energy Build. 2021, 252, 111430. [Google Scholar] [CrossRef]
- Zhang, X.; Wang, A.; Tian, Z.; Li, Y.; Zhu, S.; Shi, X.; Jin, X.; Zhou, X.; Wei, S. Methodology for developing economically efficient strategies for net zero energy buildings: A case study of a prototype building in the Yangtze River Delta, China. J. Clean. Prod. 2021, 320, 128849. [Google Scholar] [CrossRef]
- Ceglia, F.; Esposito, P.; Marrasso, E.; Sasso, M. From smart energy community to smart energy municipalities: Literature review, agendas and pathways. J. Clean. Prod. 2020, 254, 120118. [Google Scholar] [CrossRef]
- Estrella Guillen, E.; Samuelson, H.W.; Vohringer, C. The impact of cultural assumptions on simulated energy, comfort, and investment returns of design decisions in two desert climates. Build. Simul. 2021, 14, 931–944. [Google Scholar] [CrossRef]
- ASHRAE. About ASHRAE. Available online: https://www.ashrae.org/about (accessed on 16 May 2022).
- Chen, Y.; Hong, T.; Piette, M.A. Automatic generation and simulation of urban building energy models based on city datasets for city-scale building retrofit analysis. Appl. Energy 2017, 205, 323–335. [Google Scholar] [CrossRef] [Green Version]
- Klein, S.J.; Coffey, S. Building a sustainable energy future, one community at a time. Renew. Sustain. Energy Rev. 2016, 60, 867–880. [Google Scholar] [CrossRef] [Green Version]
- Dorotić, H.; Doračić, B.; Dobravec, V.; Pukšec, T.; Goran, K.; Neven, D. Integration of transport and energy sectors in island communities with 100% intermittent renewable energy sources. Renew. Sustain. Energy Rev. 2019, 99, 109–124. [Google Scholar] [CrossRef]
- Kumar, R.R.; Alok, K. Adoption of electric vehicle: A literature review and prospects for sustainability. J. Clean. Prod. 2020, 253, 119911. [Google Scholar] [CrossRef]
- Nygren, S.; Moghaddasi, H.; Culp, C. Serenbe Community. Available online: http://www.zoom.com (accessed on 25 August 2021).
- Tabb, P.J. Biophilic Urbanism: Designing Resilient Communities for the Future; Routledge: Oxfordshire, UK, 2020. [Google Scholar] [CrossRef]
- Moghaddasi, H.; Tabb, P.; Rashed-Ali, H. What it Takes to Become a Net Zero Development: Case Study of Serenbe, Georgia. Prometheus Journal. Chicago, IL (Unit-ed States). Available online: https://www.researchgate.net/publication/344478020 (accessed on 10 December 2020).
- EarthCraft. EarthCraft House. Available online: https://earthcraft.org/programs/earthcraft-house/ (accessed on 24 August 2021).
- Department of Energy (DOE). Building America Zero Energy Ready Home Case Study: Imery Group, Proud Green Home, Serenbe GA. Available online: https://www.energy.gov/eere/buildings/downloads/building-america-zero-energy-ready-home-case-study-imery-group-proud-green (accessed on 22 December 2021).
- Butler, T.; Curtis, O.; Kim, E.; Roberts, S.; Stephenson, R. Serenbe Nest Cottages, National Renewable Energy Lab (NREL). Available online: https://www.nrel.gov/docs/fy13osti/54889.pdf (accessed on 22 December 2021).
- Department of Energy (DOE). Estimating Costs and Efficiency of Storage, Demand, and Heat Pump Water Heaters. Available online: https://www.energy.gov/energysaver/estimating-costs-and-efficiency-storage-demand-and-heat-pump-water-heaters (accessed on 22 December 2021).
- ENERGYSTAR. Water Heater Key Product Criteria. Available online: https://www.energystar.gov/products/water_heaters/residential_water_heaters_key_product_criteria (accessed on 22 December 2021).
- Department of Energy (DOE). Storage Water Heaters. Available online: https://www.energy.gov/energysaver/storage-water-heaters (accessed on 22 December 2021).
- ENERGY STAR. Available online: https://www.energystar.gov/ia/partners/bldrs_lenders_raters/downloads/National_Program_Requirements.pdf (accessed on 22 December 2021).
- Panasonic Corporation. Harbor Smart Battery™. Available online: https://www.solaris-shop.com/content/Panasonic%20Pika%20Specs.pdf (accessed on 30 December 2021).
- Haleh, M.; Charles, C.; (Texas A&M University, College Station, TX, USA); Juliet, C.; (Serenbe’s resident, GA, USA). Personal communications, 2019–2021.
- ENERGY STAR. ENERGY STAR Most Efficient 2021–Geothermal Heat Pumps. Available online: https://www.energystar.gov/products/energy_star_most_efficient_2020/geothermal_heat_pumps (accessed on 23 December 2021).
- Department of Energy (DOE). LED Lighting. Available online: https://www.energy.gov/energysaver/led-lighting (accessed on 29 January 2022).
- International Energy Agency (IEA). Tracking Heat Pumps. Available online: https://www.iea.org/reports/tracking-heat-pumps-2020 (accessed on 23 December 2021).
- Feldman, D.; Brockway, A.M.; Ulrich, E.; Margolis, R. Shared Solar. Current Landscape, Market. Potential, and the Impact of Federal Securities Regulation; National Renewable Energy Lab. (NREL): Denver, CO, USA, 2015. [Google Scholar]
- Das, S.; Wilson, E.; Williams, E. The impact of behavioral and geographic heterogeneity on residential-sector carbon abatement costs. Energy Build. 2020, 231, 110611. [Google Scholar] [CrossRef]
- Melius, J.; Margolis, R.; Ong, S. Estimating Rooftop Suitability For PV: A Review of Methods, Patents, and Validation Techniques; National Renewable Energy Lab. (NREL): Denver, CO, USA, 2013. [Google Scholar]
- Feldman, D.; Ramasamy, V.; Fu, R.; Ramdas, A.; Jal, D.; Robert, M.U.S. Solar Photovoltaic System and Energy Storage Cost Benchmark: Q1 2020; National Renewable Energy Laboratory: Denver, CO, USA, 2021. [Google Scholar]
- Sengupta, M.; Xie, Y.; Lopez, A.; Habte, A.; Galen, M.; James, S. The national solar radiation data base (NSRDB). Renew. Sustain. Energy Rev. 2018, 89, 51–60. [Google Scholar] [CrossRef]
- National Renewable Energy Laboratory (NREL). Solar Resource Data, Tools, and Maps. Available online: https://www.nrel.gov/gis/solar.html. (accessed on 26 May 2022).
- Solar Electric Supply. Q CELLS Q.PEAK DUO L-G5.3 390 390W Solar Panel. Available online: https://www.solarelectricsupply.com/q-peak-duo-l-g5-3-390w-q-cells-solar-panel (accessed on 26 May 2022).
- U.S. Department of Energy (DOE). Cost-Effectiveness of ANSI/ASHRAE/IES Standard 90.1-2019 for Georgia. Available online: https://www.energycodes.gov/sites/default/files/2021-07/Cost-effectiveness_of_ASHRAE_Standard_90-1-2019-Georgia.pdf (accessed on 20 March 2022).
- United States Environmental Protection Agency (EPA). Green Vehicle Guide. Available online: https://www.epa.gov/greenvehicles/greenhouse-gas-emissions-typical-passenger-vehicle#:~:text=typical%20passenger%20vehicle%3F-,A%20typical%20passenger%20vehicle%20emits%20about%204.6%20metric%20tons%20of,8%2C887%20grams%20of%20CO2 (accessed on 26 May 2022).
- Hou, F.; Chen, X.; Chen, X.; Yang, F.; Ma, Z.; Zhang, S.; Liu, C.; Zhao, Y.; Guo, F. Comprehensive analysis method of determining global long-term GHG mitigation potential of passenger battery electric vehicles. J. Clean. Prod. 2021, 289, 125137. [Google Scholar] [CrossRef]

Publisher’s Note: MDPI stays neutral with regard to jurisdictional claims in published maps and institutional affiliations. |
© 2022 by the authors. Licensee MDPI, Basel, Switzerland. This article is an open access article distributed under the terms and conditions of the Creative Commons Attribution (CC BY) license (https://creativecommons.org/licenses/by/4.0/).