Article

Study on Influence of Joint Locations and Hydraulic Coupling Actions on Rock Masses’ Failure Process

1
Key Laboratory of Building Structural Retrofitting and Underground Space Engineering (Shandong Jianzhu University), Ministry of Education, Jinan 250101, China
2
Civil Engineering College, Shandong Jianzhu University, Jinan 250101, China
3
Shandong Provincial Institute of Land Surveying and Mapping, Jinan 250102, China
*
Author to whom correspondence should be addressed.
Energies 2022, 15(11), 4024; https://doi.org/10.3390/en15114024
Submission received: 17 April 2022 / Revised: 20 May 2022 / Accepted: 25 May 2022 / Published: 30 May 2022
(This article belongs to the Special Issue Advances in Energy Infrastructure Construction Technology)

Abstract

:
Distribution of joints and fissures under hydraulic coupling condition is particularly critical to the stability of surrounding rock masses in underground engineering construction. In this paper, DDARF (Discontinuous Deformation Analysis for Rock Failure) and RFPA (Rock Failure Process Analysis) are compared and analyzed firstly based on laboratory tests. Then using preferred software RFPA, the failure process, stress state, acoustic emission characteristics and energy dissipation laws of rock masses with different joint locations are analyzed under the hydraulic coupling condition. Results show that a large tensile stress region is generated on both ends of the original joint with the micro-cracks’ propagation, water pressure in cracks promotes the generation of tensile stress to a certain extent, damage effect angle increases gradually from the rock specimen with the middle joint to that with the marginal joint; the same water pressure has a certain auxiliary effect on the main crack failure when the joint is close to the middle part of the specimen, and has a dominant effect on the local crack failure when the joint is far away from the middle; the maximum water pressure shows the “U” shaped distribution. At low initial water pressure, stresses of specimens with symmetrical joint locations have similar evolution trends, while at high initial water pressure, the water pressure in cracks has significant dissipation and thus the maximum water pressure in the system does not exceed the initial value. The length of the main crack path is positively proportional to the number of acoustic emissions and the energy accumulation capacity, and evolution of the damage variable basically shows a development trend of steady growth-rapid growth-steady growth.

1. Introduction

With the rapid development of underground engineering construction, the complexity of engineering geological environment is increasing, which poses a more difficult challenge to the stability of engineering rock masses [1,2]. Due to the uneven distribution of natural joints and fissures in rock masses, as well as the fissure water, crack propagation of rock masses threatens the stability of project and even brings huge safety risks to the construction [3,4]. Therefore, it is of great significance to study the failure mechanism of rock masses under complex hydraulic coupling conditions and to carry out the study of crack propagation laws of rock masses with different joint locations.
Under the hydraulic coupling action, rock masses bear complex external geological environment, and many uncertain factors will affect rock failure, thus crack propagation would become more complex [5]. Abbass [6] analyzed the crack propagation law of layered sandstone under hydraulic coupling effect from a microscopic point of view, established five visually similar sandstone bodies with different microscopic parameters, and studied the influence of scale parameter’s differences on the macroscopic failure of samples through Brazil splitting test. Yashwanth [7] monitored the acoustic emission laws of sandstone samples under the hydraulic coupling condition, analyzed the frequency of the acoustic emission, and proved that the acoustic emission activities existed discontinuously in the process of rock failure. Chen Z.Q. [8] carried out the hydraulic coupling test of sandstone under different confining pressures, analyzed the acoustic emission characteristics of rock failure by using acoustic emission technology and three-dimensional space positioning system, and obtained the specific evolution process of crack propagation in three-dimensional state. In terms of numerical simulation research, Lian Z.L. [9] and Zhang S.C. [10] used ABAQUS and developed relevant hydraulic coupling subroutine to study the crack propagation mechanism under water pressure, taking into consideration a variety of comprehensive and complex factors such as rock mechanical parameters, water pressure, ground stress and boundary conditions. Li G. [11] applied the finite difference software FLAC3D 3.00 (Fast Lagrangian Analysis of Continua) to conduct numerical analysis on a semicircle arched roadway, and analyzed the evolution laws of stresses and displacements generated by deep soft rock excavation under the influence of fissure water pressure.
For the rock failure process, the study of energy accumulation and dissipation laws can provide good guidance for the early hazard warning and disaster prevention [12,13,14]. Zhao Z.G. [15] used rock acoustic emission technology to conduct uniaxial whole-process loading experiments, and proposed the energy determination index KSN, through which the failure time of rock specimens can be predicted. Jin Y. [16] carried out true triaxial physical hydraulic fracturing experiment on natural shale, extracted the numbers and energies of acoustic emission events to analyze the crack propagation laws. Based on the uniaxial and triaxial tests of yellow sandstone, Liu G. [17] analyzed the mechanical behavior and energy evolution laws in the rock failure process. Compared with laboratory tests, numerical simulation can also monitor the energy accumulation and dissipation laws precisely [18,19]. Hiroyuki S. [20] used the fluid-solid coupling DEM (discrete element method) to conduct a series of simulations on hydraulic fracturing process, and the simulation results were highly consistent with laboratory tests, which verified the feasibility of using numerical software to monitor acoustic emission. Yu J. [21,22] and Lin C. [23] analyzed the crack propagation process of sandstone under triaxial compression based on PFC (particle flow code), obtained the mesoscopic energy change response and studied the energy dissipation and conversion laws.
In this paper, the discontinuous deformation characteristics of rock masses will be studied, the reasonable simulation programs will be compared and determined, the influence of original joint location on rock failure will be analyzed, and the crack propagation laws, water pressure distributions, acoustic emission characteristics and energy dissipation laws will be deeply studied; at the same time, the custom acoustic emission damage constitutive model will be put forward and the damage variable evolution law will be analyzed.

2. Simulation Programs and Comparison Optimization on Rock Failure

Two kinds of software, discontinuous deformation analysis for rock failure (DDARF) and rock failure process analysis (RFPA), both can be good at simulating crack propagation and analyzing the stability in rock masses. One belongs to the discontinuous method, while the other is the continuous method; these two methods are compared in the terms of unit processing, parameters assignment, and cracking simulation as follows, and combined with the experimental study, the optimal algorithm of rock failure simulation under hydraulic coupling condition is determined.

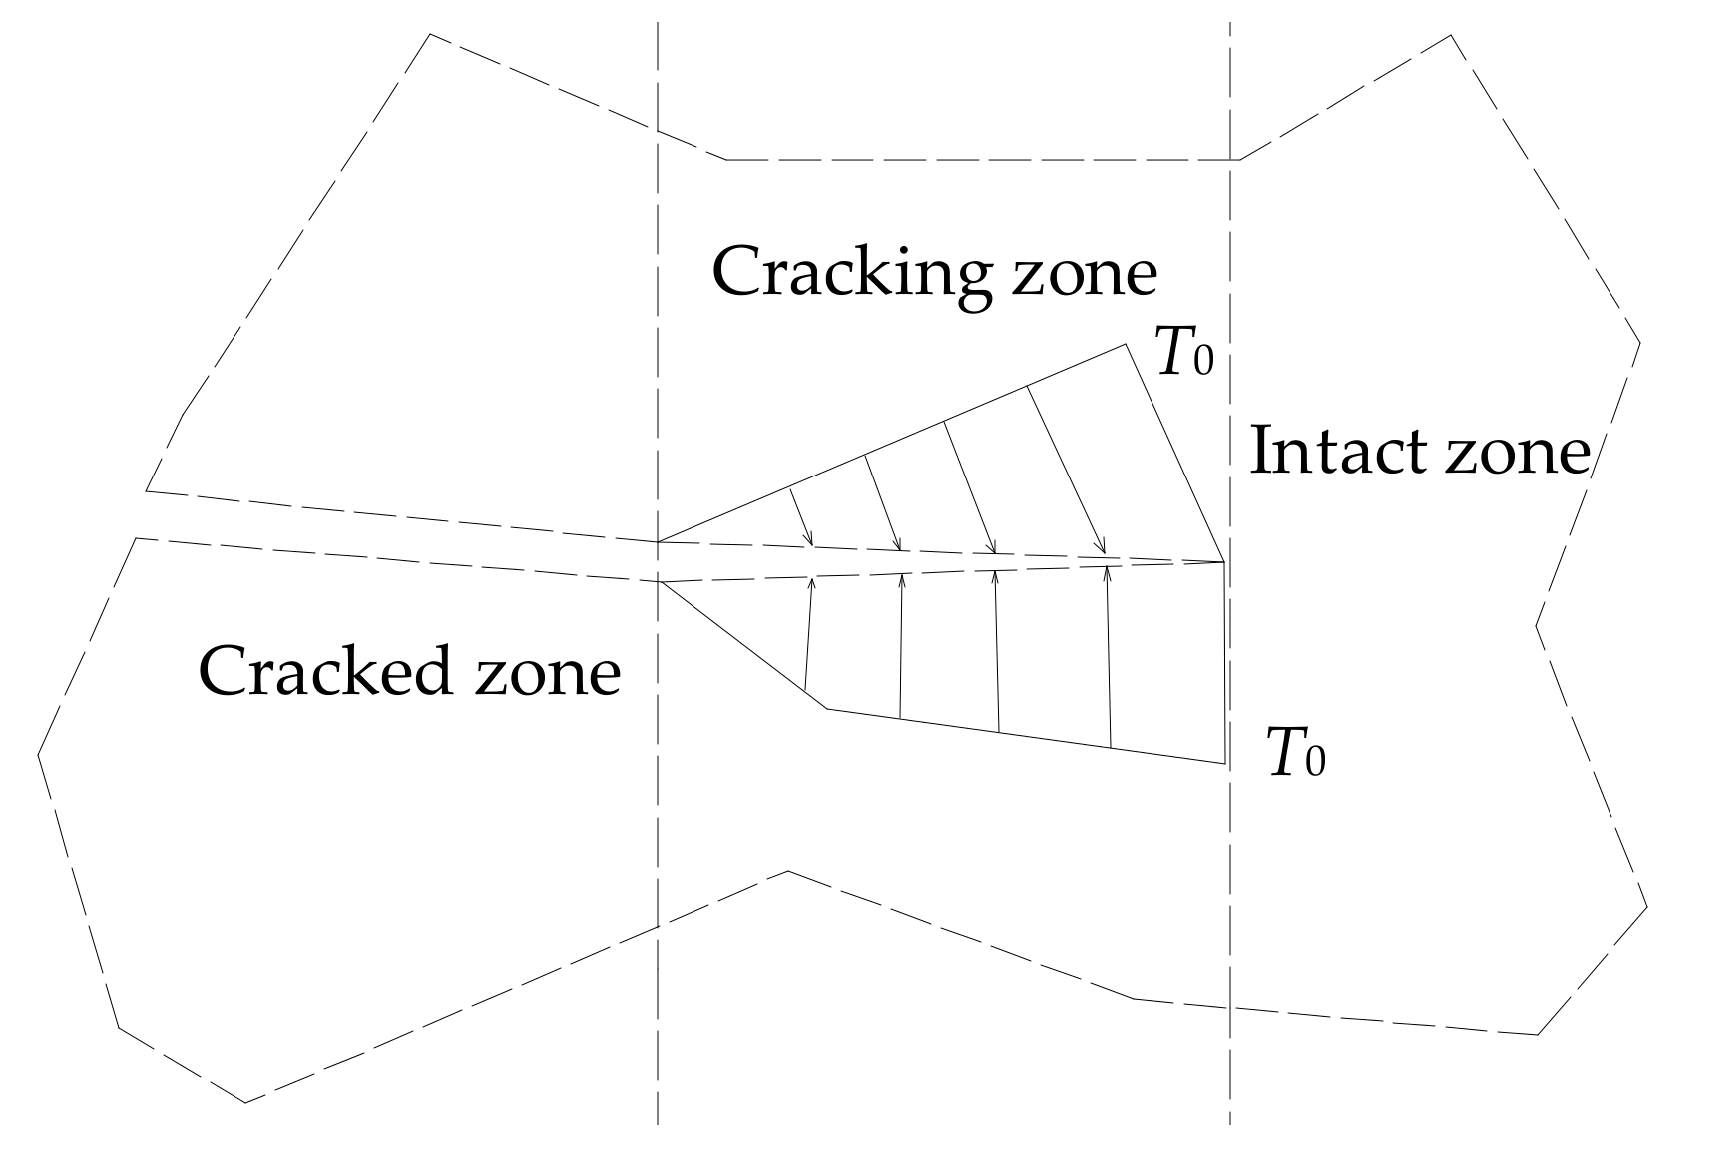
2.1. Implementation of Crack Propagation in DDARF

DDARF has the advantage that neither the finite element method (FEM) nor the discrete element method (DEM) can replace it in studying the stability of jointed rock masses. It not only has strict theoretical basis, but also can calculate the large displacement and deformation of rock masses. DDARF is applicable to analyze any situations of continuous, discontinuous and completely discrete rock masses. It has some proprietary characteristics for simulating crack propagation [24,25]:
(1)
Generation of triangular block system
Based on joints’ probability distribution in underground rock engineering (such as exponential distribution or uniform distribution, etc.), the probability model of the joint network is firstly generated in the DDARF method, then the complex calculation domain is decomposed into the combination of multiple simply connected subdomain, and the triangle grids are generated in each subdomain using the traveling wave method; thereupon, the whole triangular block system can be obtained by integrating these subdomains.
(2)
Weibull distribution of material heterogeneity
In the triangular block system, the non-uniformity of mechanical parameters is realized by Weibull distribution. If the number of triangular blocks is n, the linear congruence method will be firstly used to generate n random numbers, which obey uniform distribution in the interval [0, 1], then the direct sampling method is used to obtain the elastic modulus and Poisson’s ratio, which also obey Weibull distribution, and then are assigned to these triangular blocks.
(3)
Cracking algorithm of virtual joints
In DDARF, the block boundary is virtual joint, and the coherence algorithm is used for judging the strength limit of it. When the cohesion of virtual joint reaches its strength limit, the contact springs between blocks will fail, and tensile failure or shear failure will occur, respectively, judged by the maximum tensile stress criterion and the Mohr–Coulomb criterion, shown in Figure 1 [26]. After failure, the virtual joint will become a true joint, and the mechanical parameters are reduced from virtual joint to true joint accordingly.

2.2. Implementation of Crack Propagation in RFPA

In RFPA, it is believed that mesoscopic heterogeneity is the fundamental cause of macroscopic nonlinear failure of quasi-brittle materials, and statistical damage constitutive relation is used to study the randomness of rock masses’ heterogeneity and defect distribution. RFPA is a rock failure process analysis system which uses the elastic mechanics to analyze stress and strain, the elastic damage theory and the modified Mohr–Coulomb criterion to analyze elements’ deformation and failure. In the process of realizing rock masses’ failure simulation, RFPA has the following characteristics [27,28]:
(1)
Rock is dispersed into a numerical model composed of meso-quadrilateral elements, it is isotropic and elastic-brittle in meso-scale, and the macroscopic failure behavior of rock masses is the collective effect of mechanical behavior of these meso-quadrilateral elements.
(2)
Mechanical parameters of these meso-quadrilateral elements obey Weibull distribution, which is the same as the DDARF method. Thus, the relationship between mesoscopic and macroscopic mechanical properties of rock masses is established.
(3)
Phase change and damage criterion are introduced to analyze the contact between elements fails or not, and the phase transition point is judged by the modified Mohr–Coulomb criterion. On the other hand, elements’ stress and strain is calculated by the finite element method (FEM, which is used as the stress analysis solver). It should be noted that the stress analysis solver is independent with the analysis of phase change. At the same time, in RFPA, it is assumed crack propagation in rock masses is a quasi-static process, and thus the effect of inertia force is ignored.

2.3. Laboratory Test and Numerical Simulation on Crack Propagation of Rock-Like Specimens

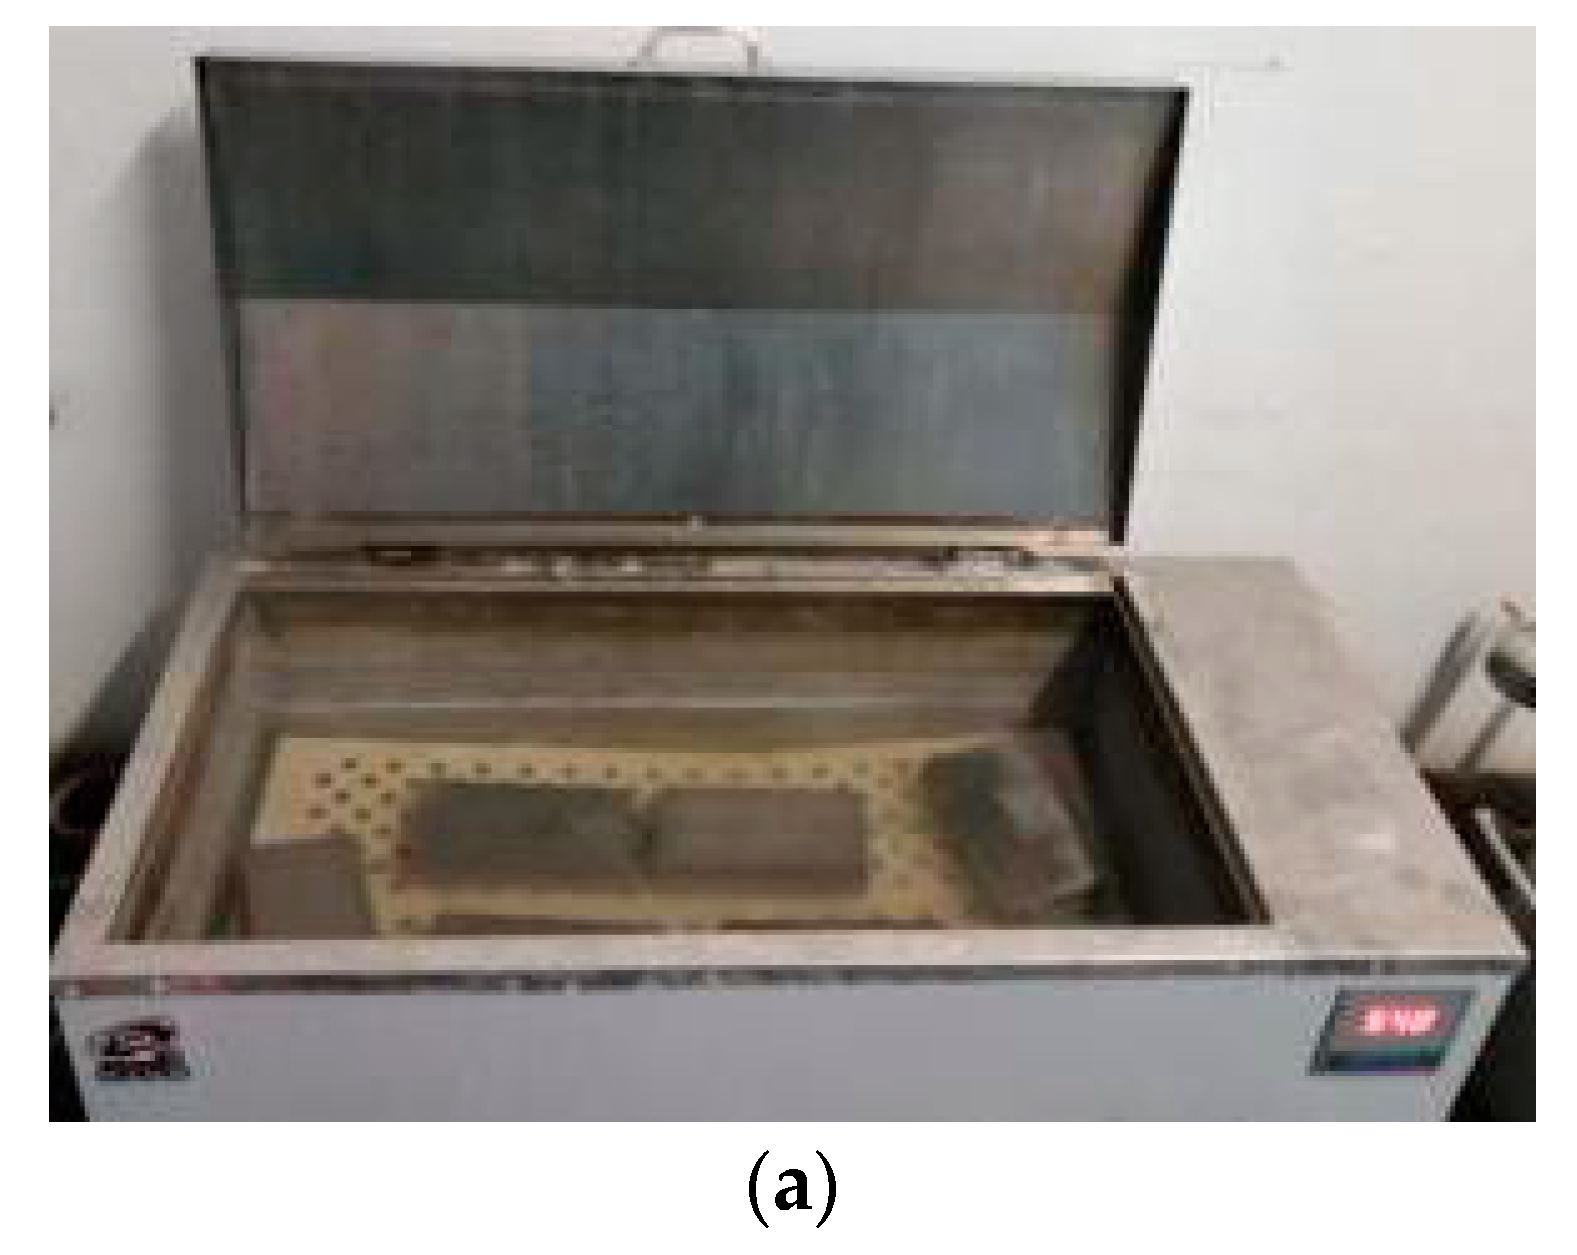
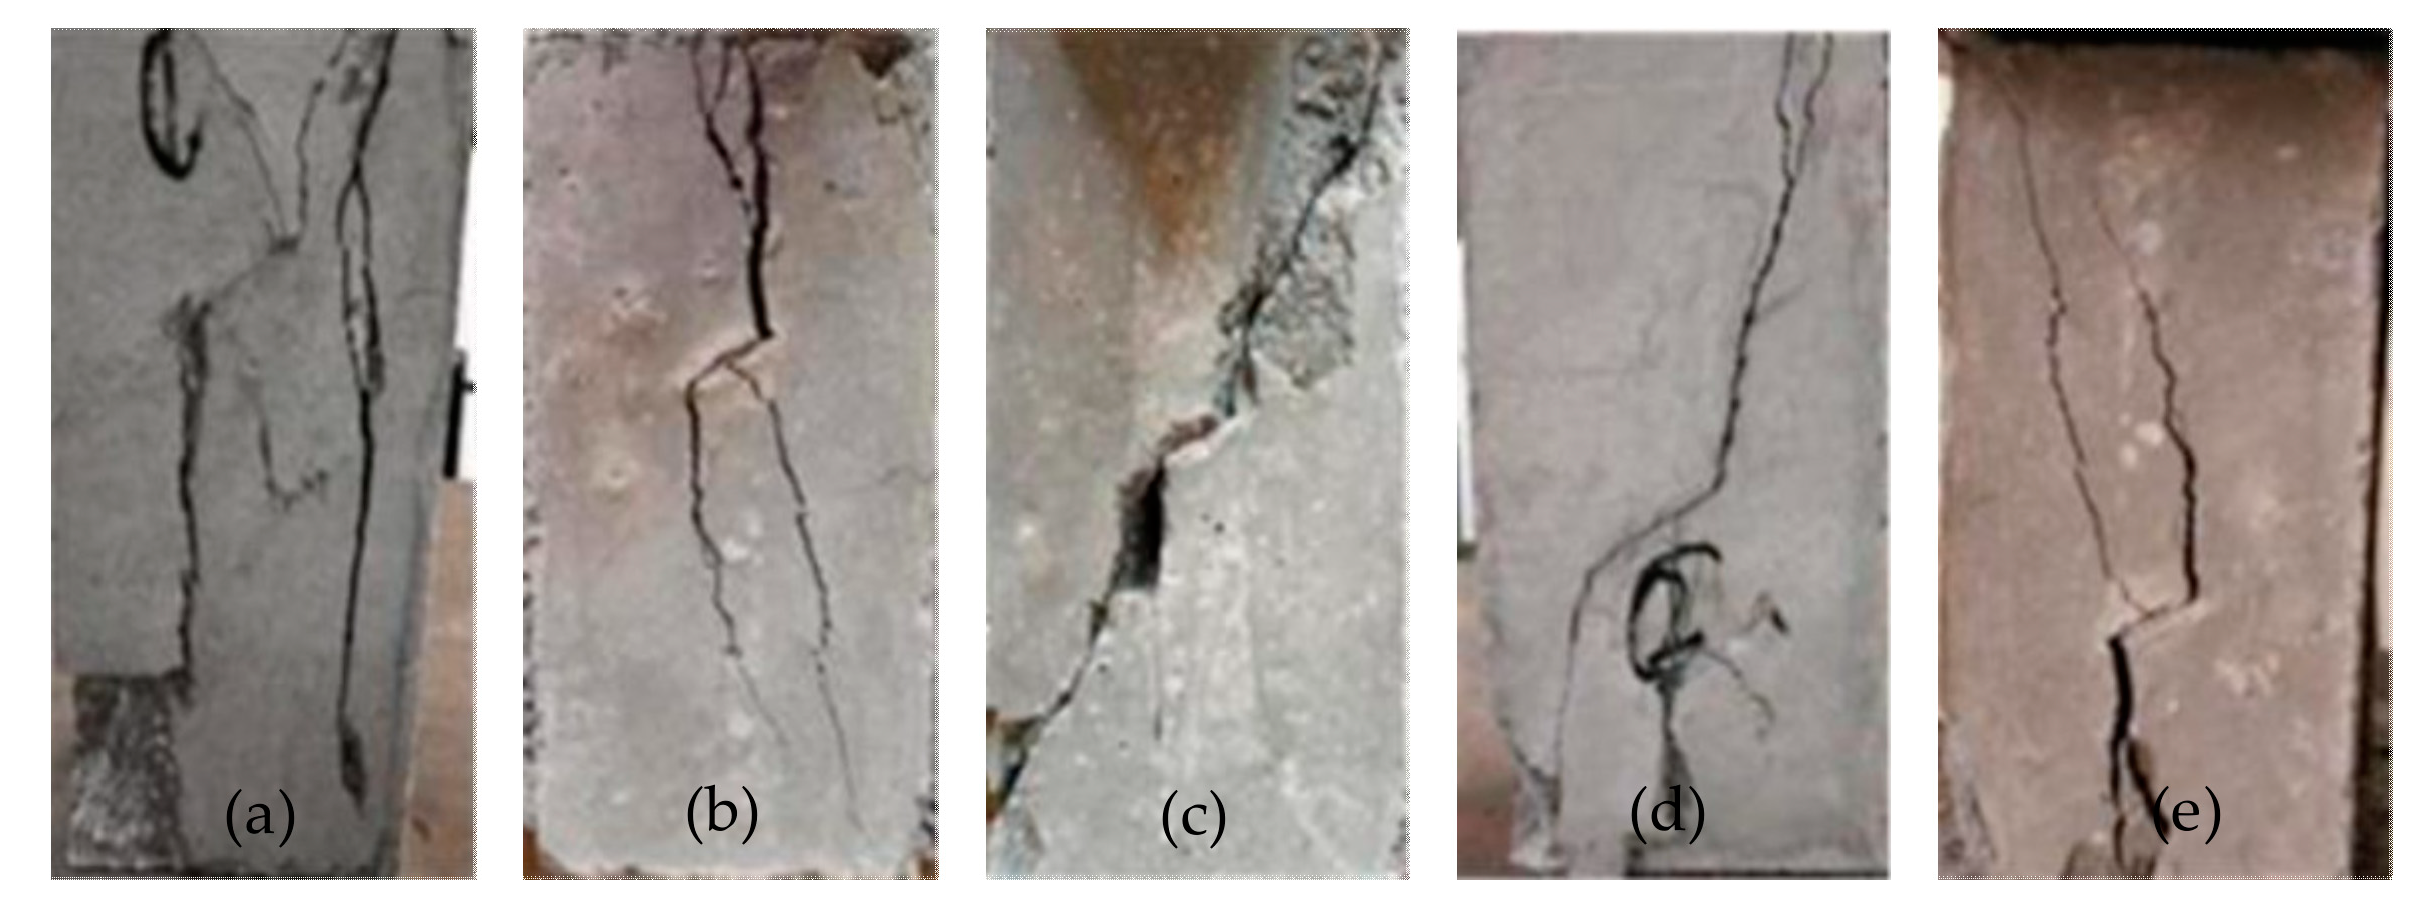
2.3.1. Laboratory Test on Crack Propagation

To study the impact of original joints’ location on rock masses’ crack propagation and damage rule, from the perspective of efficiency and high repeatability, sandstone is taken as the prototype, and the rock-like specimen is made based on the similarity principle [29,30]. Rock-like materials include sand, cement, water reducing agent and water with a quality ratio of 0.97:1.00:0.03:0.30; the solid materials are firstly poured into the stirrer (rated power: 2600 w), fully stirred, and then the water reducing agent is poured, still fully stirred. The role of the water reducing agent is to reduce the amount of water and cement, reduce the setting time of cement mortar and improve the plasticity of cement mortar. Joints are simulated by polyvinyl chloride sheets with a size of 0.5 mm × 15 mm. Rock-like specimens are water-cured for about two weeks, according to the preparation method of concrete members (seen Figure 2a), and then loaded for analysis after 28 days of curing.
The rock-like specimen’s processing device is a multi-functional mold independently developed by our own team, which can make specimens with multiple parallel or cross joints with different angles. Size of the specimen is 140 mm × 70 mm × 45mm [26], it is loaded by the GAW-2000 rigid testing machine, and firstly force control, when the machine and specimen face fully contacted, then converted to displacement control, with the loading rate 0.5 mm/min; the loading machine is shown in Figure 2b. Comprehensive material tests are carried out and the obtained physical and mechanical parameters of rock-like specimens and sandstones are shown in Table 1.
As can be seen from Table 1, the physical and mechanical test parameters of rock-like specimens are all within the variation range of sandstone. Therefore, rock-like specimens can be used to analyze the mechanical properties of sandstone to a certain extent.
In order to study the influence of original joints’ location on rock masses’ crack propagation, all the joints’ inclination angles are set at 30°, because this angle has the most significant influence on rock masses’ crack propagation [26], and joints’ location is divided into five conditions from the top part of the specimen to the bottom part: the spacing of each joint is 20 mm, and the marginal joint is 30 mm away from the end of the specimen. The specific locations of joints are shown in Figure 3, and the crack morphologies of specimens after loading are shown in Figure 4.
From Figure 4, when the original joint is in the top or bottom part of the rock-like specimen (Figure 4a,e), crack will propagate along the tip of the original joint under compressive stress, and the wing cracks are rapidly expanded, the specimen will produce obvious tensile cracks, approximately parallel to direction of the maximum principal stress. When the original joint is in the upper or lower part of the specimen (Figure 4b,d), the wing cracks’ propagation is still significant, secondary cracks are also produced and propagated concomitantly. In this condition, cracks are also mainly tensile cracks; while, when the original joint is in the middle part of the specimen (Figure 4c), there are no secondary cracks produced, and the final failure of the specimen is mainly caused by the wing cracks’ propagation along with the original joint, which belongs to shear failure.

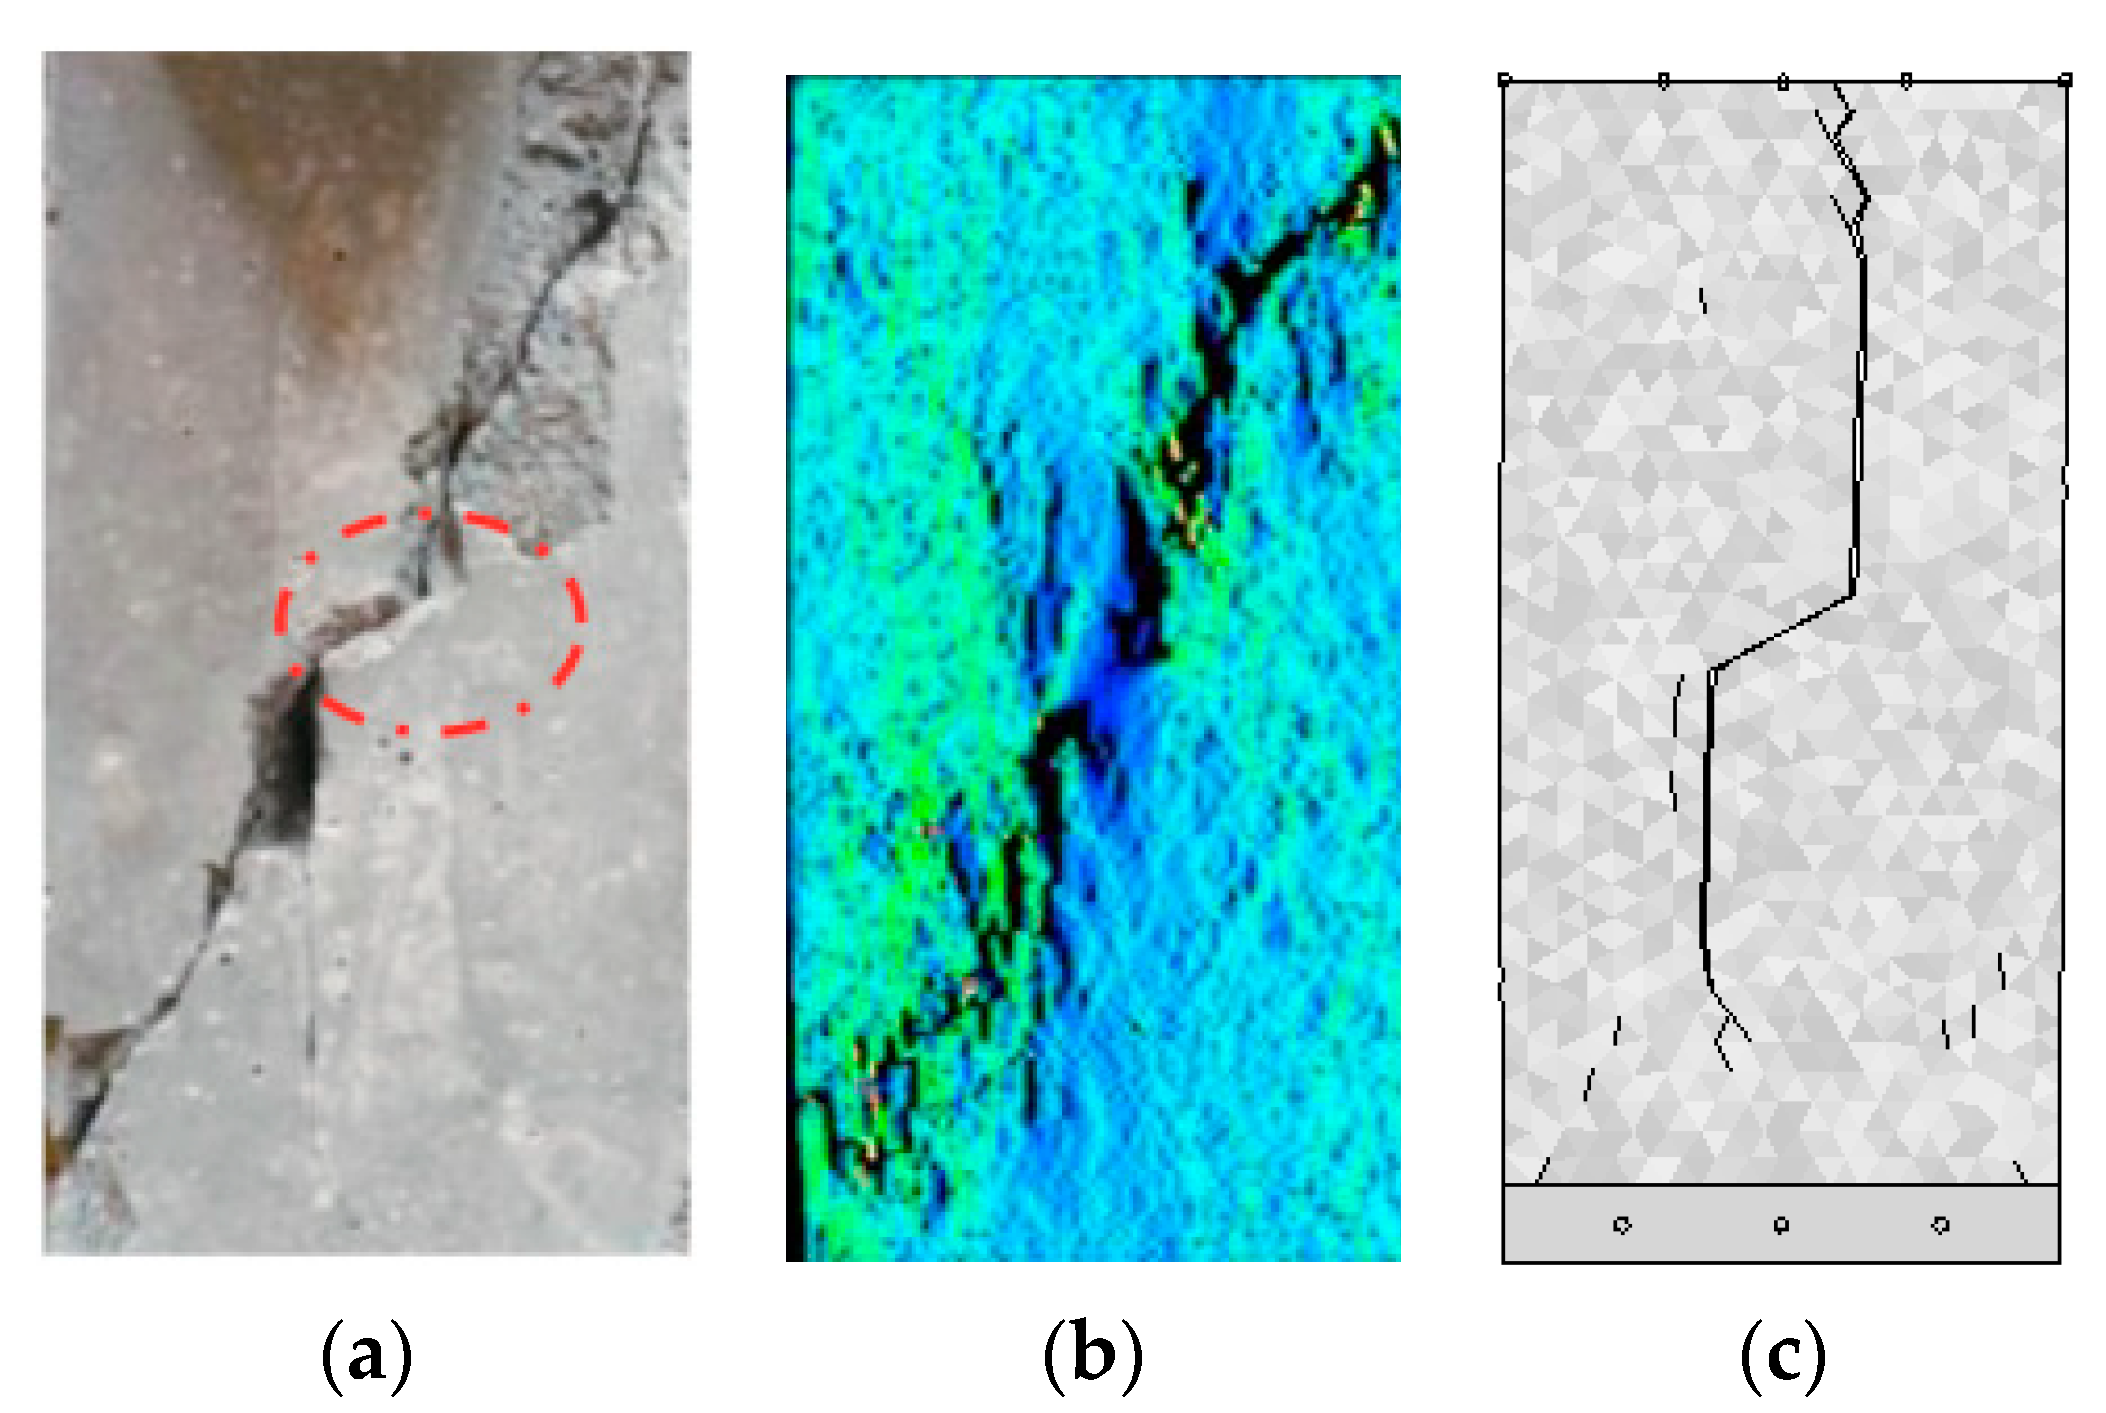
2.3.2. Numerical Simulation and Optimization Analysis on Crack Propagation

In order to compare and optimize the numerical simulation method in analyzing sandstone’s failure process, take the original joint located in the middle of the specimen for an example; DDARF and RFPA are both used to carry out the numerical simulation. The joint angle is still 30° and the specimen size is still 140 mm × 70 mm × 45 mm. The physical and mechanical parameters are adopted in Table 1. Comparison between numerical simulation results and test results is shown in Figure 5.
As can be seen from Figure 5, the laboratory result is in line with lab tests of the reference [32], when the original joint is located in the middle part of the specimen, the crack propagation of the specimen is mainly the wing cracks, and the secondary cracks can be neglected. In the laboratory test and RFPA numerical simulation, the crack propagation gives priority to shear crack. In the DDARF numerical simulation, the direction of crack propagation is basically parallel to the direction of maximum principal stress, and the tensile crack is the main one. Simulation result of RFPA is more in agreement with the laboratory test in terms of crack propagation morphology and its mechanical properties. Accordingly, in view of the superiority of RFPA in analyzing rock masses’ crack propagation, influences of joints’ location on rock failure and energy dissipation under hydraulic coupling conditions will be carried out based on RFPA in this paper.

3. Study on Rock Failure Process under Hydraulic Coupling Condition

3.1. Rock Failure Process with Different Joint Locations of the Same Water Pressure

The RFPA seepage stress coupling analysis module for rock failure is used to conduct numerical simulation, and a plane strain rectangular model with the size of 70 mm × 140 mm is established. A total of 9800 units are divided, and the mesh size of each unit is 1.0 mm × 1.0 mm. Shear failure of the units is determined by the Mohr-Coulomb criterion. Mechanical parameters of the model are shown in Table 2. The rock failure process is studied by locating the maximum principal stress and acoustic emission. The water pressure and crack propagation laws of rock specimens under the axial pressure and 100 m water head (1MPa water pressure) are analyzed with the original joint angle 30°.
In stress simulation, the red area represents tensile stress and the blue area represents shear stress. Through setting acoustic emission post-processing, the amount of acoustic emission in rock masses’ whole failure process is recorded, and the corresponding maximum principal stress evolution diagram is intercepted to analyze the mesoscopic propagation path of cracks. In the maximum principal stress diagram, the stress state of each region in numerical simulation can be understood in real time; at the same time, the shear and tensile areas are key to accurately simulate the stress of rock masses. Therefore, those marks made to distinguish different stress states are necessary.
According to the principle of controlling variable method, the axial compressive stress is maintained, and the pore water pressure diffusion laws and stress evolution laws in the rock failure process are simulated and analyzed with different joint locations. Calculation results are shown in Figure 6.
As can be seen from Figure 6, water pressure mainly exists in the original joint and dissipates slowly toward the wing crack. When the original joint is in the middle part of the rock specimen, the large water pressure diffusion range is smaller than that of other joint locations. This water pressure mainly spreads uniformly around the original joint and propagated cracks and decreases unit by unit. At the same time, it can be found that the water pressure has a great promotion effect on the crack propagation, and it has a direct relationship with the tensile stress generated in the rock specimen; the decreasing direction of the water pressure gradient is consistent with the direction of the tensile stress. Water pressure is higher in the original joint areas, and the surrounding areas are affected slightly. The closer the original joint is to the end of the specimen, the smaller the water pressure range is, affected by the wing crack propagation, and the water pressure is more likely to diffuse and lead to the failure of the rock specimen earlier.
The maximum water pressure in these jointed rock specimens are shown in Figure 7. When the original joint is located in the middle part of the rock specimen, the maximum water pressure is the lowest; conversely, when the original joint is located at both ends of the rock specimen, the maximum water pressure is the highest, shown as the “U” shaped distribution. The result shows that, when the original joint is located in the middle, the water pressure has a certain auxiliary effect on the rock failure, while when the original joints are far from the center of the rock mass, the water pressure in the rock mass increases, which plays a leading role for the local rock failure.
After crack initiation, expansion and coalescence, rock masses will enter the stage of rapid failure. Figure 8 shows the schematic diagram of crack microscopic evolution and stress evolution of rock masses at this stage.
As can be seen from Figure 8a, the failure of a specimen is mainly caused by the continuous propagation of wing cracks and secondary cracks. Under the action of axial compression, the new cracks generated meet with each other and penetrate to the end of the specimen, resulting in the instability and complete failure of rock masses. In order to further study the failure laws of rock specimen, the angle between the failure range of the rock specimen is defined as the failure effect angle α, which mainly reflects the influence of the failure range when they are completely destroyed. Figure 8b shows that, when the original joint is in the middle, angle α is the smallest, and approximately parallel to the axial stress direction, the closer the original joint is to the middle, the greater the stress is. In addition, it can be seen that the compressive stress areas produced by the middle joint are significantly larger than those of other locations’ joints. The stress concentration phenomenon is mainly related to the location of cracks and accumulations of stress energy. At the same time, because the water pressure in cracks has a certain role in promoting the wring cracks’ propagation, there are numbers of all kinds of tensile stress clouds around the main crack surface, thus making it that all the specimens’ failures give priority to tensile damage finally.

3.2. Rock Failure Process with Different Joint Locations and Different Water Pressure

Simulations with different initial water pressures and different joint locations are done to study the influence on rock strength, results are shown in Figure 9.
As can be seen from Figure 9a, the peak strength of specimens with different joint locations are all inversely proportional to the initial water pressure. In the lower initial water pressure range from 0.0 MPa to 1.5 MPa, rock specimens with the symmetrical joint locations have a highly coincidence relationship, and the peak strength of rock specimens with top or bottom joint location is greater than that of other joint locations. When the initial water pressure exceeds 1.5 MPa, the peak strength of the rock specimen with top joint location is gradually smaller than that of other locations, and the peak strength decreases greatly. The peak strength intensity of specimens with upper or lower joint location is small, and changes of these two with the initial water pressure are similar. However, the peak strength drop of the specimen with top joint location increases, and the threshold phenomenon of the relative region appears. This also indicates that under the condition of relatively high initial water pressure, the damage effect of the water pressure on the rock specimen increases when the joint is far away from the middle of the rock specimen.
As can be seen from Figure 9b, under different initial water pressures, the maximum water pressure of rock specimens with different joint locations is positively correlated with the initial water pressure. The maximum water pressure of rock specimens with top and bottom joint is the largest, and their change trends with different water pressures are highly approximate. However, when the initial water pressure reaches the relatively high value of 2.0 MPa, the biggest water pressure of rock specimens with middle joint location is smaller than its initial water pressure. The reason for this may be that newer microcracks are produced because of the wing cracks’ propagation, which can promote diffusing the water pressure, which indicates that under this higher initial water pressure, the axial pressure damage has the leading role for rock failure, and the influence by water pressure is not the primary factor.

4. Analysis on Energy Dissipation Laws in Rock Failure Process

4.1. Acoustic Emission Energy Analysis

When mechanical behavior occurs in the numerical simulation, the RFPA system itself can monitor and record the stress, strain signal and acoustic emission energy in the process of rock failure, thus we can extract the related data and disposal it. Under the action of hydraulic coupling of jointed rock masses, the whole system follows the first law of thermodynamics (ignoring that the system does not exchange heat with the outside world), that is, the total energy input into the system is all converted into the elastic strain and damage dissipation energy inside the rock masses, and the energy changes at each stage are analyzed through numerical simulation. Take the water head 100 m as the example, the damage acoustic emission energy in the rock failure process is studied; considering the symmetry, two cases of specimens with top and middle joints are taken here to analyze the acoustic emission laws, shown in Figure 10.
Seen from Figure 10, the whole loading process can be divided into four stages, including the compaction stage (OA stage), the microcrack initiation and propagation stage (AB stage), the cracks’ rapid growth stage (BC stage), and the failure stage (CD stage), similar to conference [32]. When the joint locates at the top part of the rock specimen, as shown in Figure 10a, the acoustic emission phenomenon is not produced at stage OA. At the stage AB, a relatively small number of acoustic emission peaks are produced, mainly due to the axial compression and the friction between micro-cracks, and the acoustic emission energy accumulation has a larger boost at this stage. When closer to the failure stage, the acoustic emission number has nonlinear rapid growth, and the cumulative energy can reach 2.83 MJ; cracks propagate rapidly, and when the axial stress reaches 9.03 MPa, the crack propagates to the specimen end and rock fails.
When the joint locates at the middle part of the rock specimen, as shown in Figure 10b, its acoustic emission law is similar with that of Figure 10a. At the OA stage, the amount of acoustic emission is relatively small. The acoustic emission phenomenon is “delayed” because the amount of acoustic emission does not increase significantly during the stage AB, which shows that the rock specimen can store lots of energy and the cumulative energy becomes larger; while with the axial stress increases, the acoustic emission amount is relatively smaller, due to the water pressure diffusing to the new wing cracks. When the specimen enters the failure stage and reaches the peak strength, the amount of acoustic emission increases rapidly and the energy accumulation also presents a nonlinear growth trend; the accumulated energy reaches 7.89 MJ, which is larger than the specimen with top joint.
These two cases show that, at the stage OA, small wing cracks occur at the original joint tip and water pressure also weakens the acoustic emission phenomenon, so the amount of acoustic emission is very small, and the energy accumulation value is almost zero. When entering the stage AB, the amount of acoustic emission gradually increases, and appears as a relatively small peak area. The closer the original joint is to the middle of rock specimen, the more the acoustic emission amount in this stage, which better proves secondary cracks are produced in the middle-jointed specimen at this stage. At the stage BC, affected by the water diffusion, the acoustic emission amount is less, which shows that the wing cracks’ growth is greatly influenced by water pressure; from the perspective of the acoustic emission amount, these two cases at this stage are almost in the quiet period, while the rock specimen with the middle joint is relatively active, which is the result of secondary cracks’ further propagation. Additionally, at the failure stage CD, cracks are connected and fused with each other in these two cases, and the macroscopic crack surface appears, the acoustic emission amounts all show nonlinear growth, the specimens are unstable and destroyed instantly, and the residual strength is small. The acoustic emission energy accumulation is an obvious periodic; energy growth often occurs before the sharp increase of the acoustic emission number, and the closer the original joint location to the middle of the rock specimen, the longer the crack propagation length, and the greater the accumulated energy accordingly, which indicates that the length of the main crack propagation length is proportional to the energy accumulation.

4.2. Damage Evolution Process Analysis

The essence of rock masses’ deformation and failure is the accumulation and release of internal energy. In different deformation stages, the energy release of rock masses has different characteristics. Numerical simulation can be used to monitor AE, and thus the laws of acoustic emission and energy release can be studied. Assuming that the amount of acoustic emission is W0 when the rock specimen completely fails, and the amount of acoustic emission is Wt at the time t before fails, thus the damage variable D′ of rock masses at time t can be defined as:
D′ = Wt/W0
According to the statistics of acoustic emission numbers in the rock failure process, evolution laws of damage variable D′ in rock masses’ damage process are analyzed with the load steps, as shown in Figure 11.
As shown in Figure 11, rock masses’ deformation damage can be divided into four stages: (1) Initial damage stage. At this stage, the specimen is in the compaction stage, and the value of damage variable D′ basically increases from zero to a tiny value. The main reason for this phenomenon is that rock masses are in the energy accumulation and storage stage at this time, undergoing the compaction of original joints and the closure of micro-pores and micro-cracks. (2) Damage stable development stage. Micro-cracks initiate and propagate at this stage, and it begins to propagate at the end of the original joint, accompanied by secondary cracks. The damage variable D’ shows stable growth, and the damage ratio accounts for about 1/5 of the overall damage. The increase of damage value indicates that the rock specimen dissipates energy, but the elastic strain energy accumulation is still the main. (3) Accelerated damage stage. At this stage, the micro-cracks grow rapidly, a large number of longitudinal cracks are generated at the new cracks’ ends, and the amount of acoustic emission also increases exponentially. The damage variable D’ of rock specimens of all conditions increases linearly, and the increased amplitude accounts for about 60% of the whole, while the increased amplitude of middle jointed specimen accounts for about 40%. The energy accumulation of the system basically reaches the peak, and the damage development degree shows a jump unstable growth. This stage is of great significance for engineering disaster warnings. (4) Damage failure stage. With the further expansion and connection of cracks, the large-scale macroscopic crack surface is formed; with the release of the system’s energy, the damage variable D′ shows a gentle growth, but the middle-jointed specimen produces a second jump in growth and finally tends to be stable. When the damage variable D′ reaches 1.0, the rock specimen finally loses its bearing capacity and fails.

5. Conclusions

Based on the laboratory tests, numerical simulations on crack propagation of sandstone are compared by DDARF and RFPA, indicating that RFPA is more suitable for the analysis of sandstone’s failure characteristics under the hydraulic coupling condition. Based on RFPA, the following conclusions are obtained.
(1)
Under the hydraulic coupling action, a large tensile stress region is generated on both ends of the original joint with the micro-cracks’ propagation. Water pressure in the cracks promotes the generation of tensile stress to a certain extent, and the rock specimen is mainly subjected to tensile failure. The further away the original joint from the middle part of the rock specimen, the greater the damage effect angle is; crack paths are all approximately parallel to the maximum principal stress direction at all the different joint locations.
(2)
Under the same initial water pressure, the water pressure has a certain auxiliary effect on the main crack failure when the original joint is close to the middle part of the specimen, and the water pressure has a dominant effect on the local crack failure when the original joint is far away from the middle part. At low initial water pressure, stresses of the specimens with symmetrical joint locations have similar evolution trends, while at high initial water pressure, the jointed specimens’ destruction effect by water pressure is reduced, and the water pressure in cracks has significant dissipation, and thus the maximum water pressure in the system does not exceed the initial value.
(3)
The length of the main crack path is positively proportional to the amount of acoustic emission and the energy accumulation capacity. In addition, for the rock specimens with all joint locations, the amount of acoustic emission and the cumulative energy shows a nonlinear sharp increase in the failure stage. The damage variable D’ can reflect the failure degree of jointed rock masses, and the evolution of damage variable D’ basically shows a development trend of steady growth-rapid growth-steady growth.

Author Contributions

Y.C.: Methodology and writing—original draft. T.G.: Numerical simulation. F.Y.: Writing—review and editing. X.L.: Data curation. J.W.: Conceptualization. All authors have read and agreed to the published version of the manuscript.

Funding

This study was financially supported by the National Natural Science Foundation of China (No. 42172310 and No. 51609130), the Open Foundation of Key Laboratory of Mining Disaster Prevention and Control by Shandong University of Science and Technology (No. MDPC201909), and the Doctoral Foundation of Shandong Jianzhu University (No. XNBS1704).

Data Availability Statement

Not applicable.

Acknowledgments

The authors gratefully acknowledge Shandong Jianzhu University and Shandong Provincial Institute of Land Surveying and Mapping that have contributed to the research results reported within this paper.

Conflicts of Interest

The authors declare no conflict of interest.

References

  1. Havrevoll, O.H.; Vereide, K.; Lia, L. Efficiency of pressurized rock traps for unlined hydropower tunnels. Energies 2021, 14, 4344. [Google Scholar] [CrossRef]
  2. Seto, M.; Nag, D.K.; Vutukuril, V.S. Acoustic emission in coal and sandstone under triaxial compressive stress condition. In Proceedings of the Rockbursts and Seismicity in Mines, Rotterdam, The Netherlands, 31 December 1997; pp. 427–431. [Google Scholar]
  3. Han, J.Y.; Liu, D.; Guan, Y.P.; Chen, Y.; Li, T.; Jia, D.; Yan, F.; Jia, P.; Zhao, Y. Study on shear behavior and damage constitutive model of tendon-grout interface. Constr. Build. Mater. 2022, 320, 126–223. [Google Scholar] [CrossRef]
  4. Hashemnejad, A.; Aghda, S.M.F.; Talkhablou, M. Introducing a new classification of soft rocks based on the main geological and engineering aspects. B Eng. Geol. Environ. 2021, 80, 4235–4254. [Google Scholar] [CrossRef]
  5. Riabokon, E.; Turbakov, M.; Popov, N.; Kozhevnikov, E.; Poplygin, V.; Guzev, M. Study of the influence of nonlinear dynamic loads on elastic modulus of carbonate reservoir rocks. Energies 2021, 14, 8559. [Google Scholar] [CrossRef]
  6. Abbass, T.; Andre, V. Failure of layered sandstone under Brazilian test conditions: Effect of micro-scale parameters on macro-scale behaviour. Rock Mech. Rock Eng. 2010, 43, 641–653. [Google Scholar]
  7. Chitrala, Y.; Moreno, C.; Sondergeld, C.; Rai, C. An experimental investigation into hydraulic fracture propagation under different applied stresses in tight sands using acoustic emissions. J. Petrol. Sci. Eng. 2013, 108, 151–161. [Google Scholar] [CrossRef]
  8. Chen, Z.Q.; Li, T.B.; Chen, G.Q.; Zhang, H. Experimental study of acoustic emission characteristics of sandstone under hydro-mechanical coupling action. Rock Soil Mech. 2014, 35, 2815–2822. [Google Scholar]
  9. Lian, Z.L.; Zhang, J.; Wu, H.A.; Wang, X.X.; Xue, B. A simulation study of hydraulic fracturing propagation with a solid-fluid coupling model. Rock Soil Mech. 2008, 29, 3021–3026. [Google Scholar]
  10. Zhang, S.C.; Biao, F.J.; Liu, H.; Zhang, J. A numerical study of parameter influences on horizontal hydraulic fracture. Eng. Mech. 2011, 28, 228–236. [Google Scholar]
  11. Li, G.; Shen, J.L.; Li, G.H.; Dai, L.P. Numerical simulation for deformation behavior of soft rock roadway under the condition of water-rock interaction. J. Saf. Environ. 2016, 16, 146–150. [Google Scholar]
  12. Kharghani, M.; Goshtasbi, K.; Nikkah, M.; Ahangari, K. Investigation of the Kaiser effect in anisotropic rocks with different angles by acoustic emission method. Appl. Acoust. 2021, 175, 107831. [Google Scholar] [CrossRef]
  13. Charlie, C.L.; Zhao, T.B.; Zhang, Y.B.; Wan, W. A study on the energy sources and the role of the surrounding rock mass in strain burst. Int. J. Rock Mech. Min. Sci. 2022, 154, 105114. [Google Scholar]
  14. Rodrígueza, P.; Celestino, T.B. Application of acoustic emission monitoring and signal analysis to the qualitative and quantitative characterization of the fracturing process in rocks. Eng. Fract. Mech. 2019, 210, 54–69. [Google Scholar] [CrossRef]
  15. Zhao, Z.G.; Song, L.L.; Jia, Z.C.; Gao, C.Z. Study on failure time prediction of rock based on acoustic emission energy judging index. Coal Saf. Environ. 2016, 48, 117–119. [Google Scholar]
  16. Jin, Y.; Fan, M.; Fu, W.N.; Chen, M.; Han, H.F.; Zhou, X. Experimental study on fracture propagation behavior based on acoustic emission characteristics. Chin. J. Rock Mech. Eng. 2018, 37, 3834–3841. [Google Scholar]
  17. Liu, G.; Li, Y.M.; Xiao, F.K. Study on failure mechanics behavior and damage evolution law of yellow sandstone under uniaxial triaxial and pore water action. Chin. J. Rock Mech. Eng. 2019, 38, 3532–3544. [Google Scholar]
  18. Golshani, A.; Thanh, T.C. Energy analysis of hydraulic fracturing. Ksce J. Civ. Eng. 2009, 13, 219–224. [Google Scholar] [CrossRef] [Green Version]
  19. Hajibagherpour, A.R.; Mansouri, H.; Bahaaddini, M. Numerical modeling of the fractured zones around a blasthole. Comput. Geotech. 2020, 123, 103535. [Google Scholar] [CrossRef]
  20. Hiroyuki, S.; Sumihiko, M.; Tsuyoshi, I. The distinct element analysis for hydraulic fracturing in hard rock considering fluid viscosity and particle size distribution. Int. J. Rock Mech. Min. 2011, 48, 712–727. [Google Scholar]
  21. Mu, K.; Yu, J.; Li, H.; Cai, Y.; Chen, X. Acoustic emission of sandstone with hydro-mechanical coupling and PFC-based modelling of energy dissipation. Rock Soil Mech. 2015, 36, 1496–1504. [Google Scholar]
  22. Yu, J.; Li, T.B.; Zheng, C.T.; Cai, Y.Y.; Tu, B.X.; Mu, K. Numerical simulation research on Duncan-Chang model of coastal soft soil. Chin. J. Rock Mech. Eng. 2014, 33, 4271–4281. [Google Scholar]
  23. Lin, C.; Yu, J.; Chen, X.; Cai, Y.Y.; Wen, Z.J. Mesoscopic numerical simulation on crack expansion and energy evolution of sandstone with prefabricated joint under hydro-mechanical coupling condition. J. Huaqiao Univ. (Nat. Sci.) 2018, 39, 538–544. [Google Scholar]
  24. Chen, Y.J.; Li, S.C.; Zhu, W.S.; Yu, S.; Wang, W.; Zhao, C.L. Rock failure and its jointed surrounding rocks: A multi-scale grid meshing method for DDARF. Tunn. Undergr. Space Technol. 2014, 43, 370–376. [Google Scholar]
  25. Li, S.C.; Chen, Y.J.; Zhu, W.S.; Zhao, C.L.; Li, L.P.; Yin, F.Q. New reinforcement algorithms in discontinuous deformation analysis for rock failure. Geomech. Eng. 2016, 11, 787–803. [Google Scholar]
  26. Chen, Y.J.; Zhang, X.; Zhu, W.S.; Wang, W. Modified discontinuous deformation analysis for rock failure: Crack propagation. Geomech. Eng. 2018, 14, 325–336. [Google Scholar]
  27. Ma, K.; Sun, X.Y.; Tang, C.A.; Wang, S.J.; Yuan, F.Z.; Peng, Y.L.; Liu, K. An early warning method for water inrush in Dongjiahe coal mine based on microseismic moment tensor. J. Cent. South Univ. 2020, 27, 3133–3148. [Google Scholar] [CrossRef]
  28. Ma, K.; Tang, C.A.; Xu, N.W.; Liu, F.; Xu, J.W. Failure precursor of surrounding rock mass around cross tunnel in high-steep rock slope. J. Cent. South Univ 2013, 20, 207–217. [Google Scholar] [CrossRef]
  29. Huang, Y.H.; Yang, S.Q.; Liu, X.R. Experimental and numerical study on the mechanical characteristics of rock-like materials. J. Exp. Mech. 2014, 29, 239–249. [Google Scholar]
  30. Chen, Y.J.; Zhu, W.S.; Li, S.C.; Zhao, T.B.; Li, L.P.; Zhang, Q.Q. Similar rock specimen’s creep constitutive test and realization by FLAC3D. Res. J. Appl. Sci. Eng. Technol. 2014, 7, 3015–3021. [Google Scholar] [CrossRef]
  31. Li, Y.; Cai, W.B.; Zhu, W.S.; Dong, Z.; Zhang, Q. Particle flow analysis of parallel double crack evolution under uniaxial compression. J. Cent. South Univ. 2019, 50, 3035–3045. [Google Scholar]
  32. Li, G.; Tang, C.A. A statistical meso-damage mechanical method for modeling trans-scale progressive failure process of rock. Int. J. Rock Mech. Min. 2015, 74, 133–150. [Google Scholar] [CrossRef]
Figure 1. Crack propagation in discontinuous deformation analysis for rock failure (DDARF) [26].
Energies 15 04024 g001
Figure 2. Preparation of rock-like specimen with (a) the Curing box and (b) the GAW-2000 rigid testing machine.
Energies 15 04024 g002aEnergies 15 04024 g002b
Figure 3. Original joint location and the space between joints with (a) top joint, (b) upper joint, (c) middle joint, (d) lower joint and (e) bottom joint.
Energies 15 04024 g003
Figure 4. Crack morphology of rock-like specimens with different joint location with (a) top joint, (b) upper joint, (c) middle joint, (d) lower joint and (e) bottom joint.
Energies 15 04024 g004
Figure 5. Crack propagation comparison between laboratory test and numerical simulations with (a) laboratory test, (b) rock failure process analysis (RFPA) numerical simulation, and (c) DDARF numerical simulation.
Energies 15 04024 g005
Figure 6. Distribution of water pressure and principal stress in crack propagation process with different joint locations with (a) water pressure diffusion during crack propagation, and (b) principal stress distribution during crack propagation.
Energies 15 04024 g006
Figure 7. The maximum water pressure of rock specimen with different joint locations.
Energies 15 04024 g007
Figure 8. Stress and crack morphology evolution laws at failure stage with (a) stress evolution with different joint locations and (b) crack microscopic evolution with different joint locations.
Energies 15 04024 g008
Figure 9. Influence of different initial water pressure and different joint locations on rock specimens with (a) peak strength vs. initial water pressure, and (b) biggest water pressure vs. initial water pressure.
Energies 15 04024 g009
Figure 10. Stress–strain relationship and acoustic emission laws with loading steps with (a) the specimen with top joint, and (b) the specimen with middle joint.
Energies 15 04024 g010
Figure 11. Evolution laws of damage variable D’ with load steps.
Energies 15 04024 g011
Table 1. Comparison of physical and mechanical properties of rock-like specimen and sandstone.
MaterialsCompressive Strength
/MPa
Tensile Strength
/MPa
Elastic Modulus
/GPa
Poisson RatioDensity/(g/cm3)
Rock-like specimen55560.202.25
Sandstone [31]20~1704~253~350.02~0.252.10~2.40
Table 2. Mechanical parameters of rock specimens.
Mechanical ParametersValue
Homogeneous degree/m2
Elastic modulus/GPa3
Poisson ratio0.2
Density/(g/cm3)2.25
Frictional angle/°45
Compressive strength vs tensile strength10
Permeability coefficient /m·d−10.1
Water pressure coefficient0.1
Publisher’s Note: MDPI stays neutral with regard to jurisdictional claims in published maps and institutional affiliations.

