Abstract
Renewable energy sources (RES) are becoming more attractive due to the global demand for the utilization of clean energy and their easy accessibility. The integration of renewable energy technologies into power systems has been made easy, such that RES can be incorporated into small distribution systems or power grids. This integration of RES has negative impacts on power quality, system reliability, and network security. This could affect the RES performance and causes power quality-related problems such as harmonics, voltage flickers, swell, and sag. This paper presents a generation and transmission expansion planning model with the integration of large-scale RES considering harmonic emissions constraints. This method uses a weighted sum approach to combine the multi-objective optimization problems, thereby minimizing the total costs, active power loss, and harmonic power loss. An analytical technique was developed to estimate and quantify the harmonic emissions from the RES components. The proposed AC mixed-integer non-linear optimization problem was solved using algebraic modeling language. The proposed model is demonstrated on non-distorted Garver’s test bus system and 48-bus of Nigeria’s power system. The results obtained from the sensitivity analysis can be used as a decision-making tool to determine the best approach to minimize harmonic emissions from RES integration into the grid.
1. Introduction
In recent years, renewable energy sources have gained more attention for electricity generation, thereby reducing dependence on conventional power sources. Thus, renewable energy sources are good sources of clean power owing to their environmentally friendly nature and energy sustainability, which is important to cater to future energy demand [1,2]. Different emerging technologies for interfacing RES into the power system network have brought a great revolution. Now, the integration of renewable energy technologies into power systems has been made easy, such that RES can be incorporated into small distribution systems or large power grids. The integration of RES into the main grid is also quite challenging, and so many factors have to be considered. The modern power systems with integration of RES have more crucial problems than conventional power systems. Some of these problems include the intermittent nature of RES, randomness and uncertainty penetration of RES into the grid, and power quality-related issues [3]. These power quality problems such as voltage sag, flickers, and harmonics affect the continuity and quality of supply to the consumers. The RES components such as wind turbines, PV modules, and converters are power electronic devices that, based on their mode of operations, contribute harmonics to the grid. With the continuous penetration of RES into the grid, harmonics in the grid become more pronounced. The harmonics contribution to the grid has been a major concern for power system planners, and this can lead to a reduction in voltage quality, a reduction in the lifespan of electrical components, increased power losses, and added ripples to generated power [4,5]. Therefore, it is necessary to monitor harmonic emissions and keep them within the specified standard limits to avoid the poor quality of power supply to the consumers and to enhance power quality management. However, accurate identification and quantification of the harmonic distortions introduced into the power systems are necessary using proper power quality indices. Hence, harmonic estimation has become an important task for power quality management. Ref. [6] presents a harmonic state estimation approach for harmonic computation in an unbalanced distribution system. Ref. [7] presented a phasor measurement unit for estimating harmonics in a distribution system. Ref. [8] presented a meta-heuristic approach for harmonic state estimation in a distribution system with distributed generators. In [9], a method was developed for detecting different harmonic sources in distribution networks.
2. Power Quality Aspects of Renewable Energy Sources
The harmonic distortions may arise from either the utility grid or the non-linear loads from the consumer side, such that the distorted voltage supply by the utility causes ripples to the consumers generated current, and similarly, the harmonic current from the non-linear loads also distorts the voltage quality at the utility supply [10]. In the literature, a considerable number of studies were conducted on the harmonics-related problem with the non-linear consumer loads and utility power sources, as presented in Table 1. From the consumer side, increased use of non-linear loads such as modern electronic circuitry and switching devices frequently affect the quality of the power supply. Ref. [10] proposed a new scheme for harmonic pricing for non-linear load customers. A quantitative index was developed for determining the harmonic metering and penalty prices based on every customer harmonic contribution. Ref. [11] evaluated the harmonic injection from electric charging stations considering both low and high-order harmonics. It is established that electric chargers contribute about 18% harmonic distortion to the system. Ref. [12] presents a method for assessing the harmonic emissions from traction loads in a railway system that is near a low voltage distribution network. The Norton equipment approach was used for customer and utility modeling. In [13], a new harmonic state estimation method was presented for a distribution system. The optimization problems are derived for the harmonics to be analyzed with a view of evaluating day-to-day load profiles and harmonic elements from the non-linear devices. In [14], a clustering algorithm technique was adopted for the probabilistic evaluation of harmonic power flow with uncertainties in a distribution network. The uncertainties associated with the harmonic sources’ location and the magnitudes of the harmonic emissions from non-linear loads in an unbalanced system were considered. Ref. [15] presented a wavelet packet transform to assess the harmonics contribution to system unbalanced three-phase system. This technique provides an adequate difference between harmonic distortion and an unbalanced network. Ref. [16] presented electric vehicles as a harmonic compensator, thereby injecting harmonic current into the grid. The harmonic emissions from electric vehicles served as an ancillary service in the energy market. Ref. [17] estimated the harmonic contributions from PV penetration in an unbalanced distribution system. An optimization technique with the Monte Carlo Simulation approach was used in solving the uncertainties associated with load and PV systems. In [18], a novel analytical technique was developed for solving the harmonic power flow in uncertainties associated with PV and distribution networks. Ref. [19] presented a comprehensive investigation of the efficiency of five bio-inspired intelligent algorithms for eliminating harmonic injection from renewable energy sources on the distribution network. Ref. [20] presented a constrained multiple objectives optimization problem with consideration of harmonic distortions from PV penetration on the distributed generation and filter cost incurred for mitigating the harmonics. In [21], an experimental analysis of harmonic contributions from a real-time microgrid interconnected with a PV system was presented. Different level of PV penetration was considered with the microgrid system, and a management system was set up to reduce the harmonic quantity at a different level. Ref. [22] proposed an algorithm for estimating the quantity of harmonic emission from the electrical load. The harmonic estimation aids the designing of an appropriate filter for mitigating the harmonics.
On the other hand, the utility supply, together with wind and PV generators interfacing with the grid through the inverters, contributes to the harmonic injection into the grid [23]. Ref. [24] investigated harmonic contributions from PV systems into low voltage distribution systems. This model estimates the harmonic distortions, reactive power, and power factor based on the operating mode of the PV inverters. In [25], a biogeography optimization approach was presented to minimize harmonics contribution from DFIG turbines connected to a microgrid system. In the proposed technique, the harmonic orders generated by the microgrid system are opposed by the inverter phase and frequency to reduce the harmonics to a smaller magnitude. In [26], a novel analytical technique was proposed for harmonic load flows in a radial distribution network with PV systems. This approach creates a pattern to deal with harmonic voltage interaction on a PV system. Ref. [27] investigates harmonics injected from a PV system with consideration of the level of penetration of PV and its location. Ref. [28] investigated the effects of deploying PV systems as harmonic compensation for minimizing harmonic emissions from non-linear residential loads. An algorithm was developed to compute the harmonic power flow on an unbalanced three-phase network. In [29], experimental analysis was carried out to assess the harmonic emission from an energy storage system. The developed model investigates the impact of these non-linear loads on the power losses in a radial distribution system. In [21], an overview of harmonics pollution from PV interconnected distribution system was presented. The authors’ findings were further verified by experimental studies of harmonics dominance at a different level of PV penetration in a microgrid system. Ref. [30] investigated the magnitudes and phase behavior of harmonic injected from fast-charging electric vehicles. Ref. [31] investigated the impacts of harmonic distortion from PV systems on the host capacity of a low voltage distribution network. In [32], the authors employed an additional shunt active filter as a means of solving the problem of power quality and power losses attributed to harmonic contributions from wind turbines, battery storage, and power electronic converters from grid-connected systems. The simulated results show a system with reduced harmonics but with an additional cost associated with active shunt filters. Ref. [33] presented a capacitance minimization approach for reducing the quantity of harmonic injecting from offshore wind turbines into the power system. Ref. [34] presented the propagation of harmonic emission within two or more wind turbines and the grid. The value of harmonic contributions from wind turbines and the paths of their propagation was considered.
This paper presents a generation and transmission expansion planning model with the integration of large-scale RES considering harmonic emissions constraints. The optimization model uses a weighted sum approach to combine the economic and power losses objectives considering harmonic emission constraints that can be employed in both generation and transmission expansion planning procedures at different operating modes. The proposed model is demonstrated on non-distorted Garver’s test bus system and 48-bus of Nigeria power system. Therefore, the main contributions of this research are:
- Grid modeling and simulation for identification and quantification of harmonic emissions from RES components on the grid;
- The harmonic power losses are derived as a function of the harmonic component of the resistive elements of the impedance of the transmission line;
- Developing an analytical approach for state estimation of harmonic power and losses on the transmission lines;
- Developing an optimization problem assessing the economic and loss objectives by considering harmonic emission constraints for the safe operation of the system;
- Solving the proposed AC mixed-integer non-linear optimization problem using algebraic modeling language under different operating modes;
- Applying sensitivity indexes to reflect the change in objective values due to operation and harmonic limits.
This paper is arranged into seven sections as follows: Section 1 is the introductory part. Section 2 describes the power quality aspects of renewable energy sources. In Section 3, harmonic emissions modeling of the renewable energy source components is presented. Section 4 presents the mathematical optimization modeling and numerical testing of the case studies. The simulation results are presented in Section 5. Section 6 discusses and analyzes the obtained result, while the conclusions are highlighted in Section 7.

Table 1.
An overview of previous research on power quality.
Table 1.
An overview of previous research on power quality.
| Architecture | Technical Parameter | ||||||||||
|---|---|---|---|---|---|---|---|---|---|---|---|
| Load Location | Components | Methods | Remarks | ||||||||
| Consumer Side | Utility Side | Non-Linear Load | PV | WTG | INV | ESS | Filter | HVDC | |||
| DN + PV [17] | ✓ | X | X | ✓ | X | ✓ | X | X | X | Interior point with MCS | PV and unbalanced load |
| DN + PV [18] | ✓ | X | X | ✓ | X | X | X | X | X | General analytical approach | Non-linear loads |
| DG + RES [20] | ✓ | X | X | ✓ | X | X | X | ✓ | X | Firefly | Filter cost |
| MG + PV [21] | ✓ | X | X | ✓ | X | ✓ | X | X | X | Simulation | PV penetration |
| Electrical load [22] | ✓ | X | ✓ | X | X | X | X | ✓ | X | MABC | Filter design |
| Grid + WECS [32] | X | ✓ | X | X | ✓ | ✓ | ✓ | X | X | Simulation | Power quality improvement |
| Standalone +OFW [33] | X | ✓ | X | X | ✓ | X | X | X | ✓ | Capacitance reduction technique | Offshore wind turbine |
| IEEE test system [27] | X | ✓ | X | ✓ | X | X | X | X | X | Simulation | transient and harmonic stability |
| Grid + WTG [34] | X | ✓ | X | X | ✓ | X | X | X | ✓ | Simulation | harmonic propagation |
| Grid + RES [35] | X | ✓ | X | ✓ | ✓ | X | X | X | X | Fourier analysis | RES replacing a conventional system |
| MG + HRES [36] | X | ✓ | X | ✓ | ✓ | X | X | ✓ | X | Grasshopper algorithm | Filter sizing |
| WECS [37] | X | ✓ | X | X | ✓ | ✓ | X | X | ✓ | Multilayer perception | Fault detection |
| WECS [19] | ✓ | X | X | ✓ | ✓ | X | ✓ | X | X | Bio-inspired algorithm | RES |
| DN + RES [38] | ✓ | X | X | ✓ | ✓ | X | X | X | X | Simulation | Network operation |
| Grid + WTG [39] | X | ✓ | X | X | ✓ | X | X | X | ✓ | Simulation | mathematical modeling |
| Grid + WTG [40] | X | X | ✓ | X | ✓ | ✓ | X | X | X | Simulation | harmonic load flow |
| Electrical load [41] | ✓ | X | X | ✓ | X | X | X | X | X | Exhaustive search | Non-linear loads |
| DN + RES [42] | ✓ | X | X | ✓ | ✓ | X | X | X | X | Simulation | Harmonic estimation |
3. Harmonic Modelling of Wind Turbines, PV, and Converters
The deviation of the voltage and current waveforms from sinusoidal is described in terms of waveform distortion as harmonic distortion. In the case of renewable energy components, the voltage and current distortions are more dominant due to the mode of operation of modern power electronic switches as well as power conversion from DC to AC form. The harmonics contribution to the distribution system from these sources distorts the supply voltage from the power utility and overstress equipment on the distribution network. In this study, the PV, wind turbines, and transmitting mean such as cables and DC lines are modeled as harmonic sources. These models were used in harmonic power flow analysis.
3.1. Aggregation of Harmonic Currents
The harmonic generation of power converters is dependent on their mode of operation and the magnitude of the fundamental current. The transmitting link converter, which comprises pulse width modulation-controlled rectifiers and inverters, based on their mode of operation, uncertainty, and power conversion, generates different harmonics whilst operating with different switching patterns. The harmonic currents amplification can be computed by determining the transfer gain between the converters. The aggregated harmonic is the combination of the harmonic generation from these sources and cannot be added arithmetically but as a vector summation of the harmonic sources at different locations and based on their modes of operation. The harmonic vector summation is determined from the summation law, which is also a function of the individual harmonics from the RES components.
where is the vector sum of the harmonic currents; represents the number of harmonic sources; represents the magnitudes of individual harmonics from PV modules, wind turbines, and converters; is the summation component.
3.2. Modelling of Line Parameters and Computation of Power Flow
The line parameter model is a combination of resistor and reactance. The current and voltage harmonics are magnified by the resonance on the lines. Therefore, the resistance and reactance of the line at harmonic frequency are represented as and respectively. Hence, the impedance given by the transmission line, which is a function of the line resistance and reactance, is given as:
Harmonic power flow is a method for solving and computing the system parameters, and this can be determined based on the set of linear equations.
where is admittance at harmonic order at bus k, represents the current of harmonic order at bus k, and is the voltage of harmonic order at bus k.
The harmonic distortions may arise from either the utility grid or the non-linear loads from the consumer side, such that the distorted voltage supply by the utility causes ripples to the consumers generated current, and similarly, the harmonic current from the non-linear loads also distorts the voltage quality at the utility supply [10]. In the literature, a considerable number of studies were conducted on the harmonics-related problem with the non-linear consumer loads and utility power sources, as presented in Table 1.
4. Optimization Model Formulation and Numerical Test
The harmonic simulation of RES on the grid was computed, and the optimization problem was formulated with the aim to minimize the economic objectives (investment costs and O&M cost) and technical objectives (active power losses and harmonic power losses) whilst ensuring the harmonic distortions is within the permissible limit. The placement of wind turbines and PV modules may result in penetration of harmonic emissions into the grid and increased power losses. Therefore, the harmonics at the buses should be kept at a minimum limit to ensure reliability and quality of power supply to the consumers.
4.1. Objective Function
The proposed optimization problem is determined by minimization of the objective function and is formulated as follows:
where comprises capital costs of transmission lines, PV, and wind turbines; and the operation and maintenance costs of the fossil fuel, PV, and wind turbine generating units. represents the active power losses and harmonic losses on transmission lines; and are the initial capital costs of prospective transmission lines, PV, and wind turbine generating units, respectively. is the binary decision variable indicating whether a new transmission line will be installed or not, and are the maximum rated capacity of PV and wind turbine generators, respectively, is the duration factor of operation and it is given as 8760 h. , , and are the operating and maintenance costs for the fossil fuel, PV, and wind turbine generators, respectively. , , and are active power capacity for the fossil fuel, PV, and wind turbine generators, respectively. and represent the sending and receiving end voltages, respectively, represents the voltage phase angles between the sending and receiving end buses, represents the resistance for transmission line k, and represents the current harmonics of order h on the line k.
4.2. Model Constraints
The above objectives are bounded with the following constraints:
where and represent the real and reactive power capacity of the load demand, respectively, and and represent the real and reactive power loss on the transmission line k, respectively. , , and are reactive power capacity for the fossil fuel, PV, and wind turbine generators, respectively. and represent the real and reactive power loss on the transmission line k, respectively. and represent the real and reactive power flowing into the transmission line k, respectively. and represent the real and reactive power flowing out of the transmission line k, respectively. , and represent the conductance, susceptance and shunt susceptance of transmission line k. and represent the minimum and maximum active power capacity of PV generators. and represent the minimum and maximum reactive power capacity of PV generators. and represent the minimum and maximum active power capacity of wind turbine generators. and represent the minimum and maximum reactive power capacity of wind turbine generators. and represent the minimum and maximum active power capacity of fossil fuel generators. and represent the minimum and maximum reactive power capacity of fossil fuel generators. represents voltage harmonic at order h, presents voltage total harmonic distortion, and represent maximum value for voltage individual and total harmonic distortions, represents harmonic admittance of line k at order h. and represent the minimum and maximum voltage magnitude at bus n.
The objective function given in Equation (4) is a function of overall costs and losses. Equation (5) is the economic objective which comprises the investment costs (adding new transmission lines, adding prospective PV, and adding new wind turbines) and operation and maintenance cost of the existing fossil fuel generating units. The technical objective, which comprises active power losses and harmonic power losses, is shown in Equations (6) and (7). These losses are calculated based on the variation in voltages and the computed individual and total harmonic distortions at each bus. Equations (8) and (9) are the constraints for real and reactive power balance between supply and load demand that must be preserved at each bus. Equations (10) and (11) are the constraints for real and reactive power loss on the transmission, which is the variation in power flow into and out of the transmission lines. Equations (12)–(15) are the real and reactive power flowing into and out of the transmission line, respectively, which are a function of the line parameters and voltage at each bus. In this study, different types of generation technologies are employed, such as fossil fuel, PV, and wind energy systems. Here, the PV and wind systems are considered prospective expansion candidates. Therefore, based on generation mix, Equations (16)–(21) are the real and reactive power generation limits for PV, wind, and fossil fuel generating units, respectively, and these ensure that the capacity of the generating units should be within specified limits. Equations (22) and (23) are the voltage individual and total harmonic distortion constraints at bus n, respectively, and they states that the order of both individual and total harmonic distortions of voltage should not exceed its permissible limit at bus n according to IEEE standard [5] for the safe operation of the system. Equations (24) and (25) are the harmonic load flow constraints on the transmission line and are a function of the harmonic admittance of the line and the voltage at the bus. Equation (26) is the harmonic power loss constraint at bus n, and it is a function of harmonic current, harmonic voltage, and phase angle differences of the sending and receiving bus n. Equation (27) is the bus voltage limit, and it ensures that the bus voltage should be within the specified limits.
4.3. Procedure for Computational Simulations
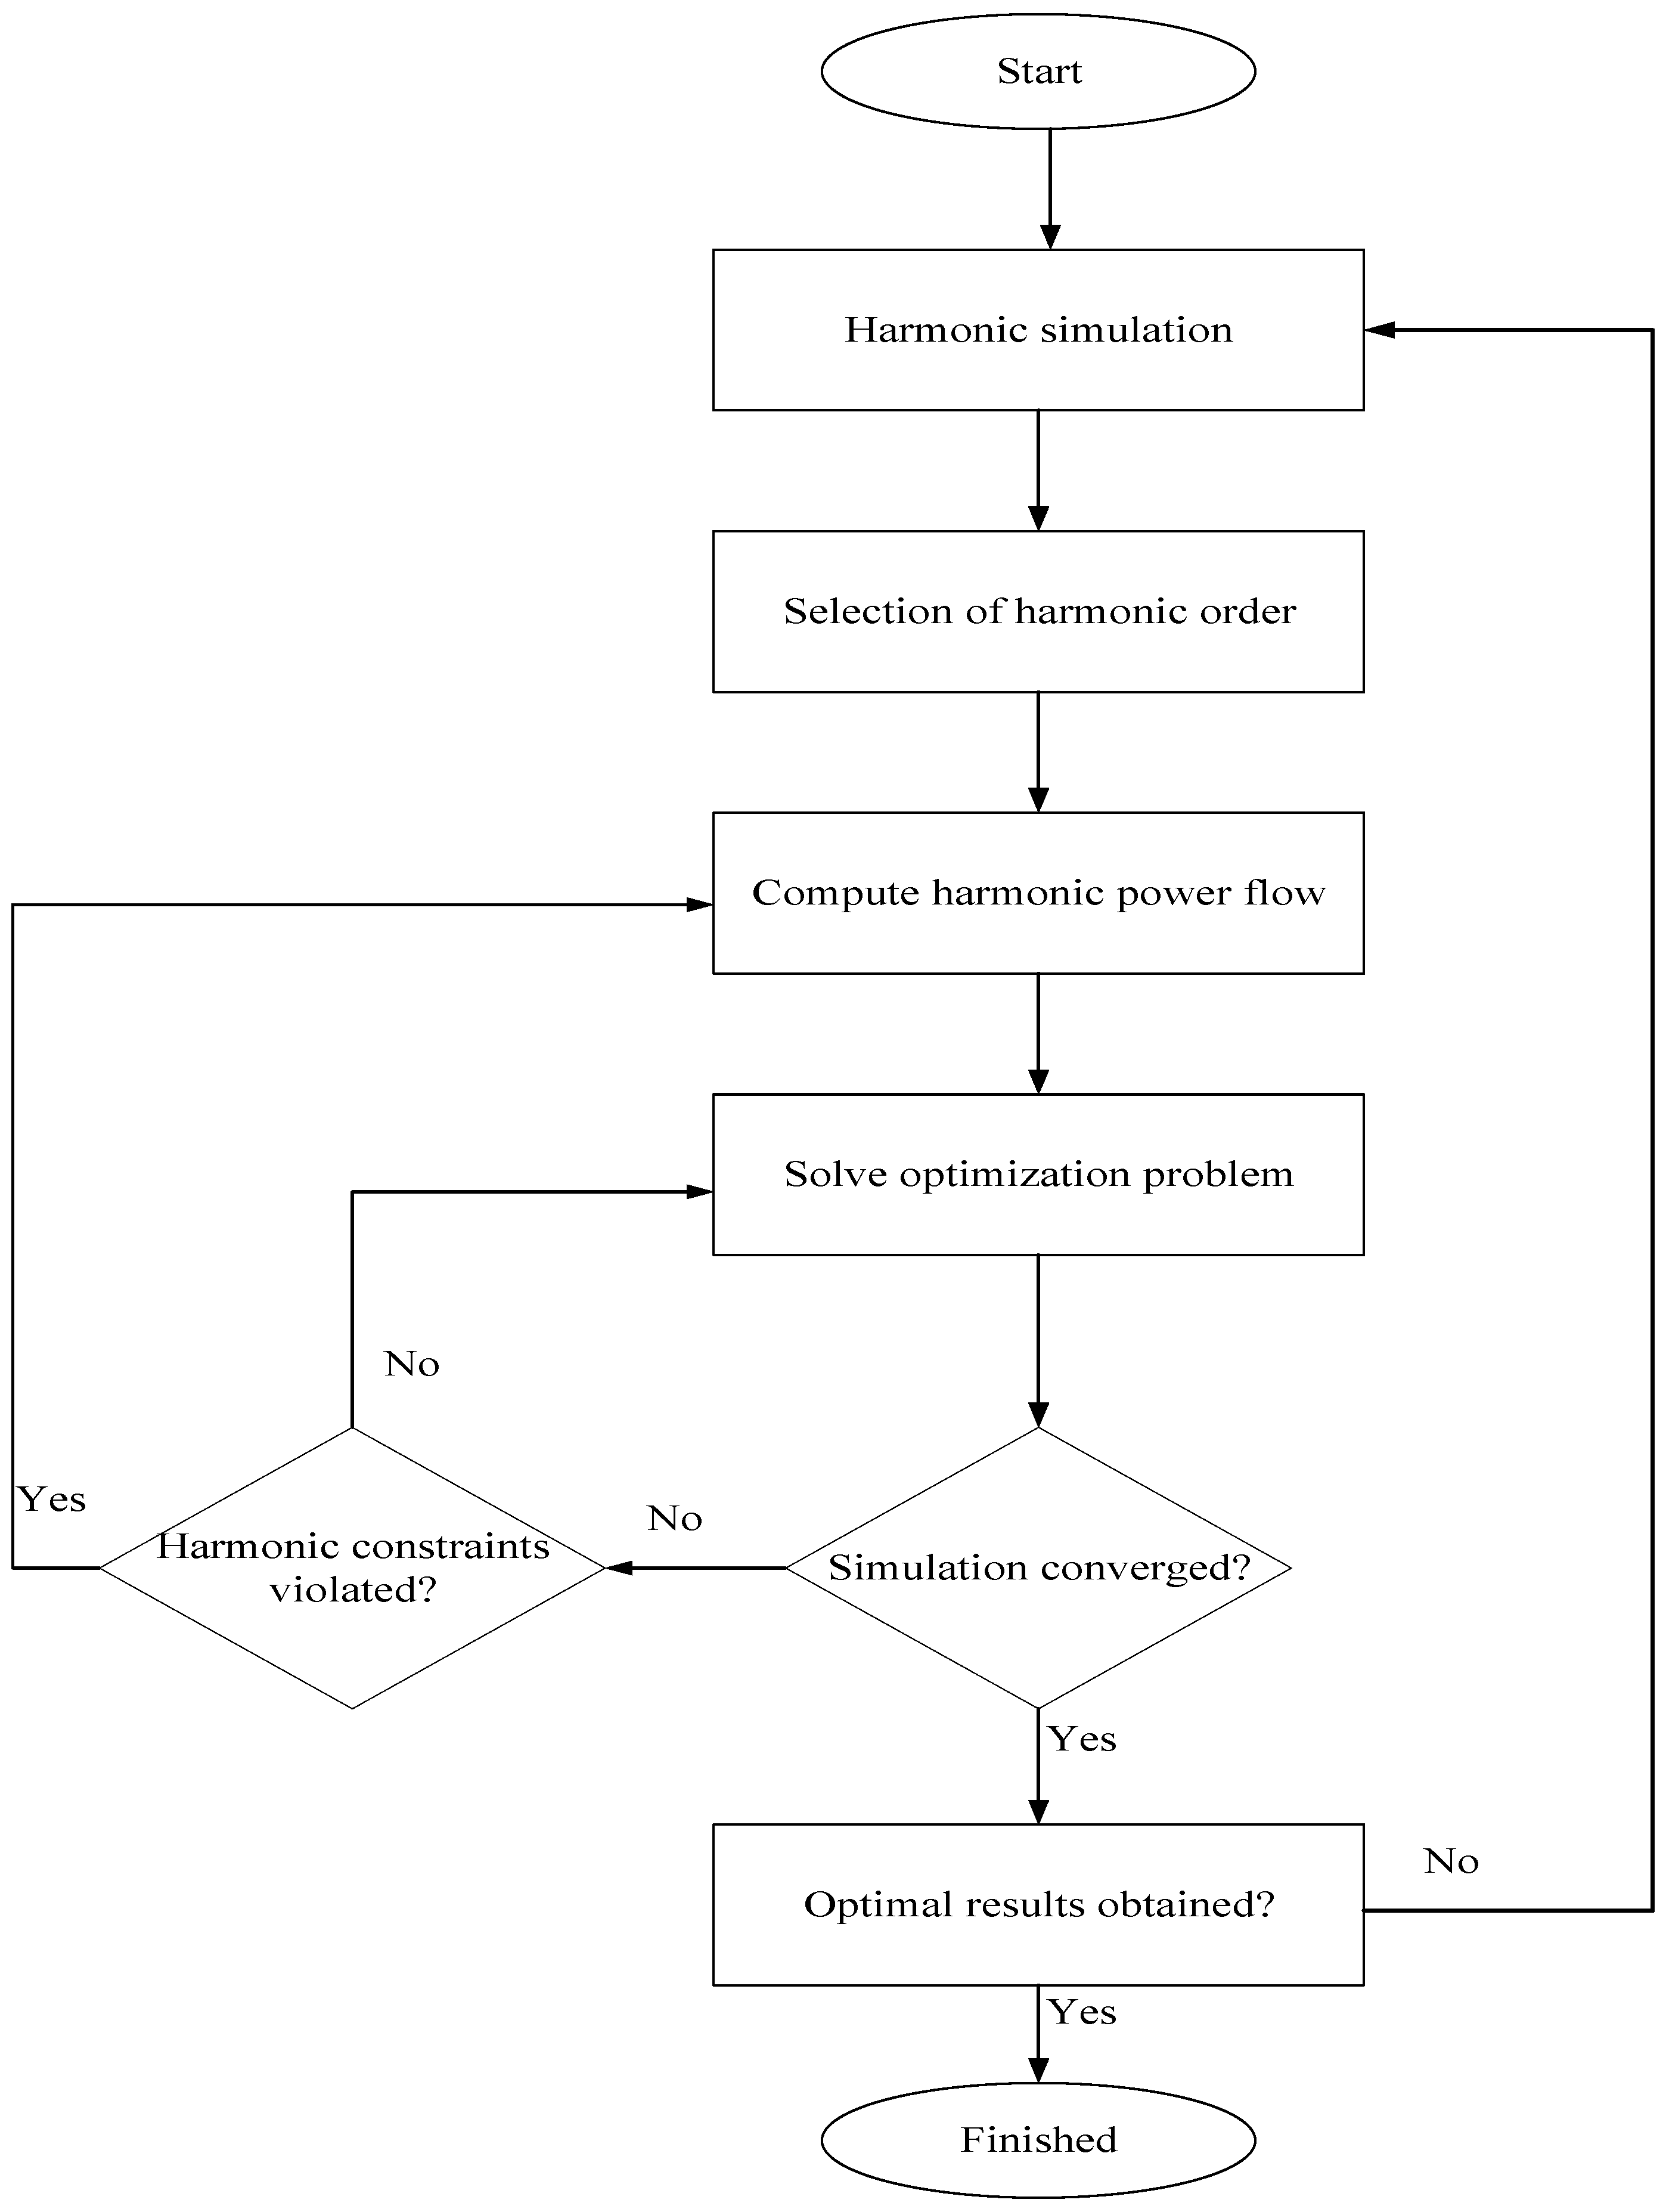
The flowchart for the simulation procedure is presented in Figure 1, and the methodology is divided into different stages, which gives a detailed explanation of the procedure.

Figure 1.
Simulation procedure flowchart.
- Stage 1: The simulation of the grid is run in ETAP software for harmonic estimation;
- Stage 2: Harmonic estimation of a different order of individual and total harmonic distortions as obtained from ETAP;
- Stage 3: Computation of harmonic power flow using Equations (1)–(3);
- Stage 4: Optimization problems are determined by minimizing the objectives as given in Equations (4)–(7), which are bounded by equality and inequality power balance, harmonics, generation, power losses, and voltage limits as presented in Equations (8)–(27);
- Stage 5: Based on the solution received from the optimization solver, the algorithm checks the safe operation of the system by various constraints especially harmonic limit. If the constraints are violated, then the solution proceeds to stage 4 or 6, but if otherwise, then stage 7;
- Stage 6: The process is feedback into stage 3 if the harmonic constraint is among the violated constraints, but if otherwise, it proceeds to stage 4;
- Stage 7: Once the simulation converges and all the constraints are bounded, the optimal solution is checked;
- Stage 8: If the required solutions are obtained, then the flowchart ends. However, if otherwise, then the system goes back to stage 1 for re-evaluation.
5. Simulation Results
In this section, the proposed multi-objective harmonic constrained generation and transmission expansion model is implemented in two case studies: IEEE Garver 6-bus and Nigeria 48-bus test systems. The optimization problems were solved with CPLEX and XA solvers embedded in the algebraic modeling language. Here, we present three scenarios, which are minimum cost, minimum loss, and minimum cost, and loss in each case study to determine the robustness of the proposed model.
5.1. Case 1: IEEE Garver Bus Test
The Garver 6-bus test system consists of three fossil fuel generating units, six transmission lines, and five load points with a total load of 1460 MW. The generating units are located in buses 1, 3, and 6, while the load’s points are in buses 1, 2, 3, 4, and 5. For the expansion problem, eight prospective lines and four new renewable energy sources (wind and PV systems) are incorporated into the grid, and the RES are placed at buses 1, 2, 3, and 4. The data used for the Garver 6-bus system were obtained from [43]. In this study, the PV, wind turbines, and converters are modeled as harmonic sources, thereby injecting harmonic current into the grid at the four buses. The harmonic current flow from RES leads to the harmonic voltage at the buses.
5.2. Case 2: Nigeria 48-Bus Systems
In the second case study, a 48-bus system of Nigeria’s power system network was considered. The 48-bus system consists of twenty-one fossil fuel generating units, eighty-one transmission lines, and thirty-five load points. The characteristics of the 48-bus system of Nigeria’s power system are presented in [44]. In order to achieve adequate expansion planning, a total of sixteen renewable energy sources were incorporated into the six-geopolitical zone of Nigeria based on their solar radiation and wind speed. These renewable energy sources are modeled as harmonic sources on the grid.
6. Discussion of Results
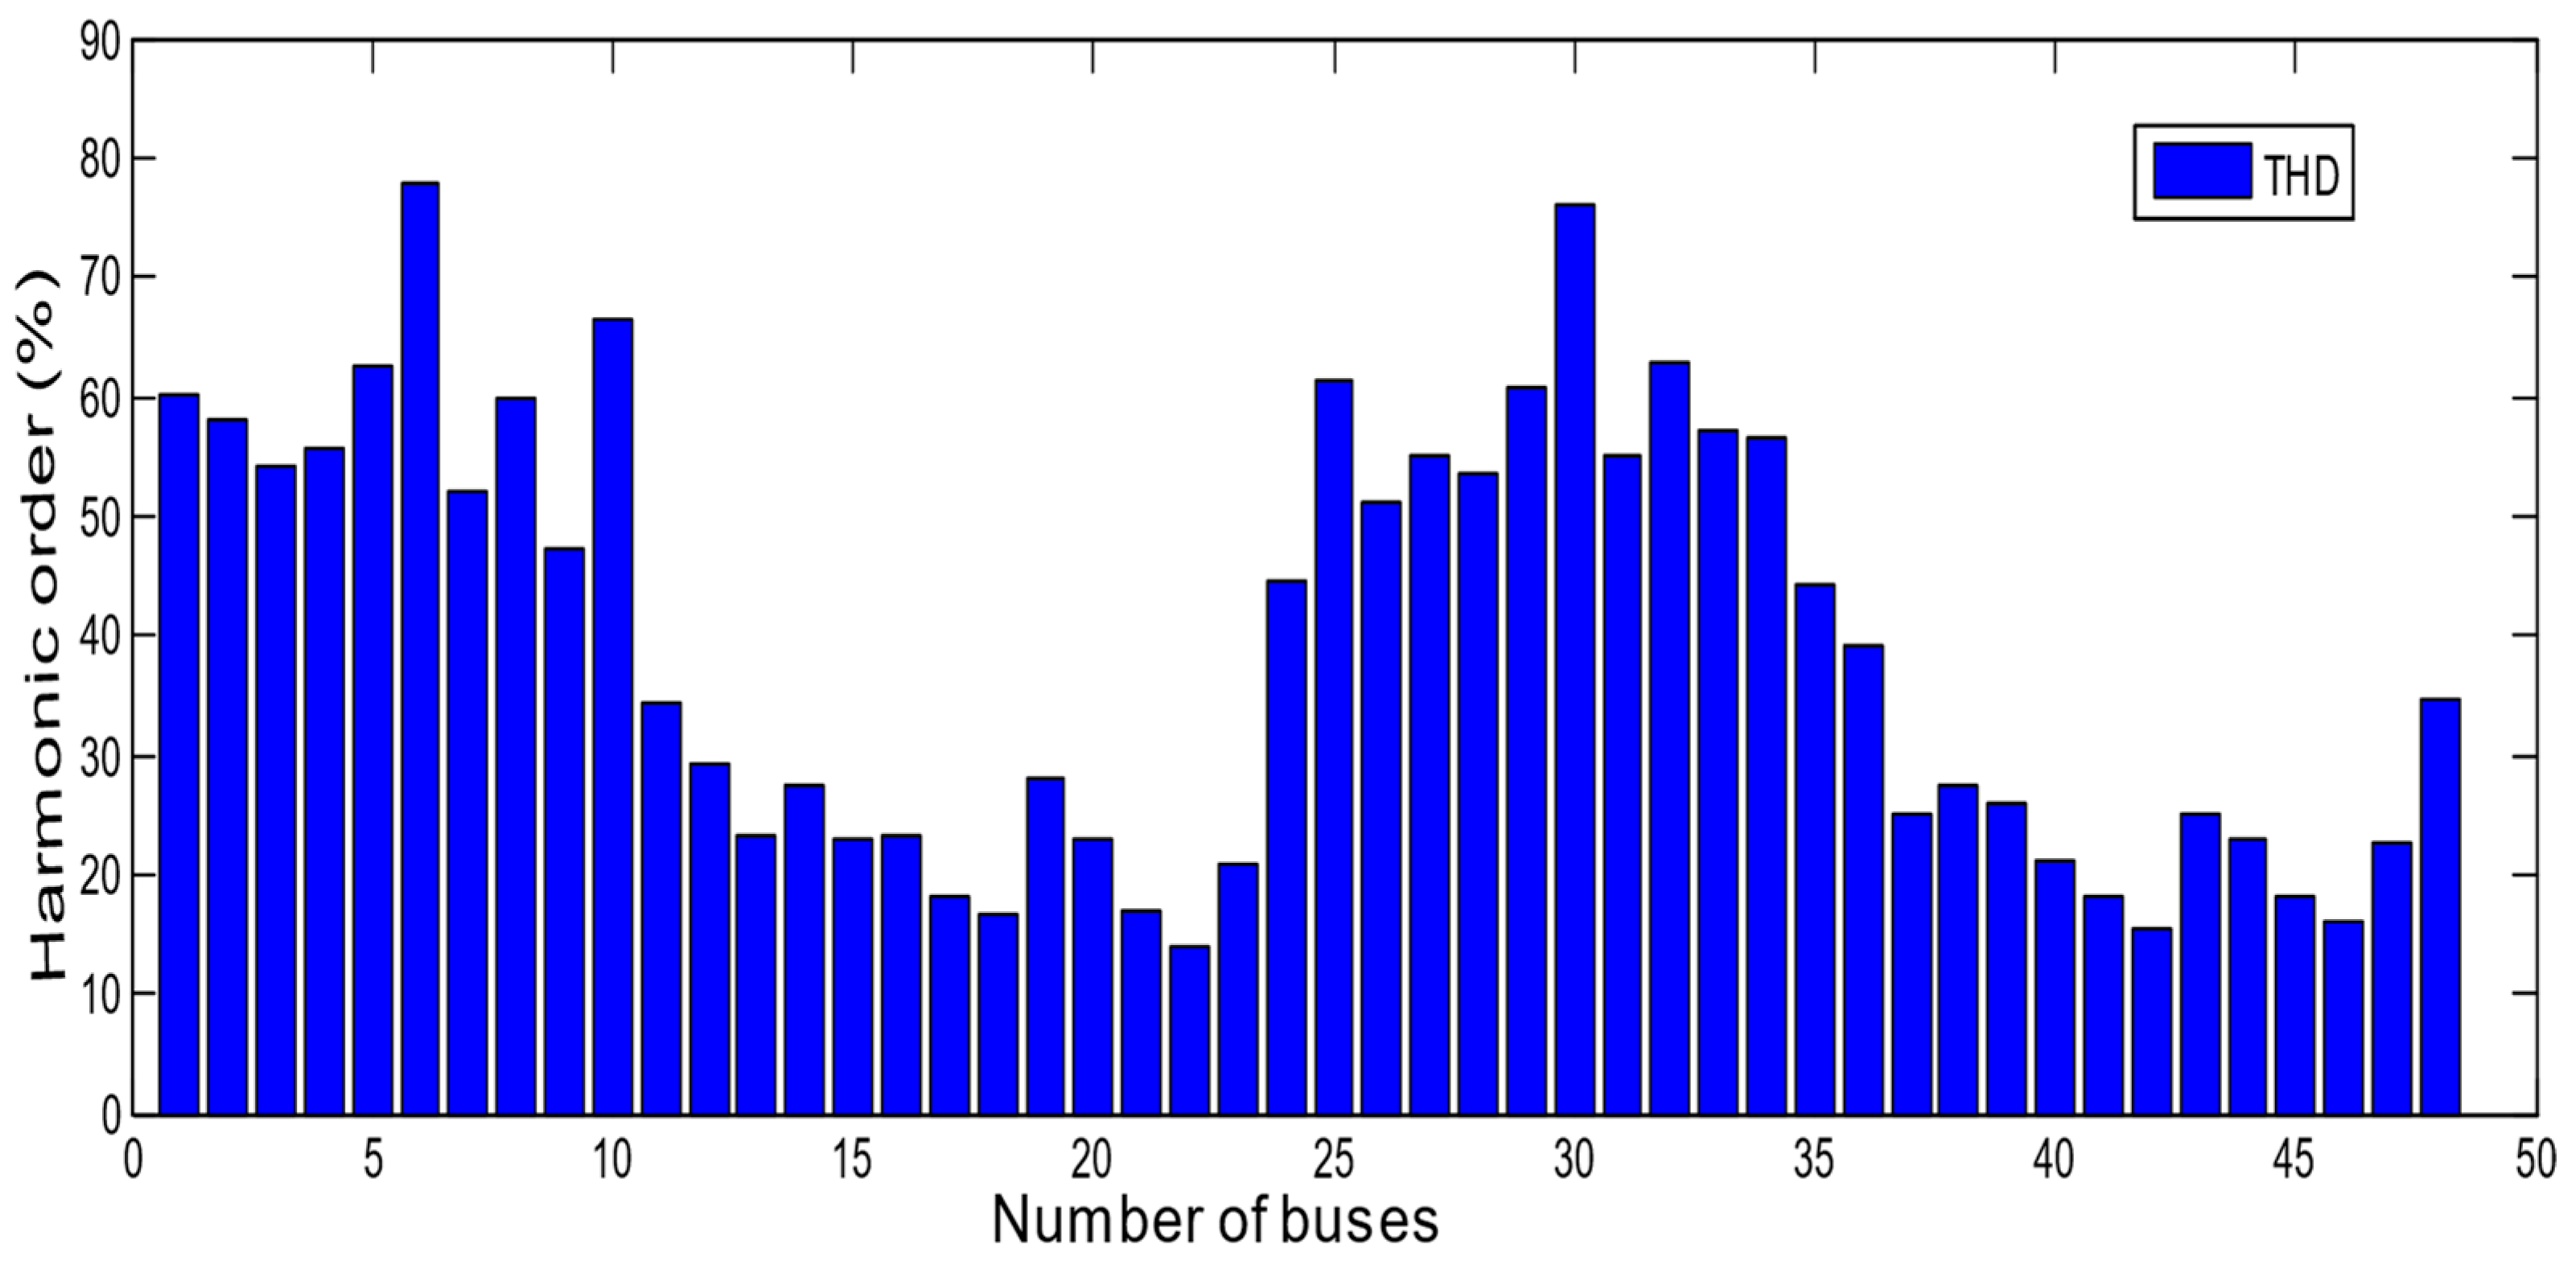
This research work is subdivided into two sections: harmonic simulation and optimization process. The harmonic simulation focuses on harmonic order selection and analyzing influences of different harmonic sources on the grid using ETAP software. The renewable energy sources and other transmitting mediums are modeled as non-linear loads. The total harmonic distortion (THD) on the grid buses for both case studies are presented in Figure 2 and Figure 3, respectively. It is observed that the THD of all buses is violated and much higher than the standard limits before the optimization process. This shows the high level of harmonic contributions from the renewable energy source penetrations on the grid.
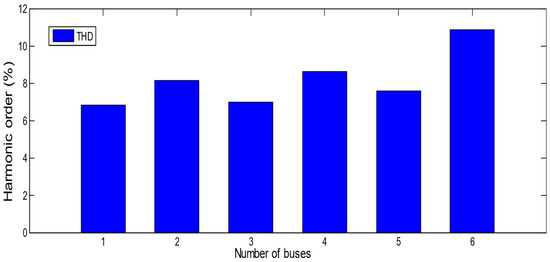
Figure 2.
Total harmonic distortion at various buses on a 6-bus test system.
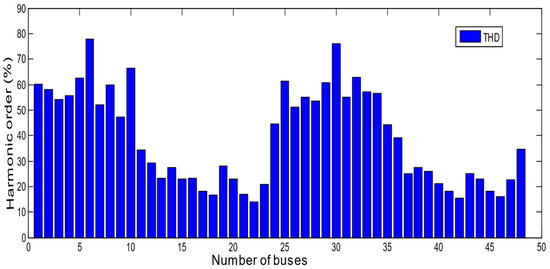
Figure 3.
Total harmonic distortion at various buses on a 48 bus Nigeria power system.
In the optimization process, the proposed model was implemented in two case studies, and each of the case studies considered three scenarios which are economic dispatch, minimum loss dispatch, and a combination of the two dispatches. In the first scenario, the objective function only considers the minimization of investment and O&M costs. The obtained results for economic dispatch are presented in the second columns of Table 2, Table 3, Table 4, Table 5, Table 6, Table 7, Table 8 and Table 9. In the second scenario, we had a technical objective function that considered the minimization of active power losses and harmonic power losses. The obtained results for minimum loss dispatch are presented in the third column of Table 2, Table 3, Table 4, Table 5, Table 6, Table 7, Table 8 and Table 9. The third scenario involves the minimization of economic and technical objective functions. The obtained results for economic and loss dispatches are presented in the fourth column of Table 2, Table 3, Table 4, Table 5, Table 6, Table 7, Table 8 and Table 9. When considering the Garver’s test bus system, as shown in Table 4, a comparison of the three scenarios shows that the total costs for economic dispatch are 1.75 × 10⁸ USD/h, the total costs for minimum loss dispatch are 8.25 × 10² USD/h, and the total costs for minimum economic and loss dispatches are 2.38 × 10⁸ USD/h. The total power produced by fossil fuel generators for the three scenarios is 395.38 MW, 321.61 MW, and 428.62 MW, respectively. The total power produced by wind power generators for the three scenarios is 998.62 MW, 1091.3 MW, and 975 MW, respectively. The total power produced by the PV power generators for the three scenarios is 84.5 MW, 60.46 MW, and 77.43 MW, respectively. The total active power losses and harmonic losses for economic dispatch are 12.48 MWh and 6.02 MWh; for minimum losses, dispatch is 8.25 MWh and 5.12 MWh; and for economic and loss, dispatches are 13 MWh and 8.05 MWh, respectively.
Table 2.
Optimal fossil fuel power considering different objective functions for Garver system.
Table 3.
Optimal wind power considering different objective functions for Garver system.
Table 4.
Optimal solar PV power considering different objective functions for Garver system.
Table 5.
Summary of the costs, generation, and losses for the three scenarios for Garver system.
Table 6.
Optimal fossil fuel power considering different objective functions for Nigeria system.
Table 7.
Optimal wind power considering different objective functions for Nigeria system.
Table 8.
Optimal solar PV power considering different objective functions for Nigeria system.
Table 9.
Summary of the costs, generation, and losses for the three scenarios for Nigeria system.
In the second case study, a larger network of the 48-bus transmission system of Nigeria’s power system was considered. A comparison of the three scenarios was presented in Table 6, Table 7, Table 8 and Table 9 for this case study. Table 6 presents power produced from fossil fuel generators with a total of 1036.38 MW for economic dispatch, 1093.48 MW for minimum losses dispatch, and 1150.12 MW for economic and loss dispatch. In Table 7, power produced from wind power is presented with a total of 2986 MW for economic dispatch, 2895 MW for minimum loss dispatch, and 3005.5 MWh for economic and loss dispatch. Table 8 presents the total power produced by PV power generators for the three scenarios with 645 MW for economic dispatch, 655 MW for minimum losses dispatch, and 735 MW for economic and loss dispatch. Table 9 presents a summary of cost, generation, and power losses on the network. The total active power losses and harmonic losses are 134.62 MWh and 32.76 MWh for economic dispatch, 115.25 MWh and 28.05 MWh for minimum loss dispatch, and 162.40 MWh and 35.84 MWh for economic and loss dispatch. The results obtained from Table 5 and Table 9 clearly show that the economic and loss dispatch scenario have high active power losses and harmonic losses as compared to the other two scenarios. These high active power losses and harmonic losses have significant effects on the power produced from RES when compared to the economic dispatch. Though there is still a significant number of losses after the optimization process, the losses are small when compared to during harmonic simulation. From the results obtained in Table 5 and Table 9, there is an indication that minimum loss has little effect on the objective function, which can be attributed to the fact that this scenario has no investment and O&M costs.
7. Conclusions
This paper focuses on minimizing total costs (investment and O&M costs) and losses (active power loss and harmonic loss) to accommodate the harmonic reduction in the power system. The harmonic penetration through the use of RES has adverse effects on the power quality and reliability of the power system network. Minimizing harmonics is a good approach to reducing harmonic emission contributions from RES on the grid. It is necessary to establish an approach to incorporate the minimization of harmonics as a requirement in power system planning in order to enforce proper power quality management and keep harmonics within specified limits. Therefore, the inclusion of minimum loss dispatch in the generation and transmission expansion planning system will serve as a guide for planning procedure with consideration to harmonic emission limits allowable in the grid. This research developed a framework for including harmonics in generation and transmission expansion planning procedures. A weighted sum approach was used to combine the economic and loss dispatch, thereby minimizing the total costs, active power loss, and harmonic power loss. Sensitivity analyses were carried out based on the three scenarios to determine the optimum costs, total generation from fossil fuel and renewable energy sources, and to minimize the losses. This can serve as a decision-making tool for monitoring harmonics allowable in the grid from renewable energy sources.
Author Contributions
Conceptualization, S.L.G.; methodology, S.L.G.; software, S.L.G.; validation, S.L.G., N.I.N. and P.S.; formal analysis, S.L.G.; investigation, S.L.G.; resources, S.L.G.; data curation, S.L.G.; writing—original draft preparation, S.L.G.; writing—review and editing, S.L.G., N.I.N. and P.S.; visualization, S.L.G.; supervision, N.I.N. and P.S.; project administration, N.I.N. and P.S. All authors have read and agreed to the published version of the manuscript.
Funding
This research received no external funding.
Institutional Review Board Statement
Not applicable.
Informed Consent Statement
Not applicable.
Data Availability Statement
Not applicable.
Conflicts of Interest
The authors declare no conflict of interest.
Abbreviations
| DFIG | Doubly Feed Induction Generator |
| DG | Distributed Generator |
| DN | Distribution Network |
| ESS | Energy Storage System |
| ETAP | Electrical Transient Analyzer Program |
| HRES | Hybrid Renewable Energy Sources |
| HVDC | High Voltage Direct Current |
| IHD | Individual Harmonic Distortion |
| INV | Inverter |
| MABC | Modified Artificial Bee Colony Algorithm |
| MCS | Monte Carlo Simulation |
| MG | Microgrid |
| O&M | Operation and maintenance |
| OFW | Offshore Wind |
| RES | Renewable Energy Sources |
| THD | Total Harmonic Distortion |
| WECS | Wind Energy Conversion System |
References
- Groissböck, M.; Gusmão, A. Impact of renewable resource quality on security of supply with high shares of renewable energies. Appl. Energy 2020, 277, 115567. [Google Scholar] [CrossRef]
- Gbadamosi, S.L.; Nwulu, N. Reliability assessment of composite generation and transmission expansion planning incorporating renewable energy sources. J. Renew. Sustain. Energy 2020, 12, 026301. [Google Scholar] [CrossRef]
- Gbadamosi, S.L.; Nwulu, N.I. A comparative analysis of generation and transmission expansion planning models for power loss minimization. Sustain. Energy Grids Netw. 2021, 26, 100456. [Google Scholar] [CrossRef]
- Elrayyah, A.; Carolina, N. Novel Harmonic and Phase Estimator for Grid- Connected Renewable Energy Systems. In Proceedings of the 2012 IEEE Energy Conversion Congress and Exposition (ECCE), Raleigh, NC, USA, 15–20 September 2012; pp. 4683–4689. [Google Scholar]
- Gbadamosi, S.L.; Melodi, A.O. Harmonic distortion from induction furnace loads in a steel production plant. Int. Inst. Sci. Technol. Educ. 2013, 3, 8–17. [Google Scholar]
- Melo, I.; Pereira, J.L.; Variz, A.M.; Garcia, P.A. Harmonic state estimation for distribution networks using phasor measurement units. Electr. Power Syst. Res. 2017, 147, 133–144. [Google Scholar] [CrossRef]
- Melo, I.D.; Pereira, J.L.R.; Variz, A.M.; Oliveira, B.C. A PMU-based distribution system harmonic state estimation using parallel processing. In Proceedings of the 17th International Conference on Harmonics and Quality of Power (ICHQP), Belo Horizonte, Brazil, 16–19 October 2016; pp. 496–501. [Google Scholar]
- Arefi, A.; Haghifam, M.R.; Fathi, S.H.; Niknam, T.; Olamaei, J. A Novel Algorithm Based on Honey Bee Mating Optimization for Distribution Harmonic State Estimation Including Distributed Generators. In Proceedings of the IEEE Bucharest Power Tech Conference, Bucharest, Romania, 28 June–2 July 2009; pp. 1–7. [Google Scholar] [CrossRef]
- Ujile, A.; Ding, Z. A dynamic approach to identification of multiple harmonic sources in power distribution systems. Int. J. Electr. Power Energy Syst. 2016, 81, 175–183. [Google Scholar] [CrossRef]
- Chen, H.; Ding, T.; Chen, L.; Shi, J. A modified harmonic pricing scheme for customers based on quantifying the harmonic comprehensive contribution. Int. J. Electr. Power Energy Syst. 2021, 130, 106905. [Google Scholar] [CrossRef]
- Basta, B.; Morsi, W. Low and high order harmonic distortion in the presence of fast charging stations. Int. J. Electr. Power Energy Syst. 2021, 126, 106557. [Google Scholar] [CrossRef]
- Vujatovic, D.; Koo, K.L.; Emin, Z. Methodology of calculating harmonic distortion from multiple traction loads. Electr. Power Syst. Res. 2016, 138, 165–171. [Google Scholar] [CrossRef]
- Melo, I.D.; Pereira, J.L.; Ribeiro, P.F.; Variz, A.M.; Oliveira, B.C. Harmonic state estimation for distribution systems based on optimization models considering daily load profiles. Electr. Power Syst. Res. 2019, 170, 303–316. [Google Scholar] [CrossRef]
- Galvani, S.; Rezaeian, S.; Morsali, J.; Ahmadi, M. A new approach for probabilistic harmonic load flow in distribution systems based on data clustering. Electr. Power Syst. Res. 2019, 176, 10597. [Google Scholar] [CrossRef]
- Karafotis, P.A.; Evangelopoulos, V.A.; Georgilakis, P.S. Evaluation of harmonic contribution to unbalance in power systems under non-stationary conditions using wavelet packet transform. Electr. Power Syst. Res. 2019, 178, 106026. [Google Scholar] [CrossRef]
- Feshki, H.; Rabiee, A.; Khalili, M. Plug-in electric vehicles as a harmonic compensator into microgrids. J. Clean. Prod. 2017, 159, 388–396. [Google Scholar]
- Barutcu, I.C.; Karatepe, E.; Boztepe, M. Impact of harmonic limits on PV penetration levels in unbalanced distribution networks considering load and irradiance uncertainty. Int. J. Electr. Power Energy Syst. 2019, 118, 105780. [Google Scholar] [CrossRef]
- Hernandez, J.; Ruiz-Rodriguez, F.; Jurado, F.; Sanchez-Sutil, F. Tracing harmonic distortion and voltage unbalance in secondary radial distribution networks with photovoltaic uncertainties by an iterative multiphase harmonic load flow. Electr. Power Syst. Res. 2020, 185, 106342. [Google Scholar] [CrossRef]
- Memon, M.A.; Mekhilef, S.; Mubin, M.; Aamir, M. Selective harmonic elimination in inverters using bio-inspired intelligent algorithms for renewable energy conversion applications: A review. Renew. Sustain. Energy Rev. 2018, 82, 2235–2253. [Google Scholar] [CrossRef]
- Bajaj, M.; Singh, A.K. Hosting capacity enhancement of renewable-based distributed generation in harmonically polluted distribution systems using passive harmonic filtering. Sustain. Energy Technol. Assess. 2021, 44, 101030. [Google Scholar] [CrossRef]
- Vinayagam, A.; Aziz, A.; Pm, B.; Chandran, J.; Veerasamy, V.; Gargoom, A. Harmonics assessment and mitigation in a photovoltaic integrated network. Sustain. Energy Grids Netw. 2019, 20, 100264. [Google Scholar] [CrossRef]
- Kabalci, Y.; Kockanat, S.; Kabalci, E. A modified ABC algorithm approach for power system harmonic estimation problems. Electr. Power Syst. Res. 2018, 154, 160–173. [Google Scholar] [CrossRef]
- Kumawat, M.; Gupta, N.; Jain, N.; Bansal, R. Optimal planning of distributed energy resources in harmonics polluted distribution system. Swarm Evol. Comput. 2018, 39, 99–113. [Google Scholar] [CrossRef]
- Elkholy, A. Harmonics assessment and mathematical modeling of power quality parameters for low voltage grid connected photovoltaic systems. Sol. Energy 2019, 183, 315–326. [Google Scholar] [CrossRef]
- Sarker, K.; Chatterjee, D.; Goswami, S. An optimized co-ordinated approach for harmonic minimization of Doubly Fed Induction Generator connected micro-grid system. Int. J. Electr. Power Energy Syst. 2015, 64, 58–70. [Google Scholar] [CrossRef]
- Ruiz-Rodriguez, F.; Hernandez, J.; Jurado, F. Iterative harmonic load flow by using the point-estimate method and complex affine arithmetic for radial distribution systems with photovoltaic uncertainties. Int. J. Electr. Power Energy Syst. 2019, 118, 105765. [Google Scholar] [CrossRef]
- Al Talaq, M.; Belhaj, C.A.; Al Talaq, M.; Belhaj, C.A. Optimal PV Penetration for Power Losses Subject to Transient Optimal PV Penetration for Power Losses Subject to Transient Stability and Harmonics Stability and Harmonics. Procedia Comput. Sci. 2020, 175, 508–516. [Google Scholar] [CrossRef]
- Camilo, F.M.; Pires, V.F.; Castro, R.; Almeida, M. The impact of harmonics compensation ancillary services of photovoltaic microgeneration in low voltage distribution networks. Sustain. Cities Soc. 2018, 39, 449–458. [Google Scholar] [CrossRef]
- Kumar, N.; Kumar, A. Experimental assessment of UPS battery load model considering harmonics and its investigation in the distribution systems. Mater. Today Proc. 2018, 5, 709–715. [Google Scholar] [CrossRef]
- Lucas, A.; Bonavitacola, F.; Kotsakis, E.; Fulli, G. Grid harmonic impact of multiple electric vehicle fast charging. Electr. Power Syst. Res. 2015, 127, 13–21. [Google Scholar] [CrossRef]
- de Oliveira, T.E.C.; Carvalho, P.M.S.; Ribeiro, P.F.; Bonatto, B.D. PV Hosting Capacity Dependence on Harmonic Voltage Distortion in Low-Voltage Grids: Model Validation with Experimental Data. Energies 2018, 11, 465. [Google Scholar] [CrossRef] [Green Version]
- Hoseinpour, A.; Barakati, S.M.; Ghazi, R. Harmonic reduction in wind turbine generators using a Shunt Active Filter based on the proposed modulation technique. Int. J. Electr. Power Energy Syst. 2012, 43, 1401–1412. [Google Scholar] [CrossRef]
- Xie, X.; Li, H.; Tan, H.; Wu, Y.; Yang, T.; Zheng, J.; Yang, W. A second-order harmonic circulating current injection method for MMC capacitance reduction in offshore DC wind turbine. Int. J. Electr. Power Energy Syst. 2021, 133, 107264. [Google Scholar] [CrossRef]
- Yang, K.; Bollen, M.H.; Amaris, H.; Alvarez, C. Decompositions of harmonic propagation in wind power plant. Electr. Power Syst. Res. 2016, 141, 84–90. [Google Scholar] [CrossRef]
- Carlini, E.; Del Pizzo, F.; Giannuzzi, G.; Lauria, D.; Mottola, F.; Pisani, C. Online analysis and prediction of the inertia in power systems with renewable power generation based on a minimum variance harmonic finite impulse response filter. Int. J. Electr. Power Energy Syst. 2021, 131, 107042. [Google Scholar] [CrossRef]
- Elkholy, M.M. Harmonic analysis of hybrid renewable microgrids comprising optimal design of passive fi lters and uncertainties. Electr. Power Syst. Res. 2018, 163, 491–501. [Google Scholar] [CrossRef]
- Jove, E.; González-Cava, J.M.; Casteleiro-Roca, J.-L.; Alaiz-Moretón, H.; Baruque, B.; Leitão, P.; Pérez, J.A.M.; Calvo-Rolle, J.L. An intelligent system for harmonic distortions detection in wind generator power electronic devices. Neurocomputing 2021, 456, 609–621. [Google Scholar] [CrossRef]
- Golovanov, N.; Lazaroiu, G.C.; Roscia, M.; Zaninelli, D. Power Quality Assessment in Small Scale Renewable Energy Sources Supplying Distribution Systems. Energies 2013, 6, 634–645. [Google Scholar] [CrossRef] [Green Version]
- Bollen, M.H.J.; Yang, K. Harmonic aspects of wind power integration. J. Mod. Power Syst. Clean Energy 2013, 1, 14–21. [Google Scholar] [CrossRef] [Green Version]
- Papathanassiou, S.; Papadopoulos, M. Harmonic Analysis in a Power System with Wind Generation. IEEE Trans. Power Deliv. 2006, 21, 2006–2016. [Google Scholar] [CrossRef]
- Brunoro, M.; Encarnação, L.F.; Fardin, J.F. Modeling of loads dependent on harmonic voltages. Electr. Power Syst. Res. 2017, 152, 367–376. [Google Scholar] [CrossRef]
- Janik, P.; Kosobudzki, G.; Schwarz, H. Influence of increasing numbers of RE-inverters on the power quality in the distribution grids: A PQ case study of a representative wind turbine and photovoltaic system. Front. Energy 2017, 11, 155–167. [Google Scholar] [CrossRef]
- Gbadamosi, S.L.; Nwulu, N.I.; Sun, Y. Multi-objective optimisation for composite generation and transmission expansion planning considering offshore wind power and feed-in tariffs. IET Renew. Power Gener. 2018, 12, 1687–1697. [Google Scholar] [CrossRef]
- Gbadamosi, S.L.; Nwulu, N.I. A multi-period composite generation and transmission expansion planning model incorporating renewable energy sources and demand response. Sustain. Energy Technol. Assess. 2020, 39, 100726. [Google Scholar] [CrossRef]

Publisher’s Note: MDPI stays neutral with regard to jurisdictional claims in published maps and institutional affiliations. |
© 2022 by the authors. Licensee MDPI, Basel, Switzerland. This article is an open access article distributed under the terms and conditions of the Creative Commons Attribution (CC BY) license (https://creativecommons.org/licenses/by/4.0/).