Article

Techno-Economic Feasibility of Off-Grid Renewable Energy Electrification Schemes: A Case Study of an Informal Settlement in Namibia

1
Department of Electrical and Computer Engineering, Namibia University of Science and Technology, Windhoek 13388, Namibia
2
Institute of Acoustics and Building Physics, University of Stuttgart, 70569 Stuttgart, Germany
3
Department of Electrical Engineering, Nelson Mandela University, Port Elizabeth 6031, South Africa
*
Author to whom correspondence should be addressed.
Energies 2022, 15(12), 4235; https://doi.org/10.3390/en15124235
Submission received: 14 April 2022 / Revised: 12 May 2022 / Accepted: 16 May 2022 / Published: 9 June 2022
(This article belongs to the Topic Distributed Energy Systems and Resources)

Abstract

:
This paper examines different off-grid renewable energy-based electrification schemes for an informal settlement in Windhoek, Namibia. It presents a techno-economic comparison between the deployment of solar home systems to each residence and the supplying power from either a centralized roof-mounted or ground-mounted hybrid microgrid. The objective is to find a feasible energy system that satisfies technical and user constraints at a minimum levelized cost of energy (LCOE) and net present cost (NPC). Sensitivity analyses are performed on the ground-mounted microgrid to evaluate the impact of varying diesel fuel price, load demand, and solar photovoltaic module cost on system costs. HOMER Pro software is used for system sizing and optimization. The results show that a hybrid system comprising a solar photovoltaic, a diesel generator, and batteries offers the lowest NPC and LCOE for both electrification schemes. The LCOE for the smallest residential load of 1.7 kWh/day and the largest microgrid load of 5.5 MWh/day is USD 0.443/kWh and USD 0.380/kWh, respectively. Respective NPCs are USD 4738 and USD 90.8 million. A sensitivity analysis reveals that variation in the fuel price and load demand changes linearly with system costs and capacities. However, reducing the PV module price in an energy system that includes wind and diesel power sources does not offer significant benefits. Furthermore, deploying an energy system that relies on fossil fuels to each residence in an informal settlement is not environmentally responsible. Unintended negative environmental impacts may result from the mass and simultaneous use of diesel generators. Therefore, a microgrid is recommended for its ability to control the dispatch of diesel generation, and its scalability, reliability of supply, and property security. A roof-mounted microgrid can be considered for piloting due to its lower initial investment. The electricity tariff also needs to be subsidized to make it affordable to end-users. Equally, government and community involvement should be prioritized to achieve long-term economic sustainability of the microgrid.

1. Introduction

Access to electricity is an essential stimulant to improved productivity, enhanced living standards, and promotion of various types of social–economic welfare [1,2,3]. Whilst the proportion of those without electricity in sub-Saharan Africa has steadily declined [4], about 45% of the people in Namibia still lack access to electricity [5], especially those living in rural areas and informal settlements. The country’s electricity access for rural and urban areas is 34.9% and 74.6%, respectively [6]. The disparity has motivated many people to migrate from rural to urban settings in pursuit of better opportunities [7]. They often settle in informal settlements due to unemployment, low incomes, and other economic challenges. Due to a lack of affordable housing and declining economic opportunities owing to the impacts of the COVID-19 pandemic, informal settlements have also become home to middle-class citizens who otherwise could reside in better suburbs [8,9].
Informal settlements are typically semi- or un-serviced peri-urban areas on the outskirts of municipal boundaries. Weber et al. [10] classify informal settlements as either: (i) structured settlements, (ii) unstructured settlements with high density, or (iii) uncontrolled urban expansions where residents set up illegal and informal housing structures, often made of low-cost corrugated iron. Where informal settlements are recognized by local authorities, road layouts are structured, and basic essential services such as water, sanitation, and electricity are provided. Thus, their “informality” is due to them not being formally proclaimed and also because residents do not have registered land tenure [11]. However, most informal settlements in Namibia are without electricity and other essential services that could improve residents’ living conditions and social status [12]. Studies have shown that access to electricity can influence the aspirations of people living in rural and informal settlements towards a productive life [13,14,15], better education [16,17], and increased health [18,19,20]. Thus, providing electricity to informal settlements is expected to reduce poverty and indirectly contribute to the country’s socio-economic development.
Although the Namibian government has made efforts to electrify rural and informal settlements through traditional grid extension, various challenges have deterred the efforts. Firstly, a large investment is needed to extend the national grid for a country as wide and low-densely populated as Namibia [21,22,23]. Secondly, development has not kept pace with the rapid growth of informal settlements. Thirdly, domestic generation is not enough to meet the country’s existing demand, let alone the additional load expected from grid expansions. Currently, about 60% of national demand [24] is met by electricity imports from neighboring countries such as South Africa, through the Southern African Power Pool (SAPP) [25]. With increasing regional demand [26], SAPP energy deficits could soon affect Namibia’s energy security and further slow down economic growth. It is thus prudent that Namibia considers renewable energy supplies to mitigate the existing power shortage and extend electricity services to rural and informal settlements.
Worldwide deployment of renewable energy systems has drastically increased in the past decade, owing to reduced components cost [27,28], technological advancements [29], global environmental concerns [30], market growth [31], and policy support [32]. For instance, the global average cost of crystalline silicon photovoltaic modules has drastically fallen by 85% between 2010 and 2020 [33]. Subsequently, the installed cost of utility-scale, commercial-rooftop, and residential photovoltaic systems has reduced by 82%, 69%, and 64%, respectively [34]. Installed cost includes the cost of equipment, site preparation, and installation of equipment. In general, total installed costs vary for different countries and regions but largely depend on project size, location, maturity of the market, and financing scheme [35].
In the next sub-sections, this paper provides a brief assessment of renewable energy potential in Namibia, the country’s current power generation capacity, problem identification and objectives, and contributions of this study.

1.1. Potential Renewable Resources in Namibia

Namibia is geographically located in the south-west of Africa, bordering Angola (north), South Africa (south), the Atlantic Ocean (west), and Botswana (east). It has a land area of 825,615 km2, a population of about 2.5 million [36], and a diverse terrain with a mostly semi-arid climate characterized by irregular rainfall and large temperature differences in day and night times [37,38]. The country has extensive and untapped renewable energy resources for electricity production, which include hydro, solar, wind, biomass, and natural gas [39], as outlined below:
  • The hydro resource is currently the largest renewable source contributing to domestically generated electricity. In 2021, the only hydropower plant in the country (Ruacana) contributed 80% of domestic capacity [5,24].
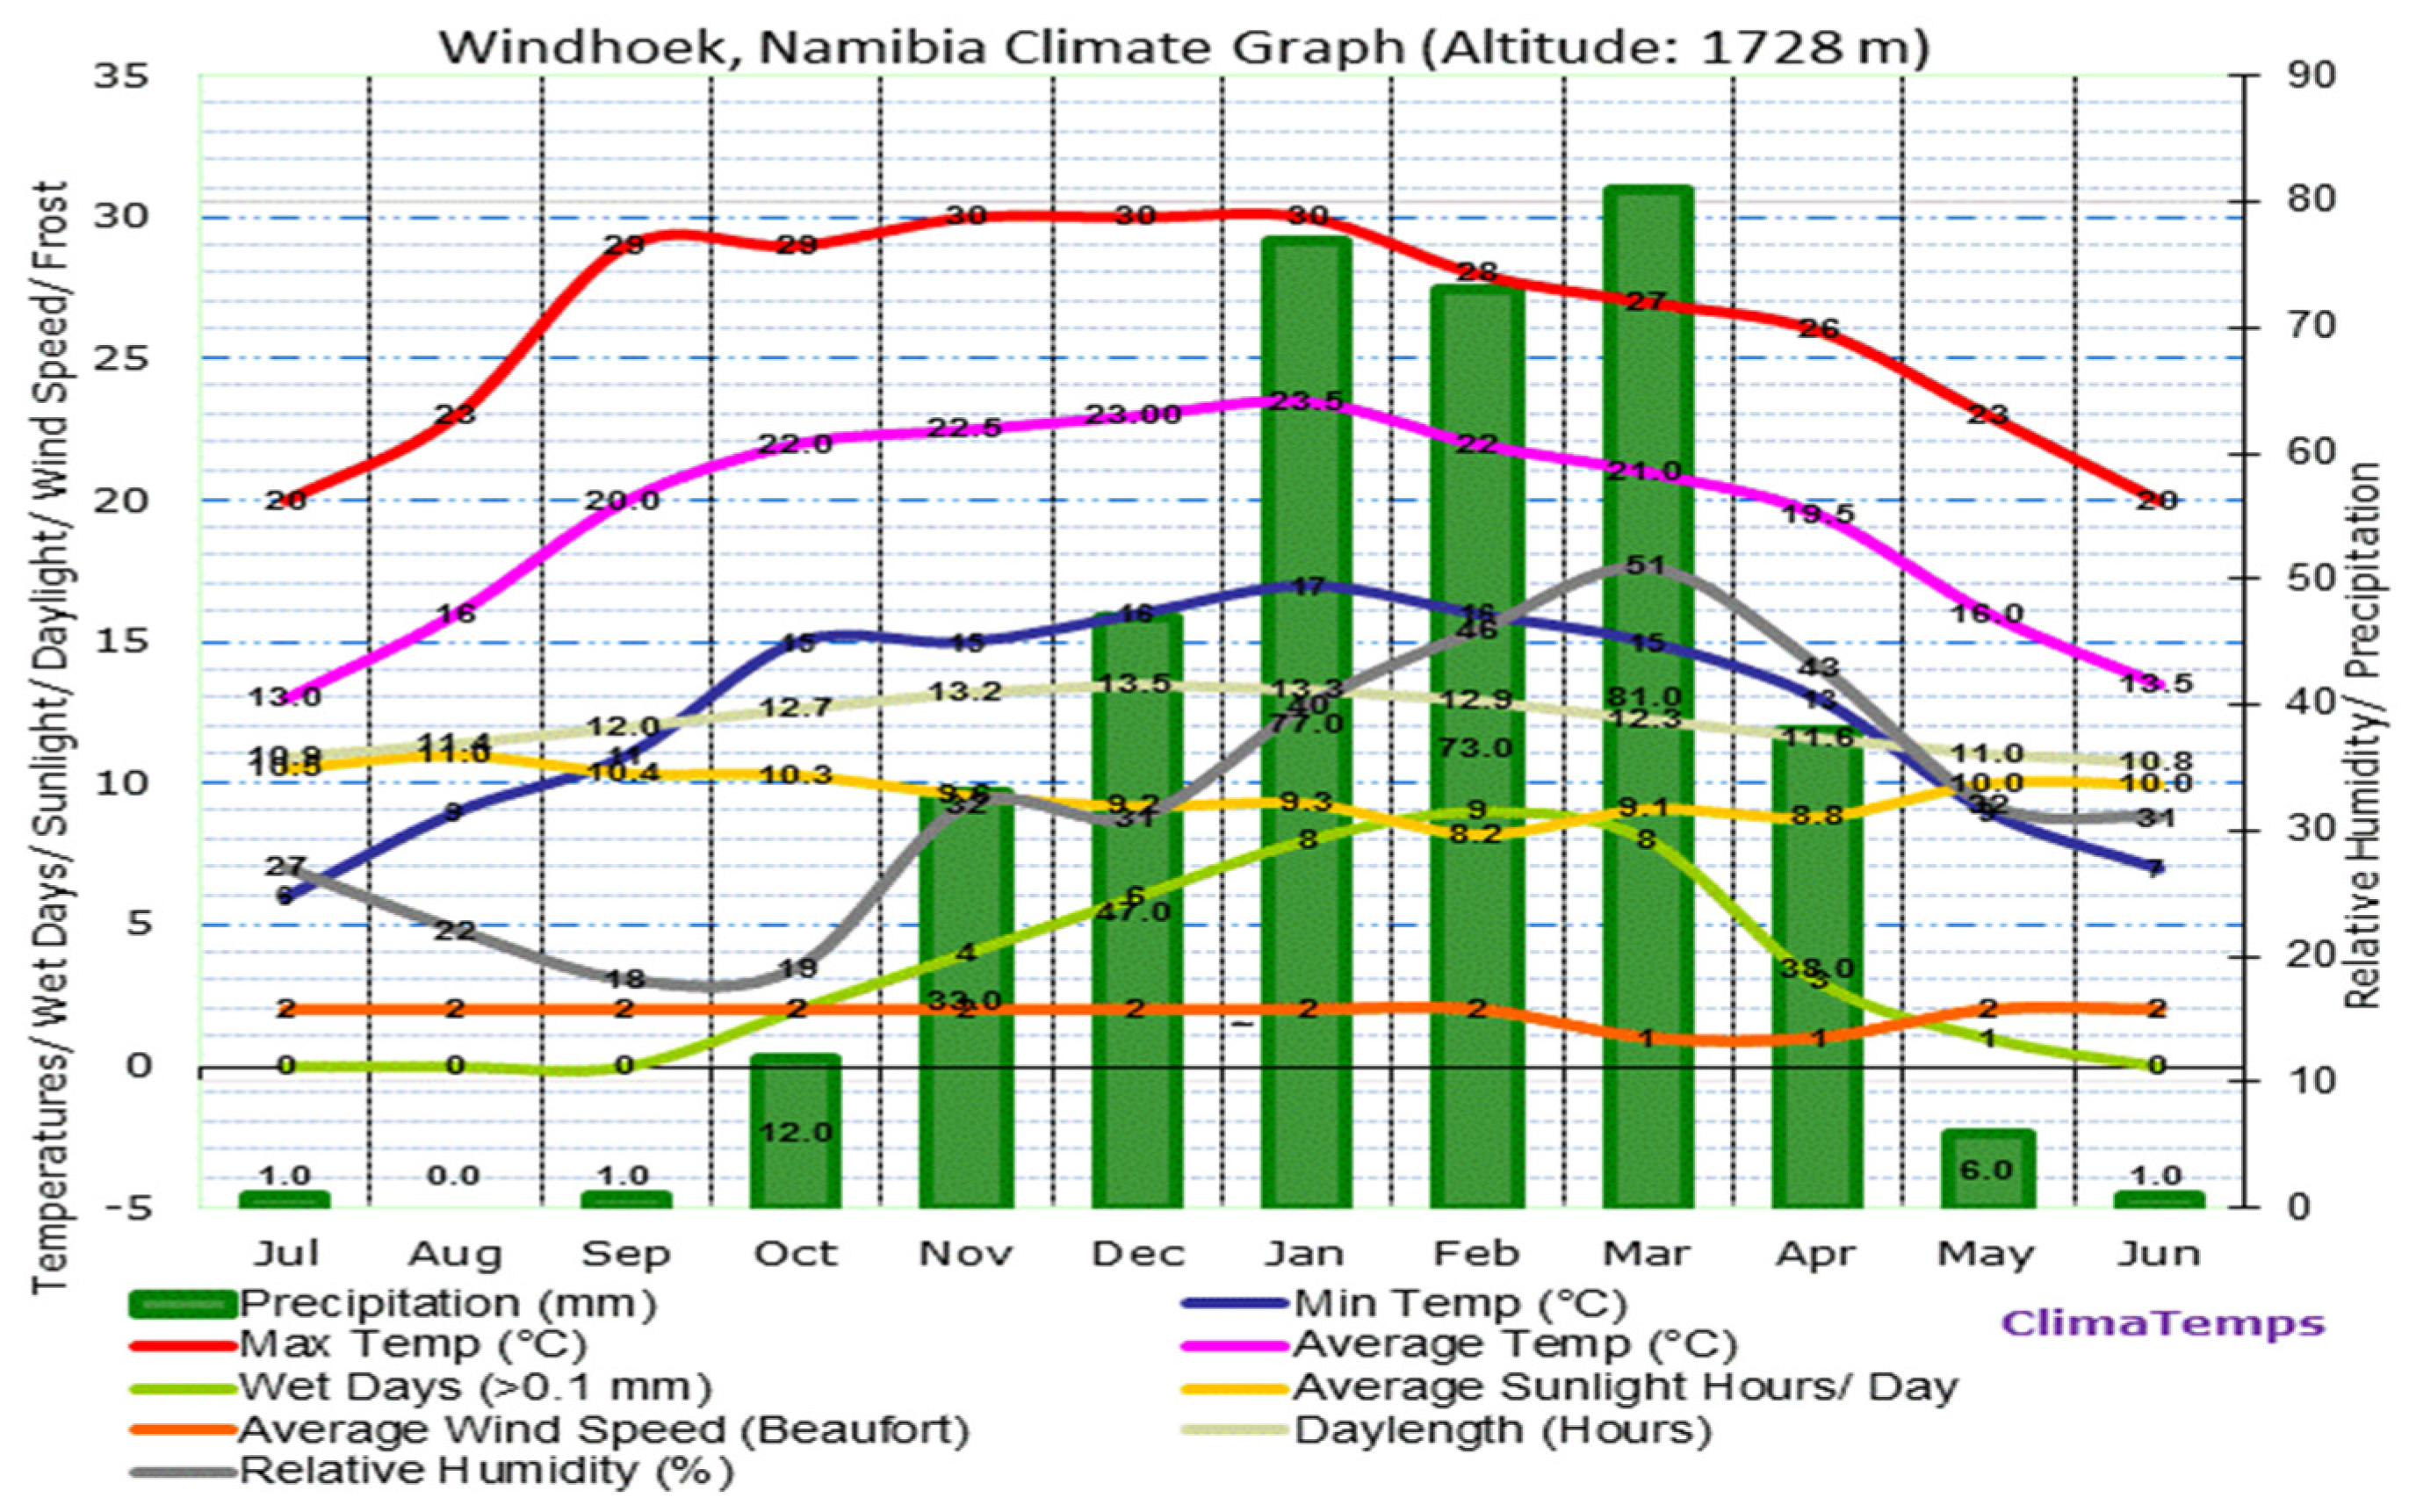
  • Namibia receives abundant solar radiation, with daily global horizontal irradiation between 4.4 kWh/m2 along the coastal areas and roughly 7.8 kWh/m2 in arid areas. A pre-feasibility study established that more than 33,000 km2 of potential sites for concentrated solar power exist in the country and produce up to 250 GWe [40,41].
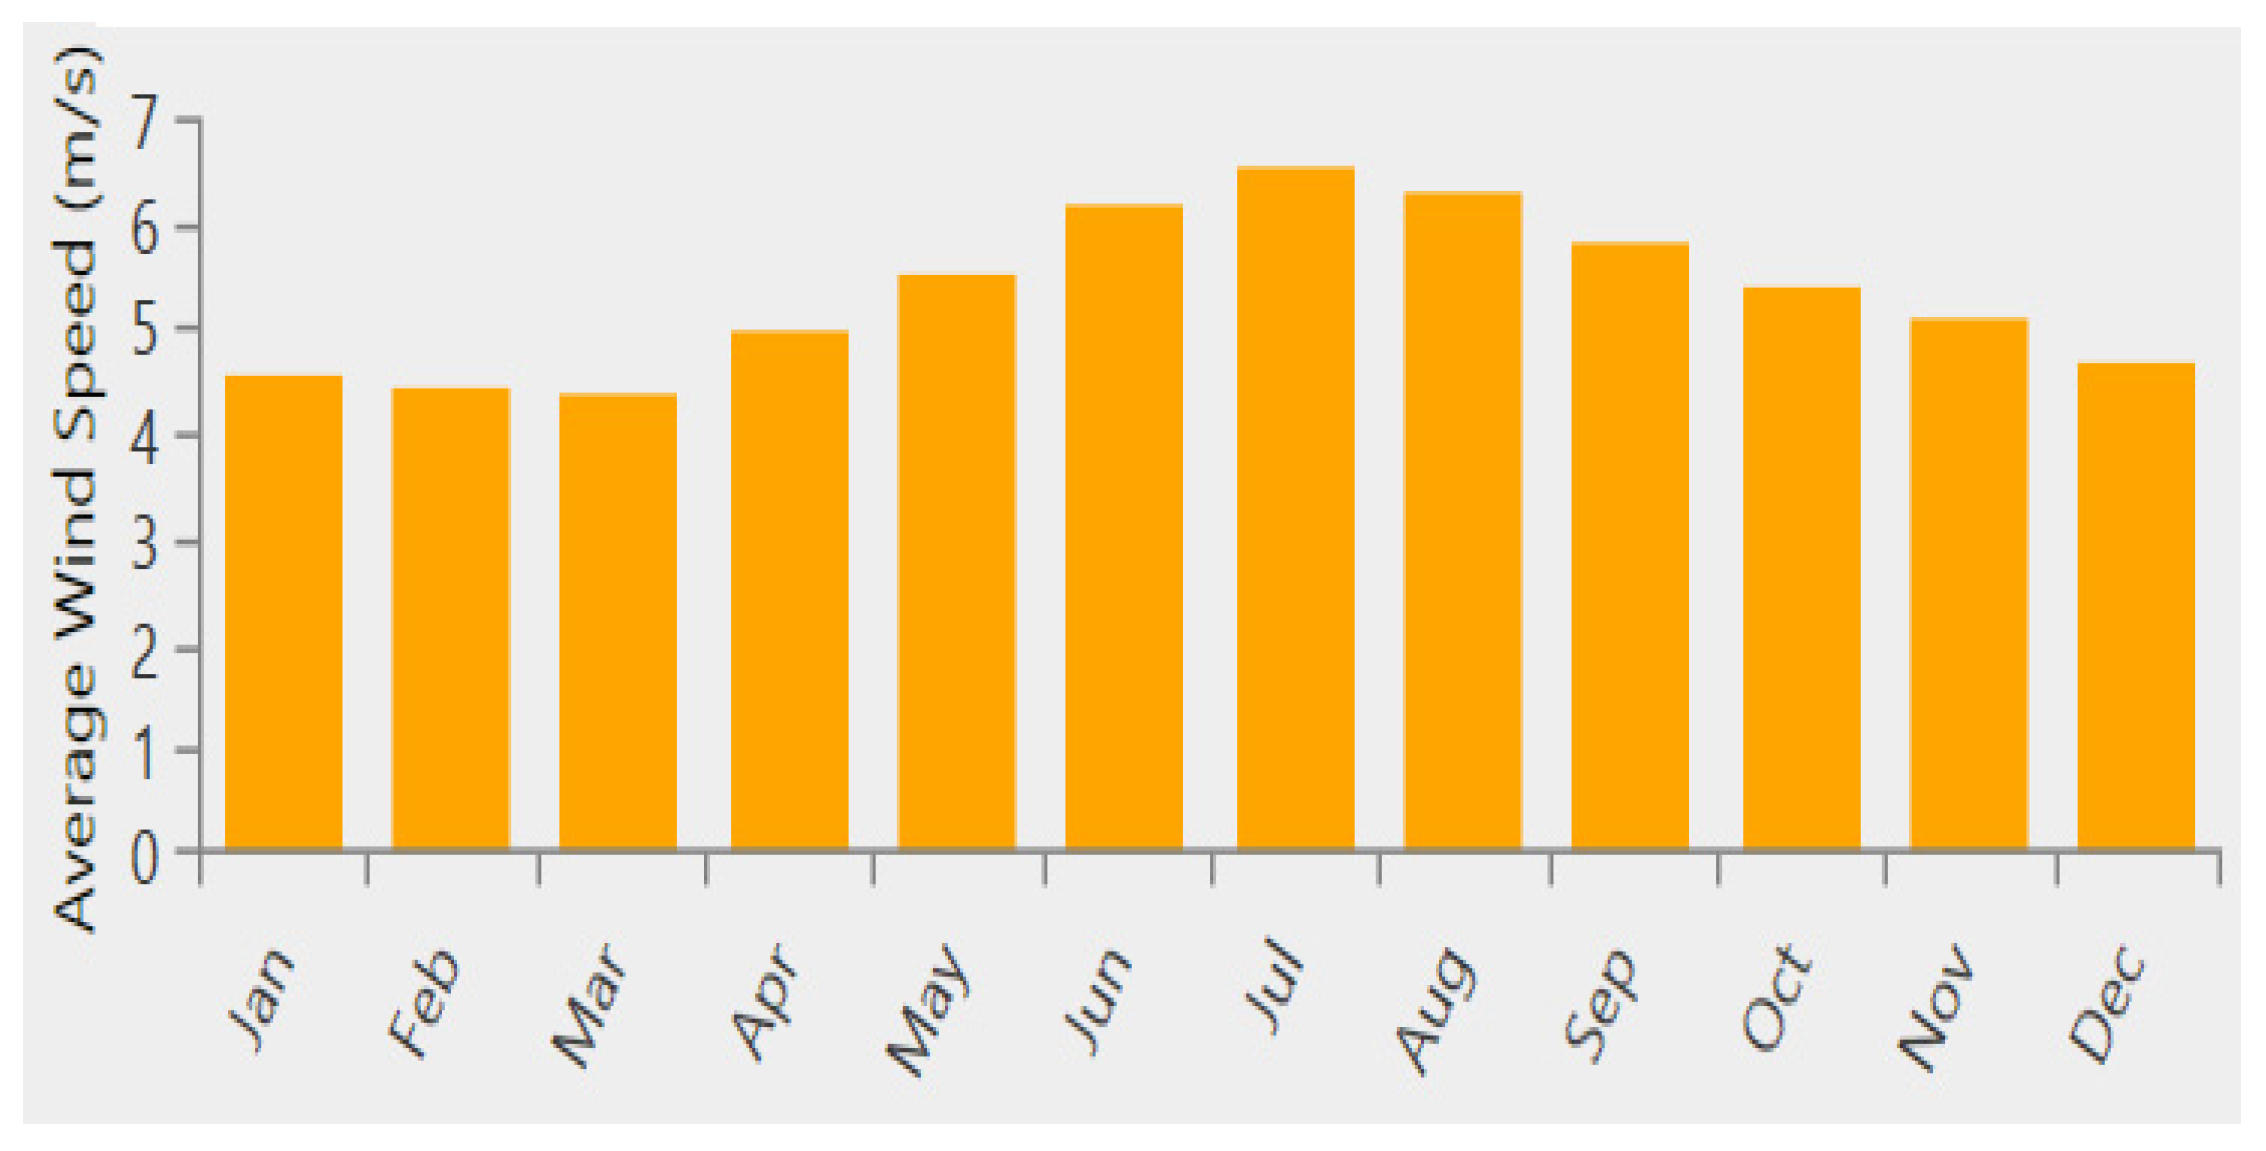
  • Average wind speed in the country ranges from 4 to 15 m/s, with higher speed expected along the coastline. A wind-power density of class 7 can be expected on the Luderitz coastline and class 3 in most parts of the country [42].
  • Encroacher bush and solid waste are key biomass resources in Namibia for electricity generation. There are approximately 260 billion m2 of bush-encroached land in the country and it is expected to grow by 3.2% annually [43].
  • A natural gas field with the potential for an 800 MW (nominal) power plant was discovered in offshore Namibia, but its implementation remains elusive [44].

1.2. Overview of the Namibian Power Sector

Namibia’s average peak demand is about 688 MW, and is largely met by a local/import ratio of about 40/60. The 40% local generation is comprised of hydro (≈80%), coal (≈2.5%), and solar/wind/biomass (≈17.5%) [5,25]. Though local installed capacity is about 639.5 MW, as shown in Table 1, the hydro generation is a run of the river plant whose throughput depends on rainfall patterns. Therefore, energy shortage could be up to 60% and is often met by electricity imports from the region [25,45]. To reduce imports dependency, the government, (i) implemented a modified single buyer market framework that promotes participation from independent power producers [46], (ii) increased the renewable share [46,47], and (iii) improved governing policies that attract more energy investments [48,49]. Consequently, Namibia’s solar photovoltaic market has grown [50,51], and deployment of more than 278 MW of renewable capacity is expected within the next 5 years [24]. However, more effort is still needed to harness abundant renewable sources to ensure self-sufficiency and achieve universal electricity access, including electrification of informal settlements.

1.3. Problem Identification and Study Objectives

Existing and planned renewable generation in Namibia is primarily via large-scale power plants feeding into the national grid and located far from loads. This necessitates large capital investments, and lengthy procurement and construction processes. The upgrading of network infrastructure is also inevitable to integrate large and varying renewable energy, and also mitigate possible grid instability. Meantime, the country’s energy demand increases [39] and unelectrified informal settlements grow rapidly [10], thus posing irrepressible socio-economic challenges [52].
In the wake of the declining cost of renewable energy components and vast research on renewable grid integrations, the energy sector is now favoring solar home systems (SHS) and microgrids as a means to reduce capital costs [53], provide rapid electrification [54,55], and increase network reliability and resiliency [56,57]. Generally, both SHS and microgrids are relatively “small grids” that integrate distributed energy resources such as solar photovoltaics, distributed energy storage devices such as batteries, and local loads. They, however, differ in generation capacity, control strategies, and ability to operate autonomously or in parallel with the grid for better reliability and resiliency [58]. Microgrids tend to have better features and are commonly sized between 50 kW and multiple megawatts [59].
In view of the above, this study examines the technical and economic conditions under which the deployment of solar home systems and microgrids becomes cost effective and viable for a peri-urban area in a developing country. The study is limited to off-grid configurations for an informal settlement in Namibia and assesses whether electrification from a centralized microgrid or stand-alone solar home systems for each resident would be cheaper, sustainable, and environmentally friendly. A sensitivity analysis is also conducted to assess the impact of changes in the diesel fuel price, load demand, and solar PV module costs on optimal energy systems.
The study employs HOMER (Hybrid Optimization of Multiple Energy Resources) software to find optimal energy systems that can cost-effectively satisfy load demand by minimizing the net present cost (NPC) and levelized cost of energy (LCOE). NPC refers to the difference between the present value of all costs of installing and operating a renewable energy system and savings or revenues earned over the project’s lifetime. LCOE is a cost-per-unit measure (USD/kWh) that compares the competitiveness of generating energy from different systems. Furthermore, HOMER is a widely used micro-power simulation software that employs an iterative optimization algorithm to find a feasible off-grid or on-grid energy solution [60].

1.4. Study Contributions

This study contributes the following:
  • It examines different off-grid energy configurations that can supply the load profile expected in a typical informal settlement or peri-urban community.
  • It presents a comparative analysis of the deployment of individual solar home systems to each resident versus supplying electricity from a centralized microgrid.
  • It implements a “framework for rural energy system design” proposed by Ali et al. [61] and assesses its performance for an informal settlement.
  • It provides a holistic feasibility study that considers both technical, economic, social, and governance aspects in determining the optimal and practical energy solution for the selected community.
  • It provides insight on whether an off-grid renewable energy system designed for an informal settlement will have techno-economic characteristics similar to a rural area, an urban area, or otherwise.
  • It can inform power system planners, policy makers, energy investors, and other researchers on the technical and economic conditions to electrify a peri-urban area using renewable energy sources.
This paper is structured into five main sections. Section 1 provides an introduction, the renewable energy potential and power sector overview in Namibia, and the study objectives and contributions. Section 2 discusses recent related techno-economic studies. Section 3 detailed the steps to optimal sizing and techno-economic assessment of a renewable energy system. Section 4 discusses simulation results, while Section 5 concludes the study and provides recommendations.

2. Related Techno-Economic Studies on Hybrid Renewable Energy Systems

Techno-economic optimization of off-grid and on-grid hybrid renewable energy systems (HRES) has drawn immense attention from researchers in recent years. Most studies examined different HRES configurations to determine optimal options for specific loads such as residential, rural villages, industrial, islands, and medical facilities. An optimal solution is the one that can sufficiently meet the load at the lowest cost. Common criteria used in evaluating the economic performance of HRES include net present cost (NPC), levelized cost of energy (LCOE), discounted payback period, and carbon dioxide emission rates [62,63].
Generally, optimal HRES integrates various renewable sources, such as solar photovoltaic and wind, conventional generation such as a diesel generator, and/or energy storage devices, and local loads into a single power system, as depicted in Figure 1. Such configurations can exploit the difference in seasonal and daily profiles of renewable power sources, such that their complimentary behaviors can results in improved reliability of supply while reducing system energy cost [60,64]. Integrating energy storage such as batteries and fuel cells is also found to improve system reliability and stability by countering the effect of fluctuating, and unpredictability of, output power from renewable sources [65].
Table 2 provides a summary of some recent studies on the techno-economic viability of off-grid hybrid renewable energy systems (HRES) for different load profiles. It outlines each study’s main objective, load type, optimization tool employed, and key findings of the research. Generally, most studies found HRES to be the optimal choice as it effectively improves the energy usage factor [66], enhances supply reliability [67], reduces energy storage requirements [64], and lowers carbon emission [68]. A review of selected research is expanded in the next paragraphs.
Ali et al. [61] developed a design framework that can be used to structure a techno-economic feasibility study for a rural energy system. The framework was implemented to design potential off-grid and on-grid HRES for a village in Dera Ismail Khan, Pakistan, and examined its potential for benchmarking in other developing countries. Real-time electrical load data were used, and HOMER software was employed to carry out system optimization and techno-economic feasibility. The system’s robustness and commercial viability were tested via a sensitivity analysis that considered the impacts of solar photovoltaic modules’ derating factor and various macro-economic variables. The study found a grid-integrated HRES to offer lower costs than an off-grid configuration, at a levelized cost of energy between USD 0.072/kWh and USD 0.078/kWh, which was also lower than the existing utility tariff. The best solution included a solar photovoltaic source, battery storage, a diesel generator, and restricted grid-connection time that reliably caters for frequent power outages.
Uddin et al. [69] investigated the technical, economic, and environmental feasibility of a 1.4 MW microgrid that employed recently innovated floating solar photovoltaic modules to serve a remote coastal region in Bangladesh. The load included 2500 households, 120 electric-vehicle scooters, and a 25,000 L water treatment facility. Techno-economic simulation and analysis of system electrical characteristics such as bus voltage were conducted using HOMER and MATLAB/Simulink software, respectively. A configuration of floating solar photovoltaic and battery storage system was found to reliably serve the load at USD 0.183/kWh, which was consistent with the region’s grid tariff. The microgrid could also result in an annual saving of up to 694.56 metric tons of carbon dioxide emissions (CO2).
In [70], three potential off-grid HRES were compared to determine the configuration that would reliably and cost-effectively supply a commercial load for a remote transport facility in Makkah Province, Saudi Arabia. A techno-economic assessment was performed using HOMER software, and the best solution was a combination of wind as a power source, batteries and fuel cells for storage, and a diesel generator for backup supply. Its levelized cost of energy was USD 0.271/kWh.
Mehta and Chowdhury [71], investigated the technical and economic feasibility of an optimal HRES for medical facilities in Tanzania. Analysis was carried out using the renowned HOMER software. It was observed that an optimal HRES at both locations included a solar photovoltaic, a diesel generator, and battery storage, presenting lower NPC and LCOE. The total system cost was USD 63,136.93 and USD 51,544.75 for an average daily load of 20.26 kWh/day and 16.22 kWh/day for hospitals in the districts of Upanga and Ngamiani, respectively. The fuel cost was between 12.3% and 13.3% of the overall system cost, implying cleaner energy production.
In a study by Zebra et al. [72], a review was conducted to identify key opportunities and barriers to HRES implementation in developing countries. The study considered political/policy, economic, social, technological, environmental, and legal (PESTEL) issues that could influence the integration of HRES in different countries. Information was obtained from scientific literature, development reports, and semi-structured qualitative interviews with experts. The study revealed that on-grid utility-scaled solar photovoltaic microgrids offer lowest the LCOE, ranging between USD 0.54/kWh and USD 0.77/kWh. It was further shown that community and government support were key to the successful implementation of HRES solutions.
A techno-economic study for a rural community in Fouay, Benin, found an off-grid hybrid solar photovoltaic, diesel generator, and battery system to offer the lowest LCOE of USD 0.207/kWh. Analysis was performed using HOMER software and established that integrating a diesel generator increased supply reliability and reduced battery requirements by 70% compared to a solar photovoltaic and battery configuration [73].
Krishan and Suhag [74] compared the techno-economic performance of three hybrid renewable energy systems for residential and agricultural loads in the Yamunanagar community in the State of Haryana, India. HOMER and MATLAB/Simulink software were used for techno-economic evaluation and analysis of electrical systems, respectively. The result showed that an energy system that combines solar, wind, and battery was cost-effective for the selected site, with an LCOE of USD 0.288/kWh. The MATLAB simulation demonstrated that an active power balance was maintained amidst solar irradiance, load, and wind speed variations. Similarly, Javed et al. [75], developed a genetic optimization algorithm to evaluate the technical and economic viability of a hybrid solar, wind, and battery system for a remote island. The algorithm was compared to HOMER optimization and offered better performance, in terms of supply reliability and cost. The selected energy configuration could sufficiently supply load, but with high initial capital costs. The study also observed that the size of a wind turbine had little impact on the system cost and reliability.
It is evident from past research that the subject of assessing the viability of renewable energy systems continues to evolve. Literature shows that there is no single solution. An optimal solution is influenced by factors such as accuracy of load profiles [70], types of renewable energy resources at the site [61], component costs [28], and an optimization method used [68]. Government and community support are also key to the implementation and economic sustainability of these projects [76,77]. Therefore, each case study is expected to present unique constraints and outcomes.
Table 2. Selected research on off-grid hybrid renewable energy systems (HRES), published between 2018 and 2022 *.
NoYearCase StudyLoad TypeObjective and Optimization Tool(s)Key Findings
12022Bangladesh [69]Remote western coastal region
-
Investigated the technical, economic, and environmental feasibility of a 1.4 MW solar mini-grid to serve 2500 households, 120 electrical scooters, and a 25,000 L water treatment facility.
-
Used MATLAB and HOMER software
-
A floating PV|BAT system could optimally serve the load at an LCOE of USD 0.183/kWh, which is found to be in line with the region’s grid tariff.
-
Annual carbon dioxide emissions (CO2) of 466.56 and 228 metric tons could also be saved from EV scooters and households, respectively.
22022Makkah Province, Saudi Arabia [70]Remote commercial facility
-
Evaluated the techno-economic feasibility of three possible off-grid HRES systems for a commercial load of a remotely located transport company.
-
HOMER software.
-
A WT|DG|FC|BAT system was the most optimal and eco-friendly option at NPC of USD 7.045 million and LCOE of USD 0.271/kWh.
32021Dera Ismail Khan, Pakistan [61]Semi-electrified village
-
Developed and implemented a design framework for a rural electrification system. Techno-economic viability of two off-grid and two on-grid configurations was performed using HOMER software
-
A grid-connected hybrid solar PV, batteries, and diesel generator was the economically feasible solution. Excess energy is traded with the grid.
-
LCOE for on-grid systems were USD 0.072/kWh and USD 0.078/kWh, and USD 0.145/kWh and USD 0.167/kWh for the off-grid options.
42021Upanga and Ngamiani, Tanzania [71]Medical facilities
-
Investigated the technical, economic, and environmental feasibility of an optimal HRES for medical facilities in Tanzania.
-
HOMER software was used.
-
The PV|DG/BAT option was the most optimal HRES option, presenting lower NPC, LCOE, and excess electricity.
52021Various Developing Countries [72]Rural communities
-
Compared the techno-economic performance of a range of off-grid HRES systems to electrify rural communities in various developing countries.
-
Used PESTEL analytical framework
-
A PV|DG system was the most optimal solution for most locations.
-
LCOE for this option ranged between (USD 0.54/kWh and USD 0.77/kWh.
-
It was further established that community and government supports were key to the successful implementation of off-grid HRES solutions.
62020Benin, Africa [73]Remote village
-
Evaluated the technical, and economic feasibility of a hybrid off-grid option for a remote village in Benin.
-
Used HOMER software.
-
A PV|DG|BAT was the least cost option at an LCOE of USD 0.207/kWh and reduced battery storage requirements by 70%.
72019Chungbuk Innovation City, South Korea [78]Town
-
Assessed the environmental economic impact of an HRES for a town in South Korea, which included electrical and thermal load.
-
Used HOMER software.
-
When compared to conventional systems, a system with a higher solar fraction could result in CO2 reduction of up to 61%, energy savings of up to 73%, a cost/benefit ratio of 1.7, and a lower LCOE.
82019Jiuduansha, Near Shanghai, China [75]Remote island
-
Evaluated the technical and economic viability of a hybrid solar-wind-battery system.
-
Used a genetic algorithm and HOMER
-
Hybrid PV|WT/BAT systems could sufficiently electrify an island without violating any constraints but with high initial capital requirements.
-
The size of a wind turbine had little impact on the system cost and reliability.
92019Maluku Province, Indonesia [79]Remote villages
-
Compared the viability of different HRES systems for 3 villages in Maluku province, Indonesia.
-
HOMER, PVsyst, and PVsol were used.
-
The PV|DG option was the most optimal solution for Klistau village, while the PV|WT/DG was found to be optimal for Wairatan and Leiting villages.
102019Yamunanagar, India [74]Rural community
-
Investigate the techno-economic viability of an HRES system for residential and agriculture load. Impact of renewable source variability on HRES electrical characteristics was also assessed.
-
Used HOMER and MATLAB/Simulink software
-
The hybrid PV|WT|BAT was the most cost-effective option for the site.
-
Active power balance and voltage buses were maintained in spite of solar irradiance, wind speed, and load variations.
112018Godagari, Bangladesh [80]Remote areas
-
Evaluated the performance of the PV|DG/BAT option for a remote community, mainly focusing on the effects of different battery dispatching strategies on LCOE and NPC.
-
Used HOMER software
-
Combined dispatch strategy had resulted in lower LCOE compared to the load following and cyclic charging strategies
122018Mbeni, Comoros [81]Remote island
-
Investigated the techno-economic viability of a renewable-based microgrid with hydrogen storage, primarily to mitigate electricity deficits and load shedding in a rural area in Comoros.
-
HOMER software was used
-
A microgrid comprised of PV|DG|WT|FC|Electrolyser|Hydrogen storage tank was found to fully serve the load with excess electricity of 538,138 kWh/year.
-
Although the solution eliminated energy deficiency and intermittency, the LCOE was 8.4% above the current grid tariff.
* Abbreviations used in this table are listed below: HOMER—Hybrid Optimization of Multiple Energy Resources, HRES—hybrid renewable energy system, NPC—net present cost, LCOE—levelized cost of energy, PESTEL—political/policy, economic, social, technological, environmental, and legal, PV—solar photovoltaic, DG—diesel generator, WT—wind turbine, BAT—battery storage system, FC—fuel cell, PVsyst—a photovoltaic energy design and simulation software, PVsol—a photovoltaic energy design and simulation software.

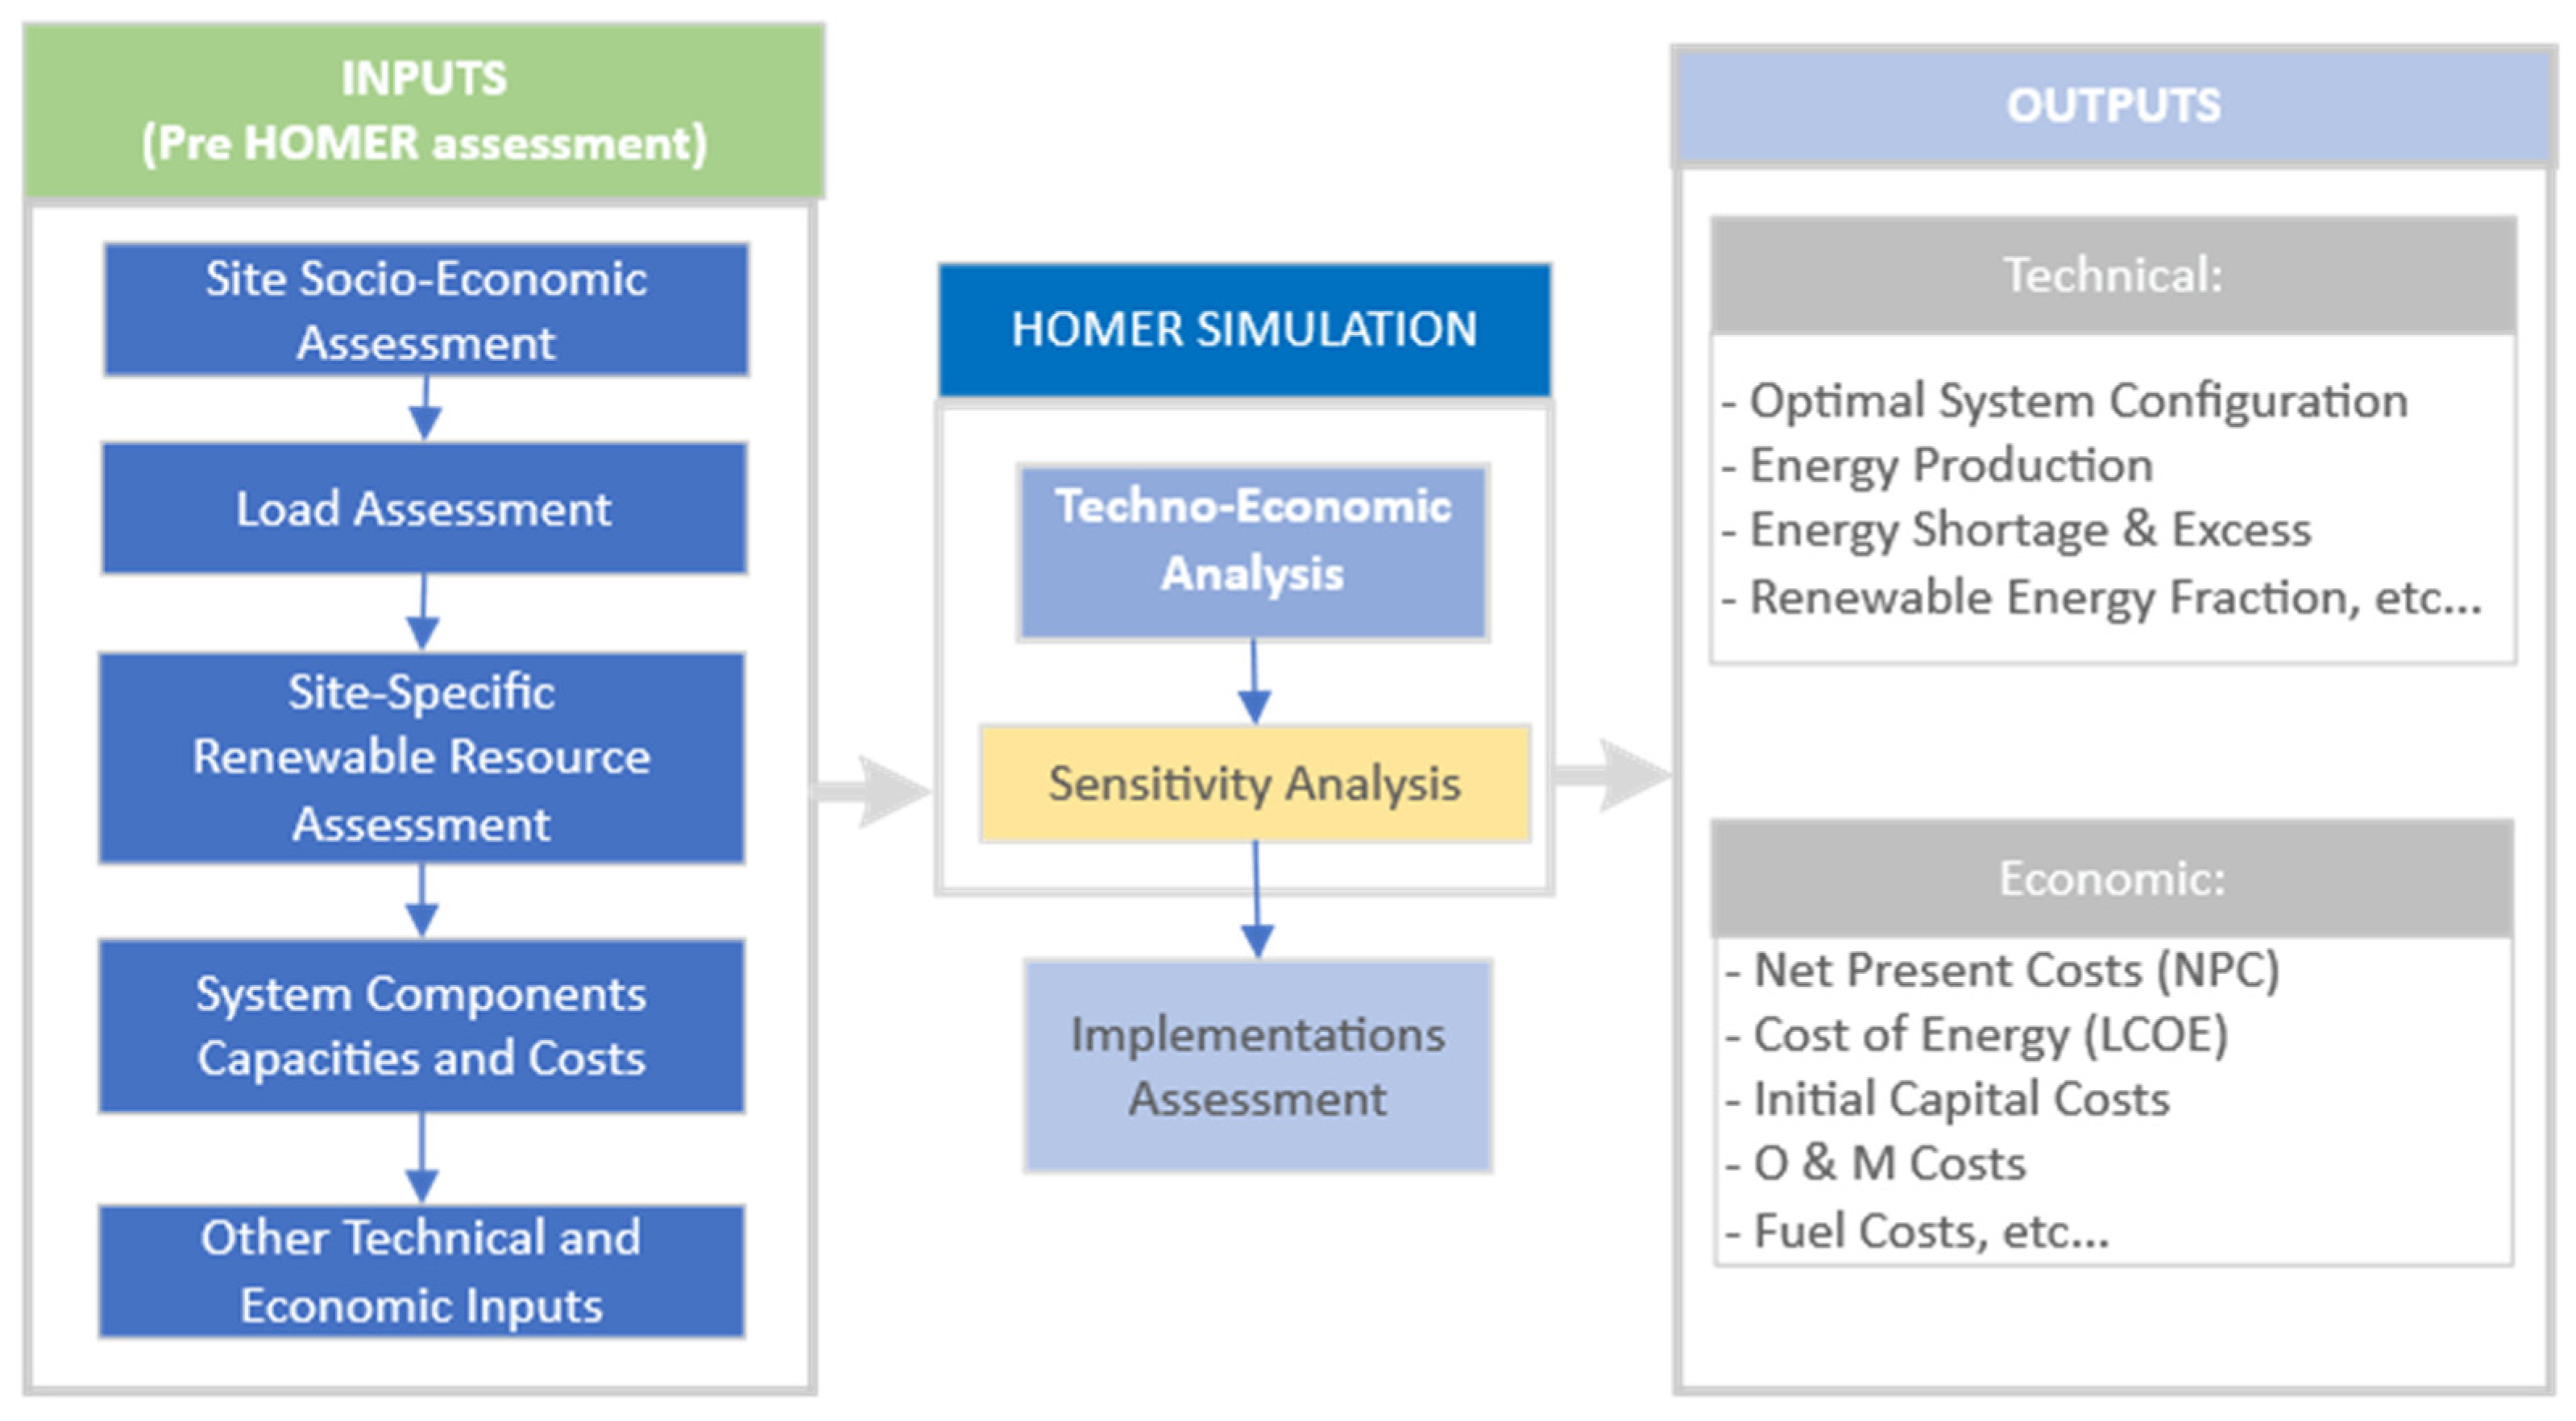
3. Materials and Methods

This study implements a framework proposed by Ali et al. in assessing the techno-economic viability of a rural energy system. The emphasis is on ensuring that input requirements are carefully assessed to ensure that an appropriate energy system is designed for the target community. As depicted in Figure 2, a pre-HOMER input assessment is carried out in the first step. This includes (i) examining the selected site’s social and economic conditions; (ii) assessing the community load demand pattern; (iii) assessing site-specific renewable energy resources; and (iv) defining energy system component capacities and costs.
In the second step, HOMER Pro 3.14.7880.21077 by HOMER Energy, LLC (Boulder, CO, USA) is used to carry out the techno-economic analysis by modeling, simulating, and optimizing different energy configurations. The aim is to determine the optimal capacities of generating units that can cost-effectively meet the load demand. In the third step, a sensitivity analysis is conducted to assess the robustness of the optimal energy configuration. Finally, financial, social, and environmental aspects are briefly assessed to determine the social and commercial efficacy of the most economical energy system.

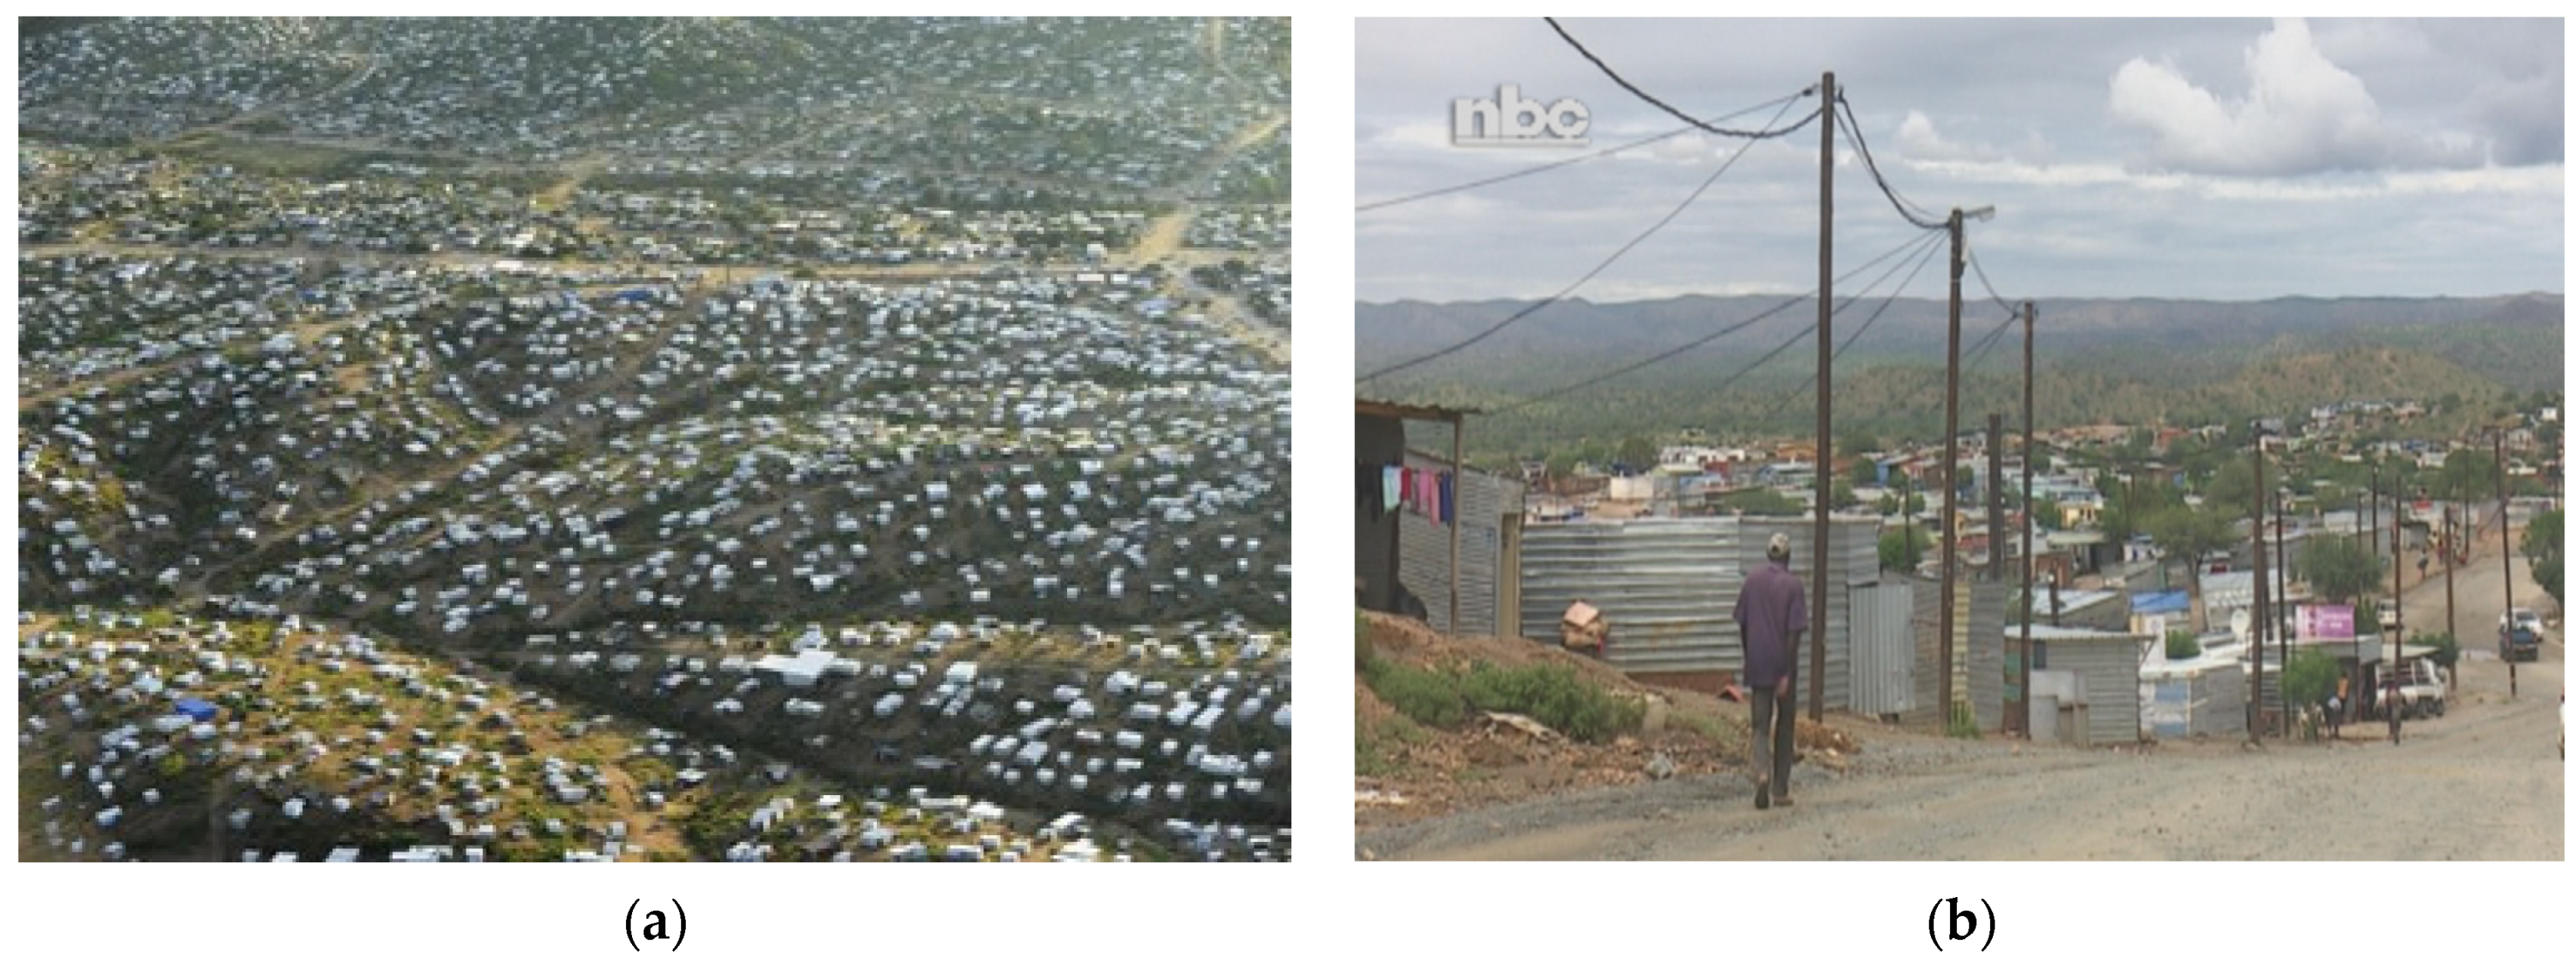
3.1. Site Socio-Economic Assessment

The case study is a semi-electrified Havana informal settlement located on the outskirts of Katutura, a suburb in the northern part of Windhoek, the Namibian capital city (shown in Figure 3). The site is geographically located at 22°29′ S, 17°01′ E, at 1558 m in elevation. It is in a semi-arid climatic region with hot summers and cold to mild winters [38]. Havana is the most populous and one of the oldest informal settlements in Windhoek, spanning a total area of approximately 3.1 km2 and a dwelling density of around three dwellings per 100 m2. The settlement is mainly for rural migrants, but it has also become a residence for anyone seeking low-cost living in the city [82]. This is because authorities are slow in delivering proper, sufficient, and affordable housing at a rate that keeps pace with the influx and increasing living costs.
Although many residents have the means to construct decent housing, houses in the informal settlements are mainly constructed of cheap and uninsulated corrugated iron that can easily be erected or removed [10]. This is because most of the informal settlers lack formal property rights and are therefore at risk of losing their investments in event of eviction from the land. However, the Havana settlement has been proclaimed a city structure and basic services are gradually being rolled out. This includes electrification of Havana Ext 1–3 in 2020/2021 through the “Windhoek Peri-Urban Electrification Project” [83,84,85]. Since service delivery has not kept pace with rapid growth of informal settlements, illegal electricity connections have been on the rise as the un-electrified residents try to connect from those legally supplied [86,87,88].
Available data from 2004 estimated that 29% of the Windhoek population lived in informal settlements [89]. Since the Windhoek population has grown annually by 4.2% between 1991 and 2011 [10], all things equal, it can be inferred that informal settlers constituted roughly 48% of Windhoek population by 2021, of which roughly 40% reside in the Havana settlement and other populous settlements such as Babylon, Ombili, Okahandja Park, and Goreagab. The population in Havana is largely a working group of 20–40-year-olds, comprised of unskilled workers, job seekers, and self-employed individuals operating informal businesses [9,10,82]. Thus, electricity consumption is expected to be dominated by domestic consumers and small businesses. The energy needed for cooking and lighting is currently met by firewood and kerosene, respectively. There are also some users operating diesel generators, gas cookers, rechargeable portable lamps, and small solar home systems [9]. The characteristics of the site are summed up in Table 3.
An aerial and closer view of the Havana settlement is shown in Figure 4. The area constitutes about 80% residential, 10% small-scale commercial (comprised of small grocery shops, hair salons, and small liquor shops mainly operated from residential properties), and the remaining 10% is made up by a few public facilities such as schools, clinics, and municipal areas. Two sizes of corrugated iron residences are dominant: the 10–12 m2 single room occupying 1–2 persons and the 15–24 m2 usually partitioned to occupy a family of 2–4 persons, typically a couple with young children. There are also a few brick houses, mainly 4 rooms structures in the size range of 30–40 m2. These dwellings will henceforth be referred to as Shack-12sqm, Shack-24sqm, and Brick-House, respectively.

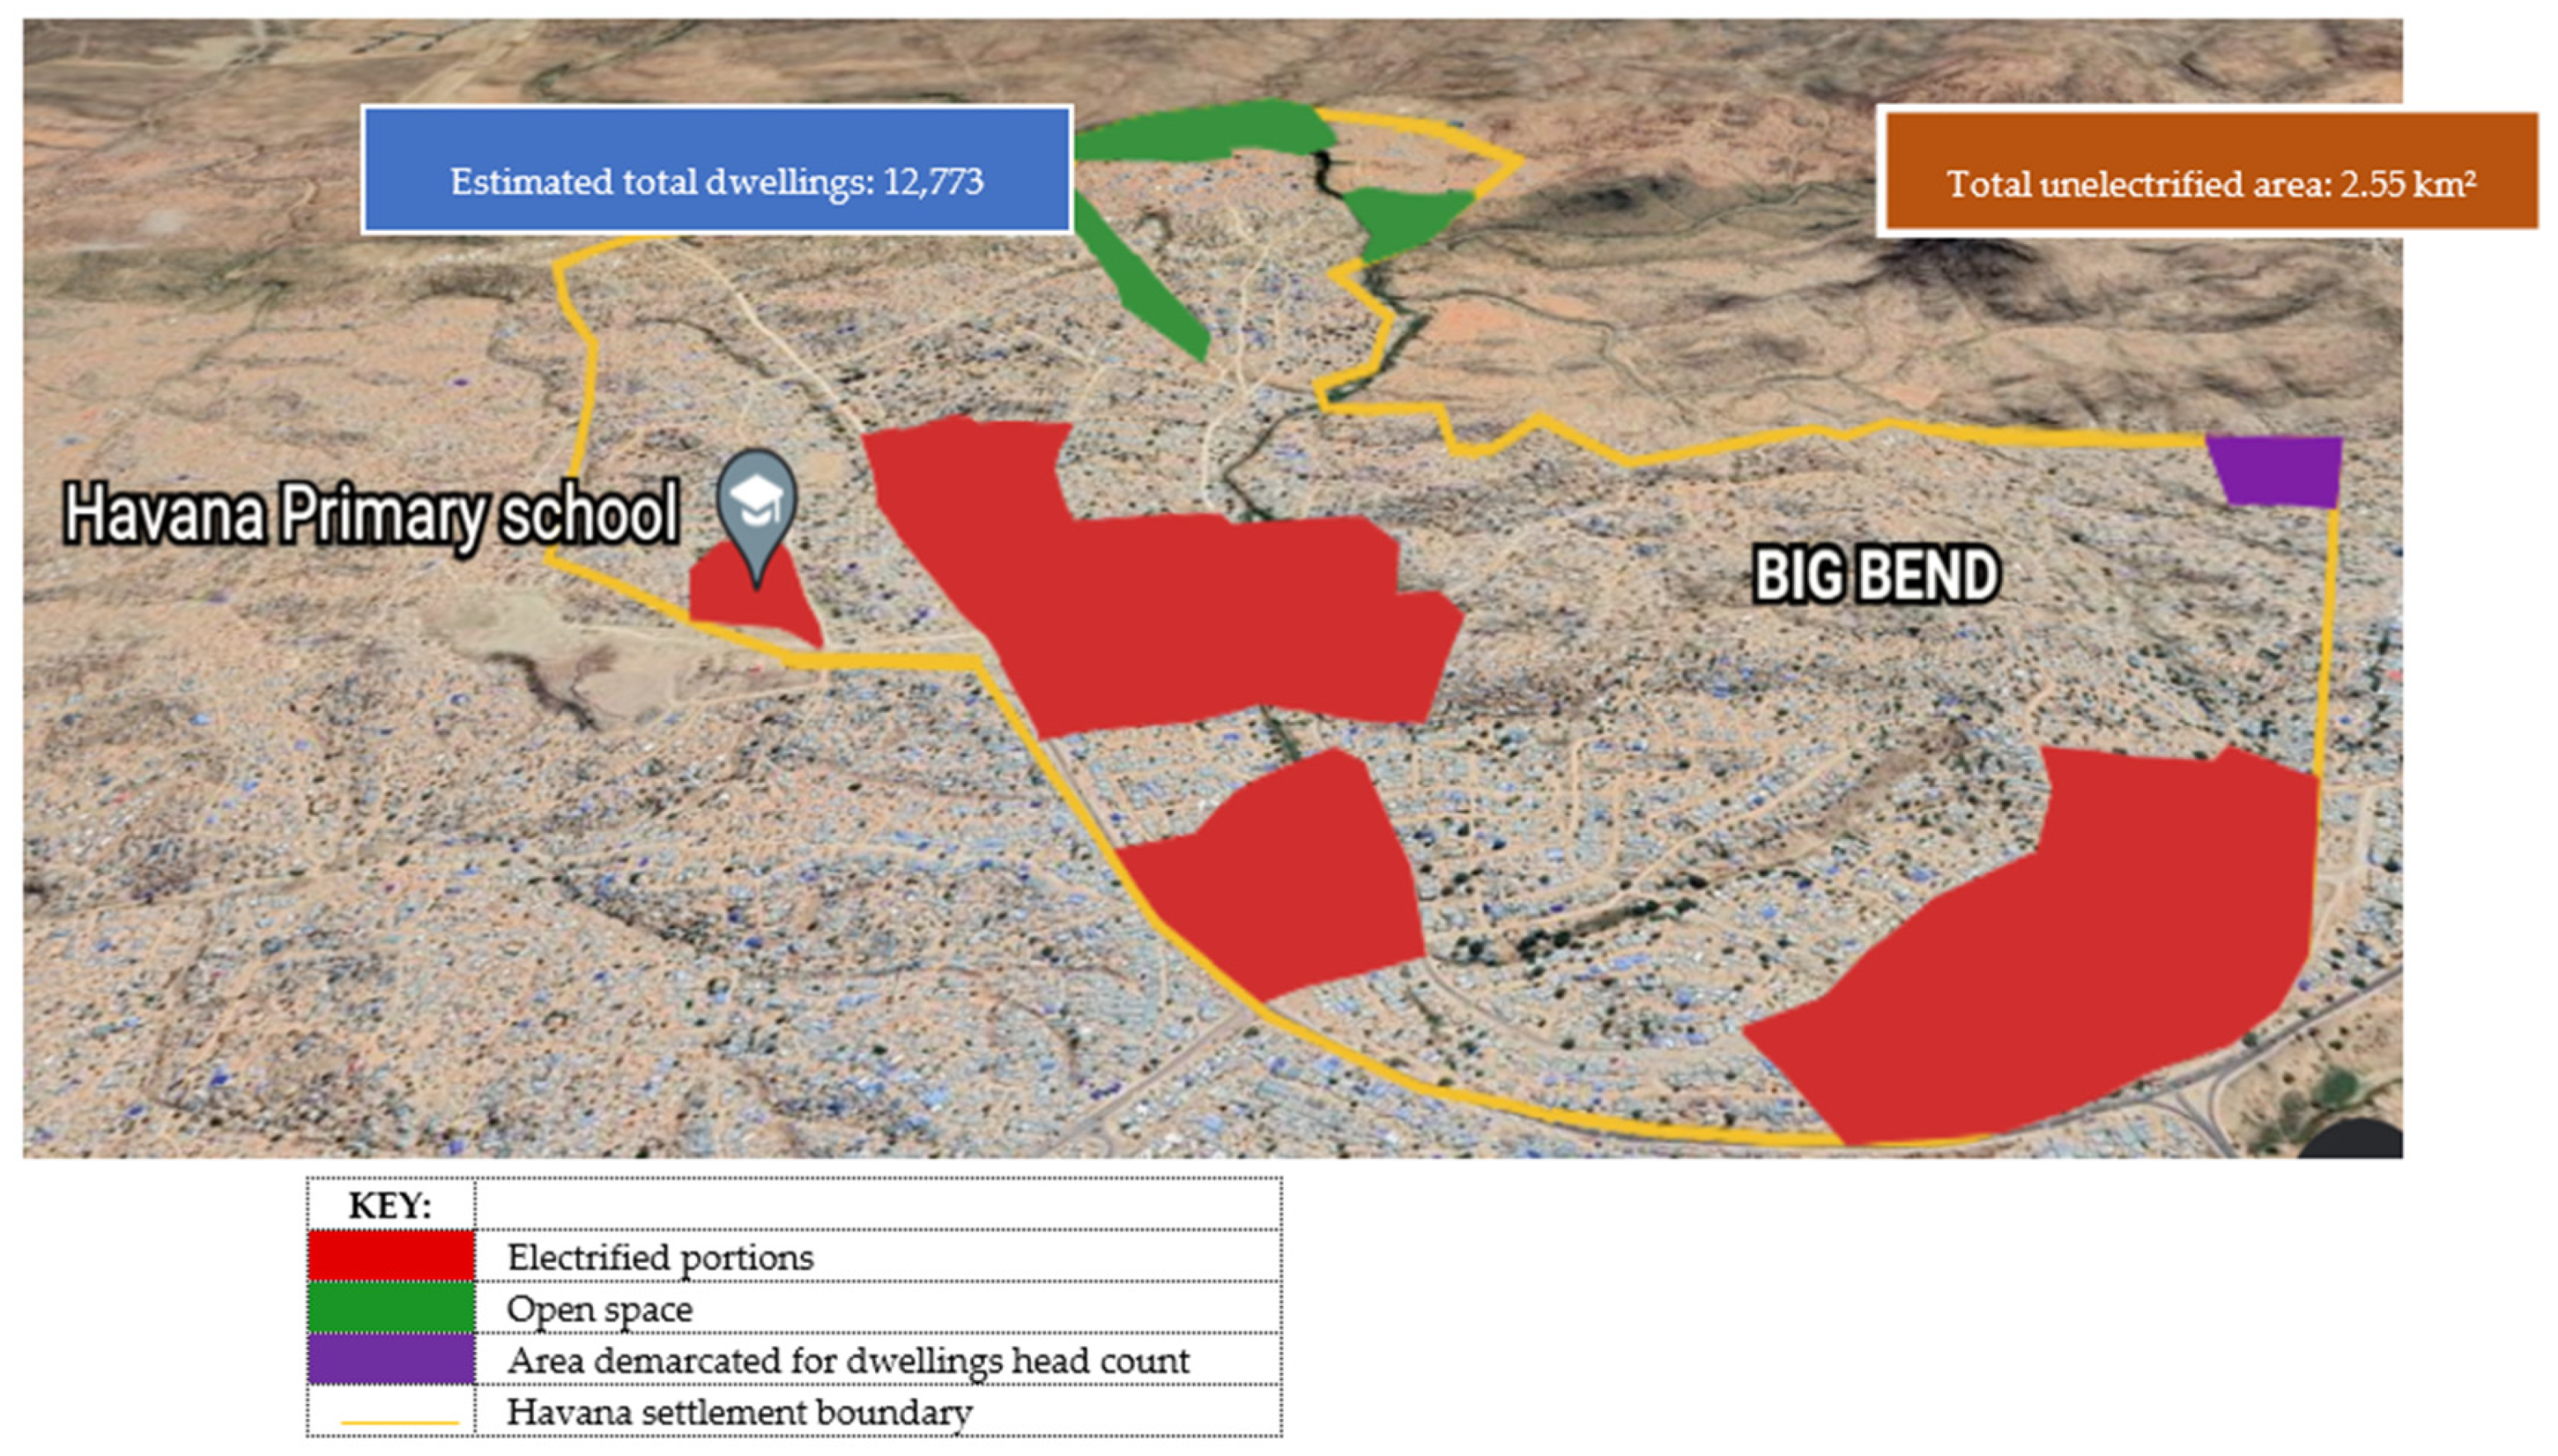
3.2. Load Assessment

Although extensions 1–3 of Havana settlement have been electrified since 2020 [84], actual electricity consumption data for the area could not be obtained. The load data pattern of similar electrified communities in the country are also limited. Therefore, the “bottom-up” approach [92,93,94] was used to formulate the daily load profile expected for the area as outlined in these steps:
  • Determined the surface area of the unelectrified Havana settlement.
  • Estimated the dwellings’ density per 100 m2 from the aerial and satellite imagery in Google Maps and then extrapolated to determine the total units in the area. A head count of about 3 dwellings per 100 m2 was observed.
  • Estimated the ratio of residential (80%), commercial (10%), and public institutions such as schools and clinics (10%). The commercial dwellings are comprised of small grocery shops and liquor shops, home businesses, and other informal businesses.
  • Divided the residential units into different classes and estimated expected the daily load. A class ratio of 65% Shack-12sqm, 25% Shack-24sqm, and 10% Brick-House were assumed. Each residential class was assumed to have the same number and types of appliances, which were operated at the same time window. The loads for commercial and public institutions were estimated as different scales of the Brick-House daily load. Details of the daily profile for Shack-24sqm are shown in Table 4, and the total load expected for the area in Table 5.
  • Ideal relative load demand curves of domestic and commercial profiles common to developing countries were assumed. Single-day curves are shown in Figure 5 and Figure 6, respectively. Relative load demand at any hour D r e l , t , is a normalized load (per unit) defined as the ratio between average hourly demand D t and peak demand D p , over a period of time T o .
    D r e l , t = ( D t D p )   for   0     t     T o
  • To make the load profiles more realistic, the daily relative demand profiles were first scaled by average daily consumption (kWh/day) before randomness was added. A 20% day-to-day variance and 10% hourly time-step variance were assumed.
Table 4. Shack-24sqm daily load profile (a 24 sqm unit segmented into 2 rooms housing a family of 4).
Load TypePower (W)QtyTotal Power (W)Total Daily Use (Hours)Daily Demand (kWh/Day)
Living room light1511520.030
Bedrooms lights1523020.060
Security light15115100.150
Single plate cooker1275112750.70.893
Fridge (150 lt = 5.3 Cu Ft)105110560.630
Cell phone charging921810.018
Radio1211220.024
Television (21″ LCD)150115060.900
Average energy demand (kWh/day)2.705
Average power demand (kW/day)0.113
Peak demand (kW/day)0.436
Table 5. Estimated daily load profile for the Havana settlement.
FacilityTotal UnitsUnit Demand (kWh/Day)Total Daily Demand (kWh/Day)% Daily Demand
Shack-12 sqm83031.7614,595.8838.12%
Shack-24 sqm31932.708636.2522.55%
Brick-House12777.549628.4025.14%
Liquor shops *10215.081540.544.02%
Mini grocery shops10216.581694.604.43%
Small-scale industries10220.732118.255.53%
Public services (e.g., schools, clinics, libraries)326.3879.150.21%
Total average energy demand (kWh/day)38,293.07
Average residential load (kWh/day)32,860.53
Average community load (kWh/day)5432.54
Total peak demand (kW/day)1595.54
* Locally known as shebeens or pubs.
In Figure 5, domestic demand is dominated by morning and evening peaks, whereas commercial demand in Figure 6 is uniformly distributed during the day with a single evening peak. Commercial loads would be dominated by liquor shops, hair salons, and other small businesses; while residential needs would mainly be for lighting, television, radios, phone charging, and refrigeration.

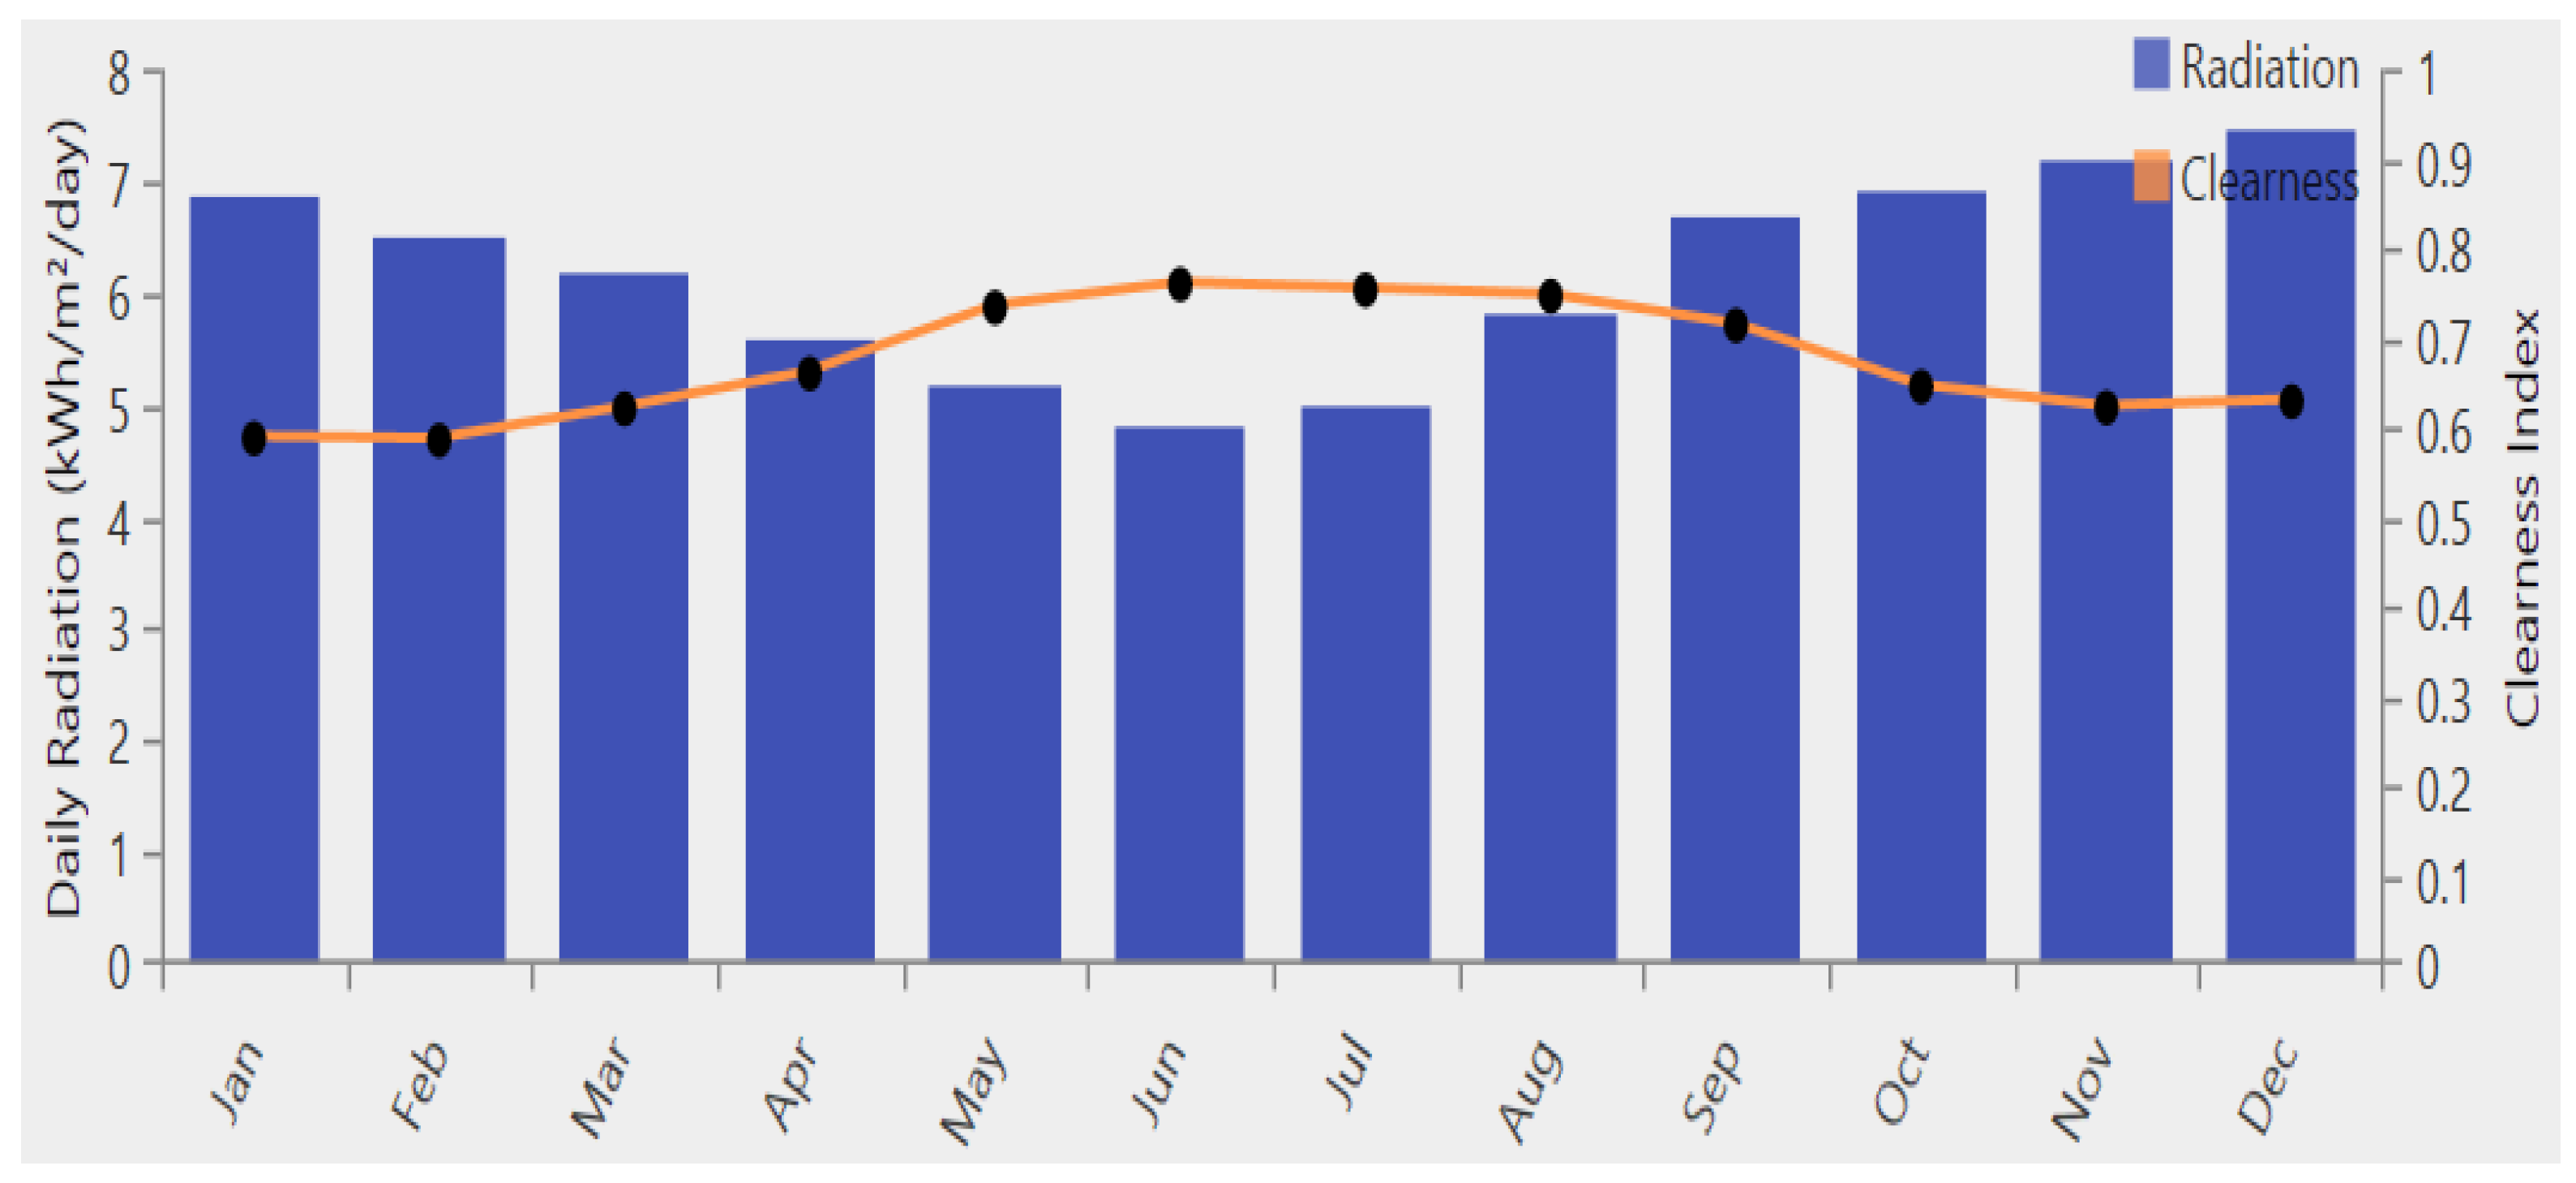
3.3. Renewable Resource Assessment

The study only considers solar and wind resources for the selected site. Both solar and wind data are obtained from NASA’s (National Aeronautics and Space Administration) database via HOMER software. The data set is comprised of long-term monthly averages of global horizontal irradiance recorded over a 22-year period. In Figure 7, the site has daily average solar radiation of 4.82 kWh/m2 in winter, 7.44 kWh/m2 in summer, and an annual average of 6.17 kWh/m2. The clearance index is between 0.58 and 0.78 in winter. Thus, 4 to 7 h of full sunlight is available at the site throughout the year and has potential to generate adequate electricity from solar photovoltaic (PV) modules.
Due to wide temperature range of the site (Figure 8), the effect of temperature on solar PV modules is considered. Temperature coefficient of −0.41%/°C of power, module efficiency of 14.91%, and PV derating factor of 80% are assumed. PV modules are modeled as fixed and tilted north at a 45° angle and assumed to use maximum power point tracking (MPPT).
The average wind speed for the site ranged from 4.34 to 6.50 m/s (Figure 9), with an annual average of 6.31 m/s. This translates between wind power classes 2 and 3, which can generate marginal to fair wind output.

3.4. System Component Capacities and Costs

3.4.1. Solar Photovoltaic Capacity

The solar photovoltaic output power capacity is a function of the site’s solar radiation, tilt angle, photovoltaic module rating, and temperature. HOMER calculates solar photovoltaic array power output as follows [60]:
P P V = Y P V f P V ( G T ¯ G T , S T C ) [ 1 + α P ( T c T c , S T C ) ] ,
where P P V is the solar photovoltaic output power, Y P V is the rated photovoltaic module capacity (kW), f P V is the photovoltaic module derating factor (%), G T ¯ is the photovoltaic array incident solar radiation at a given time (kW/m2), G T , S T C ¯ is the global incident solar radiation (1 kW/m2) under standard test conditions, α P is the power temperature coefficient (%/°C), T c is the temperature of a photovoltaic cell at a given time (°C), and T c , S T C is the temperature of a photovoltaic cell under standard test conditions (25 °C).

3.4.2. Wind Capacity

HOMER computes the wind turbine output power as a 4-steps process [60].
  • Generate statistically reasonable hourly time series wind data from monthly average wind speeds. This step is only performed when time-series data are not available, as with the case in this study.
  • Calculates the wind speed for the selected wind turbine’s hub height. A generic wind turbine of 3 kW rating and 50 m hub height is selected for the study.
  • Uses the wind turbine power curve to predict the amount of output power that can be produced at the wind speed computed in step 2, and at standard air density.
  • Adjusts the output power in step 3 for the actual air density as follows [60].
    P W T = ( A i A o ) · P W T , s t d ,
    where P W T is the wind turbine output power in kW, A i is the actual air density in kg/m3, A o is the air density at standard conditions (1.225 kg/m3), and P W T , s t d is the wind turbine output power in kW at standard.

3.4.3. Diesel Generator, Battery Storage, and Capacity

Generic HOMER components are used to model the diesel generator, lead acid batteries, and converter. Where applicable, a diesel generator and a battery system are used for backup supply and energy storage, respectively. Output from the diesel generator and battery system is computed as outlined by Ali et al. [10] and the HOMER manual [60].

3.4.4. Component Costs

In Table 6, a summary of the ratings and costs of system components used in this study is given.

3.5. Techno-Economic Analysis

Energy systems need to be sized properly to ensure accurate matching of supply and demand and to avoid under- or oversizing of the system that could lead to reduced reliability or increased costs, respectively. The intermittency behavior of power from renewable sources and load uncertainties makes it difficult to obtain optimal sizes of generating units that can cost-effectively meet the load demand. Therefore, use of HOMER software eases this process by minimizing the difference between generated power and demanded power over a period of time.
Δ P = i = 0 T o P g , i P d , i ,
where Δ P is the minimal power, ( P g , i ) is the supplied power, ( P d , i ) is the demanded power, and ( T o ) is the simulation time step, usually 60 min.
The main economic metrics used in this study to evaluate the economic sustainability of feasible renewable energy systems are net present costs (NPC), levelized cost of energy (LCOE), and discounted payback period.

3.5.1. Net Present Cost

The net present cost (NPC) is the present value of all systems costs to be incurred during its lifetime. It includes costs of capital, component replacements, operation and maintenance, fuel costs, and salvage. The NPC is calculated by aggregating total and annual discounted cash flows over the project lifetime. HOMER computes the NPC as follows [60]:
C n p c = C a n n , t o t C R F ( i , N ) ,   where   C R F = i ( 1 + i ) N ( 1 + i ) N 1 ,
where C n p c is the system net present costs, C a n n , t o t a l is total costs incurred annually, N is the interest period (project lifetime), i is the discounted rate, and C R F is the capital recovery factor, which divides an investment into a stream of equal annual payments over an interest period N .

3.5.2. Levelized Cost of Energy

Due to opposing cost characteristics between renewable and fossil-fuel-based generation systems, levelized cost of energy (LCOE) is used to assess the cost-competitiveness of energy systems. It combines all cost factors into a cost-per-unit measure (USD/kWh). Thus, LCOE represents the minimum unsubsidized price of energy. HOMER calculates LCOE as follows [60]:
C c o e = C a n n , t o t E p r i m + E d e f + E g r i d , s a l e s ,
where C c o e is the levelized cost of energy, C a n n , t o t is the total annualized system costs, E p r i m is the total amount of annual energy used to serve primary load, E d e f is the total amount of annual energy used to serve deferrable load, E g r i d , s a l e s is the total amount of annual energy sold to the grid per year (if any). E g r i d , s a l e s = 0 for off-grid systems.

3.5.3. Discounted Payback Period

Discounted payback period refers to how long it will take (years) to recover the cost of an initial investment, factoring in the time value of money. Since there is no actual revenue expected from an off-grid energy system, the cash flow from an investment is defined as annual savings from not having to pay for the investment or generating power from an alternative source. For instance, revenue for a renewable solar home system (PV and battery) can be defined as annual savings from using a diesel-only alternative (base case). By default, HOMER uses a fossil fuel-based off-grid configuration as the base case and computes the discounted payback period as follows [60]:
T d p = C o s t   o f   i n v e s t m e n t D i s c o u n t e d   a n n u a l   s a v i n g s = n = 0 N ( I n C F n ( 1 + r ) n ) ,
where T d p is the discounted payback period, I n is the initial investment in the nth period, C F n ( 1 + r ) n is the net discounted cash flow (i.e., discounted annual savings), r is the discount rate, n is the current year, and N is the project lifetime.

3.5.4. Other Economic Inputs

Apart from the system component costs, this study assumes other economic inputs listed in Table 7.

3.5.5. Potential Energy Configurations

The Potential for solar home systems (SHS) is explored using three off-grid energy configurations, for each type of dwelling. Scenarios considered are: (i) solar photovoltaic (PV) and batteries (BAT); (ii) solar photovoltaic and diesel generator (DG); and (iii) solar photovoltaic, diesel generator, and batteries. Henceforth, the three configurations are abbreviated as PV|BAT, PV|DG, and PV|DG|BAT.
In addition, the study considers two microgrid scenarios: a rooftop and a ground-based option. In the first case, solar PV arrays are assumed to be installed on a rooftop of one of the local schools. This option is valid when a dedicated land for a microgrid cannot be secured. The four energy configurations considered for SHS are simulated for a rooftop microgrid. Furthermore, a local school with a total shade-free rooftop area of 2200 m2 (275 m2/building) and a PV module efficiency of 14.9% is simulated. The solar PV power output is computed as follows [60]:
P P V = A P V · G T , S T C ¯ · ( η P V ) ,
where P P V is the PV array power output (kW), A P V is the rooftop surface area (m2), G T , S T C ¯ is the global incident solar radiation (1 kW/m2), and η P V is the PV module efficiency (%).
The second case considers a ground-based microgrid. In addition to the three off-grid energy configurations discussed above, a solar photovoltaic (PV), wind turbine (WT), diesel generator (DG), and batteries (BAT) setup (henceforth, PV|WT|DG|BAT) is simulated. The HOMER schematic diagrams used to model the SHS for Shack-24sqm load, and a roof-top microgrid are shown in Figure 10. A load ratio of 75% residential and 25% commercial load is assumed for a roof-top microgrid to cater to a limited solar PV area.

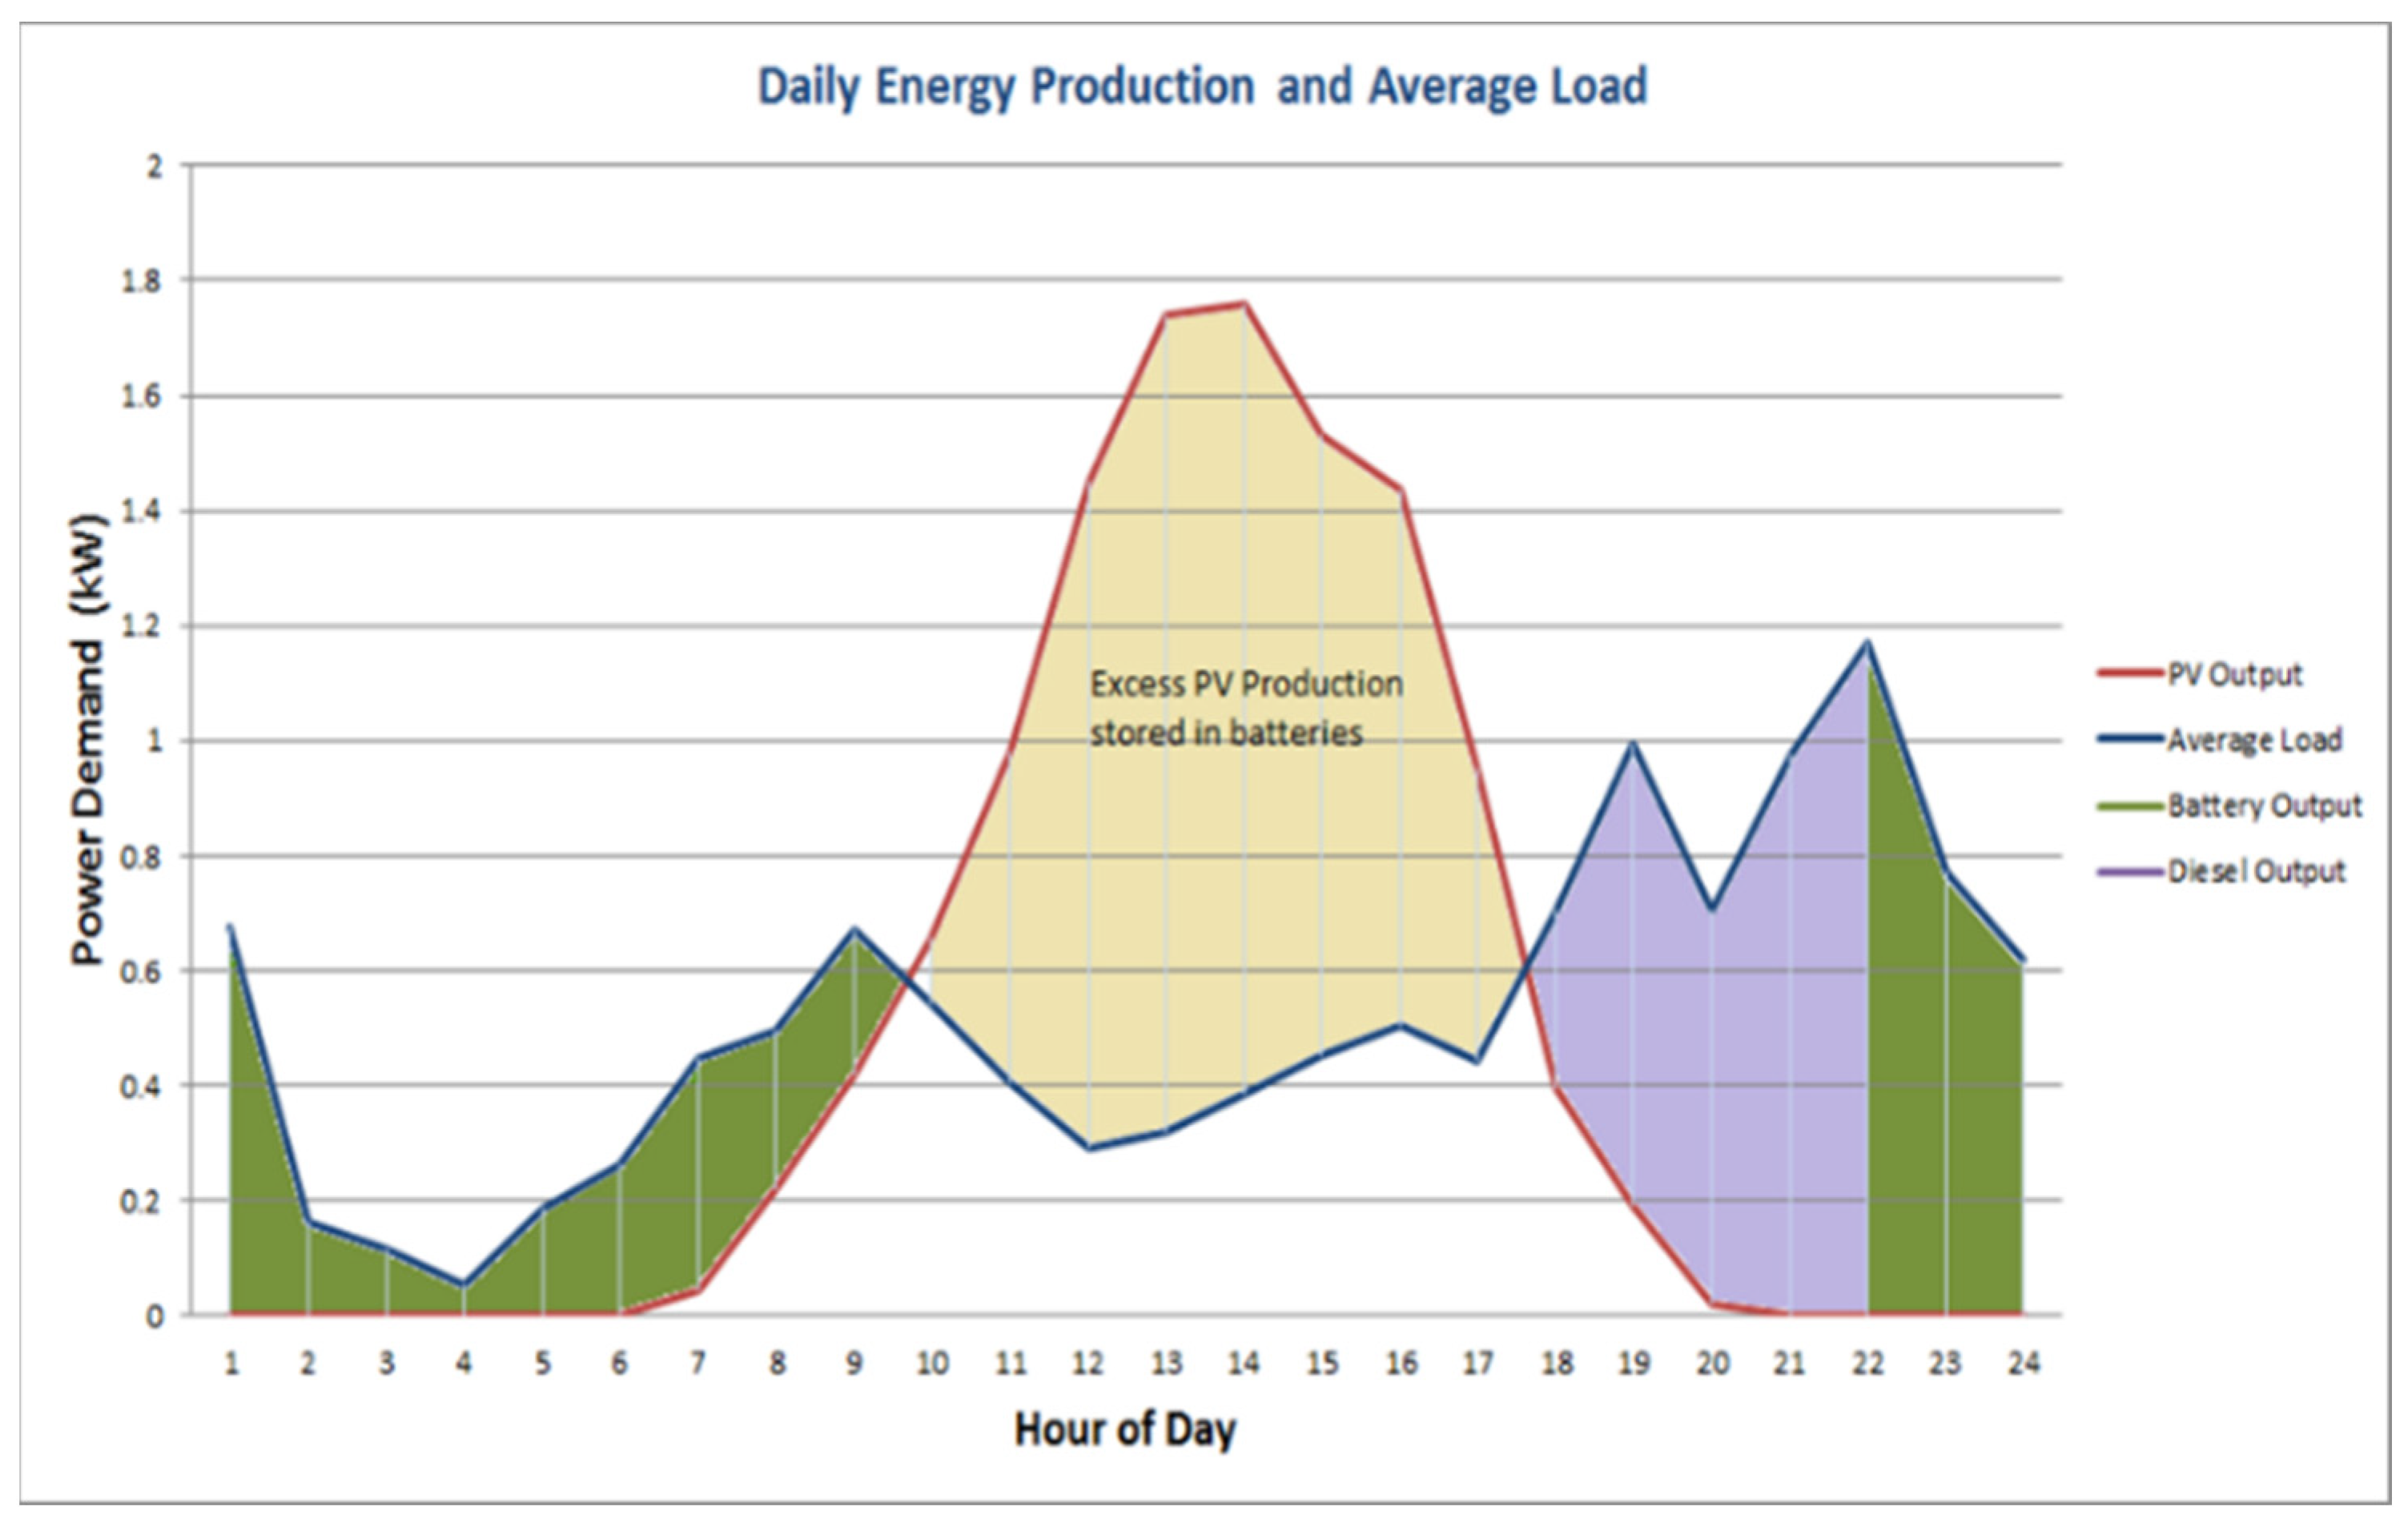
3.5.6. Energy Dispatching

HOMER uses two energy dispatching strategies to regulate operations of a diesel generator (DG) and charging/discharging of a battery (BAT) storage system to ensure economic energy balance between supply and load demand is at each time step. The first method, called load following (LF), allows the DG to be operated at its minimum rated capacity to serve the net load whenever the output from RES sources is not sufficient. In this case, the DG is not used to charge the battery storage, regardless of its state of charge, but solely serves the net load [102]. However, when the minimum DG output power is more than the net load, the excess DG power is directed to the baseload and RES excess power is reserved to charge the BAT. The second technique is the cycle-charging (CC), which allows the DG to always be operating at its maximum capacity to serve the net load and to use any excess power to charge the battery [102]. Irrespective of the dispatching strategy, however, whenever DG and BAT are simultaneously operated, HOMER always chooses the most economically available way to serve the load at each time step [103,104,105], as depicted in Figure 11. It can be observed that priority was given to BAT supply in hour 1–9 to serve the load instead of operating the DG, because BAT seemed economical during that time duration. At hour 18–22, and hour 22–24, energy was dispatched from DG and BAT, respectively. Although DG and BAT were both available, HOMER had to choose the cheapest available energy source at different times.

4. Results and Discussion

This study explores two potential off-grid electrification methods to supply electricity to the Havana informal settlement in Windhoek, with the aim of finding an optimal solution that can cost-effectively meet the load requirements. This section presents and discusses simulation results.

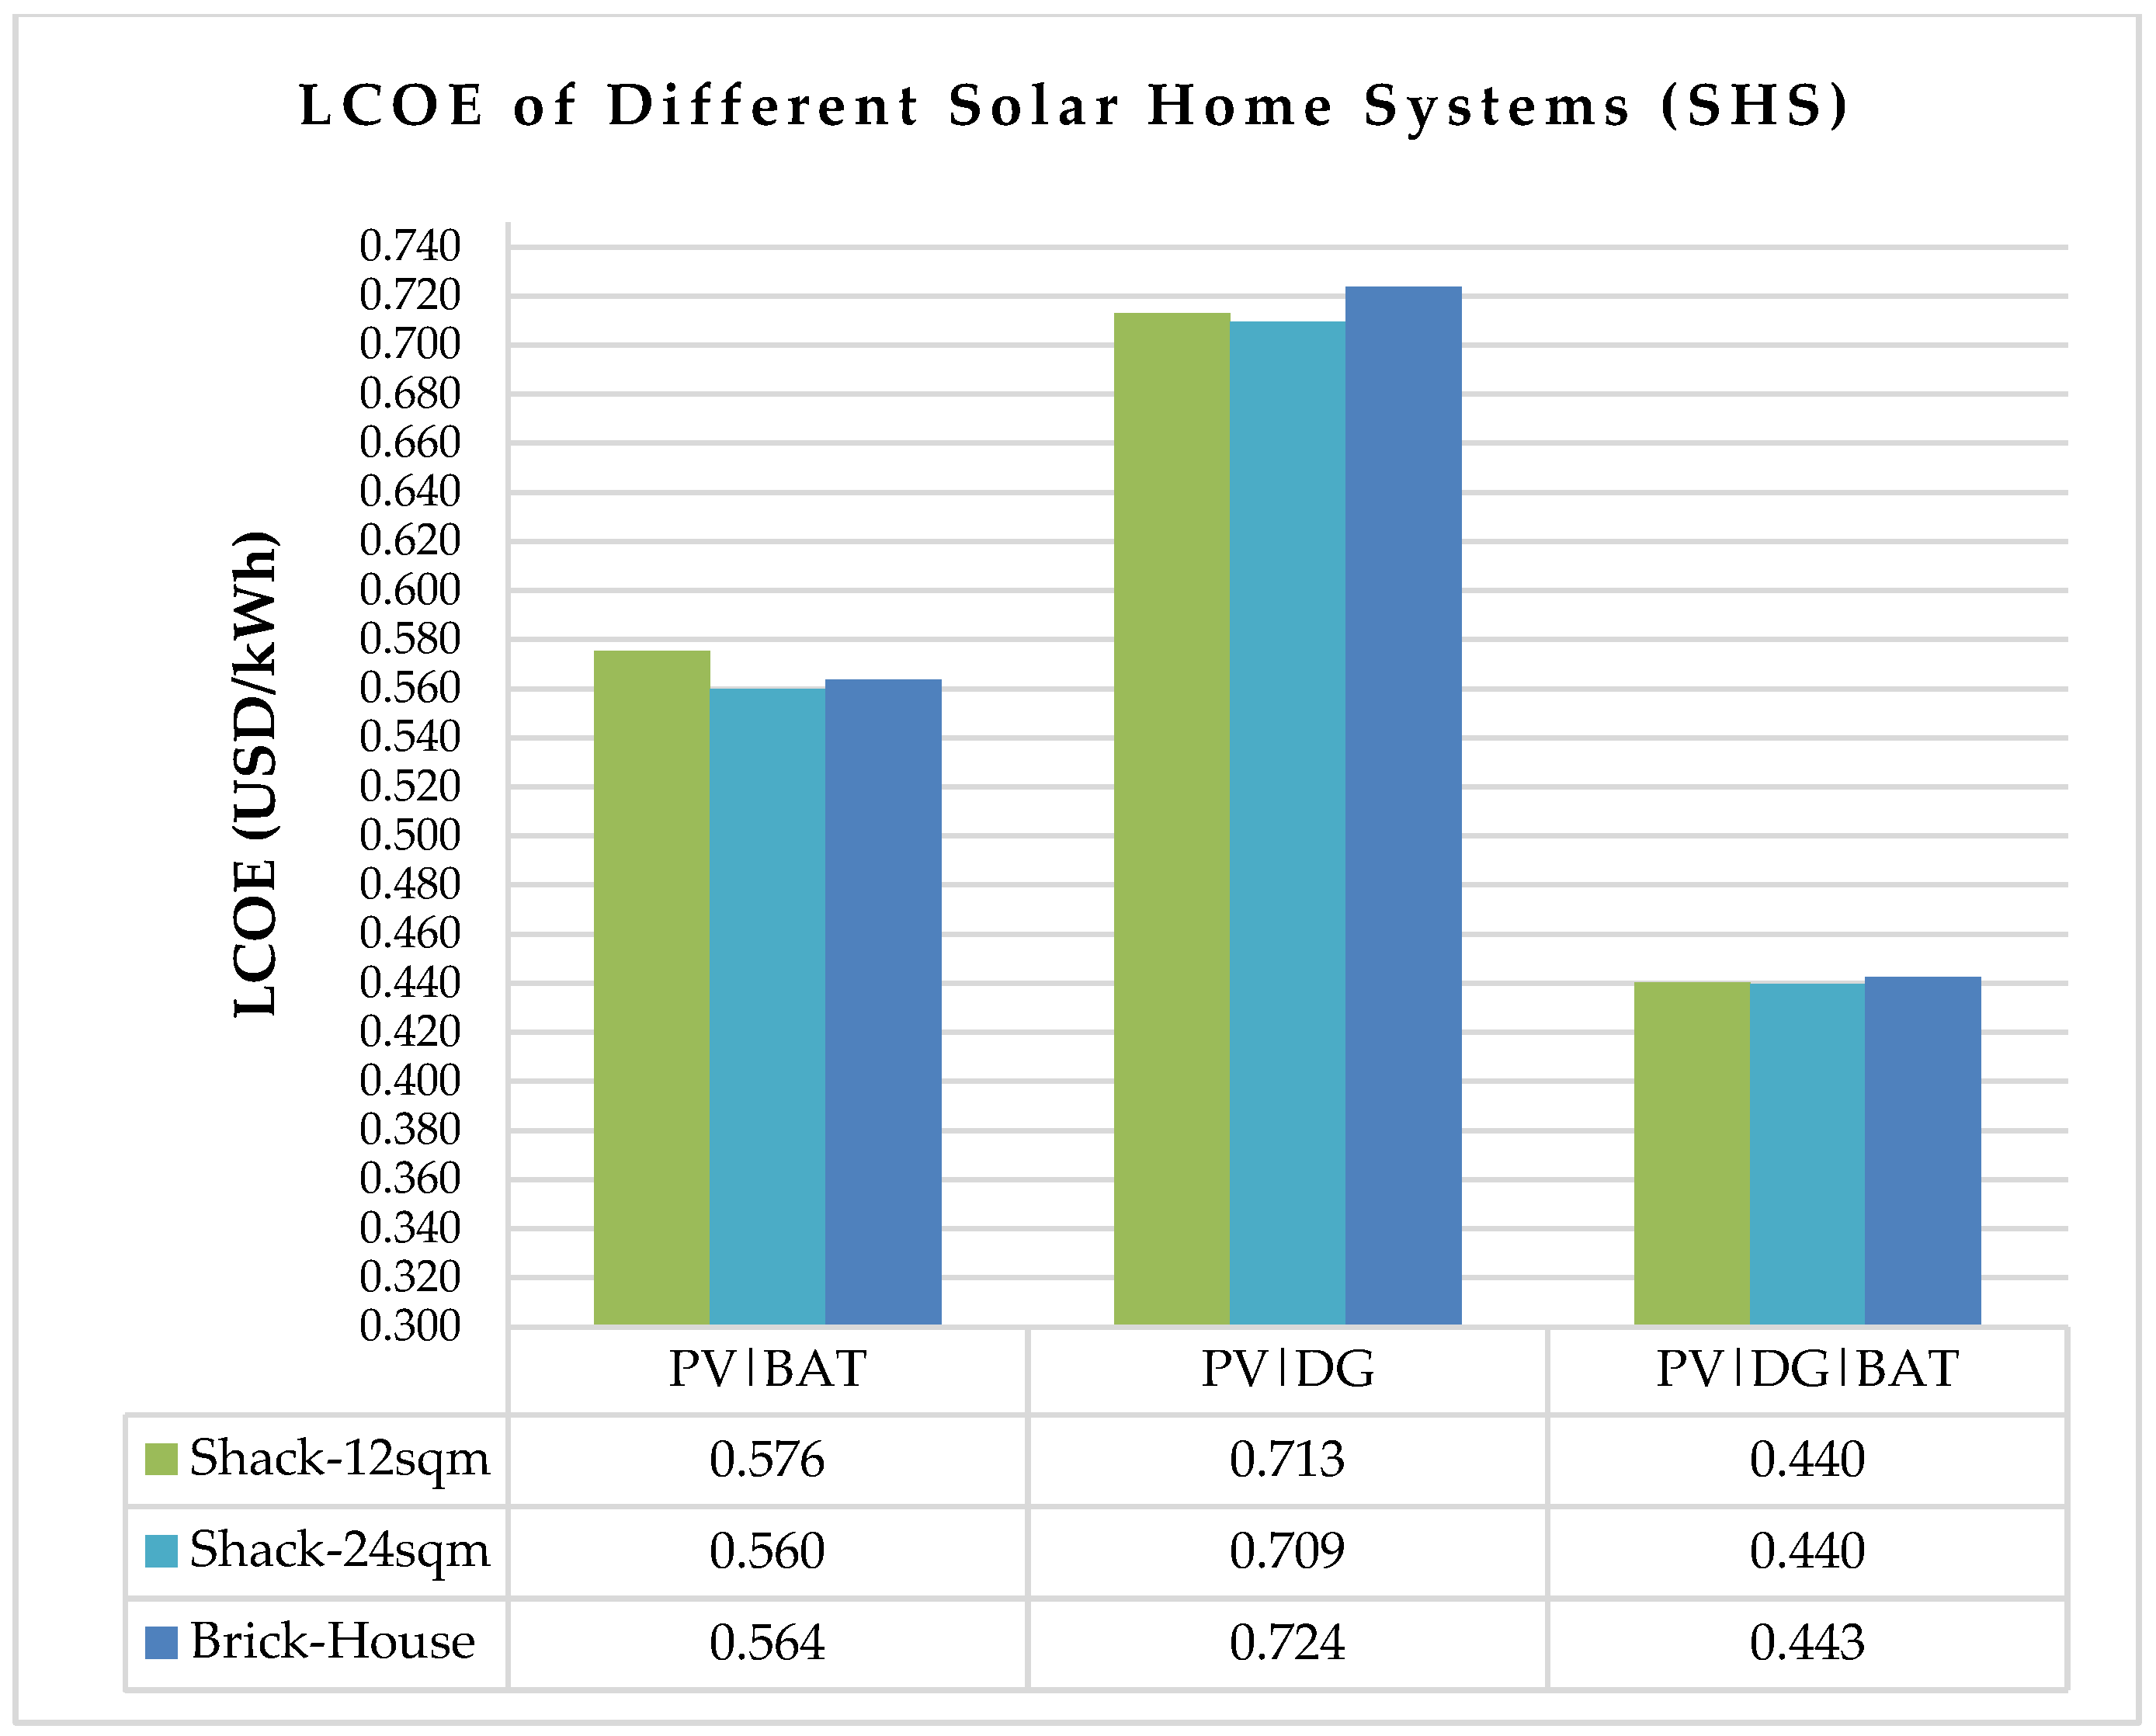
4.1. Electrification through Solar Home Systems (SHS)

Figure 12 compares the net present costs (NPC) of the three potential energy designs for each residential type. Expected daily load demand of 1.76 kWh, 2.71 kWh, and 7.54 kWh are considered for Shack-12sqm, Shack-24sqm, and BrickHouse-42sqm, respectively. It is observed that, for each energy configuration, NPC increases linearly with load demand. Costs of fuel and operation and maintenance (O&M) make up the largest share of NPC for designs that integrate diesel generators, while capital and replacement costs are the highest for a complete renewable option. For instance, in a solar photovoltaic and diesel generator (PV|DG) option, fuel and O&M costs together account for between 74% and 76% of the total cost. In a hybrid solar photovoltaic and batteries (PV|BAT), capital and replacement costs respectively account for 82% to 90% of NPC. Thus, a large initial investment is required to acquire a complete renewable solar home system.
In Figure 13, levelized cost of energy (LCOE) for different solar home systems is compared and ranges between USD 0.440/kWh and USD 0.724/kWh for different residential loads and energy configurations. The lowest LCOE is from a hybrid solar photovoltaic, diesel generator, and batteries (PV|DG|BAT). A lower LCOE is mainly influenced by the use of complementary energy sources and system efficiencies. Therefore, a hybrid PV|DG|BAT option offers the best economic metrics across all three residential load types. Its NPC range of USD 4738 to USD 20,404 is comprised of fuel costs (≈35%), operation and maintenance costs (≈17%), replacement costs (≈33%), and initial capital (≈16%).
Although the PV|DG|BAT configuration offers a minimum LCOE of USD 0.440/kWh, it is almost three times the current grid electricity tariff of USD 0.13/kWh [56] and, therefore, not competitive. In addition, it will have unintended consequences such as noise and air pollution, stemming from the mass and simultaneous use of diesel generators by residents. Furthermore, the need to constantly buy fuel and maintain diesel generators over the system’s lifetime would also deter investment from residents, even when the cost of initial investment is subsidized. Therefore, deploying the PV|DG|BAT option to each household in this community would not be environmentally responsive.

4.2. Electrification through Microgrids

The study compares two microgrid settings: the roof-mounted and ground-mounted. A roof-mounted microgrid with a solar PV capacity of 300 kW is designed to supply about 170 dwellings, comprised of a daily residential load of 2636 kWh and a commercial load of 879 kWh. A hybrid solar photovoltaic, diesel generator, and batteries (PV|DG|BAT) is the optimal option. The expected NPC, LCOE, and the payback period are USD 8.3 million, USD 0.386/kWh, and 3.14 years, respectively. To ensure the reliability of supply, fuel and Q&M costs will account for 38% and 15% of NPC, respectively.
Furthermore, a ground-mounted microgrid is designed to serve the entire un-electrified Havanna settlement, with an estimated residential and commercial average daily load of about 5435 kWh and 32,860 kWh, respectively. As shown in Figure 14, the hybrid solar photovoltaic, wind turbine, diesel generator, and batteries (PV|WT|DG|BAT) option offers the lowest NPC and LCOE. However, when compared to the next lowest option of hybrid PV|DG|BAT, its NPC and LCOE are only 3% lower, while its initial capital is 30% higher due to the costs of a wind turbine (WT). Since energy production and energy excess between the two models are similar, as noted in Table 8, the PV|DG|BAT option would be recommended for the selected site. It offers low capital investment, competitive NPC and LCOE, and ease of implementation. The expected NPC, LCOE, and payback period from the hybrid PV|DG|BAT are USD 90.8 million, USD 0.388/kWh, and 3.05 years, respectively.

4.3. Comparing Electrical Productions

A comparison of the LCOE of various feasible configurations is shown in Figure 15. The lowest LCOE of USD 0.377/kWh, is from a hybrid PV|WT|DG|BAT ground-mounted microgrid. Apart from system component costs, the use of complementary power sources and the energy dispatching technique can result in a lower LCOE. For instance, combining solar PV with wind, and dispatchable power sources, such as DG and/or BAT, can offset the limitations of each power source by minimizing initial capital and fuel costs.
Moreover, excess electricity observed in Table 8 is mainly due to non-dispatchable renewable sources, which do not always produce power at the time of need. Therefore, it needs to be controlled to maintain system frequency and bus voltages. Use of dump/resistive load in the form of a water heater or air cooler, and demand response, are common control techniques for off-grid solutions. In the case of the Havana settlement, a separate battery charging station can be considered as a dump load, which allows residents to charge their rechargeable equipment at a fee to offset this investment. With demand response, consumers are encouraged to operate certain loads at specific times for less tariff, thus reducing the need to operate a diesel generator to serve at peak load.

4.4. Sensitivity Analysis

A sensitivity analysis is performed on the PV|WT|DG|BAT ground-based microgrid to assess the impact of change in fuel price, load growth, and solar PV installed cost on NPC, LCOE, initial capital, and system capacity.

4.4.1. Fuel Price Variations

From February 2018 to February 2022, the highest fuel price increase recorded in Windhoek was 7.64% and the lowest price decrease was 2.2% [99]. Therefore, the diesel fuel price is varied between the two limits. A base diesel price of USD 1.08/L, recorded in February 2022, is used. Figure 16 shows that an increase in the diesel price by 7.64% increases all system costs, except capital costs, owing to reduced diesel generator capacity (as a means to save costs). A fuel price reduction of 2.2% decreases system costs, except for operating costs. This is due to the frequent use of the diesel generator to serve the net load. In each case, however, solar PV and wind capacity are reduced to maintain lower marginal costs. This implies that the diesel generator has to run longer to make up for the reduced renewable supply.

4.4.2. Load Variations

A load increase of 30% and 100% is simulated. The choice of 30% growth aligns with the expected annual growth of informal settlements in Namibia [10]. From Figure 17, system costs and component capacities increased to cater for load growth, with few exceptions. For instance, LCOE decreases with load growth because generated energy is efficiently put to use. Renewable energy systems tend to be oversized to increase reliability, thus resulting in large excess energy, which is mostly wasted in an off-grid system. When the load increases, existing excess energy is consumed, and generation capacity only needs to increase marginally to cater for load growth. With less unused energy, the cost of energy reduces.

4.4.3. PV Installed Costs Variations

As noted earlier, global solar PV module costs have declined in the past decade. For instance, between 2019 and 2020, the global annual cost of crystalline modules declined between 5% and 15% [28]. The southern African market has also witnessed an average annual decline of 7% between 2013 and 2020 [100]. Thus, solar PV module decreases of 5%, 7%, and 15% are considered as sensitivity values. Figure 18 shows that decreasing the solar PV module price by up to 15% does not yield a significant decrease in system costs, except for the LCOE. This is because wind energy and diesel generators are available for this model as alternative power sources to economically satisfy load demand.

4.5. Specific Implementation Considerations for the Selected Study Area

The Namibian energy sector adopted several policies to increase renewable share and to promote energy infrastructure investment. These include the National Energy Policy, National Electrification Policy, Independent Power Producer, Renewable Energy Policy, Off-grid Electrification Policy, and Modified Single Buyer market framework. Consequently, the renewable energy market has grown in the past five years [50,51]. Useful to the case study is the solar revolving fund (SRF) scheme that provides loans at subsidized interest rates to end users that install either a solar home system, solar water heating, or solar water pumping system [106]. The scheme employs an ownership model where end users can borrow money to purchase a solar system and retain full ownership at the end of the loan period. The shack owners or small business owners in the Havana settlement who qualifies for a maximum loan of about USD 2500 under the SRF [107] can invest in a PV|DG|BAT system, provided they limit diesel operations to certain hours to limit carbon emissions. Additionally, owners will have to take responsibility for securing their systems, since they will be prone to a high risk of theft.
Regarding microgrids, the rooftop setup is easier to set up compared to the ground-mounted option because of less capital and land requirements. This notwithstanding, given the socio-economic background of the target community, a government or development agent would be an ideal investor. An energy operator can then be appointed to operate and maintain the microgrid. Furthermore, microgrid investment will need to be subsidized to ensure affordability. Two incentive schemes are typical: capital-based subsidies and production-based subsidies. With capital-based subsidies, incentive policies reward system owners through upfront lump-sum cash rebates. For production-based, rewards are given for each unit of electricity produced. Capital-based subsidies on investment can reduce initial capital costs and costs of energy, therefore expediting implementation. In the case of production-based subsidy, operating costs will be reduced, and, therefore, operators can afford to reduce tariffs to customers and ensure affordability.

5. Conclusions and Recommendations

This paper explores the technical and economic viability of supplying electricity to the Havana informal settlement on the outskirts of Windhoek, Namibia. The study is limited to a hypothetical load profile and off-grid hybrid renewable energy systems employing solar photovoltaic and wind resources. Electrification schemes compared are: the deployment of individual solar home systems to each residence, and supplying power from either a roof-mounted or ground-mounted hybrid microgrid. HOMER software is used to model, simulate, and optimize potential energy systems to an optimal configuration that can satisfy the load at the lowest net present cost (NPC) and levelized cost of energy (LCOE). A sensitivity analysis is also carried out on the ground-mounted microgrid to understand the impact of varying diesel fuel prices, load demand, and solar PV module costs. The study concludes as follows:
Firstly, although the hybrid solar photovoltaic, diesel generator, and battery (PV|DG|BAT) offers better economic benefits for the solar home system scheme, it is not environmentally responsible. Deploying an energy system that relies on fossil fuels to each residence could result in high noise and air pollution when residents operate their diesel generators simultaneously, and is therefore not recommended for the entire community.
Secondly, both roof-mounted and ground-mounted microgrids are feasible for the selected community because they offer competitive NPC and LCOE that are in line with most literature. The hybrid PV|DG|BAT and PV|WT|DG|BAT are the optimal configurations for the roof-mounted and ground-mounted microgrid, at LCOE of USD 0.386/kWh and USD 0.388/kWh, respectively. Integrating a wind turbine (WT) in the ground-mounted option, however, does not offer significant benefits. The model’s initial capital is 30% higher and its savings in NPC and LCOE is around 3% compared to the next lowest energy option, the hybrid PV|DG|BAT. Therefore, the PV|DG|BAT configuration is preferred for microgrids rollout. Electricity tariffs, however, need to be subsidized to make it affordable to target consumers and ensure long-term economic sustainability of the microgrid. In terms of implementation, the roof-mounted option is recommended for a pilot project since its initial investment and land requirements are lower compared to the ground-mounted microgrid. If land can be secured within a reasonable timeframe, a scalable ground-mounted microgrid can be deployed to lower investment costs and implementation time. An appropriate business model is also needed to ensure commercial viability and timely revenue collection.
Thirdly, the sensitivity analysis on a hybrid PV|WT|DG|BAT microgrid reveals that an increase/decrease in diesel fuel price and load demand increases/decreases system component capacities and costs, but with few exceptions. For instance, operating costs increase when fuel prices reduce by 2.2%, because of the frequent use of a diesel generator to serve the load. Increasing load demand by 30% and 100% reduces LCOE, mainly because excess energy is economically put to use. Furthermore, reducing the PV module price in an energy system that includes wind and diesel power sources results in less than a 1% decrease in system costs, which is not a significant benefit. This is mainly because there was no need to increase PV capacity if energy can be economically dispatched from other sources.
The findings of this study agree with research on rural electrifications, in terms of optimal energy configurations. However, actual NPC and LCOE values mainly depend on the load profile accuracy and renewable energy resources available at the site. Commercial viability and practical implementation are also influenced by existing electricity tariffs, socio-economic conditions of the target community, and supporting energy policies. For instance, policy support that encourages private energy investors, tax incentives, and lower discount rates are crucial to commercial feasibility. Furthermore, a hybrid PV|DG|BAT standalone solar home system will be ideal for the selected community, because it offers lower costs, faster rollout time, and no additional cost for a reticulation network will be incurred. However, given the socio-economic status of the community, the system will not be affordable to many people and can have unintended environmental consequences.
Generally, the study confirms that off-grid electrification schemes can serve an informal settlement or any peri-urban area, because of socio-economic characteristics similar to rural areas. However, for a community that is close to an existing electrical grid, it will be recommended to assess its techno-economic viability of a grid-connected microgrid and grid extension. Since excess electricity of simulated off-grid options results in 47.4% to 75.4%, this could be sold to the grid to reduce costs and increase commercial viability. Therefore, future research work can consider the above, in addition to assessing reticulation network costs.

Author Contributions

Conceptualization, A.A.; methodology, A.A., S.N. and D.S.P.C.; software, A.A. and S.N.; validation, D.S.P.C. and G.G.; formal analysis, A.A.; investigation, A.A. and S.N.; resources, S.N., D.S.P.C. and G.G.; data curation, S.N.; writing—original draft preparation, A.A.; writing—review and editing, A.A., S.N., D.S.P.C. and G.G.; visualization, A.A.; supervision, D.S.P.C., and G.G.; project administration, D.S.P.C. and G.G.; funding acquisition, A.A. and G.G. All authors have read and agreed to the published version of the manuscript.

Funding

This research was partially funded by Deutscher Akademischer Austauschdienst (DAAD), grant number: 2021/22 (57552340).

Institutional Review Board Statement

Not applicable.

Informed Consent Statement

Not applicable.

Data Availability Statement

The data presented in this study are available on request from the corresponding author.

Acknowledgments

The authors would like to acknowledge initial input from Hashem Nehrir of the Montana State University, Bozeman, USA, and for administrative and facility supports from the Namibian University of Science and Technology, Department of Electrical Engineering, Windhoek, Namibia; the Institute of Acoustics and Building Physics, University of Stuttgart, Stuttgart, Germany; and the Nelson Mandela University, Port Elizabeth, South Africa; in conducting the research and writing of this paper. All individuals and institutional representatives have consented to the acknowledgements.

Conflicts of Interest

The authors declare no conflict of interest.

Abbreviations

BATBattery
CCCycle Charging
CCGTCombined Cycle Gas Turbine
DGDiesel Generator
EVElectric Vehicle
FCFuel Cell
GHIGlobal Horizontal Irradiance
GWeGiga Watt electric
HOMERHybrid Optimization of Multiple Energy Resources
HRESHybrid Renewable Energy Systems
IPPIndependent Power Producer
kWKilowatt
kWhkilowatt-hour
LLiter
LCDLiquid Crystal Display
LCOELevelized Cost of Energy
LFLoad Following
MATLABMatrix Laboratory (software)
MPPTMaximum Power Point Tracking
MSBModified Single Buyer
MWMegawatt
MWhMegawatt hour
NASANational Aeronautics and Space Administration
NPCNet Present Cost
O&MOperation and Maintenance
PESTELPolitical/Policy, Economic, Social, Technological, Environmental, and Legal
PVPhotovoltaic
SAPPSouthern African Power Pool
SHSSolar Home System
SRFSolar Revolving Fund
SSASub-Saharan Africa
WTWind Turbine

References

  1. William, R. Goal 7. Ensure Access to Affordable, Reliable, Sustainable, and Modern Energy for All, in A New Era in Global Health-Nursing and the United Nations 2030 Agenda for Sustainable Development; Springer: Berlin/Heidelberg, Germany, 2018. [Google Scholar] [CrossRef]
  2. Bos, K.; Chaplin, D.; Mamun, A. Benefits and challenges of expanding grid electricity in Africa: A review of rigorous evidence on household impacts in developing countries. Energy Sustain. Dev. 2018, 44, 64–77. [Google Scholar] [CrossRef]
  3. IEA; IRENA; The World Bank; World Health Organization. Tracking SDG 7: The Energy Progress Report 2020; IEA: Paris, France, 2020. [Google Scholar]
  4. Brew-Hammond, A. Energy access in Africa: Challenges ahead. Energy Policy 2010, 38, 2291–2301. [Google Scholar] [CrossRef]
  5. IRENA. Energy Profile—Namibia. 2021. Available online: https://www.irena.org/IRENADocuments/Statistical_Profiles/Africa/Namibia_Africa_RE_SP.pdf (accessed on 27 February 2022).
  6. The World Bank. Access to Electricity (% of Population)—Namibia. 2022. Available online: https://data.worldbank.org/indicator/EG.ELC.ACCS.ZS?locations=NA (accessed on 27 February 2022).
  7. Tenenbaum, B.; Greacen, C.; Siyambalapitiya, T.; Knucles, J. From the Bottom Up: How Small Power Producers and Mini-Grids Can Deliver Electrification and Renewable Energy in Africa; World Ban Publications: Washington, DC, USA, 2014; pp. 1–30. [Google Scholar]
  8. Lennon, J. How Namibia’s Housing Shortage Became a Humanitarian Crisis. 2018. Available online: https://jade-lennon.medium.com/how-namibias-housing-shortage-became-a-humanitarian-crisis-eef05ba14b9b (accessed on 27 February 2022).
  9. Endjala, T.; Botes, L. Surviving like a Bird: Livelihood Coping Strategies in an Informal Settlement of Windhoek, Namibia. Afr. Sociol. 2020, 24, 151–173. [Google Scholar]
  10. Weber, B.; Mendelsohn, J. Informal Settlements in Namibia: Their Nature and Growth; Development Workshop Namibia: Windhoek, Namibia, 2017; Available online: https://www.raison.com.na/sites/default/files/Informal-Settlements-in-Namibia-Book-Web.pdf (accessed on 2 March 2022).
  11. Republic of South Africa. Informal Settlements Policy Guidelines for Integrated National Electrification Programme (INEP); Department of Energy: Pretoria, South Africa, 2018. Available online: http://www.energy.gov.za/files/policies/electrification/Informal-Settlements-Policy-Guidelines-for-INEP.pdf (accessed on 2 March 2022).
  12. Republic of Namibia. Response to the Questionnaire of Informal Settlements in Namibia and Human Rights; Ministry of Justice: Windhoek, Namibia, 2017. Available online: https://www.ohchr.org/sites/default/files/Documents/Issues/Housing/InformalSettlements/Namibia.pdf (accessed on 2 March 2022).
  13. Singh, M.; Balachandra, P. Microhybrid Electricity System for Energy Access, Livelihoods, and Empowerment. Proc. IEEE 2019, 107, 1995–2007. [Google Scholar] [CrossRef]
  14. Opiyo, N.N. How solar home systems temporally stimulate increasing power demands in rural households of Sub-Saharan Africa. Energy Trans. 2020, 4, 141–153. [Google Scholar] [CrossRef]
  15. Pelz, S.; Pachauri, S.; Groh, S. A critical review of modern approaches for multidimensional energy poverty measurement. Wiley Interdiscip. Rev. Energy Environ. 2018, 7, e304. [Google Scholar] [CrossRef] [Green Version]
  16. IRENA. Fostering Livelihoods with Decentralised Renewable Energy: An Ecosystem Approach. 2022. Available online: https://www.irena.org/-/media/Files/IRENA/Agency/Publication/2022/Jan/IRENA_Livelihood_Decentralised_Renewables_2022.pdf (accessed on 2 March 2022).
  17. Hussein, M.A. Analysis of energy as a precondition for improvement of living conditions and poverty reduction in sub-Saharan Africa. Sci. Res. Essays 2012, 7, 2656–2666. [Google Scholar] [CrossRef]
  18. Markandya, A.; Wilkinson, P. Electricity generation and health. Lancet 2007, 370, 979–990. [Google Scholar] [CrossRef]
  19. Sverdlik, A. Ill-health and poverty: A literature review on health in informal settlements. Environ. Urban. 2011, 23, 979–990. [Google Scholar] [CrossRef]
  20. Ortega, N.; Curto, A.; Dimitrova, A.; Nunes, J.; Rasella, D.; Sacoor, C.; Tonne, C. Health and environmental impacts of replacing kerosene-based lighting with renewable electricity in East Africa. Energy Sustain. Dev. 2021, 63, 16–23. [Google Scholar] [CrossRef]
  21. Republic of Namibia. National Electrification Policy; Ministry of Mines and Energy: Windhoek, Namibia, 2020. Available online: https://www.ecb.org.na/images/docs/Economic_Regulation/1st%20DRAFT%20-%20National%20Electrification%20Policy%20-%20Rev%202%20-%2020200916.pdf (accessed on 2 March 2022).
  22. Jain, P.K.; Jain, P.; Dhafana, P. Addressing Barriers to Off-Grid Rural Electrification in Africa: The Botswana and Namibia Experience. 2014. Available online: https://www.researchgate.net/publication/281612732 (accessed on 2 March 2022).
  23. Hoeck, I.; Steurer, E.; Dolunay, Ö.; Ileka, H. Challenges for off-grid electrification in rural areas. Assessment of the situation in Namibia using the examples of Gam and Tsumkwe. Energy Ecol. Environ. 2021. [Google Scholar] [CrossRef]
  24. Namibia Power Corporation. Nampower Annual Report 2021; Nampower: Windhoek, Namibia, 2021; Available online: https://www.nampower.com.na/public/docs/annual-reports/NamPower/Annual/Report/202021.pdf (accessed on 6 May 2022).
  25. von Oertzen, D. State of the Namibian Electricity Sector, Windhoek; Konrad-Adenauer-Stiftung: Bonn, Germany, 2019. [Google Scholar]
  26. Akpeji, K.O.; Olasoji, A.O.; Gaunt, C.; Oyedokun, D.T.O.; Awodele, K.O.; Folly, K.A. Economic impact of electricity supply interruptions in south Africa. SAIEE Afr. Res. J. 2020, 111, 73–87. [Google Scholar] [CrossRef]
  27. NREL. Documenting a Decade of Cost Declines for PV Systems. 2021. Available online: https://www.nrel.gov/news/program/2021/documenting-a-decade-of-cost-declines-for-pv-systems.html (accessed on 27 February 2022).
  28. Hansen, K. Decision-making based on energy costs: Comparing levelized cost of energy and energy system costs. Energy Strategy Rev. 2019, 24, 68–82. [Google Scholar] [CrossRef]
  29. IRENA. World Energy Transitions Outlook 2022: 1.5 °C Pathway. 2022. Available online: https://www.irena.org/-/media/Files/IRENA/Agency/Publication/2022/Mar/IRENA_World_Energy_Transitions_Outlook_2022.pdf (accessed on 10 May 2022).
  30. Lou, X.; Li, L.M.W.; Xia, W.; Zhu, Q. A meta-analysis of temporal shifts in environmental concern between 1994 and 2017: An examination of the new environmental paradigm. Anthropocene 2022, 38, 100335. [Google Scholar] [CrossRef]
  31. Solar Plaza, Top 5 Fastest-Growing Solar Markets in Africa. 2019. Available online: https://www.qualenergia.it/wp-content/uploads/2019/09/White-Paper-The-Big-5-Africa-fastest-growing-solar-energy-markets.pdf (accessed on 27 February 2022).
  32. IRENA. Global Renewables Outlook: Energy Transformation 2050. 2020. Available online: https://www.irena.org/publications/2020/Apr/Global-Renewables-Outlook-2020 (accessed on 10 May 2022).
  33. IRENA. Renewable Power Generation Costs 2020. 2020. Available online: https://www.irena.org/-/media/Files/IRENA/Agency/Publication/2021/Jun/IRENA_Power_Generation_Costs_2020.pdf (accessed on 2 March 2022).
  34. Feldman, D.; Ramasamy, V.; Fu, R.; Ramdas, A.; Desai, J.; Margolis, R.U.S. Solar Photovoltaic System and Energy Storage Cost Benchmark: Q1 2020. 2020. Available online: https://www.nrel.gov/docs/fy21osti/77324.pdf (accessed on 2 March 2022).
  35. Fu, R.; James, T.L.; Chung, D.; Gagne, D.; Lopez, A.; Dobos, A. Economic competitiveness of U.S. utility-scale photovoltaics systems in 2015: Regional cost modeling of installed cost ($/W) and LCOE ($/kWh). In Proceedings of the 2015 IEEE 42nd Photovoltaic Specialist Conference (PVSC 2015), New Orleans, LA, USA, 14–19 June 2015. [Google Scholar] [CrossRef]
  36. Namibia Statistic Agency. Namibia 2011 Census Atlas. 2013. Available online: https://nsa.org.na/page/publications/ (accessed on 10 May 2022).
  37. Info-Namibia, Climate and Weather of Namibia. 2022. Available online: https://www.info-namibia.com/info/namibia-weather (accessed on 2 March 2022).
  38. The World Bank. Namibia Climatology Climate Change Knowledge Portal. 2022. Available online: https://climateknowledgeportal.worldbank.org/country/namibia/climate-data-historical (accessed on 2 March 2022).
  39. Energypedia. Namibia Energy Situation. 2022. Available online: https://energypedia.info/wiki/Namibia_Energy_Situation#Renewable_Energy (accessed on 11 May 2022).
  40. Solargis. Solar Resource Maps and GIS Data for 200+ Countries|Solargis. 2022. Available online: https://solargis.com/maps-and-gis-data/download/namibia (accessed on 2 March 2022).
  41. Global Solar Atlas. Global Solar Atlas. Available online: https://globalsolaratlas.info/download/namibia (accessed on 27 February 2022).
  42. Ministry of Mines and Energy. Wind Energy. 2022. Available online: https://mme.gov.na/energy/ene_wind.php (accessed on 2 March 2022).
  43. Beck, J.; Markstein, M. State and Trends of the Namibian Bush Biomass Sector. 2019. Available online: https://www.dasnamibia.org/?wpfb_dl=129 (accessed on 2 March 2022).
  44. National Petroleum Corporation of Namibia. Kudu gas-NAMCOR. 2022. Available online: https://www.namcor.com.na/kudu-gas/ (accessed on 10 May 2022).
  45. Electricity Control Board. Annual Report 2021; ECB: Windhoek, Namibia, 2021; Available online: https://ecb.org.na/images/docs/Annual%20Reports/ECB%20Annual%20Report%202021.pdf (accessed on 2 March 2022).
  46. Republic of Namibia. Electricity Supply Industry Detailed Market Design; Ministry of Mines and Energy: Windhoek, Namibia, 2019. Available online: https://www.ecb.org.na/images/docs/Rules_and_Regulations/MSB/MSB_Detailed_Design_Report.pdf (accessed on 27 February 2022).
  47. Republic of Namibia. National Energy Policy; Ministry of Mines and Energy: Windhoek, Namibia, 2017. Available online: https://www.mme.gov.na/files/publications/fd8_National%20Energy%20Policy%20-%20July%202017.pdf (accessed on 27 February 2022).
  48. Republic of Namibia. National Renewable Energy Policy for Namibia; Ministry of Mines and Energy: Windhoek, Namibia, 2017. Available online: https://www.mme.gov.na/files/publications/03f_National%20Renewable%20Energy%20Policy%20-%20July%202017.pdf (accessed on 27 February 2022).
  49. World Economic Forum. How Namibia Is Moving towards a Green and Blue Economy. 2021. Available online: https://www.weforum.org/agenda/2021/10/namibia-is-positioned-to-become-the-renewable-energy-hub-of-africa/ (accessed on 10 May 2022).
  50. Saure Energy. Top 5 Fastest-Growing Solar Markets in Africa. 2022. Available online: https://www.saurenergy.com/solar-energy-news/top-5-fastest-growing-solar-markets-in-africa (accessed on 2 March 2022).
  51. Rödl & Partner. Namibia—A small but Attractive Market. 2022. Available online: https://www.roedl.com/insights/renewable-energy/2017-02/namibia-small-attractive-market (accessed on 11 May 2022).
  52. United Nations Namibia. Namibia Socio-Economic Recovery Plan. 2021. Available online: https://namibia.un.org/sites/default/files/2021-06/UN%20SERP%20Report.pdf (accessed on 11 May 2022).
  53. Perez-DeLaMora, D.A.; Quiroz-Ibarra, J.E.; Fernandez-Anaya, G.; Hernandez-Martinez, E.G. Roadmap on community-based microgrids deployment: An extensive review. Energy Rep. 2021, 7, 2883–2898. [Google Scholar] [CrossRef]
  54. Yon, K.; Alvarez-Herault, M.C.; Raison, B.; Khon, K.; Vai, V.; Bun, L. Microgrids planning for rural elec-trification. In Proceedings of the 2021 IEEE Madrid PowerTech, PowerTech 2021-Conference Proceedings, Madrid, Spain, 28 June–2 July 2021. [Google Scholar] [CrossRef]
  55. Meyer, E.L.; Overen, O.K. Towards a sustainable rural electrification scheme in South Africa: Analysis of the Status quo. Energy Rep. 2021, 7, 4273–4287. [Google Scholar] [CrossRef]
  56. Mishra, M.; Patnaik, B.; Biswal, M.; Hasan, S.; Bansal, R.C. A systematic review on DC-microgrid protection and grounding techniques: Issues, challenges and future perspective. Appl. Energy 2022, 313, 118810. [Google Scholar] [CrossRef]
  57. Yang, W.; Sparrow, S.N.; Ashtine, M.; Wallom, D.C.H.; Morstyn, T. Resilient by design: Preventing wildfires and blackouts with microgrids. Appl. Energy 2022, 313, 118793. [Google Scholar] [CrossRef]
  58. Boche, A.; Foucher, C.; Villa, L.F.L. Understanding Microgrid Sustainability: A Systemic and Compre-hensive Review. Energies 2022, 15, 2906. [Google Scholar] [CrossRef]
  59. SolarTown. Rural Electrification with Solar Energy: Microgrids vs. Solar Home Systems. 2022. Available online: https://solartown.com/learning/solar-panels/rural-electrification-with-solar-energy-microgrids-vs-solar-home-systems/ (accessed on 11 May 2022).
  60. HOMER Pro. Optimize Your Renewable Hybrid Power System. HOMER® Energy. 2022. Available online: Moz-extension://3f77186b-2803-443f-8635-06142985ec0d/enhanced-reader.html?openApp&pdf=https%3A%2F%2Fwww.homerenergy.com%2Fpdf%2FHomer-Product-Overview.pdf (accessed on 1 March 2022).
  61. Ali, F.; Ahmar, M.; Jiang, Y.; AlAhmad, M. A techno-economic assessment of hybrid energy systems in rural Pakistan. Energy 2021, 215, 119103. [Google Scholar] [CrossRef]
  62. Yavor, K.M.; Bach, V.; Finkbeiner, M. Resource assessment of renewable energy systems—A review. Sustainability 2021, 13, 6107. [Google Scholar] [CrossRef]
  63. Hamatwi, E.; Nyirenda, C.N.; Davidson, I.E. Cost Optimization and Design of a Hybrid Distributed Generation System for a DC Microgrid. In Proceedings of the 2018 IEEE PES/IAS PowerAfrica, Cape Town, South Africa, 28–29 June 2018. [Google Scholar] [CrossRef]
  64. Alkafaji, A.S.; Al-Samawi, A.A.; Trabelsi, H. Hybrid Energy Storage Review for Renewable Energy System Technologies and Applications. In Proceedings of the 2021 18th International Multi-Conference on Systems, Signals & Devices (SSD), Monastir, Tunisia, 22–25 March 2021. [Google Scholar] [CrossRef]
  65. Tobajas, J.; Garcia-Torres, F.; Roncero-Sánchez, P.; Vázquez, J.; Bellatreche, L.; Nieto, E. Resilience-oriented schedule of microgrids with hybrid energy storage system using model predictive control. Appl. Energy 2022, 306, 118092. [Google Scholar] [CrossRef]
  66. Bhandari, B.; Lee, K.T.; Lee, G.Y.; Cho, Y.M.; Ahn, S.H. Optimization of hybrid renewable energy power systems: A review. Int. J. Precis. Eng. Manuf. Technol. 2015, 2, 99–112. [Google Scholar] [CrossRef]
  67. Gan, J.; Li, J.; Qi, W.; Kurban, A.; He, Y.; Guo, S. A Review on Capacity Optimization of Hybrid Renewable Power System with Energy Storage. In E3S Web of Conferences; EDP Sciences: Les Ulis, France, 2019; p. 118. [Google Scholar] [CrossRef]
  68. Parhizi, S.; Lotfi, H.; Khodaei, A.; Bahramirad, S. State of the art in research on microgrids: A review. IEEE Access 2015, 3, 890–925. [Google Scholar] [CrossRef]
  69. Uddin, M.N.; Biswas, M.M.; Nuruddin, S. Techno-economic impacts of floating PV power generation for remote coastal regions. Sustain. Energy Technol. Assess. 2022, 51, 101930. [Google Scholar] [CrossRef]
  70. Seedahmed, M.M.A.; Ramli, M.A.M.; Bouchekara, H.R.E.H.; Shahriar, M.S.; Milyani, A.H.; Rawa, M. A techno-economic analysis of a hybrid energy system for the electrification of a remote cluster in western Saudi Arabia. Alex. Eng. J. 2021, 61, 5183–5202. [Google Scholar] [CrossRef]
  71. Mehta, R.; Chowdhury, S. Design of an optimal stand-alone hybrid renewable energy system with storage for supplying medical facilities in Tanzania. In Proceedings of the 2021 IEEE PES/IAS PowerAfrica, Nairobi, Kenya, 23–27 August 2021. [Google Scholar] [CrossRef]
  72. Zebra, E.I.C.; van der Windt, H.J.; Nhumaio, G.; Faaij, A.P.C. A review of hybrid renewable energy systems in mini-grids for off-grid electrification in developing countries. Renew. Sustain. Energy Rev. 2021, 144, 111036. [Google Scholar] [CrossRef]
  73. Odou, O.D.T.; Bhandari, R.; Adamou, R. Hybrid off-grid renewable power system for sustainable rural electrification in Benin. Renew. Energy 2020, 145, 1266–1279. [Google Scholar] [CrossRef]
  74. Krishan, O.; Suhag, S. Techno-economic analysis of a hybrid renewable energy system for an energy poor rural community. J. Energy Storage 2019, 23, 305–319. [Google Scholar] [CrossRef]
  75. Javed, M.S.; Song, A.; Ma, T. Techno-economic assessment of a stand-alone hybrid solar-wind-battery system for a remote island using genetic algorithm. Energy 2019, 176, 704–717. [Google Scholar] [CrossRef]
  76. Hussain, S.; Xuetong, W.; Maqbool, R.; Hussain, M.; Shahnawaz, M. The influence of government support, organizational innovativeness and community participation in renewable energy project success: A case of Pakistan. Energy 2022, 239, 122172. [Google Scholar] [CrossRef]
  77. Qazi, A.; Hussain, F.; Rahim, N.A.; Hardaker, G.; Alghazzawi, D.; Shaban, K.; Haruna, K. Towards Sustainable Energy: A Systematic Review of Renewable Energy Sources, Technologies, and Public Opinions. IEEE Access 2019, 7, 63837–63851. [Google Scholar] [CrossRef]
  78. Kim, M.H.; Kim, D.; Heo, J.; Lee, D.W. Techno-economic analysis of hybrid renewable energy system with solar district heating for net zero energy community. Energy 2019, 187, 115916. [Google Scholar] [CrossRef]
  79. Faridah, L.; Purwadi, A.; Ibrahim, M.H.; Rizqiawan, A. Study and design of hybrid off-grid power system for communal and administrative load at 3 regions in Maluku, Indonesia. In Proceedings of the 2018 Conference on Power Engineering and Renewable Energy (ICPERE), Solo, Indonesia, 29–31 October 2018. [Google Scholar] [CrossRef]
  80. Das, B.K.; Zaman, F. Performance analysis of a PV/Diesel hybrid system for a remote area in Bangladesh: Effects of dispatch strategies, batteries, and generator selection. Energy 2019, 169, 263–276. [Google Scholar] [CrossRef]
  81. Manama, S.M.; Scipioni, A.; Davat, B.; el Ganaoui, M. The idea of feeding a rural area in Comoros zith a micro-grid system with renewable energy source with hydrogen storages. In Proceedings of the 2018 6th International Renewable and Sustainable Energy Conference, IRSEC 2018, Rabat, Morocco, 5–8 December 2018. [Google Scholar] [CrossRef]
  82. van Greunen, S. The city assemblage: A case of Windhoek, Namibia. Cities 2021, 119, 103374. [Google Scholar] [CrossRef]
  83. Namibia Economist. City of Windhoek Launches Spatial Development Framework|Namibia Economist. 2021. Available online: https://economist.com.na/60693/extra/city-of-windhoek-launches-spatial-development-framework/ (accessed on 27 February 2022).
  84. Namibia Economist. Power utility to ‘Light Up’ Windhoek’s Informal Settlements—NamPower, City of Windhoek ink Agreement Worth N$15.5 Million for Electrification Project. 2020. Available online: https://economist.com.na/53233/general-news/power-utility-to-light-up-windhoeks-informal-settlements-nampower-injects-n15-5-million-to-electrification-project/ (accessed on 27 February 2022).
  85. Namibia Economist. Government Moves to Formalise Shacks—Land Tenure System Pilot Project Kicks Off. 2019. Available online: https://economist.com.na/44768/community-and-culture/government-moves-to-formalise-shacks-land-tenure-system-pilot-project-phase-kicks-off/ (accessed on 27 February 2022).
  86. Dave, R.; Smyser, C.; Koehrer, F. Where and How Slum Electrification Succeeds: A Proposal for Replication; World Bank: Washington, DC, USA, 2019. [Google Scholar] [CrossRef]
  87. New Era. City to Crack down on Electricity Theft-Truth, for Its Own Sake. 2021. Available online: https://neweralive.na/posts/city-to-crack-down-on-electricity-theft (accessed on 6 March 2022).
  88. Informante. City Warns Residents against Electricity Theft-Informanté. 2021. Available online: https://informante.web.na/?p=308395 (accessed on 6 March 2022).
  89. Karuaihe, S.T.; Wandschneider, P.R. Limited access to services for the urban poor in Windhoek, Namibia. Dev. S. Afr. 2018, 35, 466–479. [Google Scholar] [CrossRef] [Green Version]
  90. Namibian Sun. Informal Settlements Still in Crisis-Infrastructure-Windhoek Express. 2020. Available online: https://www.we.com.na/news/informal-settlements-still-in-crisis-2020-10-09 (accessed on 6 March 2022).
  91. Namibia Broadcasting News. 1200 Windhoek Informal Settlement Households Will Soon Have Electricity. 2020. Available online: https://nbcnews.na/havana (accessed on 11 May 2022).
  92. Mandelli, S.; Merlo, M.; Colombo, E. Novel procedure to formulate load profiles for off-grid rural areas. Energy Sustain. Dev. 2016, 31, 130–142. [Google Scholar] [CrossRef]
  93. Mandelli, S.; Brivio, C.; Moncecchi, M.; Riva, F.; Bonamini, G.; Merlo, M. Novel LoadProGen procedure for micro-grid design in emerging country scenarios: Application to energy storage sizing. Energy Proc. 2017, 135, 367–378. [Google Scholar] [CrossRef]
  94. Tshabeni, T.; Freece, P. Comparison of informal settlement electrification: A case study at seaview, eastern cape, South Africa. In Proceedings of the 2017 IEEE AFRICON, Cape Town, South Africa, 18–20 September 2017. [Google Scholar]
  95. ClimaTemps. Windhoek Climate & Temperatures. 2017. Available online: http://www.windhoek.climatemps.com/ (accessed on 7 March 2022).
  96. Pupkewitz Megatech, Pupkewitz Megatech Renewable Energy. 2022. Available online: https://megatechsolar.com.na/ (accessed on 7 March 2022).
  97. NEC Namibia. Specialists in Green Energy-NEC Power & Pumps Pty (Ltd.). 2022. Available online: https://nec-namibia.com/ (accessed on 7 March 2022).
  98. Light Systems Namibia. Light Systems Namibia—LSN—A Renewable Energy Company Focused on Solar Technology. 2022. Available online: https://lsn.com.na/ (accessed on 7 March 2022).
  99. National Petroleum Corporation of Namibia. Fuel Prices. 2022. Available online: https://www.namcor.com.na/fuel-prices/ (accessed on 7 March 2022).
  100. IRENA. Solar Pv in Africa: Costs and Market; IRENA: Abu Dhabi, United Arab Emirates, 2016. [Google Scholar]
  101. Bank of Namibia, Today’s Rates. 2022. Available online: https://www.bon.com.na/ (accessed on 7 March 2022).
  102. Aziz, A.S.; Tajuddin, M.F.N.; Adzman, M.R.; Ramli, M.A.M.; Mekhilef, S. Energy management and optimization of a PV/diesel/battery hybrid energy system using a combined dispatch strategy. Sustainability 2019, 11, 683. [Google Scholar] [CrossRef] [Green Version]
  103. Das, C.K.; Bass, O.; Kothapalli, G.; Mahmoud, T.S.; Habibi, D. Overview of energy storage systems in distribution networks: Placement, sizing, operation, and power quality. Renew. Sustain. Energy Rev. 2018, 91, 1205–1230. [Google Scholar] [CrossRef]
  104. Ekren, O.; Canbaz, C.H.; Güvel, Ç.B. Sizing of a solar-wind hybrid electric vehicle charging station by using HOMER software. J. Clean. Prod. 2021, 279, 123615. [Google Scholar] [CrossRef]
  105. Das, B.K.; Hasan, M. Optimal sizing of a stand-alone hybrid system for electric and thermal loads using excess energy and waste heat. Energy 2021, 214, 119036. [Google Scholar] [CrossRef]
  106. Ministry of Mines and Energy. Solar Revolving Fund. 2022. Available online: https://mme.gov.na/directorates/efund/srf/ (accessed on 7 March 2022).
  107. Energypedia. Solar Revolving Fund: A Financing Strategy for Solar Energy Technologies in Namibia. 2022. Available online: https://energypedia.info/wiki/Solar_Revolving_Fund:_A_Financing_Strategy_for_Solar_Energy_Technologies_in_Namibia (accessed on 7 March 2022).
Figure 1. An example of an off-grid hybrid renewable energy system (HRES).
Energies 15 04235 g001
Figure 2. The techno-economic analysis process using HOMER.
Energies 15 04235 g002
Figure 3. Havana informal settlement terrain and characteristics.
Energies 15 04235 g003
Figure 4. Different views of Havana informal settlement in Windhoek, Namibia: (a) An aerial view of the unstructured portion of the settlement [90]; (b) A closer view of the corrugated iron dwellings [91].
Energies 15 04235 g004
Figure 5. Hourly average relative demand for domestic load. Source [60].
Energies 15 04235 g005
Figure 6. Hourly average relative demand for commercial load. Source [60].
Energies 15 04235 g006
Figure 7. Annual solar radiation and clearness index profile for Windhoek. Source [60].
Energies 15 04235 g007
Figure 8. Climate pattern for Windhoek. Source [95].
Energies 15 04235 g008
Figure 9. Monthly average wind speed for Windhoek.
Energies 15 04235 g009
Figure 10. A HOMER model for: (a) Shack-24sqm load; (b) Solar rooftop microgrid.
Energies 15 04235 g010
Figure 11. An illustration of how HOMER dispatch energy in a hybrid renewable energy system.
Energies 15 04235 g011
Figure 12. Comparing costs of different SHS system configurations.
Energies 15 04235 g012
Figure 13. Comparing LCOE of different solar home systems.
Energies 15 04235 g013
Figure 14. Comparing costs of different microgrid system configurations.
Energies 15 04235 g014
Figure 15. Comparing LCOE of different electrification schemes.
Energies 15 04235 g015
Figure 16. Impact of fuel price change on system costs.
Energies 15 04235 g016
Figure 17. Impact of load growth on system costs.
Energies 15 04235 g017
Figure 18. Impact of PV module price decrease on system costs for the PV|WT|DG|BAT model.
Energies 15 04235 g018
Table 1. Existing power production plants in Namibia [25].
Power PlantTypeBuiltCapacity (MW)Operating Modus
RuacanaHydro1978347Flexible/Baseload
Van EckCoal197390Stand-by
AnixasDiesel201122.5Stand-by
IPPs 1Solarvary174.5Flexible
IPPs 1—OmbepoWind20195Flexible
IPPs 1—N-BiGBiomass20100.5Flexible
Total Capacity (MW)639.5
1 IPP—Independent Power Producers.
Table 3. Site parameters for Havana informal settlement.
ParameterValue
Location name and city:Havana settlement, Windhoek, Namibia
Type of location:Informal settlement (peri-urban area)
Longitude:22°29′ S
Latitude:17°01′ E
Population:≈96,000 [10]
Estimated number of dwellings:≈12,773
Main type of dwellings:Shacks made of corrugated iron [10]
Main source of energy:Electricity (for the electrified area), kerosene, and firewood (for un-electrified area)
Dominant population:20–40 years (male and female) [9]
Main source of income:Small informal businesses, general labor, and construction labor [10]
Monthly income:USD 30–2500 [10]
Table 6. Ratings and costs for various system components used in the study.
ComponentProduct SpecificationRating (kW)Unit Cost ($/Wp)Capital Cost (USD) 1Replacement Cost (USD) 1O&M Cost 2 (USD)Lifetime (Years)
PV moduleGeneric flat plate10.66005401025
Wind turbineGeneric33.09000900018020
ConverterGeneric10.25250225515
Deep cycle batteryGeneric lead Acid1 kWh0.49490430105
Diesel generatorAuto-size GensetN/A500N/A500/kW0.03/h15,000 h
1 Component costs are based on quotations sourced from various Namibian suppliers to install a 5 kW solar home system (SHS). Microgrid components are assumed to be of better quality than an SHS; hence, they are costed at 20% higher than SHS. Replacement costs for solar PV, batteries, and converters are assumed at 10% less than capital costs [96,97,98]. 2 O&M cost for a diesel generator is based on 2021 average fuel price in Namibia [99]. Other O&M costs are obtained from an IRENA report on African solar PV market [100].
Table 7. Project economic input assumptions.
ParameterValue
Project lifetime25 years
Annual discount rate 18%
Inflation rate 14.5%
Diesel fuel cost 2USD 1.08/L
1 Discount and inflation rates obtained from [101], 2 Fuel cost obtained from [99].
Table 8. Techno-economic comparison of different energy system configurations *.
LoadConfigurationCapacity 1DS 2EP 3
MWh/Year
REP 4
%
EE 5%NPC 6
USD Thsd 13
CAP 7
USD Thsd 13
LCOE 8
US$/kWh
DPP 9
Years
Shack-24sqmPV|BAT1.68 kW|5 kWh|0.437 kWCC 103.25 12100.063.69.273.570.560-
PV|DG1.63 kW|0.49 kW|0.168 kWCC4.08 1277.275.411.761.260.7095.20
PV|DG|BAT0.98 kW|0.49 kW|2 kWh|0.27 kWLF 112.26 1284.052.27.291.880.4402.85
Microgrid-RoofPV|BAT2.41 MW|5.74 MWh|0.56 MWCC4.68100.067.413,58752950.633-
PV|DG1.87 MW|0.59 MW|0.21 MWCC4.7975.772.812,11017030.5637.09
PV|DG|BAT1.06 kW|0.59 MW|1.25 MWh|0.32 MWLF2.6676.949.2829718890.3863.14
Microgrid-GroundPV|BAT26.61 MW|63,424 kWh|6508 kWCC51.63100.067.7150,82558,5320.644-
PV|DG19.55 MW|6.60 MW|2.24 MWCC50.9474.572.2131,98418,0450.5646.74
PV|DG|BAT11.52 MW|6.60 MW|12.18 MWh|3.53 MWLF29.3776.149.990,83419,8400.3883.05
PV|WT|BAT17.77 MW|1.40 MW|61.64 MWh|6.06 MWCC42.49100.062.6135,44063,5770.5795.17
PV|WT|DG19.42 MW|—|6.60 MW|2.19 MWCC50.7174.372.0131,93317,9400.5636.69
PV|WT|DG|BAT8.87 MW|0.87 MW|6.60 MW|12.55 MWh|3.19 MWLF27.6980.047.488,22225,8510.3773.65
* Abbreviations used in this table are listed below: 1 Capacities for Solar PV|Wind|Diesel|Battery|Converter (whichever is applicable). 2 DS—Dispatching Strategy, 3 EP—Energy Production (kWh/yr), 4 REP—Renewable Energy Production, 5 EE—Excess Energy, 6 NPC—Net Present Cost, 7 CAP—Initial Capital Cost, 8 LCOE—Levelized Cost of Energy, 9 DPP—Discounted Payback Period, 10 CC—Cycle Charging, 11 LF—Load Following, 12 These values are kilowatts (KW), 13 Thsd—Amount in thousand US dollars.
Publisher’s Note: MDPI stays neutral with regard to jurisdictional claims in published maps and institutional affiliations.

