Abstract
A method of positioning a location on a specific object using a wireless sensor has been developed for a long time. However, due to the error of wavelengths and various interference factors occurring in three-dimensional space, accurate positioning is difficult, and predicting future locations is even more difficult. It uses IoT-based node pattern recognition technology to overcome positioning errors or inaccurate predictions in wireless sensor networks. It developed a method to improve the current positioning accuracy in a sensor network environment and a method to learn a pattern of position data directly from a wavelength receiver. The developed method consists of two steps: The first step is a method of changing location data in 3D space to location data in 2D space in order to reduce the possibility of positioning errors in 3D space. The second step is to reduce the range of the moving direction angle in which the data changed in two dimensions can be changed in the future and to predict future positions through pattern recognition of the position data. It is to calculate the expected position in the future. In conclusion, three-dimensional positioning accuracy was improved through this method, and future positioning accuracy was also improved. The core technology was able to reduce inevitable errors by changing the spatial dimension from 3D to 2D and to improve the accuracy of future location prediction by reducing the range of the movable direction angle of the location data changed to 2D. It was also possible to obtain the result that the prediction accuracy increases in proportion to the amount of data accumulated in the wavelength receiver and the learning time. In the era of the Fourth Industrial Revolution, this method is expected to be utilized in various places, such as smart cities, autonomous vehicles, and disaster prediction.
1. Introduction
This work started with the idea that if there is a system that can accurately predict the future positions of humans, it is expected to be very useful socially and scientifically. In order to create a position prediction system using edge artificial intelligence, it is necessary to develop a method to improve the currently used positioning algorithms and to develop a pattern classification application algorithm that can convert position data into more accurately predicted values. Therefore, in prior research, the positioning algorithms and pattern classification prediction algorithms widely used commercially were investigated.
A location-based service is a service that identifies a user’s location through location positioning technology and provides various information or services accordingly. However, the existing outdoor positioning system is not suitable for application in an indoor environment requiring higher positioning accuracy. In this paper, we focus on the indoor positioning system using trigonometry in the IEEE 802.15.4 wireless personal area network (PAN) environment and use RSS (received signal strength) to predict the distance between the reference point and the terminal. This paper, with the concept of building an indoor positioning system in mind, proposes a method for selecting an optimal reference point that can maximize positioning accuracy and a distance prediction method adaptive to changes in the radio wave environment to predict the distance between the selected reference point and the terminal. Through system implementation, the performance of the proposed method was verified in terms of location accuracy.
This paper considers a location tracker as a sensor using a wavelength generator and is a fusion of an algorithm for wavelength data from a location tracker and a pattern classification algorithm for the data derived from location-positioning technology. Technology that allows the conversion of the data into tagged data using the sensor position values received by a receiver (low power sensor) from a physical sensor, in addition to the application of the pattern classification algorithm to the converted data, is ultimately applied. The main content of this paper is to create a system that predicts the future locations of human beings. Currently, location prediction technology, through the convergence of location data and pattern classification in various fields, has been proposed. In previous studies, many studies have been conducted on how to determine a location according to the latitude, longitude, and user patterns of mobile applications. The most often proposed method is to predict future locations based on the past data of mobile users. Predicting a position through an individual’s movement pattern using a preset prediction model has also been proposed.
In general, when the positioning technique for the positioning system is used, an additional training process is required to obtain the propagation environment characteristic value of the three-dimensional position coordinates using the existing fingerprinting method, thereby increasing the system construction and maintenance cost. The proposed technique to solve this problem is the online RSS measurement technique. This RSS measurement technique is also difficult to apply in 3D. Therefore, it is possible to propose a position prediction system by arbitrarily replacing a three-dimensional position value with a two-dimensional position value and then applying a pattern classification technique to the measured position values.
The purpose of this paper is to generate prediction data using generalized time series data, and the method uses a time series pattern hidden in the time series data as a prediction value. The key of this paper is to label the wavelengths emitted by these sensors (portable beacons) according to positioning, obtain current positions by using the labeled data through pattern classification, and derive predicted positions in the future according to the passage of time.
2. Related Works
Real-time location-tracking systems refer to location and location-tracking services in a limited space, such as one that is nearby and indoors and outdoors in every place. A real-time location-tracking system is called an indoor location-tracking service because it checks the location of a person or thing, such as a mobile communication network-based location-based service (LBS), but is used in a limited space [1,2]. After an exhaustive study of bibliographies in this field, a system has not been found that is able to identify exact locations and predict locations. The reason for this is that the positioning error using a human-owned radio wavelength generating sensor is too large, and there is no machine learning methodology suitable for predicting location data [3]. The purpose of this paper is to convert the existing positioning technology [4] into a new positioning method in a wireless sensor network and to output accurate positioning and predicted positions by applying a new machine learning methodology.
Therefore, in order to make a position prediction system that uses pattern recognition [5] by using edge computing, it is necessary to propose a method for improving the currently used positioning algorithm and the machine learning application algorithm that can more accurately convert position data into predicted values. Therefore, the currently widely used positioning algorithm and artificial intelligence prediction algorithm were studied in prior research. General positioning technology using radio waves is a method of measuring the arrival time of radio waves to obtain a location as well as a method of measuring the TOA (time of arrival) between a terminal and a base station. A method that used the TDOA (time difference of arrival) as a measured value was used for positioning in sensor networks.
In general, a three-dimensional position calculation can be made directly in a mobile device by calculating the distance between each beacon and a receiver using RF and ultrasonic signals transmitted from three or more beacons fixedly attached to the inside of a building. However, since the distance from each fixed transmitter becomes closer or farther according to the movement of the receiver, distortion always occurs due to a change in the wavelength intensity, an angle change, etc., and an error due to the Doppler effect of radio waves always occurs. If both the source and the observer are moving, both speeds increase as the observed wavelength increases as the source approaches the observer or the observer moves toward the source. The radio frequency decreases as they move away from each other.
In other words, it is assumed that the wave source directly approaches or moves away. When a sensor’s wavelength source approaches the observer with a certain angle and velocity, the observed wavelength is initially higher than the emitted wavelength and then decreases as it approaches the observer. It becomes the same when it is closest to the observer and then decreases as it moves away from the observer. If the observer is very close to the path of the object, there is a rapid transition from high to low wavelength, and if the observer is far away from the path, it changes slowly. In general, the Doppler equation is useful when the speed of a wave is much larger than the relative speed of the wave source and the observer, when the sensor’s wavelength source and the observer are very slow compared to the speed of the wave, or when the distance between the wave source and the observer is very large. The values in the Doppler equation are constantly changing.
Therefore, the positioning algorithms that are currently commercialized using general radio waves inevitably have errors in 3D space. Therefore, this paper aims to create a system that predicts the future position of a sensor by taking into account the error caused by the Doppler effect and the wavelength distortion that occurs between the wave source and the receiving sensor, which is the observer, in the positioning of the sensor that generates or receives these frequencies. The method is to map the wireless signal data used for positioning to the MAP, convert the location value through the data into tagged data, and then calculate the future predicted location through the pattern recognition of time series data with edge computing. This paper regards a position tracker as a sensor that uses the wavelength generator constituting the position tracker in addition to the algorithm [1,2,3] for the wavelength data from the position tracker and its positioning technology [4,5]. It is a fusion of pattern recognition for time series data with edge computing for data derived from the method of applying the learning algorithm.
Currently, location prediction technology through the convergence of positioning data and machine learning in various fields has been proposed.
For example, a positioning method that determines a location according to the longitude and latitude of a user’s check-in location or a mobile application, a location prediction method using user patterns [6,7], and a location prediction method based on the past data of mobile users [8] have been proposed. Method [9] and a location prediction method [10] based on individual movement patterns using a trajectory location prediction model have been proposed. In addition, based on the flight records of aircraft, aircraft position prediction using aircraft trajectory file data was also proposed [11]. Due to the major limitations of the Markovian model, the current trend of location prediction is recognized as the most important value to obtain the predicted value of the next location from the location visited by a user. In other words, location data also mainly use a learning neural network as a pattern recognition problem [12]. For the performance evaluation of the results obtained through this study, referring to the evaluation method of the existing system that predicts locations, the method of evaluating the prediction accuracy using the correct training data and the test data answers when evaluating the prediction system, in general, can be determined by how well it can be applied to new data is a measure of the quality of the system [13]. Classifications were applied based on the random forest algorithm, a regulated AI strategy for analyzing textual data in datasets and finding levels of accuracy based on classification [14], and in another case, a novel method of predicting the incremental size of presented information cascades was used [15]. The convergence technology of dimensional transformation and machine learning to predict the position of an existing vehicle is a major case for position prediction of low-power sensors [16]. KNN is an algorithm that determines the type of new data by measuring the distance between the new data and the existing data and checking the types of nearby data widely used as a technology for predicting the price of a specific product in the market [17] and predicting auto credit defaults [18]. In addition, a new algorithm has been proposed that aims to achieve both link prediction and sign prediction in networks [19]. In location prediction, the Markovian [20] model has limitations. In the case of aircraft, there is also a method of predicting the position of aircraft through the aircraft trajectory [21] dictionary file data based on flight histories. The trend of current location prediction is recognized as the most important value for obtaining a future prediction value for a location visited by a user. The prediction of location can also be regarded as a problem of pattern recognition in data, and a machine learning neural network is used as a method.
The performance evaluation of this study used a method of evaluating prediction accuracy by using training data and test data. In general, the accuracy of a prediction system is determined by how well it analyzes test data. Sensors owned by humans include smartphones [22] and beacons. If a sensor is installed on a robot, the robot’s motion control [23] function can be used to predict its future positions. In general, there are various methods that can be used to determine the location of a specific object in space, but methods using a sensor mainly use a triangulation technique based on the estimation of the DTOA (differential time of arrival) [24]. User application provides the data necessary for the server to localize the device or enable the user to receive various services from the client [25]. Smart grid projects to form an efficient and eco-friendly intelligent grid using low-power technology are being actively carried out [26]. From the point of view of the IoT, there are many security vulnerabilities [27] in multi-sensor platforms, but this study proposed a method performed in edge computing, so it can also solve security problems. A learning method to detect and recognize human activity by analyzing the CSI of multiple APs in a narrow area [28] and a method using a continuous inverse skyline query in a sensor network to search a set of nodes [29] have been proposed. Big data technology used in wireless sensor networks is one of the major development directions in the information field and can be applied to large-scale data mining, data analysis, and data sharing [30]. The convergence of wireless sensor networks and artificial intelligence is being studied in various fields. As an example, a deep learning-based automatic fetal ultrasound standard plane recognition model is proposed in the Internet of Things environment, and the Convolutional Neural Network (CNN) component and the Recurrent Neural Network (RNN) component are fused [31]. Energy efficiency (EE) has been a major challenge in wireless sensor networks (WSNs) over the past few decades. Therefore, low power-based WSNs should reduce transmission delay and increase throughput with high-quality service, and pay more attention to increasing energy consumption to improve network lifespan [32]. The method of repeatedly performing the above process and narrowing the error range of the physical real position and computing location and narrowing the error range of the positioning [33]. In the positioning method, triangulation is the most commonly used positioning method, and there are many suggestions to improve it. Among them, there are indoor positioning and positioning correction methods to improve such triangulation. The triangulation method is a method of constructing a triangular node in a sensor network and positioning a specific object at the center. The method also uses machine learning to directly correct signal reception classifications, and GBDT (Gradient Boosting Decision Tree)-based method is used to correct the calculation distance error in the condition of signal strength [34]. All deviations of the values brought from such specific reference points are calculated, the information is stored as a vector, and then the relative general deviation to be applied is obtained by adding this. It has been proved useful for improving the accuracy of Wi-Fi-based positioning when correction is made to all measurements to make deviation smaller. The initial calculations indicate an average error of 1 m, which is similar to outdoor GPS accuracy but is not special given the required precision within a much smaller specified boundary; however, the accuracy increases through continuous experiments, resulting in a total error of about 60 cm [35]. That is, the positioning and correction method using triangulation can include various options as one of the oldest methods. However, unless the error value for the fundamentally existing space is removed, a simple mathematical calculation method cannot be an alternative to reduce the positioning error.
Global Navigation Satellite Systems (GNSS) has been making a lot of progress with the development of smartphones, electric cars, and autonomous vehicles, among location detection technologies. This has been built into mobile phones, tablet computers, and smartwatches as receivers, which has greatly increased the development and use of Internet-supported mobile devices. The number of applications using this GNSS function and the number of vehicles operating on the ground. Generally, the size, weight, power, and cost of GNSS antenna and chipset are minimized. The accuracy of positioning is about 8–20 m. Due to such a big error, GNSS cannot play a big role in location-based services. To overcome these disadvantages, a team of researchers proposed a Location Corrections through Differential Networks (LOCD-IN) system as a means of increasing the position accuracy of the device [36]. An LOCD-IN uses GPS (Global Positioning System) pseudo-distance, code phase, and carrier phase measurements in mobile devices and is combined with data provided through network connections at fixed base stations. The network transmission of RTCM through the Continuous Operating Reference Stations (CORS) or the Internet protocol (NTRIP) is utilized. The raw GPS measurements of the mobile device are adjusted to calculate a geographic reference position with improved accuracy. These adjustments may include differential GPS, real-time kinematics (RTK) GPS, space-based enhancement systems, or ground-based enhancement systems (GBAS). The LOCD-IN system is also proposed as a means to increase the GPS-based position accuracy of existing mobile devices.
However, if different networks are used for location correction, it is not economical in terms of cost for environmental construction, and the error part about the fundamental space is considered to be overlooked. Therefore, the idea of using existing GPS and using adjacent network environments for location detection is considered to be very impracticable. A Japanese research team proposed a machine learning approach to indoor positioning of mobile targets based on BLE signals. In the case of smartphones, time series data at past points is an essential function in guessing the current location. For example, if the previous value of time series data indicates the same point, the target is likely to be in the same position next time. Moreover, if you continue to move points, you are likely to move the target to another location next time. The BLE signal was severely attenuated by experiments to observe the received signal and failed to receive it due to distance and obstacles. Based on preliminary experiments, feature vectors for position estimation were designed, and pattern classification was performed with well-known decision tree-based algorithms. In using the position data generated in the sensor network, the position data was learned, and the position of the indoor with high accuracy was measured [37]. Therefore, the pattern classification of data through the low-power sensor in this paper is expected to develop a lot in the future.
As seen above, there have been various methods and attempts to predict locations, but there is no definitive answer. Therefore, we developed a new method via location patterns.
3. Location Pattern Algorithm
This paper describes an algorithm for predicting the current and future locations of a positioning target [3]. The position of a radio frequency source in three-dimensional space becomes the reference point for positioning the target object in the space. The core of this paper is to tag the data from the localization of this wave source according to the localization, find the current location of the tagged data through pattern classification, and derive the predicted location in the future according to the passage of time. Through this paper, the predicted location of future sensors can be derived by the reuse of location data and the application of pattern classification. Sensor positioning technology, marine underwater detection and prediction technology, and autonomous vehicle technology can also be widely used in factory automation technology.
3.1. Positioning for Three Dimensions
This proposal places a sensor existing in three-dimensional space, that is, a wave source in a specific space, and broadcasts the wavelength at a certain period, obtains data on the position of the wave source through a scanner, and describes the method of predicting the position data where the sensor will be located in three-dimension space.
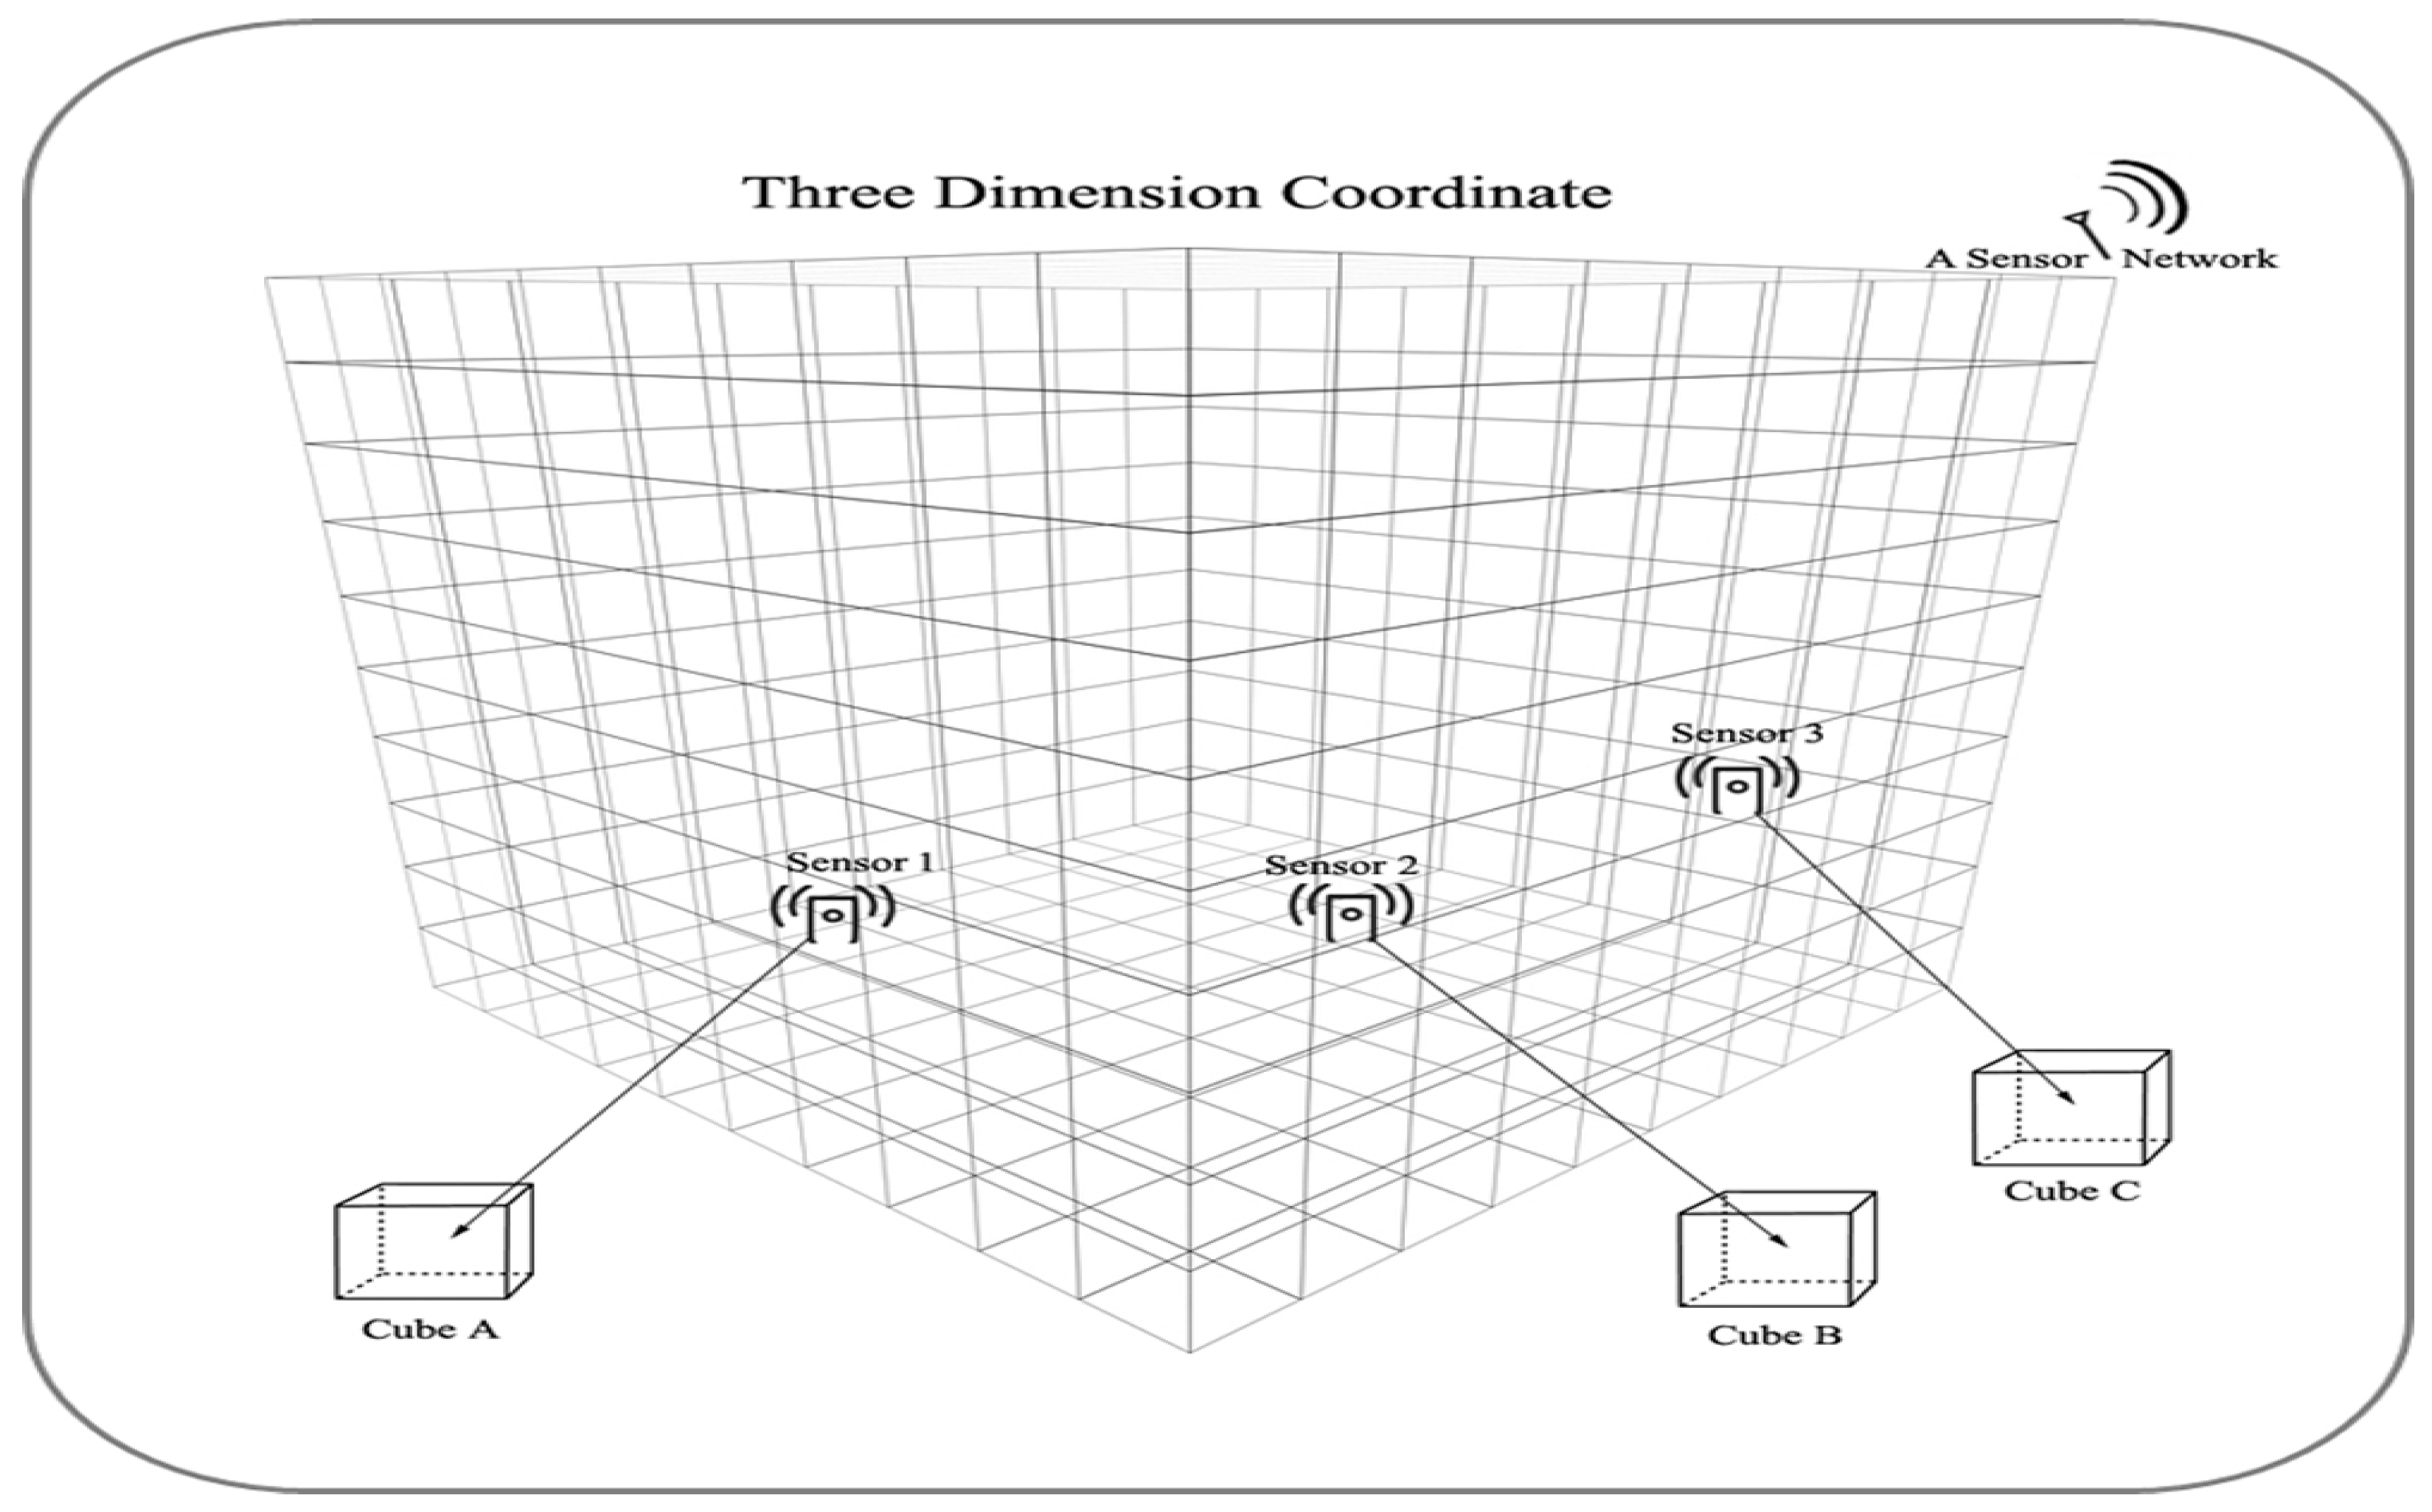
Figure 1 is a model set up to make a positioning algorithm in consideration of the three-dimensional space that exists in general, and the three-dimensional space is composed of several cubes. Specifically, the current location data are tagged based on this three-dimensional space, and the tagging method is a location-positioning algorithm using the wavelength [3]. An artificial intelligence algorithm implements a predictive model using the tagged data [5].
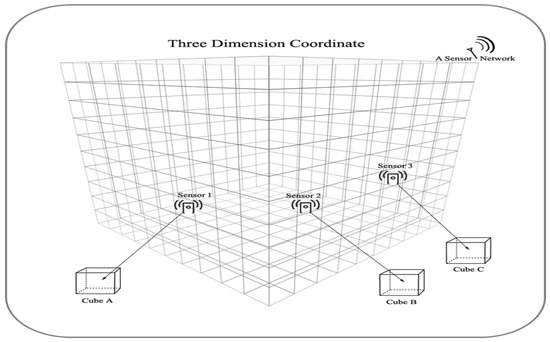
Figure 1.
Definition of real 3D space.
In order to carry out this study, the recognition and reception stage of the wavelength generated by the sensor, the 3D position coordinate value assignment stage, the 2D position value conversion stage, and the position variable inclusion stage for the 2D position value and the 2D position value data can be implemented as a step of storage in a database through tagging, a step of deriving a location’s predicted value through pattern classification, a step of storing a location’s predicted value in a database, and a step of checking a location’s predicted value as well as the actual current value of the sensor, respectively. By repeating the process of continuously deriving high-accuracy position prediction values from the generation and recognition stage of the wavelength to the last stage, the position prediction value of the sensor, and the actual current position value confirmation stage, the more the position data are accumulated and the position of the sensor is located. As a result, the accuracy of predictions is increased.
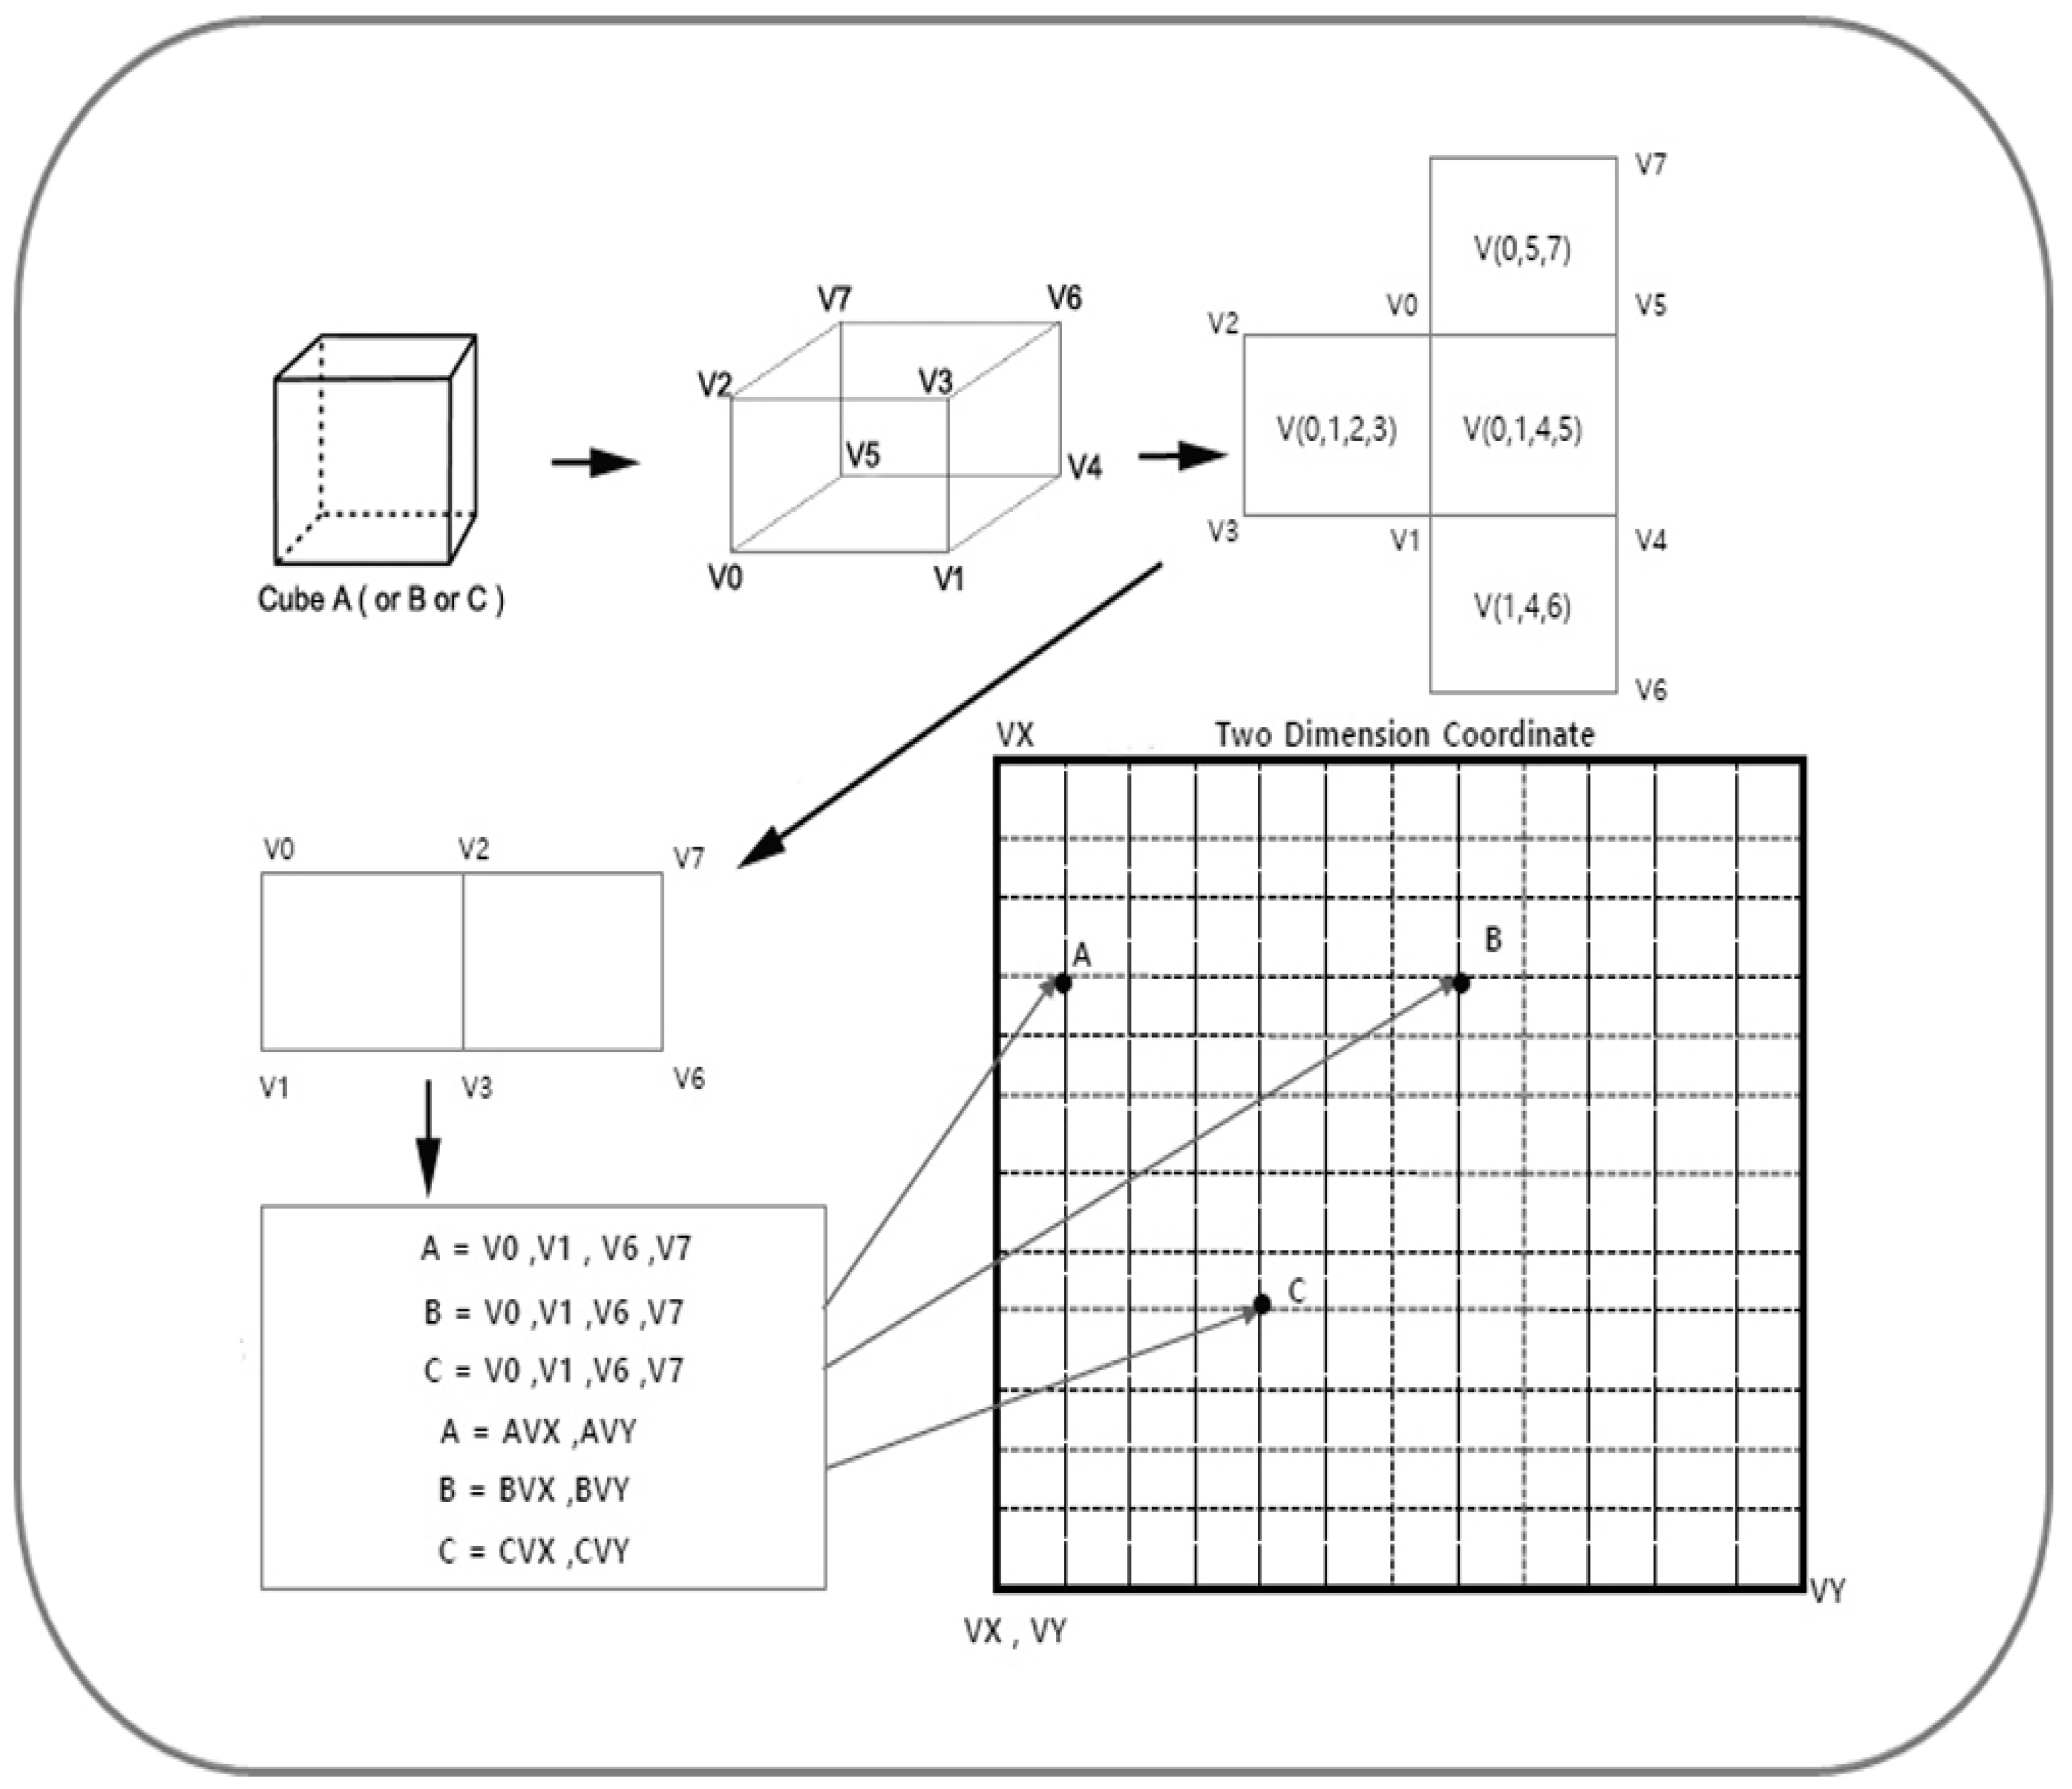
In order to materialize this conceptually by forming a sensor network [3] in a three-dimensional space, the space is configured as an environment for positioning, and the current position of the sensor can be positioned through a scanner. In such a sensor network, the recognition of space is given a coordinate value as it is in three dimensions, that is, in the real space itself, and this proves that the coordinate value becomes the real coordinate value. This actual coordinate value is finally compared with the predicted value of the location prediction data, and the prediction value with the highest accuracy in the future is adopted again to increase the accuracy of the location prediction [5]. Specifically, the cube in Figure 2, derived as a three-dimensional cube, can express location data by implying vertex values from V0 to V7. That is, V0, V1, V2, V3, V4, V5, V6, and V7 may imply data values as V0, V1, V2, V3, V6, and V7. Additionally, as shown in Figure 2, V0, V1, V2, V3, V6, and V7 form a rectangle with V0, V1, V6, and V7 again and can be converted into position data with four values. The resulting cube vertex values, V0, V1, V6, and V7, are used to display the two-dimensional coordinate values. The three-dimensional positional value is changed to a two-dimensional positional value through the redefinition of the cube. The method to be changed is A = V0, V1, V6, and V7, as shown in Figure 2, and the value of A is specified in the two-dimensional coordinate value. The coordinate value of A is a point at which the horizontal axis, VX, and the vertical axis, VY, intersect, and A = V0, V1, V6, and V7 can be substituted with AVX and AVY.
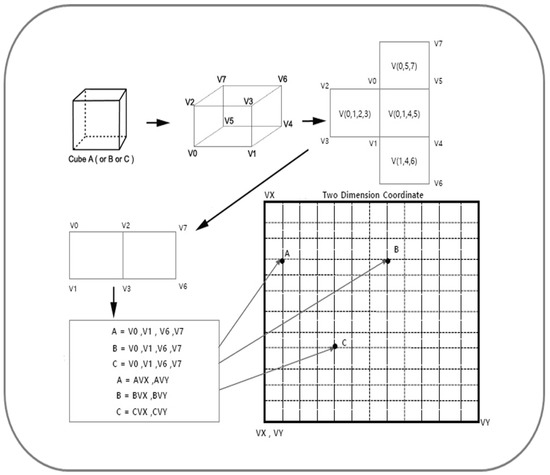
Figure 2.
Converting a 3D cube into 2D values.
That is, a three-dimensional cube with vertices of V0, V1, V2, V3, V4, V5, V6, and V7 is changed into a two-dimensional plane with vertices of V0, V1, V6, and V7. The position values V0, V1, V6, and V7 of B in the two-dimensional space belonging to the three-dimensional cube with vertices of V0, V1, V2, V3, V4, V5, V6, and V7, as shown in Figure 2, will have a value. Figure 2 expresses the principle of the generation of coordinate values displayed in two-dimensional coordinate values. The principle is that when a two-dimensional planar rectangle with vertices V0, V1, V6, and V7 is folded in half, the folding point becomes V2. That is, V0, V2, V6, and V7 derived in this way are V(0,1,2,3), V(0,1,5,7), and V(0,1,4,5), and V(0, a cube with two-dimensional surfaces of 1,6) can be created. The cube created in this way becomes a three-dimensional cube with vertices of V0, V1, V2, V3, V4, V5, V6, and V7, and the three-dimensional cube is in a three-dimensional position. It means to become a constitutive cube of space. That is, it can be explained that it is included in a specific cube, including the positions of Sensor 1, Sensor 2, and Sensor 3 in the three-dimensional space of Figure 1.
3.2. Positioning Using Azimuth
It can be assumed that a cube with a sensor, not a point where general coordinate values intersect, is a three-dimensional coordinate value cube as a predicted position value. This is a data conversion algorithm for 2D and 3D positioning for location prediction.
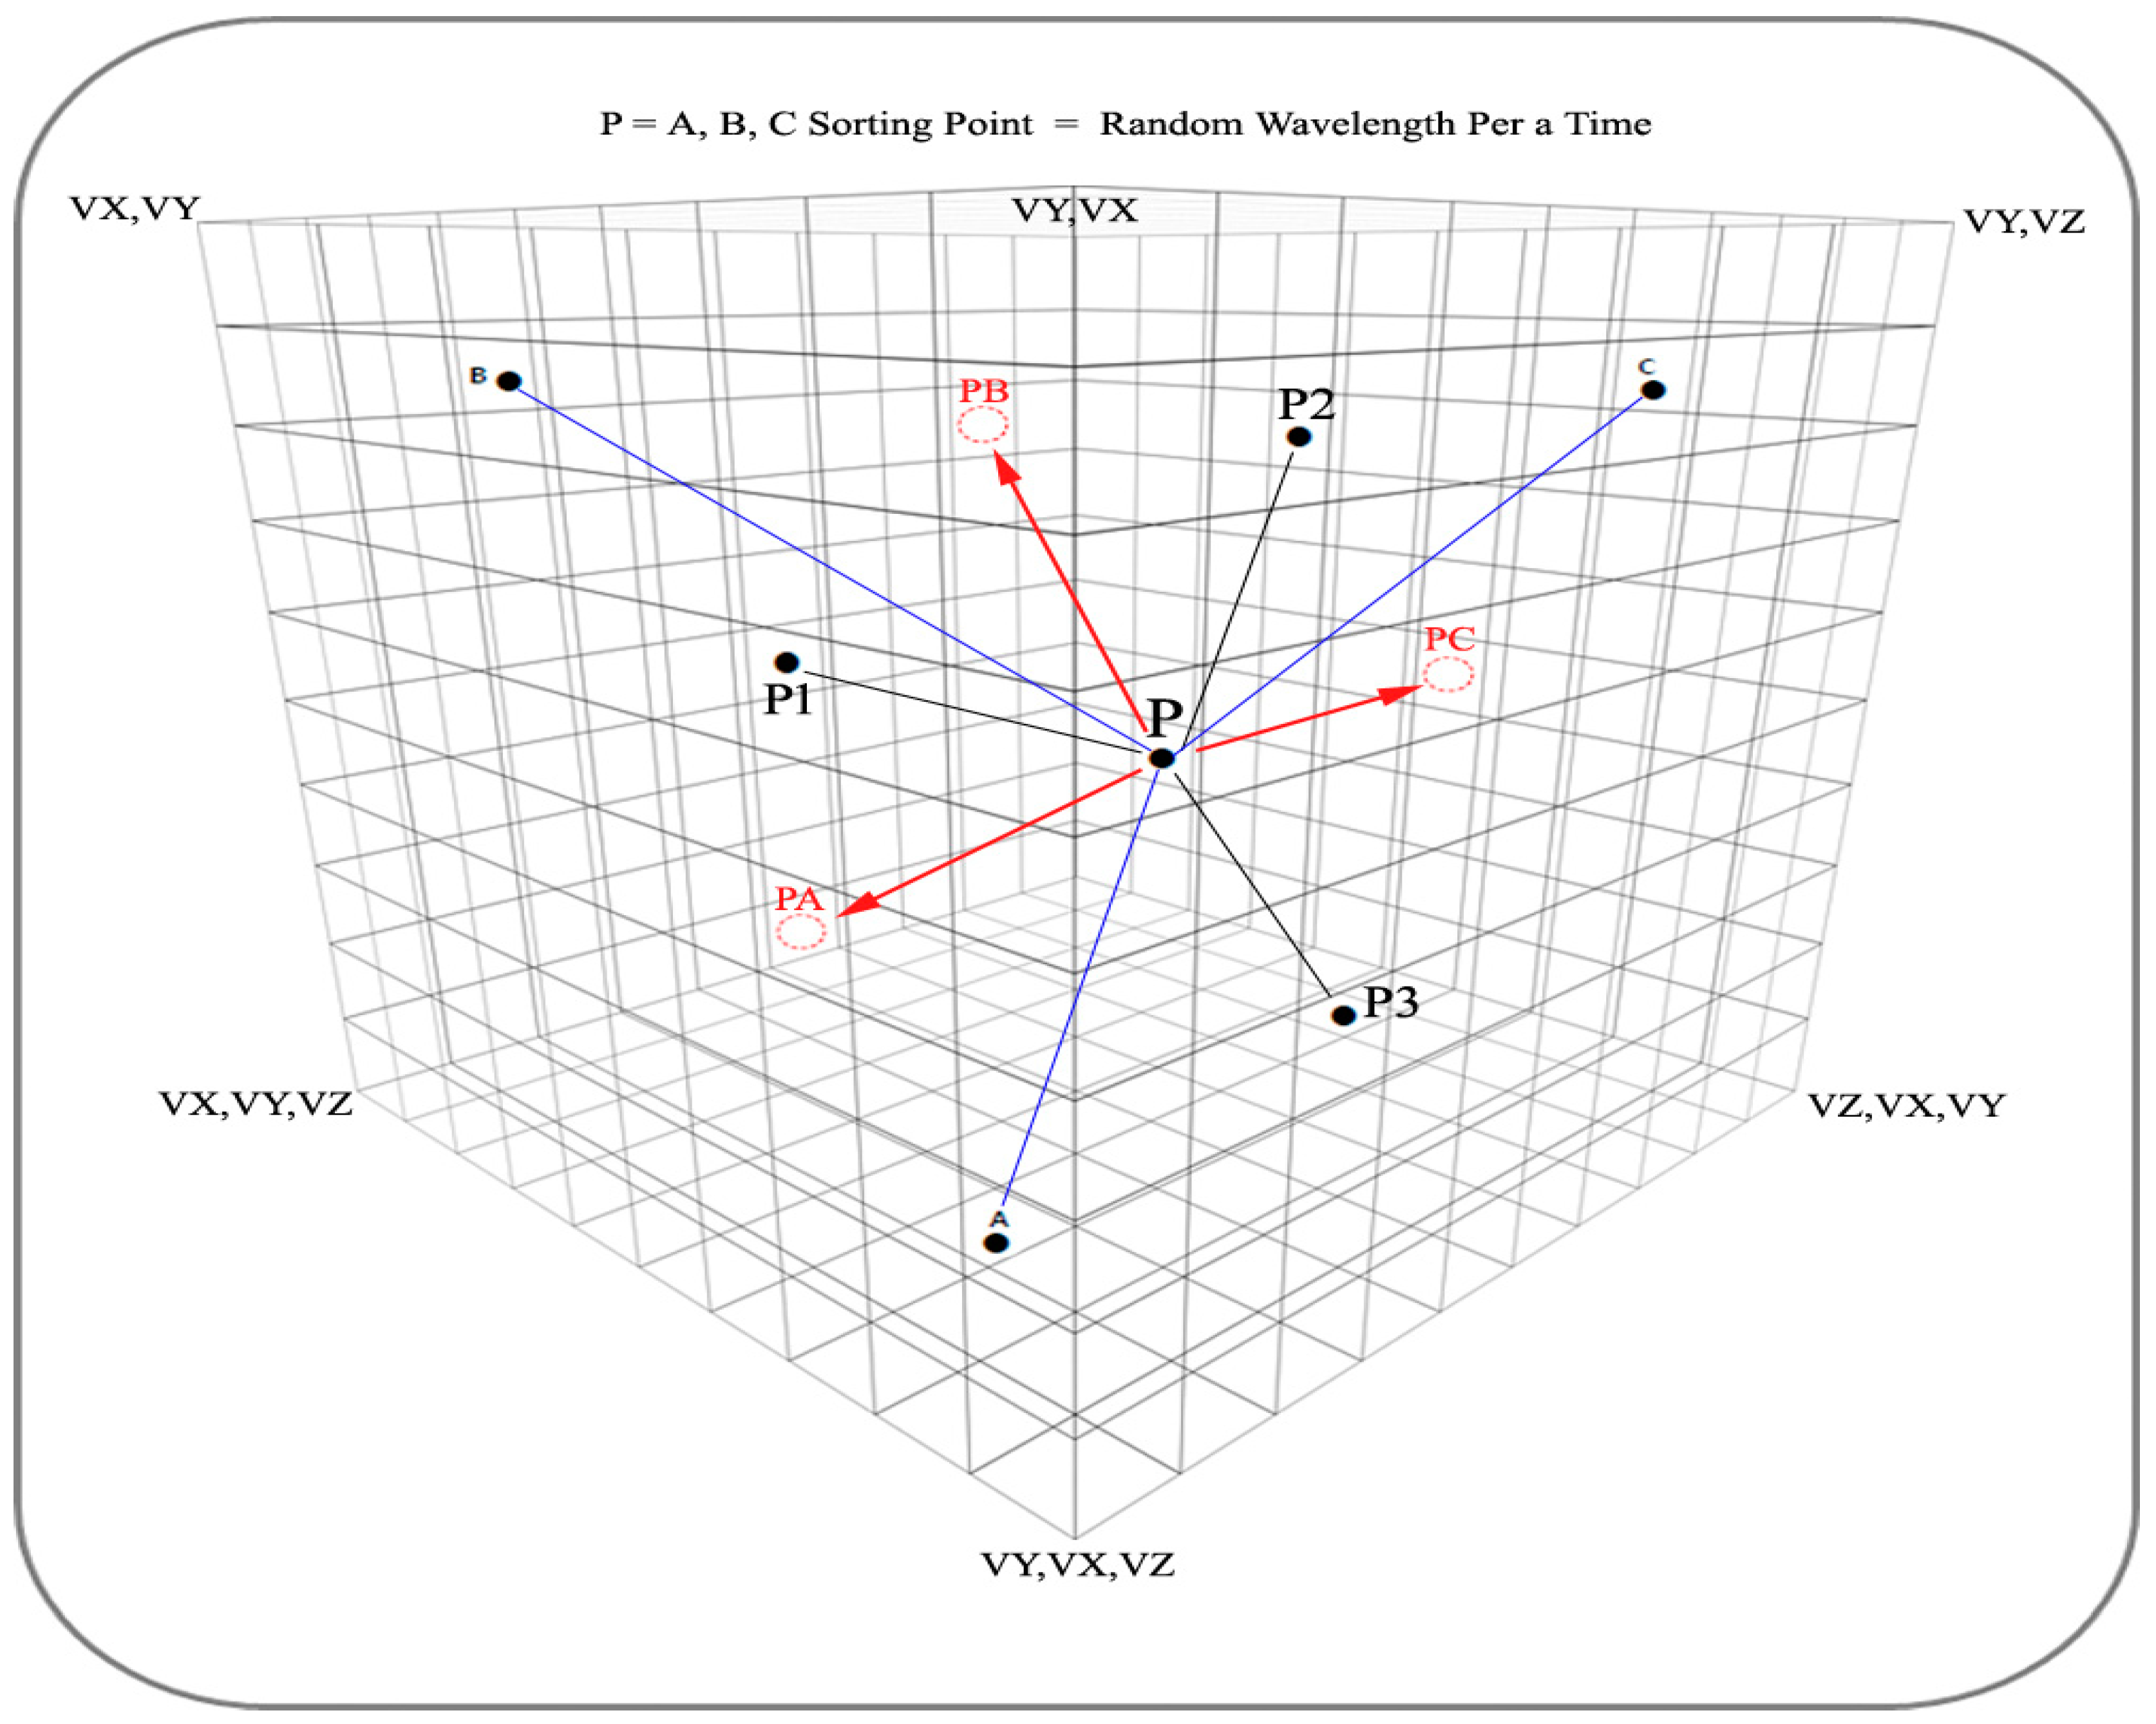
As shown in Figure 3, if the current position of the sensor in 3D has a value of A, the future position of this sensor can be moved to A, B, or C, and its movement path is based on the reference point, P. The path can be predicted with PA, PB, and PC, based on P1, P2, and P3, which are set as references. Since the movable reference point, reference line, and reference path are determined, this proves that the future predicted position of A can be determined as one of A, B, or C by moving from A to B or C. A predictive model in which the position of A in 3D space is changed to A, B, or C is bound to be subordinated to the reference point, P, the reference lines, P1, P2, and P3, and the reference paths, PA, PB, and PC. In other words, the position movement of A in 3D with an azimuth angle cannot deviate from the reference point, the reference lines, and the reference paths, so the predicted position also cannot deviate. P is the center of gravity of the A, B, and C values in three dimensions.
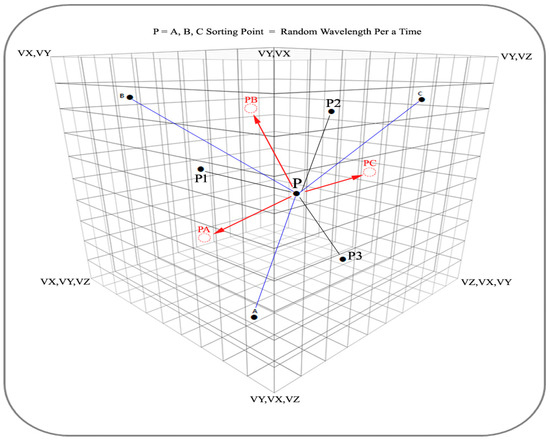
Figure 3.
Converting a 3D cube into 2D values.
The reference point (P), reference lines (P1, P2, and P3), and reference paths (PA, PB, and PC) set as described above start from the initial positioning of A. When the position of A in the first three-dimensional space is determined, the reference point, P, the reference lines, P1, P2, and P3, and the reference paths, PA, PB, and PC, are automatically assigned, and they are bundled together with the position value as a dataset. The location data tagged as this dataset are stored in the database and automatically stored along with the location prediction values according to time in the future according to the location value of A. The above is the description of the positioning algorithm for the position prediction of the sensor using the pattern recognition of edge computing in the sensor network.
3.3. Pattern Classification Method
This paper is a study that converges the positioning algorithm [3] and the learning and prediction algorithm of artificial intelligence [5]. Data labeling is performed on the data obtained through the positioning algorithm, and a prediction algorithm using pattern recognition for time series location data is used to implement learning and prediction models based on the tagged data in this paper.
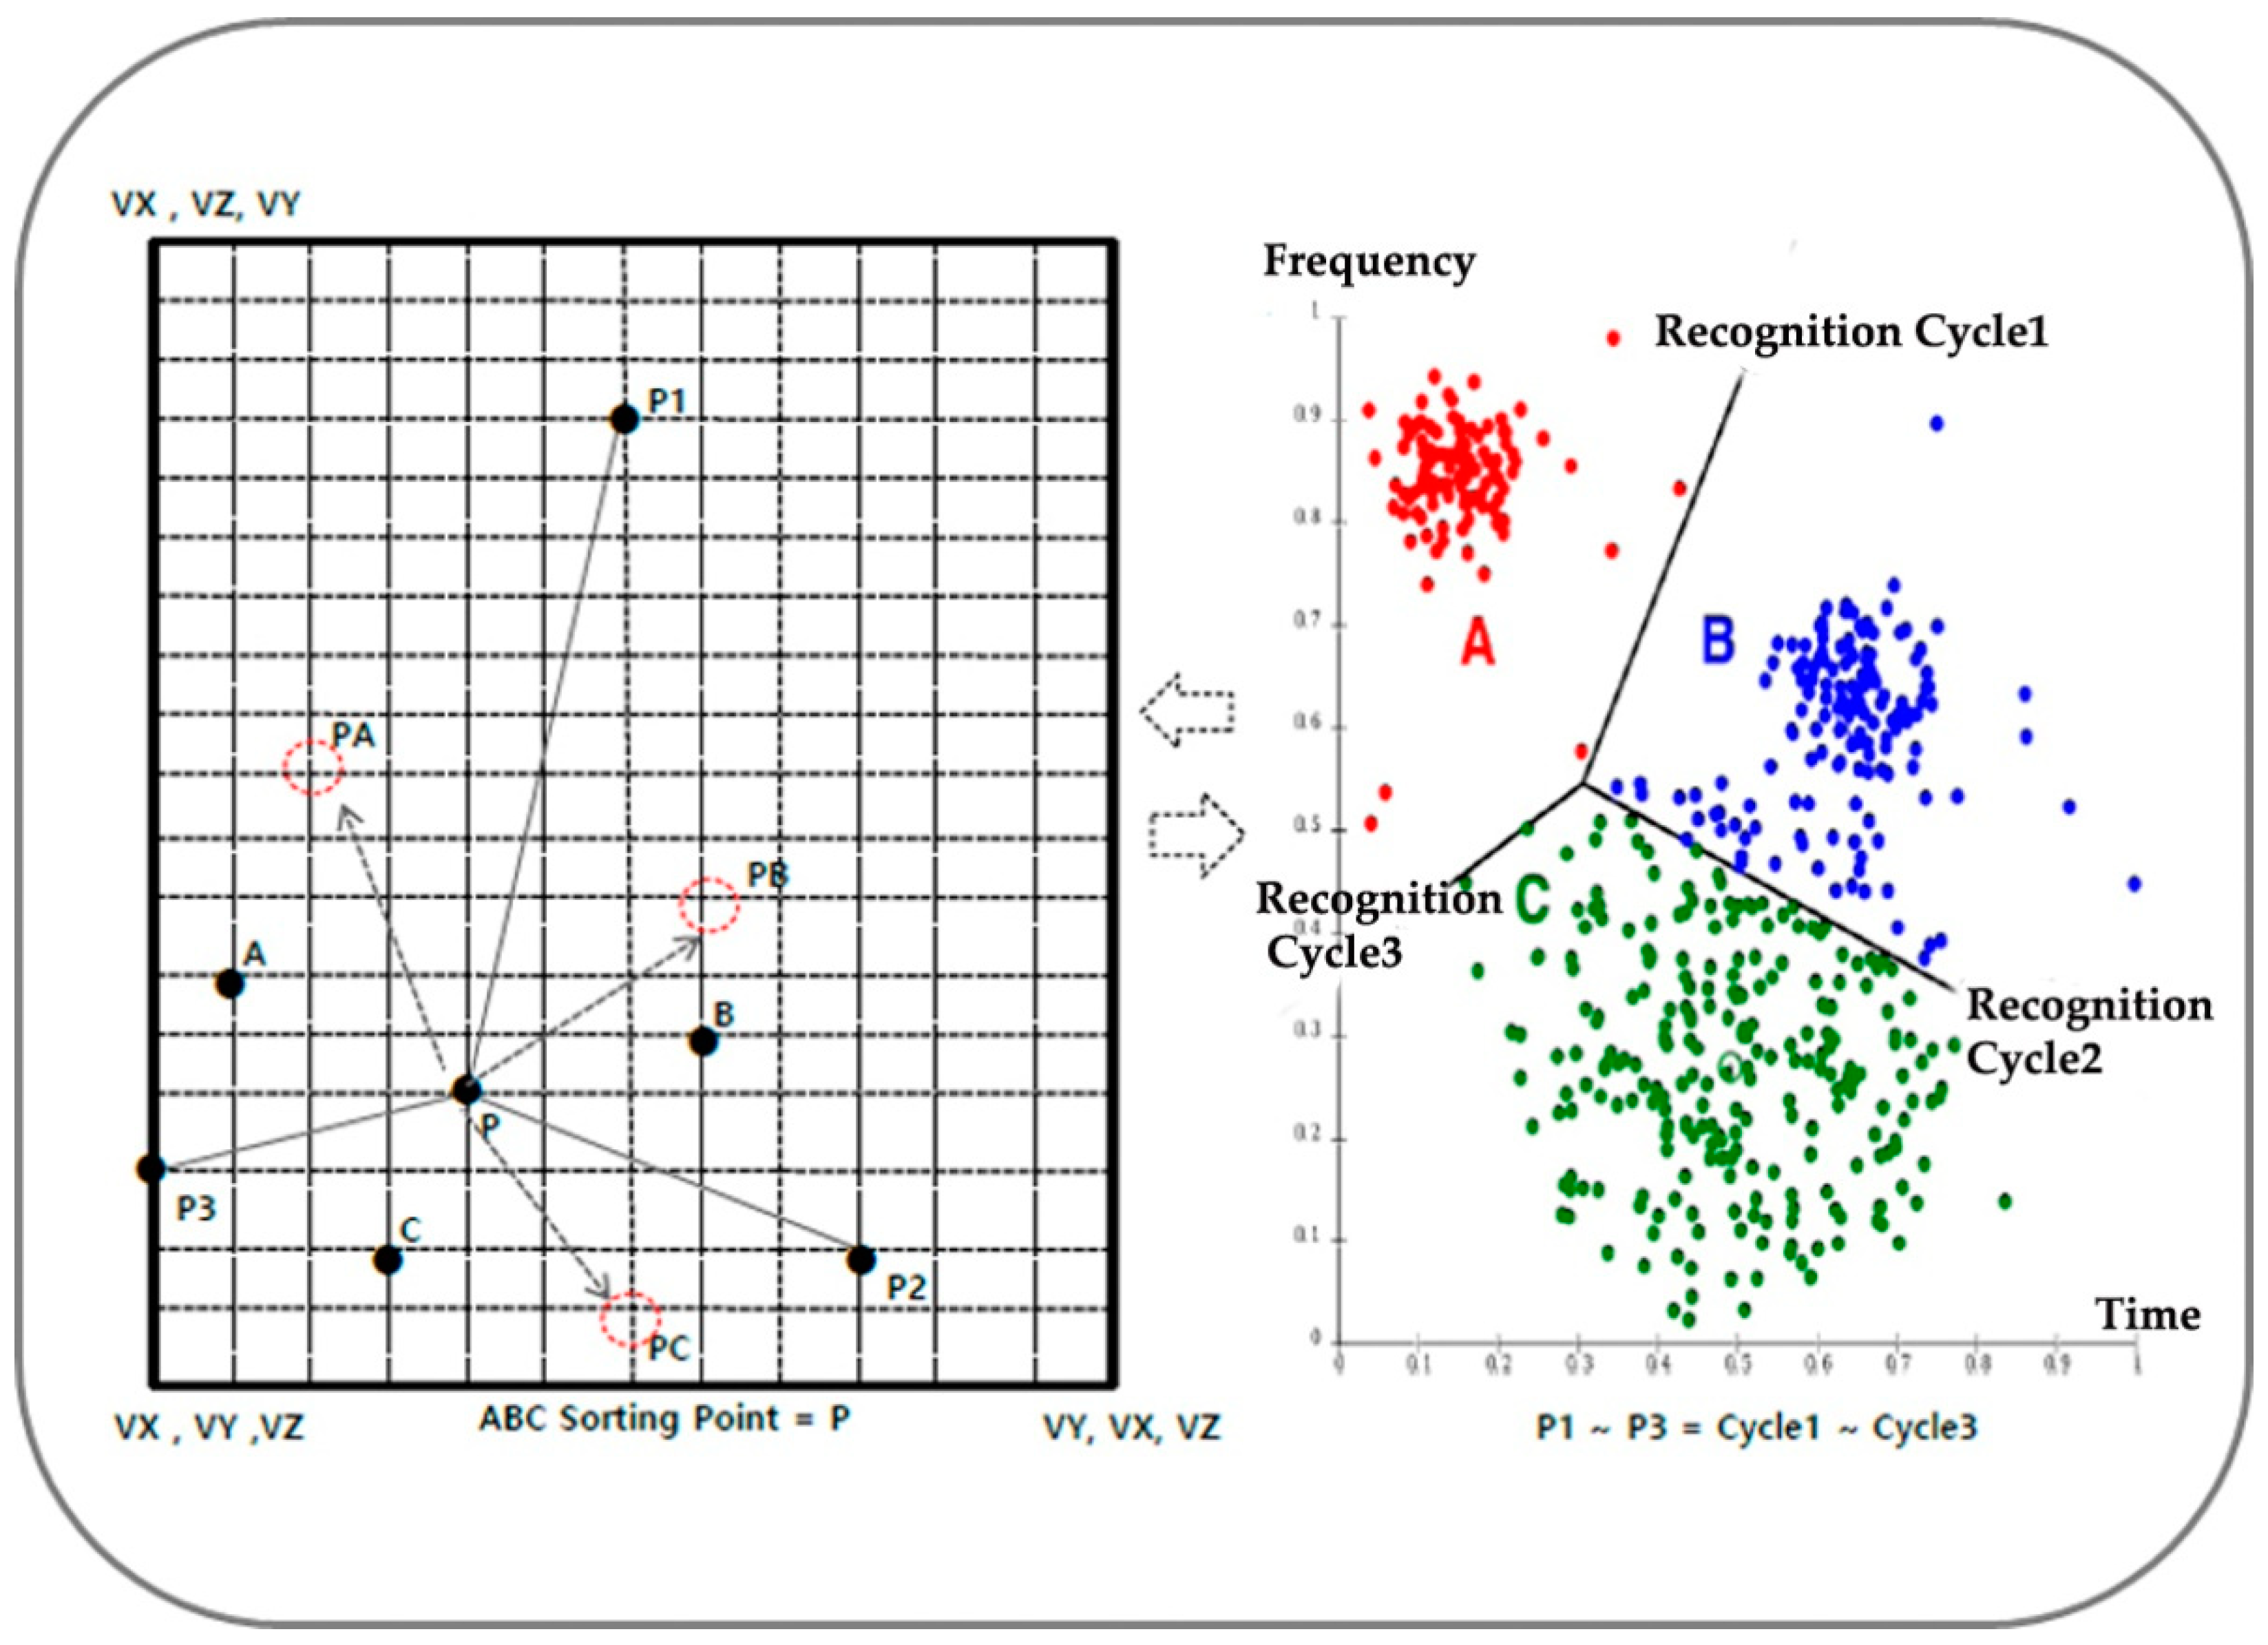
The value of C in Figure 4 is displayed on the graph with the highest wavelength and is displayed with the highest probability. Therefore, the value of A at the present time has a high probability of moving to C as the time value progresses, and the probability that the position value of A will change to the position value of C after time has elapsed is high because C is an assumed value and the last point is a wavelength cycle. However, as shown in the X-axis in Figure 5, the wavelength also changes in proportion to the Y-axis time, so the predicted position is the reference point, P, and the reference lines, P1, P2, and P3, as well as the reference paths, PA, PB, and PC, are the reference lines, P1 and P2. It is reset to Recognition Cycle 1~Recognition Cycle 3, which is the signal recognition period, through to P3.
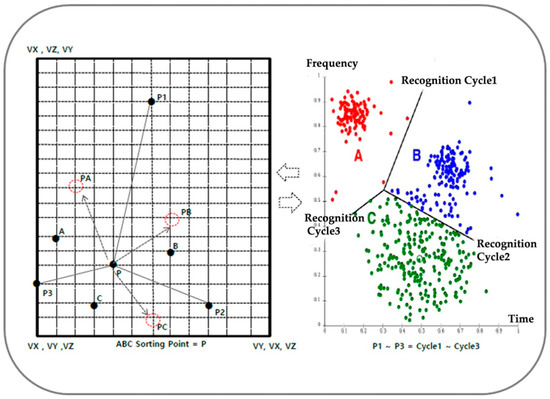
Figure 4.
Two-dimensional location classification.
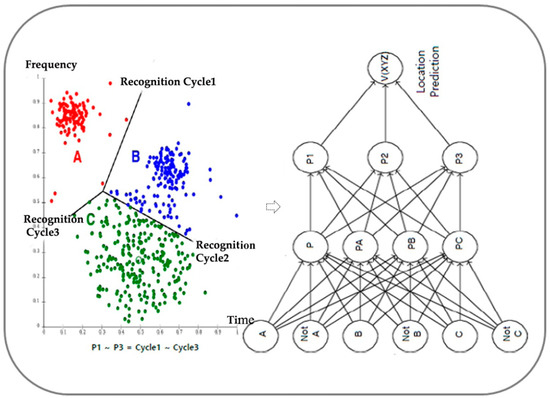
Figure 5.
Learning methodology for tagging data.
In other words, when Recognition Cycle 1~Recognition Cycle 3 change, P1, P2, and P3 also change, so the reference point, P; the reference lines, P1, P2, and P3; and the reference paths, PA, PB, and PC, all change. In this way, since the wavelength and time cannot be regarded as predictable values in the future, the reset baseline P1, P2, and P3 values can be set as reference lines for position movements that can predict future positions. Therefore, since the data obtained through clustering => classification => decision tree are included in the ranges of P1, P2, and P3, they always exist within the range of the predicted values. Since the position data value that exists within the predictable range becomes the closest value to the future position value, the actual predicted value is designated based on the current value of C.
3.4. Classification Location Data
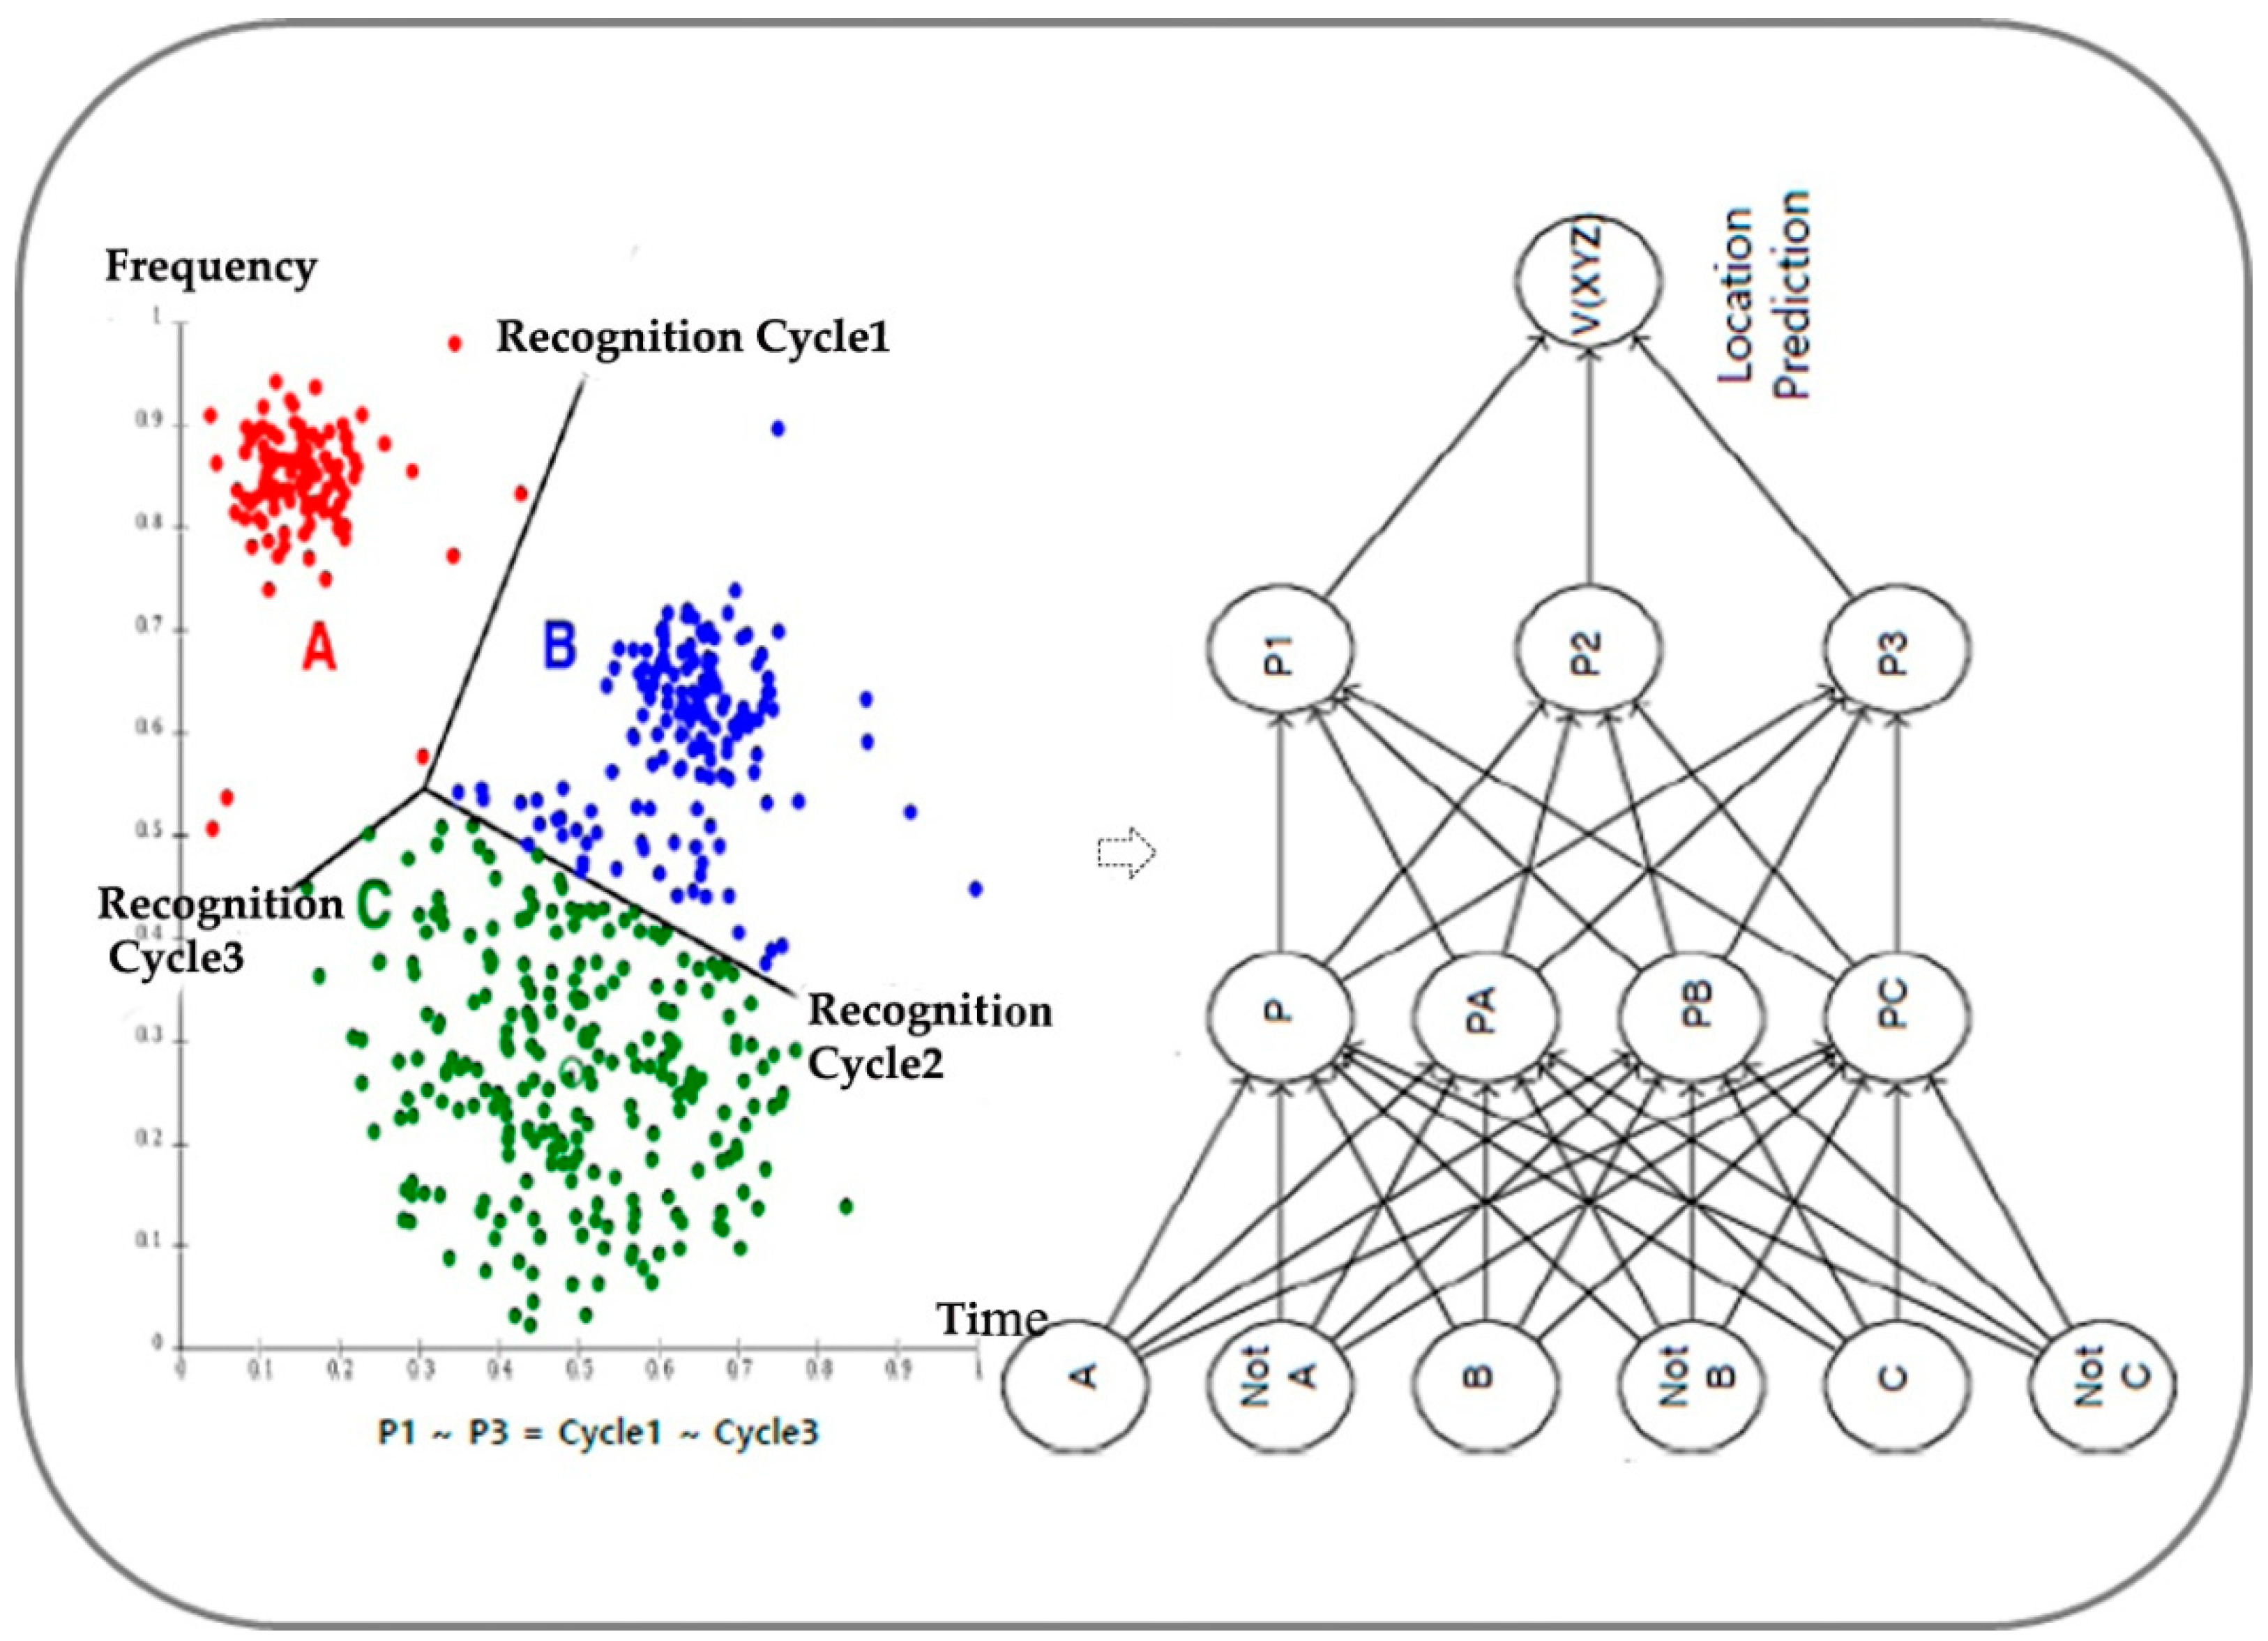
As shown in Figure 5, the location prediction value C always exists between P3 and P2, and the time and wavelength exist between Recognition Cycle 3 and Recognition Cycle 2. The position of A, thus derived through supervised learning, is inserted into the training data when the current position is A, not A, B, not B, C, and other cases as training data. It is determined whether a proximity relationship is formed with the reference point P for prediction, a proximity relationship is formed with PA, a proximity relationship is formed with PB, or a proximity relationship is formed with PC. Naturally, more cases of sites can be added or reduced. Based on the data obtained from P, PA, PB, and PC, the current position of A is finally the value of future V by remapping P1, P2, and P3, which are the baselines that judge the possibility of setting the movement range of the position. V can derive a highly probable predicted value encompassing the present, past, and future based on the current location, time, wavelength, and measurement time.
The value of V thus derived is two-dimensional V0, V1, V6, and V7, that is, CVX, CVY, so it has V0, V1, V6, and V7 values, similar to the algorithm in Figure 3, and V0, V1, V2, V3, and V4. It is converted into a position value belonging to a three-dimensional cube with vertices of V5, V6, and V7. Therefore, the predicted position data are expressed as V(XYZ) with an orthogonal coordinate azimuth. Therefore, the position value of the current sensor position A is changed to the position value of C after a specific time, and the position value becomes V(XYZ). In conclusion, the contents researched and developed in this paper are the existing learning methods by developing a positioning algorithm for 3D space, tagging the position data derived therefrom according to the properties, and applying the optimized learning method to the tagged data. It is possible to calculate future predictable location data based on the location data [4,38,39].
4. Implementation
In order to implement the developed method, the scanner itself that receives the wavelength of the sensor network performs positioning calculations and performs pattern recognition of nodes on the received wavelength and time series data. A system for predicting the future location of sensors included in the sensor network environment in the receiver itself was studied. The originality of the technology is to store the positioning data of the sensor in time series using the positioning technology of the Internet of Things and the pattern recognition of sensor nodes and to use the positioning data of the past as learning data.
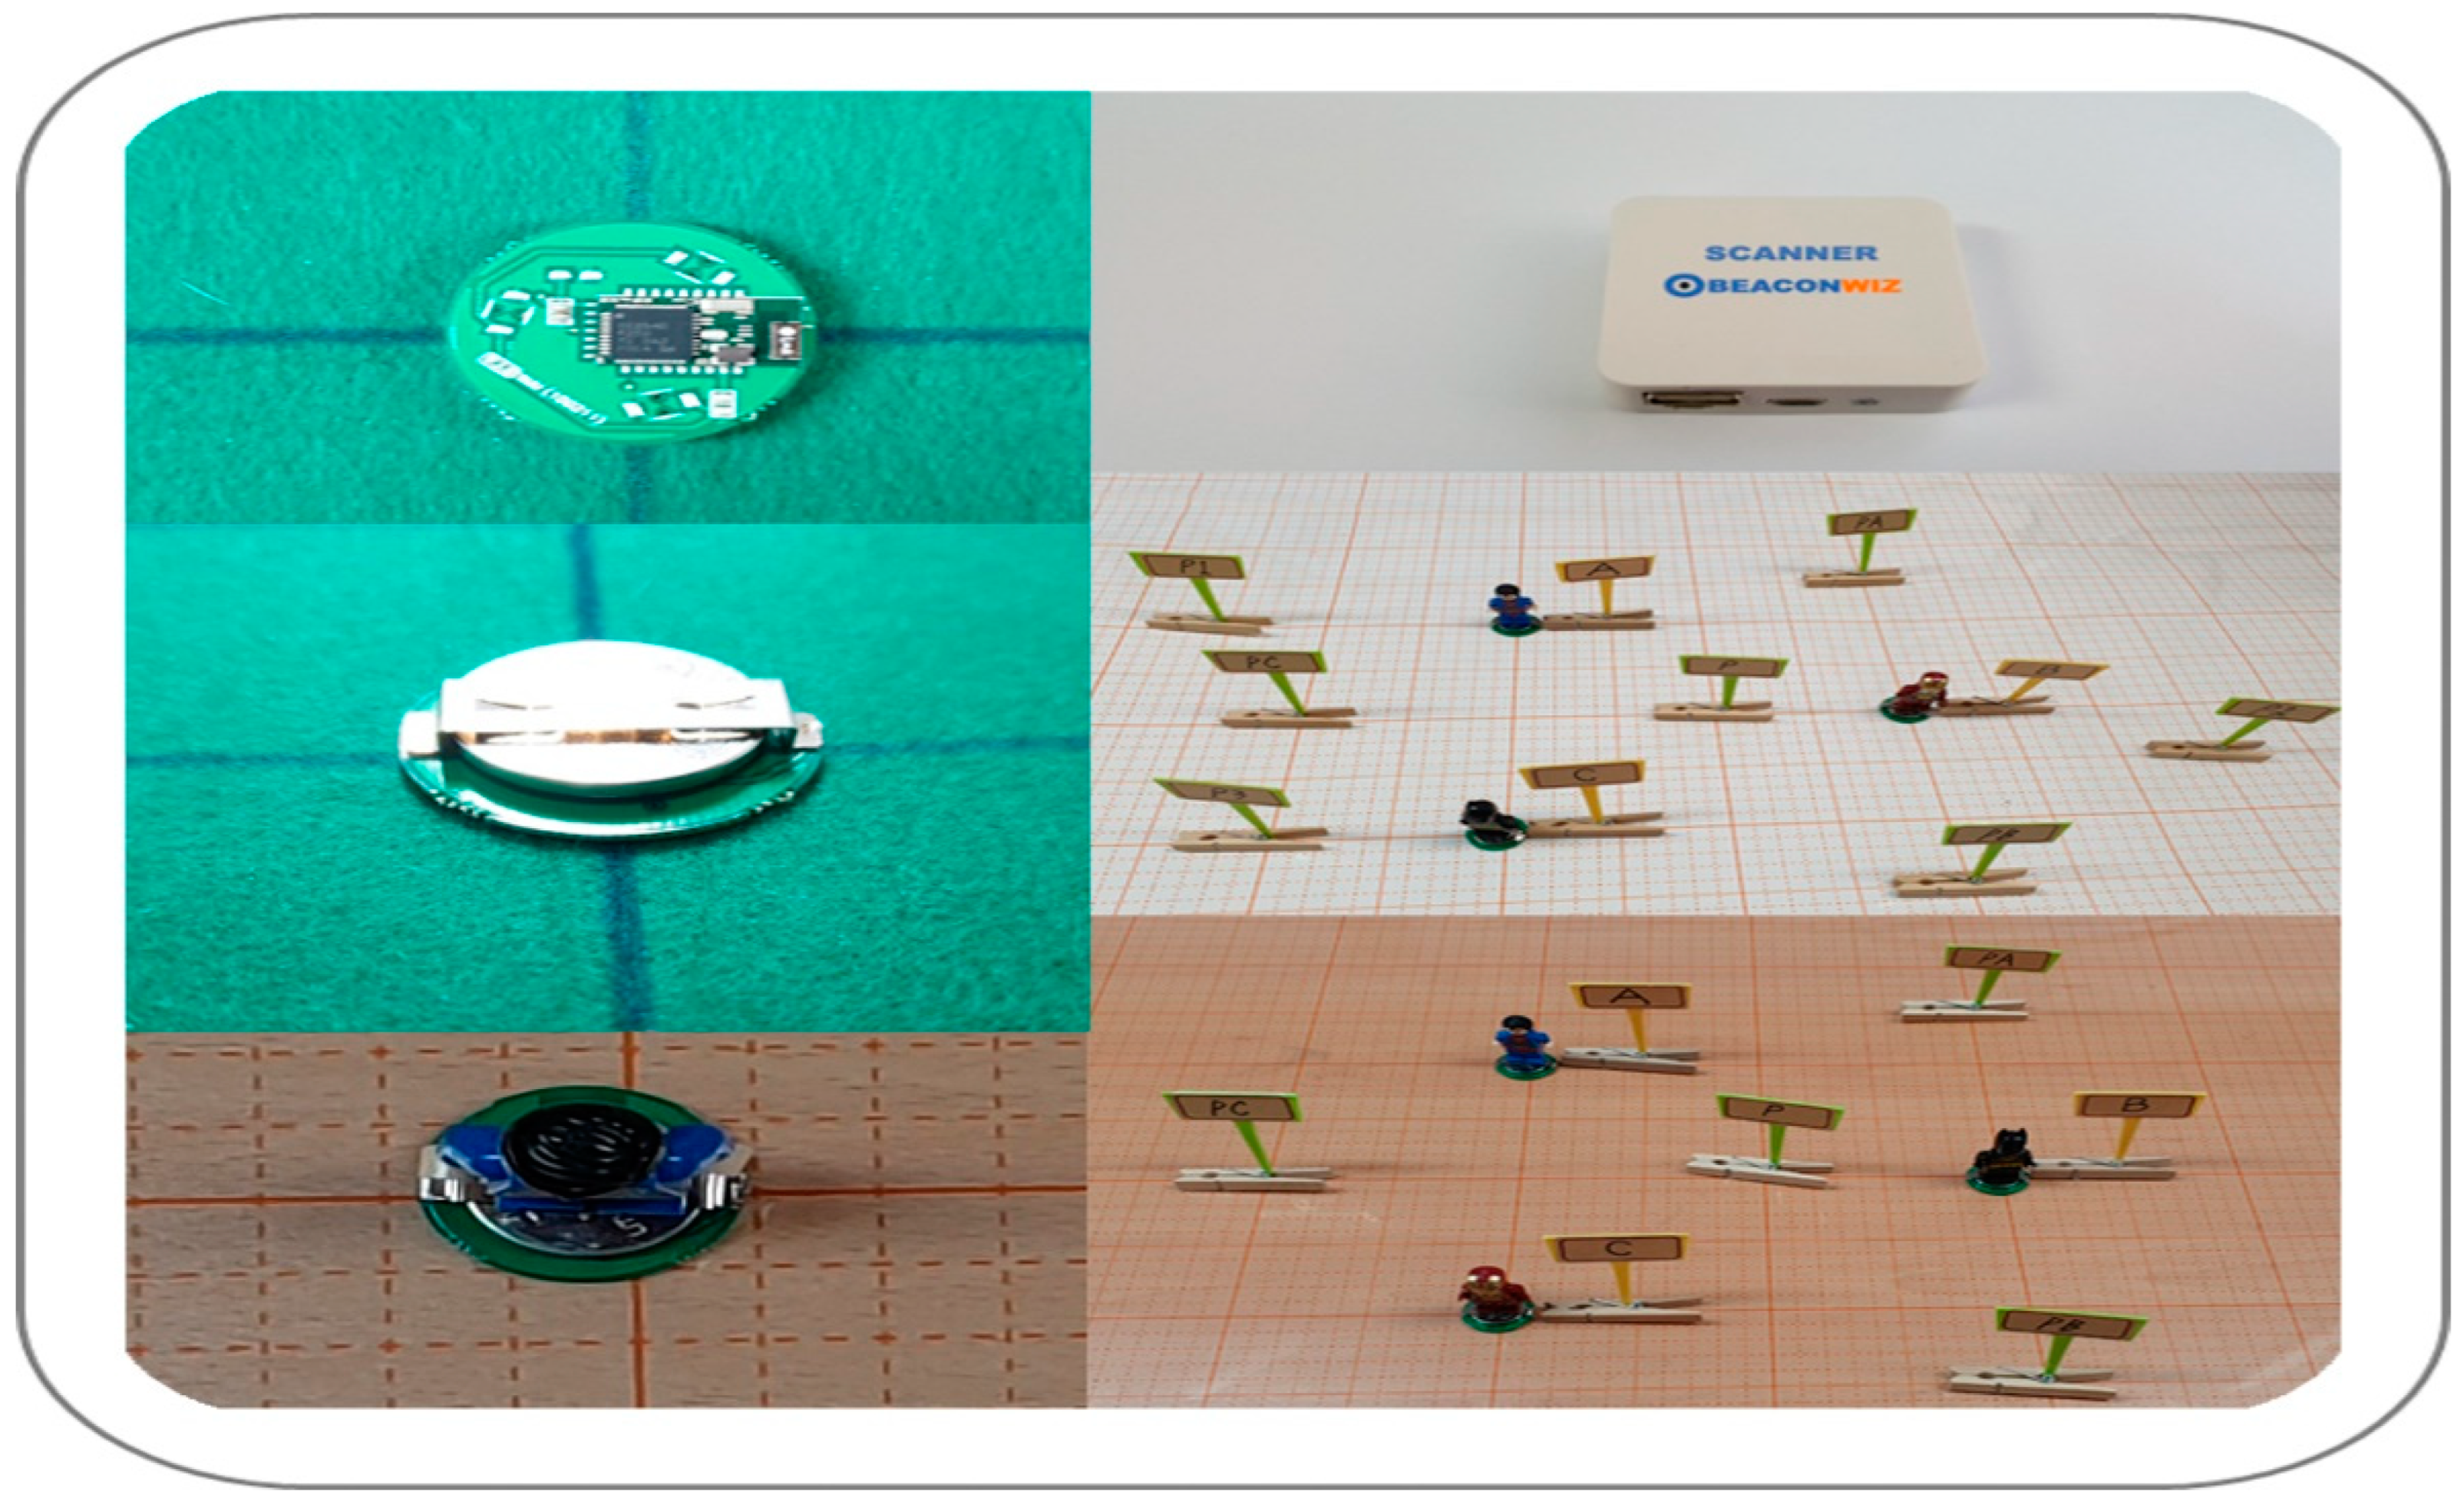
A beacon was used to track the position of the sensor network for positioning of the current time in three dimensions, and a scanner that collected beacon data, three beacon servers connected to the scanner, an MDM (mobile device management) server, a CMS (contents management server), and a new mobile application were created for this study. In order to physically implement this study, a sensor network environment for the sensor position prediction in Table 1 below was constructed.

Table 1.
Data attributes of the sensor network.
After configuring the sensor network devices for the pattern recognition of edge computing, as shown in Figure 6, the labeling and data quality given through annotation work were checked finally to complete the pattern classification dataset.

Figure 6.
Sensor network devices for the pattern recognition of low power sensor.
4.1. Procedure of Implementation
The forward position prediction value, V, of the current sensor position values A, B, and C is always subordinated within the range angles of PA, PB, and PC as well as P1, P2, and P3 once detecting.
The current sensor position can be classified as a selection value that is A or not A, B or not B, and C or not C within 360° as 2D. The current sensor position considers the current value of A, B, or C through whether a proximity relationship is formed with any of PA, PB, and PC, as well as whether a proximity relationship is formed with either P1, P2, or P3.
4.2. Detail Process of Implementation
4.2.1. Dataset Construction Steps for Derived A, B, C, P, PA, PB, PC, P1, P2, and P3
- (1)
- The values derived as P, PA, PB, PC, P1, P2, and P3 through the two-dimensional A, B, and C values, derived based on the above positioning algorithm, are prefixed with A, B, and C labels and timed as suffixes.
- (2)
- These labeled location data are annotated and stored in the database.
- (3)
- If it is assumed that the value of C is outputted with the highest wavelength among the values of A, B, and C measured over time, the value of A at the present time will be the position of the positioning target as time goes by. The assumed value of A means that the probability of moving to C is the highest. That is, after time has passed based on the reference point, P, the position value of A has the highest probability of changing the position value to the position value of C, located between PC and P3.
- (4)
- The values of A, B, and C are stored in time-labeled variables, and the time-labeled A, B, and C variables again reset the values. That is, the reset baseline PA, PB, and PC values can be set as the baselines for position movement that can predict future positions.
- (5)
- Since the data obtained in this way are included in the ranges P1, P2, and P3, they are always within the range of the predicted values. Since the position data value that exists within the predictable range becomes the closest value to the future position value, the actual position prediction value is outputted based on the current value of C.
4.2.2. Pattern Classification Execution Steps for Derived A, B, C, P, PA, PB, PC, P1, P2, and P3
- (1)
- As shown in the figure below, the virtual location prediction value C is always between PA and PC, and the time and wavelength are dependent on the recognition cycle. If not, if it is B, if it is not B, if it is C, and if it is not C. The case into the training data to determine whether they form a proximity relationship with the reference point, P, for position prediction or a proximity relationship with PA and PB and PC. It is related to one of PA, PB, and PC. That is, to reduce the expected future position range to a minimum. It is judged whether they form a proximity relationship with PC or a proximity relationship with PC.
- (2)
- A, B, C, P, PA, PB, PC, P1, P2, and P3 are inserted as variables of pattern classification by themselves, and pattern classification is performed with the actual data values labeled with the variables. Therefore, the values of A, B, C, P, PA, PB, PC, P1, P2, and P3 with labeling at a specific time are cross-classified in the hidden layer based on the input values of A, B, and C as the classification distributions of positions.
- (3)
- Derived as two-dimensional values, P, PA, PB, and PC are derived through the values of A, B, and C, and the movement range of the location can be set based on the data obtained from P, PA, PB, and PC. Finally, by relearning P1, P2, and P3, which are the baselines for judging the possibility, the current position of A is most likely to have a value of V in the future.
- (4)
- V can derive the most probable predicted value covering the present, past, and future based on the current location, time, and measurement time of the radio wavelength.
4.2.3. Restoring the Derived Two-Dimensional Future Location Prediction V Value to a Three-Dimensional Location Value
- (1)
- Since the above-derived values of V are two-dimensional, VX and VY, they can be restored back to V0, V1, V6, and V7 in the same way as when V0, V1, V6, and V7 are changed to VX and VY.
- (2)
- The value of V, which is the finally derived position prediction value, can be converted into V0, V1, V2, V3, V4, V5, V6, and V7, which are three-dimensional cube values. The position in 3D space can be derived from the values of X, Y, and Z, which indicate the position of the small cube where the object exists.
- (3)
- The positioning algorithm has V0, V1, V6, and V7 values, and they can be converted into a position value belonging to a three-dimensional cube with vertices of V0, V1, V2, V3, V4, V5, V6, and V7. The predicted position data are expressed as V(XYZ) with a three-dimensional coordinate azimuth.
- (4)
- Assuming that the position value of the current sensor position A is changed to a specific position value after a specific time, the predicted position value of A becomes V(XYZ).
- (5)
- This proves that future predictable location data can be calculated based on existing learned location data by labeling the location data according to the attributes and applying a learning method suitable for the characteristics of location data to the tagged data.
4.3. Result of Implementation
The value of V predicted through the experiment has the values of CVX and CVY in the two-dimensional plane, and in the three-dimensional plane, it is in a three-dimensional cube called space, with vertices of V0, V1, V2, V3, V4, V5, V6, and V7. This is one detailed cube to which it belongs.
Therefore, the current sensor position prediction value, which is outputted through pattern classification after collecting sensor position data through 3D edge computing, outputs 3D position prediction data again. Although the dimension change algorithm was performed, the actual position value of 3D data can finally be obtained. You can obtain the result that the data type does not change; only the attribute value changes. Therefore, this proves that the dimensional transformation algorithm and pattern classification method of this paper are designed correctly in the sensor position prediction method through edge computing.
5. Performance Evaluation
As a result of the verification, the prediction accuracy improved by 10% compared to the position prediction accuracy suggested in the previous study, and prediction accuracy of 80% or more was realized on average. Through this study, assuming that the pattern classification methodology [40] for the purpose of location-based service is used in this study, it is important to know what data are required, how to obtain them, and how to create clean and high-quality labeled data. In general, the most commonly used past visit patterns [41] were used as learning data. Additionally, since the target of position tracking is the position prediction [42] of a moving object, they were defined as time series data, and the experiment was conducted. This allowed us to check how accurate the processes and algorithms were. A position prediction system through the pattern recognition of edge computing of the sensor network requires higher positioning accuracy than the indoor and outdoor positioning systems that have been proposed, therefore requiring a developed dimensional transformation positioning algorithm. We tried to design and make a system with higher prediction accuracy by using a learning algorithm based on time series data of positioning values [4] that match the characteristics of location data and verify them [41,42]. An RSSI (received signal strength indicator) is not used for an indoor positioning system using a triangulation method or for predicting the distance between a reference point and a terminal on a commonly used sensor network as a fusion of positioning technology and artificial intelligence prediction technology [3]. In this paper, we propose a method for selecting an optimal reference point that can maximize positioning accuracy and a dimensional transformation positioning method to make it adaptable to changes in the radio wave environment for predicting the distance between the selected reference point and the terminal. Additionally, based on the dimensional transformation positioning method, it aims to implement a prediction system through artificial intelligence learning, and it was verified through experiments. Supervised learning was performed to designate target features on the dataset for verification of the study. The remapping was applied to P1, P2, and P3, which are the baselines that judge the possibility of setting the movement range. As a result, there was an attempt to create a result of deriving the current position of A as the value of V, which is the future position, by narrowing the range of the starting position and the final position within a 360° direction angle.
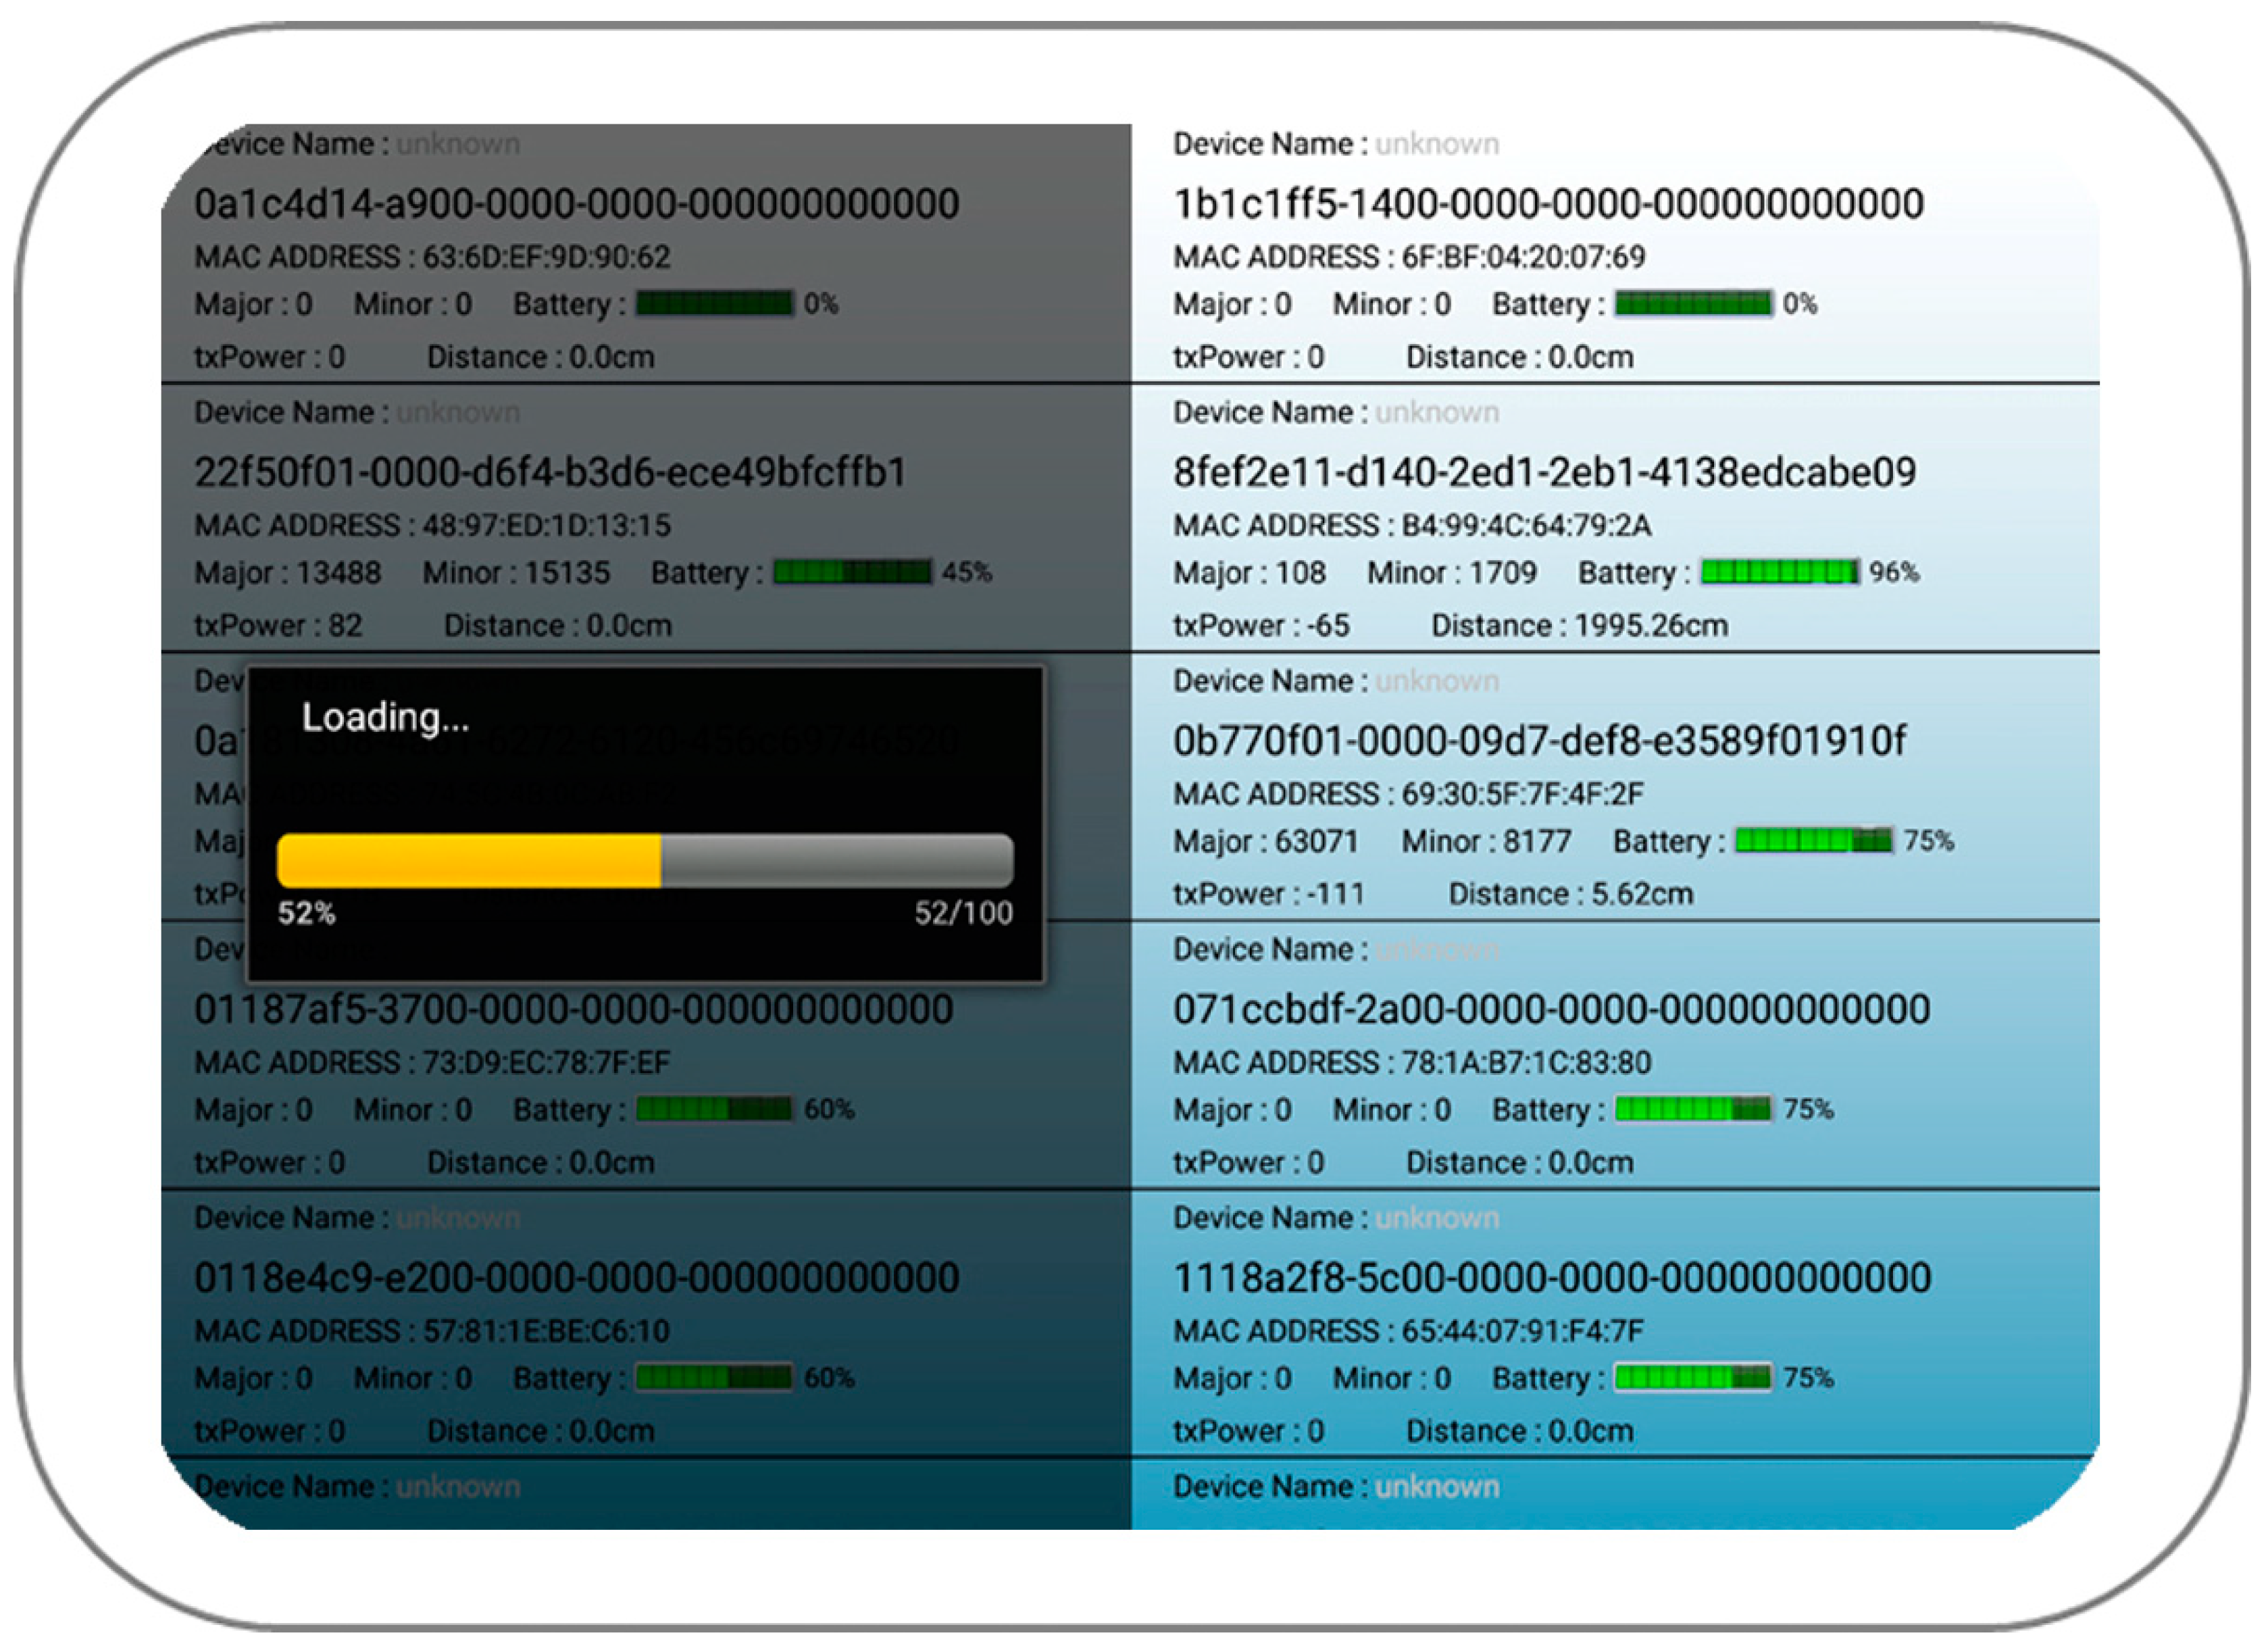
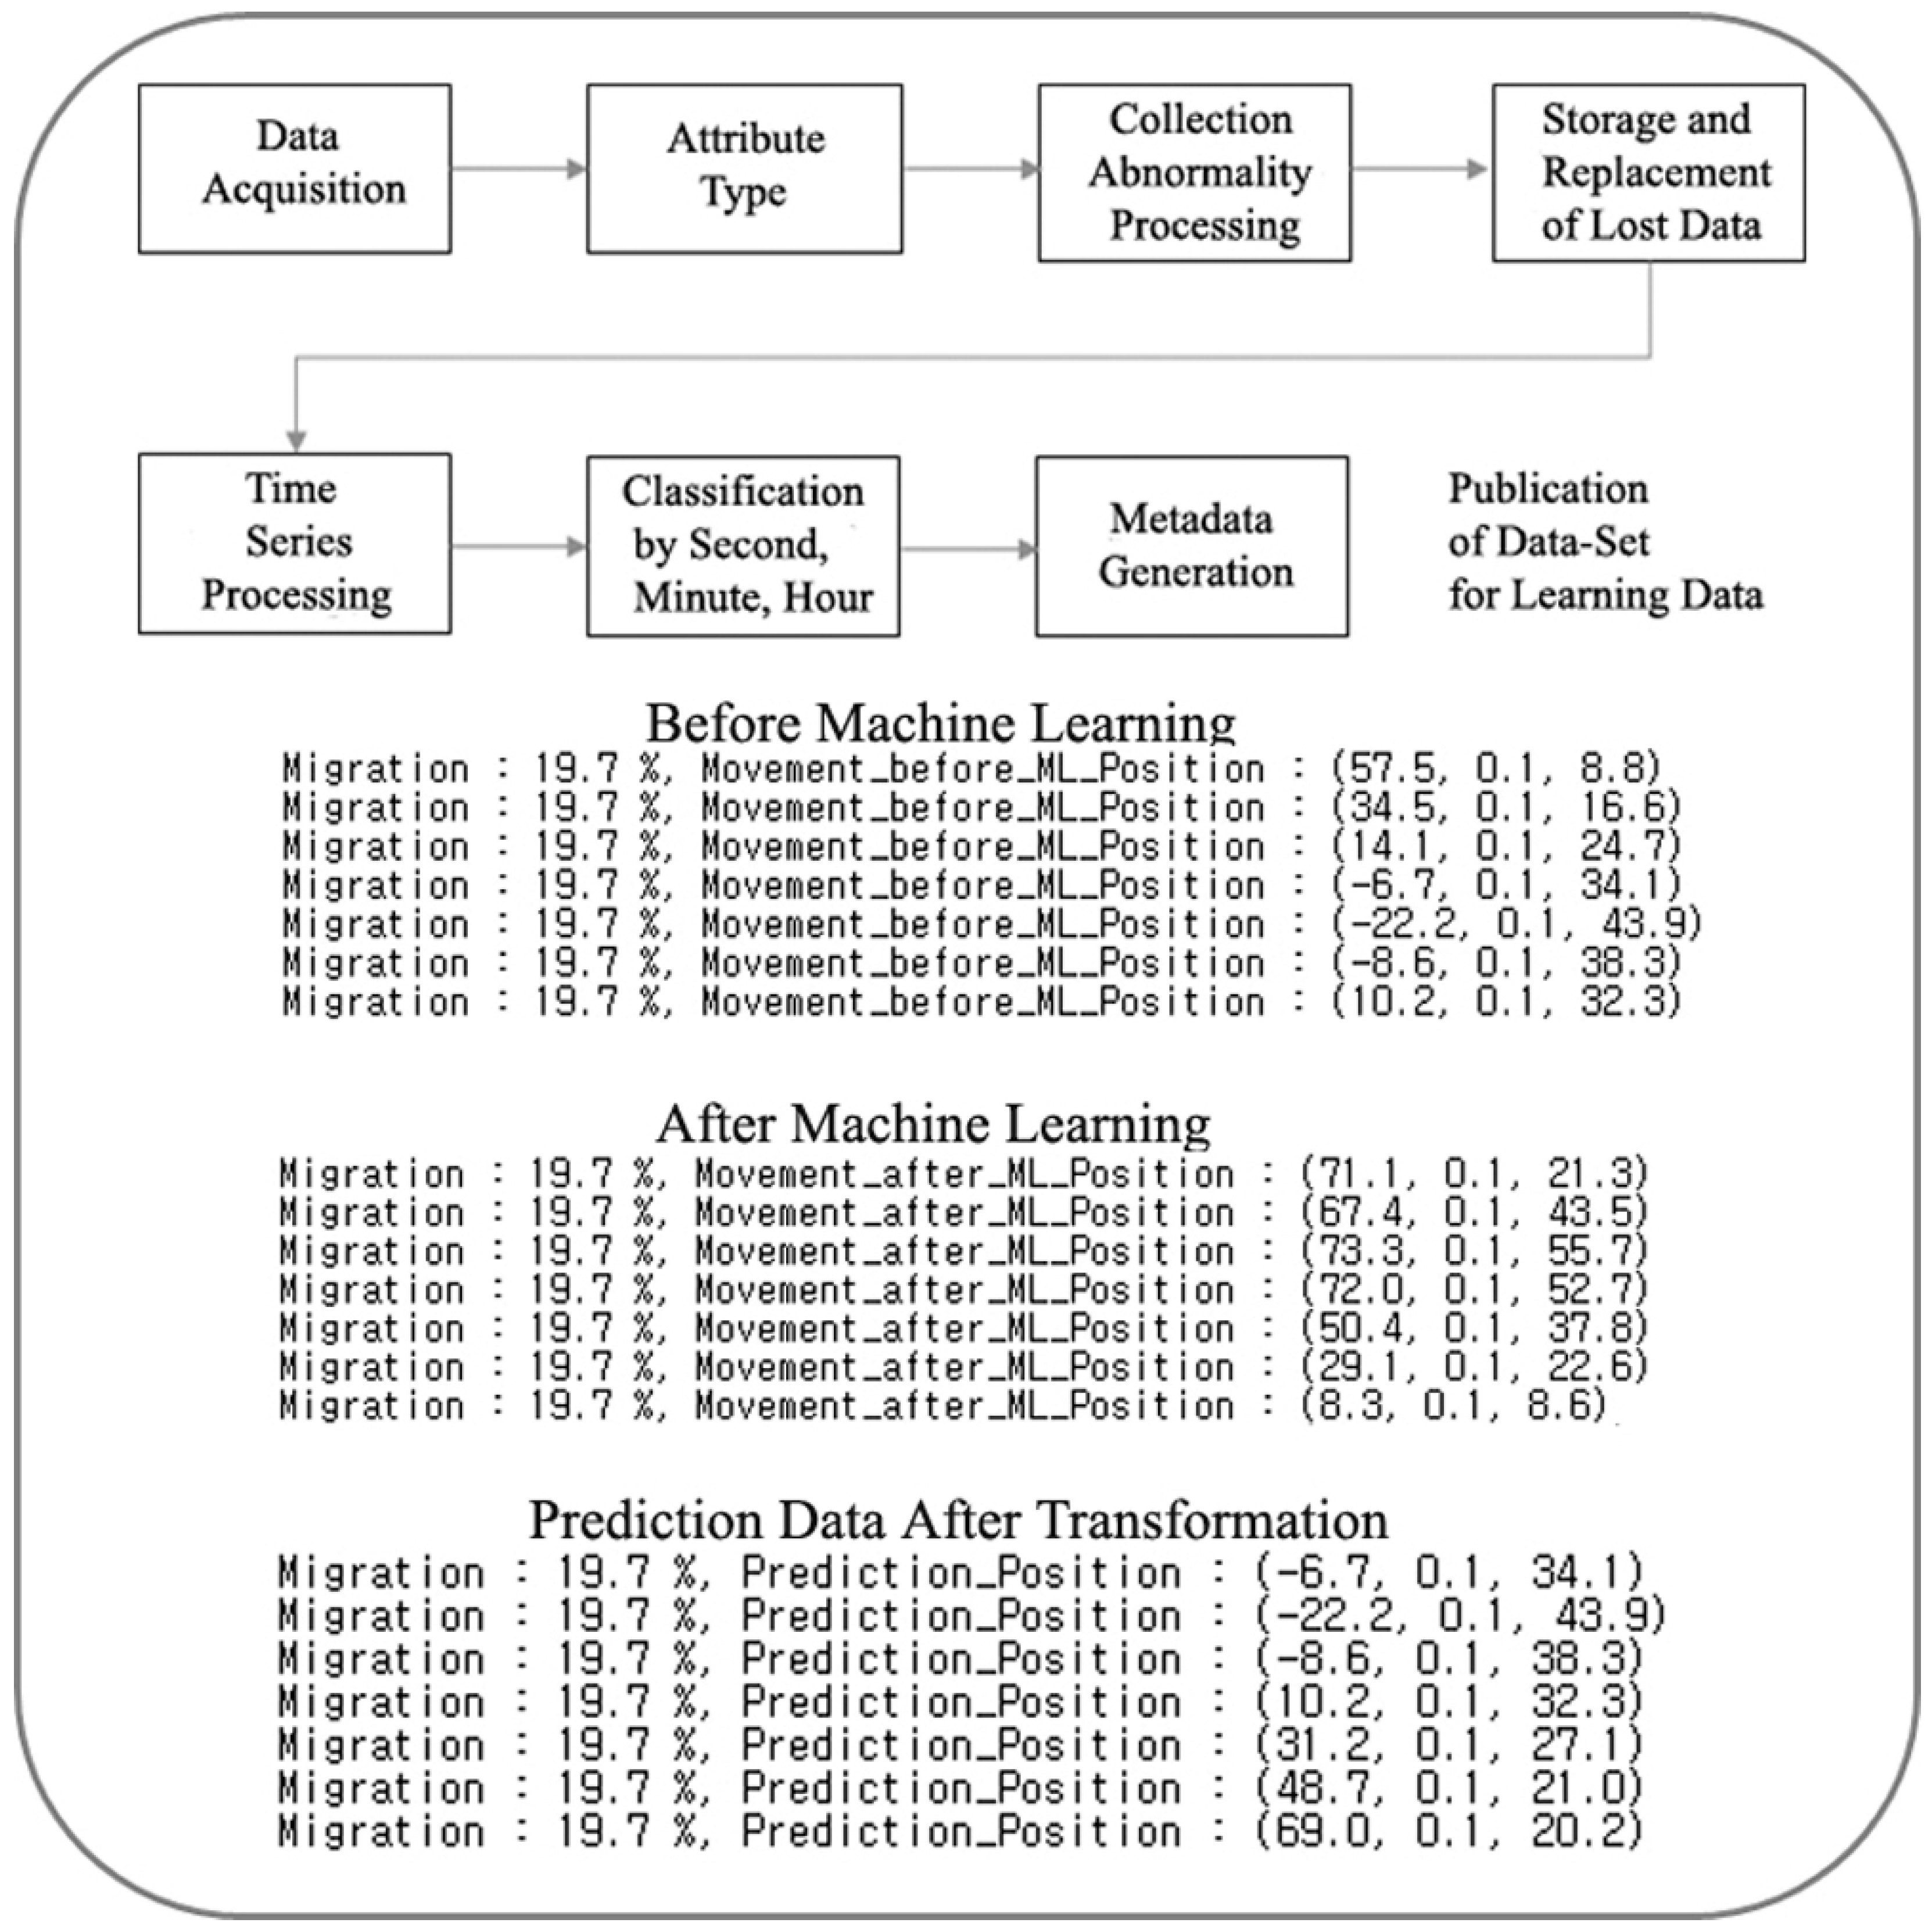
Figure 7 shows that the scanner recognizes the wavelengths of the sensors in the sensor network, converts them into data, and collects them, and Figure 8 is the source code for preprocessing learning on the collected positioning data. Figure 9 annotates the collected sensor data and shows the pretraining dataset, the post-learning dataset, and finally, the predicted value.

Figure 7.
Sensor data collected from the scanner in the sensor network.
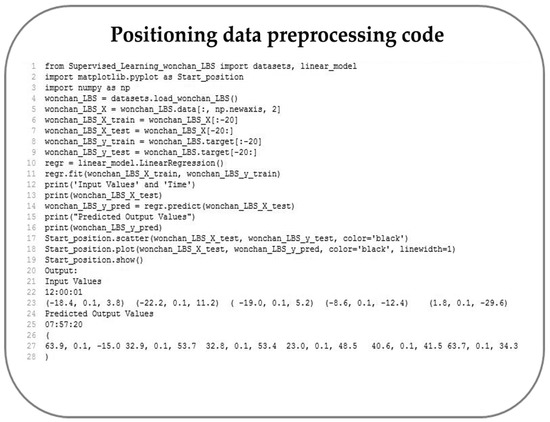
Figure 8.
Positioning data preprocessing code.

Figure 9.
Machine learning sequence for the data collected from the sensor network.
As a result of the experiment, the dimensional transformation localization algorithm and the learning algorithm [5] for the prediction of the method of narrowing the range of the starting position and the final position within a 360° direction angle of two dimensions through experiments were designed accurately, and the sensor A virtual avatar character was assumed as predicted and tested as to how accurately it predicted. As a verification result, compared with the input dataset, the output dataset produced a predicted value of about 7.7 min when the learning time was judged on a 10-min basis, and the accuracy changed from 50% to 72% and then dropped to 45% again. A prediction data value similar to the shape of a waveform of a wavelength with a prediction accuracy that rises to 84% again and falls back to 50% was outputted. Of these figures, 45% and 50% seemed to be caused by the lack of learning time and learning data, and the accuracy of location prediction gradually increases as the amount of learning time and learning data increases.
In the position prediction data using the pattern recognition of edge computing, the accuracy of the predicted position was increased in proportion to the accumulated learning time. Therefore, it was possible to confirm the possibility that a positioning system with positioning data could make a positioning prediction system with higher accuracy in proportion to the optimization technology of the positioning algorithm and the learning time. As with most position prediction systems, it has the prediction accuracy of the shape of the wavelength waveform that has the maximum and minimum values at the same time according to the learning time while rising gently as a probability does. It is judged that the learning time, the amount of learning data, and the learning algorithm have an effect at the same time, and it was confirmed that they are also related to the ratio and quality of the learning data and the test data.
When selecting a model, the commonly used data are divided into two parts: training data and test data. The training data are used to estimate certain parameters of the prediction technique, and the test data are used to evaluate the accuracy. Since the test data are not used to determine predictions, they can serve as an indicator to evaluate how well the model makes predictions on new data [13]. Therefore, in this study, the test data used about 20% of the training data sample to maximize the reliability of the sample prediction accuracy.
In particular, even in various attempts using radio waves, the error of positioning is fundamentally different from the actual location by more than 10%.
We propose a method of displaying the RSS measurement value of frequency and positional accuracy according to the signal strength of the sensor on the 2D coordinate value in proportion to time with Regression, Classification and Clustering corresponding to supervised learning among pattern classification. Convert the actual position value into a two-dimensional coordinate value into a three-dimensional one by using the conversion key value so that there is no error again.
In this way, not only can the accuracy of a specific sensor be improved, but also location prediction data can be extracted using a lot of big data.
The dimensional transformation positioning algorithm is used in the receiver itself that receives the wavelength. As an algorithm that also applies dimensional transformation in real time, the time standard for applying the algorithm is based on real time, and the output prediction data are also based on time. Therefore, when a positioning data value from a specific time point to a specific time point is input as an input value, it is possible to derive a predicted value for that time within the learned specific time range. If positioning data for about 10 min are learned from 12:00:00 to 12:10:00 of a specific date, only the predicted value within 10 min of the specific time can be outputted, and it also starts from a specific time. Therefore, it can be seen that the prediction value that can evaluate the accuracy of the prediction value is outputted after 77% of the time has elapsed. It is from the point at which 77% of the inflection point can be found where the training data and the test data are displayed differently. The scanner (receiver) that receives the wavelength of the sensor network performs positioning calculations and pattern recognition on the received wavelength time series data to predict the future position of the sensor included in the sensor network environment in the receiver itself. In general 3D, the results of the experiment contain many errors, so it is impossible to predict the location accurately.
As shown in Figure 10, the prediction accuracy of the paper is compared with the input location dataset, and the output location dataset can be expressed as a point of comparison between the training data and test data. A sample of the predicted value was output from about 7.7 min, and the accuracy was changed from 50% to 72%, then dropped to 45% again, rose to 84% again, and dropped again to 50%. A similar predicted data value was outputted. Of these figures, 45% and 50% seemed to be caused by the lack of learning time and learning data for the location prediction system. As the amount of learning time and learning data increases, the accuracy of location prediction gradually increases. The prediction system can obtain the result that the prediction accuracy of the location data increases in proportion to the accumulated learning time, as shown in Figure 10.
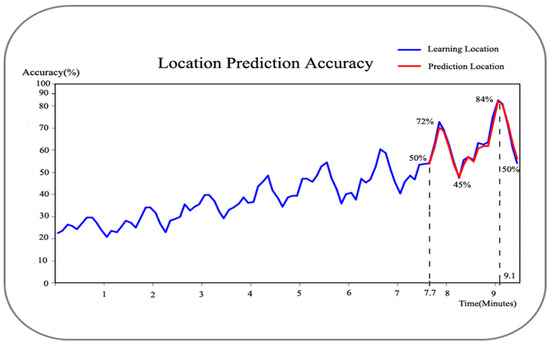
Figure 10.
Accuracy of the position prediction system based on pattern recognition.
6. Conclusions
The dimensionally transformed position value derived by pattern classification can have the effect of improving and correcting the accuracy of the position that exists in an actual three-dimensional space, and it can learn more and more position data as time goes by. The positioning technology proposed so far has always had a positioning error due to frequency distortion and inaccuracy of the Doppler equation when using radio waves, except for errors in the space itself. Therefore, in conclusion, it is possible to see the effect of improving the accuracy of the position value for a specific target over time.
We researched that solving the inaccuracy and unpredictability of positioning technology in 3D space has begun. First, a dimensional transformation method was developed to reduce the three-dimensional positioning error. It is a method of changing three-dimensional position data into two-dimensional position data while maintaining properties.
After converting the three-dimensional to the two-dimensional position, data is used. When the deep learning methodology optimized for location data is applied, a much more accurate location value can be derived.
Second, a method was used to reduce the range of predictable positions in the future by reducing the range of the two-dimensional movable direction angle through the reference line.
It was confirmed that the accuracy of the location data also increases as the learning time for the location data increases in dimensional transformation-based positioning.
This paper has proposed a dimensional transformation method for space and a method to increase the accuracy of positioning through deep learning of the position data generated through it.
The way to reduce the range is to predict the future locations by using the pattern recognition of the location data of the previous time as if folding a collapsible fan little by little. The scanner that receives the wavelength of the sensor network performs position calculations and pattern recognition on the received wavelength time series data to predict the future positions of the sensor included in the sensor network environment in the receiver itself.
By changing the positioning method from the actual three-dimensional MAP that exists to a two-dimensional MAP, the possibility of spatial distortion in positioning is reduced as much as possible. When the training time for the time series position data and the size of the training data are at their maximum, the accuracy of the position prediction system was recorded as being the highest. It is expected that more training data and more training time will be required to create a better localization system. A position prediction system that performs learning by recognizing position data as a problem in the pattern recognition method of an edge computer can create a position prediction system with higher accuracy in proportion to the optimization method of the positioning algorithm and the learning time. The core idea of the positioning algorithm is to reduce the range of positions to move forward, such as folding a collapsible fan and increasing the accuracy of predictions. Baselines and reference paths can be added continuously. This narrows the range of motion and increases the prediction accuracy. The positioning, which recognizes position data as a pattern recognition problem and performs learning, was able to confirm the possibility of making a location correction system with higher accuracy in proportion to the optimization technology of the positioning algorithm and the learning time. The core idea of the learning algorithm is to derive predictive values through location pattern recognition.
In the case of general statistical data, a more optimized result can be obtained through pattern classification, and it was confirmed that the dimensionally transformed position data further increases the effect of pattern classification than the general method of positioning.
The scanner that receives the wavelength of the sensor network performs position calculations and pattern recognition on the time series data of the received wavelength, such that the sensor included in the sensor network environment is detected by the receiver. In our next study, we will create a system that can predict the future positions of a sensor more accurately than can be done so now by using an optimized positioning algorithm and increasing pattern classification time.
Author Contributions
Validation, C.-S.J.; Writing—original draft, W.L. All authors have read and agreed to the published version of the manuscript.
Funding
This research received no external funding.
Institutional Review Board Statement
Not applicable.
Informed Consent Statement
Not applicable.
Data Availability Statement
Not applicable.
Conflicts of Interest
The authors declare no conflict of interest.
References
- Yao, W.; Ma, L. Research and Application of Indoor Positioning Method Based on Fixed Infrared Beacon. In Proceedings of the 2018 37th Chinese Control Conference (CCC), Wuhan, China, 25–27 July 2018; pp. 5375–5379. [Google Scholar] [CrossRef]
- Sekmen, B.; Özyılmaz, K.R.; Ince, G.; Özyılmaz, K.R. An efficient beacon hardware for indoor location services. In Proceedings of the 2016 24th Signal Processing and Communication Application Conference (SIU), Zonguldak, Turkey, 16–19 May 2016; pp. 217–220. [Google Scholar] [CrossRef]
- Guaman, B.P.; Cordero, J. Indoor positioning system using Beacon technology. In Proceedings of the 2020 15th Iberian Conference on Information Systems and Technologies (CISTI), Sevilla, Spain, 24–27 June 2020; pp. 1–4. [Google Scholar] [CrossRef]
- Chen, N.C.; Xie, W.; Welsch, R.E.; Larson, K.; Xie, J. Comprehensive Predictions of Tourists’ Next Visit Location Based on Call Detail Records Using Machine Learning and Deep Learning Methods. In Proceedings of the 2017 IEEE International Congress on Big Data (BigData Congress), Honolulu, HI, USA, 11–14 December 2017; pp. 1–6. [Google Scholar] [CrossRef]
- Fan, X.; Guo, L.; Han, N.; Wang, Y.; Shi, J.; Yuan, Y. A Deep Learning Approach for Next Location Prediction. In Proceedings of the 2018 IEEE 22nd International Conference on Computer Supported Cooperative Work in Design (CSCWD), Nanjing, China, 9–11 May 2018; pp. 69–74. [Google Scholar] [CrossRef]
- Yue-Qiang, R.; Ze, W.; Xiao-Na, S.; Shi-Min, S. A Multi-Element Hybrid Location Recommendation Algorithm for Location Based Social Networks. IEEE Access 2019, 7, 100416–100427. [Google Scholar] [CrossRef]
- Mourchid, F.; Habbani, A.; El Koutbi, M. Mining user patterns for location prediction in mobile social networks. In Proceedings of the 2014 Third IEEE International Colloquium in Information Science and Technology (CIST), Tetouan, Morocoo, 20–22 October 2014; pp. 213–218. [Google Scholar] [CrossRef]
- Li, Y.; Lei, L.; Yan, M. Mobile user Location Prediction Based on user Classification and Markov Model. In Proceedings of the 2019 International Joint Conference on Information, Media and Engineering (IJCIME), Osaka, Japan, 17–19 December 2019; pp. 440–444. [Google Scholar] [CrossRef]
- Zhang, W.; Han, G.; Wang, X.; Guizani, M.; Fan, K.; Shu, L. A Node Location Algorithm Based on Node Movement Prediction in Underwater Acoustic Sensor Networks. IEEE Trans. Veh. Technol. 2020, 69, 3166–3178. [Google Scholar] [CrossRef]
- Li, F.; Li, Q.; Li, Z.; Huang, Z.; Chang, X.; Xia, J. A Personal Location Prediction Method to Solve the Problem of Sparse Trajectory Data. In Proceedings of the 2019 20th IEEE International Conference on Mobile Data Management (MDM), Hong Kong, China, 10–13 June 2019; pp. 329–336. [Google Scholar] [CrossRef]
- Adesina, D.; Adagunodo, O.; Dong, X.; Qian, L. “Aircraft Location Prediction using Deep Learning” Center of Excellence in Research andEducation for Big Military Data Intelligence. In Proceedings of the 2019 IEEE Military Communications Conference, MILCOM 2019, Norfolk, VA, USA, 12–14 November 2019. [Google Scholar]
- Sassi, A.; Brahimi, M.; Bechkit, W.; Bachir, A. Location Embedding and Deep Convolutional Neural Networks for Next Location Prediction. In Proceedings of the 2019 IEEE 44th LCN Symposium on Emerging Topics in Networking, Osnabrück, Germany, 14–17 October 2019; pp. 149–157. [Google Scholar]
- Rehman, F.; Malik, M.; Faisal, M.S. Significance of Linguistic Indicators for Location Prediction. In Proceedings of the 2019 22nd International Multitopic Conference (INMIC) Multitopic Conference (INMIC), Islamabad, Pakistan, 29–30 November 2019; pp. 1–6. [Google Scholar]
- Shanmuganathan, V.; Yesudhas, H.R.; Madasamy, K.; Alaboudi, A.A.; Luhach, A.K.; Jhanjhi, N.Z. AI Based Forecasting of Influenza Patterns from Twitter Information Using Random Forest Algorithm. Hum. Cent. Comput. Inf. Sci. 2021, 11, 33. [Google Scholar] [CrossRef]
- Liu, Y.; Bao, Z.; Zhang, Z.; Tang, D.; Xiong, F. Information cascades prediction with attention neural network. Hum. Cent. Comput. Inf. Sci. 2020, 10, 13. [Google Scholar] [CrossRef]
- Lee, W.-C.; Jeon, Y.-B.; Han, S.-S.; Jeong, C.-S. Position Prediction in Space System for Vehicles Using Artificial Intelligence. Symmetry 2022, 14, 1151. [Google Scholar] [CrossRef]
- Liu, W.; Wang, P.; Meng, Y.; Zhao, C.; Zhang, Z. Cloud spot instance price prediction using KNN regression. Hum. Cent. Comput. Inf. Sci. 2020, 10, 34. [Google Scholar] [CrossRef]
- Chen, Y.; Zhang, R. Default Prediction of Automobile Credit Based on Support Vector Machine. J. Inf. Process. Syst. 2021, 17, 75–88. [Google Scholar] [CrossRef]
- Liu, M.; Hu, Q.; Guo, J.; Chen, J. Link Prediction Algorithm for Signed Social Networks Based on Local and Global Tightness. J. Inf. Process. Syst. 2021, 17, 213–226. [Google Scholar] [CrossRef]
- Shen, H.; Zhang, X.; Yi, Y. Integral Sliding Mode Anti-Disturbance Control for Markovian Jump Systems with Mismatched Disturbances. Electronics 2021, 10, 1075. [Google Scholar] [CrossRef]
- Chan, T.K.; Chin, C.S. Review of Autonomous Intelligent Vehicles for Urban Driving and Parking. Electronics 2021, 10, 1021. [Google Scholar] [CrossRef]
- Chavez-Burbano, P.; Rabadan, J.; Guerra, V.; Perez-Jimenez, R. Flickering-Free Distance-Independent Modulation Scheme for OCC. Electronics 2021, 10, 1103. [Google Scholar] [CrossRef]
- Li, D.; Dornadula, V.; Lin, K.; Wehner, M. Position Control for Soft Actuators, Next Steps toward Inherently Safe Interaction. Electronics 2021, 10, 1116. [Google Scholar] [CrossRef]
- Capineri, L.; Bulletti, A. A Versatile Analog Electronic Interface for Piezoelectric Sensors Used for Impacts Detection and Positioning in Structural Health Monitoring (SHM) Systems. Electronics 2021, 10, 1047. [Google Scholar] [CrossRef]
- Huh, J.-H.; Seo, K. An Indoor Location-Based Control System Using Bluetooth Beacons for IoT Systems. Sensors 2017, 17, 2917. [Google Scholar] [CrossRef] [Green Version]
- Kim, S.-K.; Huh, J.-H. A Study on the Improvement of Smart Grid Security Performance and Blockchain Smart Grid Perspective. Energies 2018, 11, 1973. [Google Scholar] [CrossRef] [Green Version]
- Kim, S.-K.; Kim, U.-M.; Huh, J.-H. A Study on Improvement of Blockchain Application to Overcome Vulnerability of IoT Multiplatform Security. Energies 2019, 12, 402. [Google Scholar] [CrossRef] [Green Version]
- Li, H.; Ota, K.; Dong, M.; Guo, M. Learning Human Activities through Wi-Fi Channel State Information with Multiple Access Points. IEEE Commun. Mag. 2018, 56, 124–129. [Google Scholar] [CrossRef] [Green Version]
- Yin, B.; Zhou, S.; Zhang, S.; Gu, K.; Yu, F. On Efficient Processing of Continuous Reverse Skyline Queries in Wireless Sensor Networks. KSII Trans. Internet Inf. Syst. 2017, 11, 1931–1953. [Google Scholar]
- Wang, J.; Yang, Y.; Wang, T.; Sherratt, R.; Zhang, J. Big Data Service Architecture: A Survey. J. Internet Technol. 2020, 21, 393–405. [Google Scholar]
- Pu, B.; Li, K.; Li, S.; Zhu, N. Automatic Fetal Ultrasound Standard Plane Recognition Based on Deep Learning and IIoT. IEEE Trans. Ind. Inform. 2021, 17, 7771–7780. [Google Scholar] [CrossRef]
- Sivakumar, N.R. Stabilizing energy consumption in unequal clusters of wireless sensor networks. Comput. Mater. Contin. 2020, 64, 81–96. [Google Scholar] [CrossRef]
- Liu, Y.; Cheng, W.; Zhang, L. A Distributed Location Correction Algorithm in the WSNs. In Proceedings of the 2006 International Symposium on Communications and Information Technologies, Bangkok, Thailand, 20 September–18 October 2006; pp. 166–170. [Google Scholar] [CrossRef]
- Sun, R.; Wang, G.; Cheng, Q.; Fu, L.; Chiang, K.-W.; Hsu, L.-T.; Ochieng, W.Y. Improving GPS Code Phase Positioning Accuracy in Urban Environments Using Machine Learning. IEEE Internet Things J. 2020, 8, 7065–7078. [Google Scholar] [CrossRef]
- Draghici, I.-C.; Vasilateanu, A.; Goga, N.; Pavaloiu, B.; Guta, L.; Mihailescu, M.N.; Boiangiu, C.-A. Indoor positioning system for location based healthcare using trilateration with corrections. In Proceedings of the 2017 International Conference on Engineering, Technology and Innovation (ICE/ITMC), Madeira, Portugal, 27–29 June 2017; pp. 169–172. [Google Scholar] [CrossRef]
- Gilabert, R.; Dill, E.; de Haag, M.U. Location corrections through differential networks (LOCD-IN). In Proceedings of the 2018 IEEE/ION Position, Location and Navigation Symposium (PLANS), Monterey, CA, USA, 23–26 April 2018; pp. 382–388. [Google Scholar] [CrossRef] [Green Version]
- Sashida, A.; Moussa, D.P.; Nakamura, M.; Kinjo, H. A Machine Learning Approach to Indoor Positioning for Mobile Targets using BLE Signals. In Proceedings of the 2019 34th International Technical Conference on Circuits/Systems, Computers and Communications (ITC-CSCC), JeJu, Korea, 28–30 June 2019; pp. 1–4. [Google Scholar] [CrossRef]
- Indira, K.; Brumancia, E.; Kumar, P.S.; Reddy, S.P.T. Location prediction on Twitter using machine learning Techniques. In Proceedings of the 2019 3rd International Conference on Trends in Electronics and Informatics (ICOEI), Tirunelveli, India, 23–25 April 2019; pp. 700–703. [Google Scholar] [CrossRef]
- Liao, J.; Liu, T.; Liu, M.; Wang, J.; Wang, Y.; Sun, H. Multi-Context Integrated Deep Neural Network Model for Next Location Prediction. IEEE Access 2018, 6, 21980–21990. [Google Scholar] [CrossRef]
- Abo-Zahhad, M.; Ahmed, S.M.; Mourad, M. Future location prediction of mobile subscriber over mobile network using Intra Cell Movement pattern algorithm. In Proceedings of the 2013 1st International Conference on Communications, Signal Processing, and their Applications (ICCSPA), Sharjah, United Arab Emirates, 12–14 February 2013; pp. 1–6. [Google Scholar] [CrossRef]
- Kumari, A.; Chhabra, C.; Singh, S. Future Location Prediction of a Mobile User Using Historic Visiting Patterns. In Proceedings of the 2020 10th International Conference on Cloud Computing, Data Science & Engineering (Confluence), Noida, India, 29–31 January 2020; pp. 676–679. [Google Scholar] [CrossRef]
- Shen, Y. Location Prediction for Tracking Moving Objects. In Proceedings of the 2009 WRI Global Congress on Intelligent Systems, Xiamen, China, 19–21 May 2009; pp. 362–366. [Google Scholar] [CrossRef]


Publisher’s Note: MDPI stays neutral with regard to jurisdictional claims in published maps and institutional affiliations. |
© 2022 by the authors. Licensee MDPI, Basel, Switzerland. This article is an open access article distributed under the terms and conditions of the Creative Commons Attribution (CC BY) license (https://creativecommons.org/licenses/by/4.0/).