Abstract
In existing proton exchange membrane fuel cell (PEMFC) applications, improper membrane water management will cause PEMFC performance decay, which restricts the reliability and durability of PEMFC systems. Therefore, diagnosing improper water content in the PEMFC membrane is the key to taking appropriate mitigations to guarantee its operating safety. This paper proposes a novel approach for diagnosing improper PEMFC water content using a two-dimensional convolutional neural network (2D-CNN). In the analysis, the collected PEMFC voltage signal is transformed into 2D image data, which is then used to train the 2D-CNN. Data enhancement and pre-processing techniques are applied to PEMFC voltage data before the training. Results demonstrate that with the trained model, the diagnostic accuracy for PEMFC membrane improper water content can reach 97.5%. Moreover, by comparing it with a one-dimensional convolutional neural network (1D-CNN), the noise robustness of the proposed method can be better highlighted. Furthermore, t-distributed Stochastic Neighbor Embedding (t-SNE) is used to visualize the feature separability with different methods. With the findings, the effectiveness of using 2D-CNN for diagnosing PEMFC membrane improper water content is explored.
1. Introduction
As a typical clean energy source, hydrogen energy has been widely considered as one possible alternative for traditional fossil fuel, while for utilizing hydrogen energy more efficiently, fuel cell technology is required. Due to characteristics such as suitable operating temperature and low noise [1,2], the proton exchange membrane fuel cell (PEMFC) has been utilized in several applications, including energy storage stations, automotive, etc. [3,4].
However, during PEMFC operation, various abnormal states can be experienced due to improper operation, including improper membrane water content such as flooding and dehydration [5,6,7], which can greatly affect PEMFC reliability and reduce its useful lifetime [8,9]. Therefore, detection and isolation of the PEMFC’s abnormal state during its early stage is key to guaranteeing PEMFC reliability and durability [10,11].
From the literature, research regarding PEMFC fault diagnosis can be divided into different categories, including model-based approaches [12], expert knowledge-based methods [13], and data-driven-based techniques [14]. In model-based methods, the fault can be detected with the residual between experimental and model results, thus constructing an accurate PEMFC model is the key to fault diagnosis [15,16], but this is usually difficult as the PEMFC is a nonlinear complex system. For expert knowledge-based methods, fault diagnosis results depend on professional knowledge and experience, which may not consistent. Compared to the above methods, data-driven-based techniques receive much more interest in PEMFC fault diagnosis [17], as the fault can be identified by analyzing PEMFC test data using signal processing techniques, while neither a PEMFC model nor comprehensive expert knowledge is required.
In the past few decades, a set of data-driven-based approaches has been proposed to diagnose various PEMFC faults, where different signal processing techniques are utilized to extract features representing the PEMFC’s state of health. In these studies, various signal processing techniques are used, including wavelet transform (WT) [18], fast Fourier transform (FFT) [19], empirical mode decomposition (EMD) [20], principal components analysis (PCA) [21], Fisher discriminant analysis (FDA) [22], support vector machine (SVM) [23], etc. With the above techniques, distinguishable features can be extracted and classified for fault diagnosis. However, several drawbacks can be concluded regarding the existing diagnostic methods. Firstly, various features can be extracted using different techniques, while the selection of features still depends on prior knowledge or trial-and-error analysis [24]. Moreover, when dealing with massive data from PEMFC operations, existing data-driven techniques cannot fulfill real-time analysis requirements [25,26].
With the advancement of computing technology in recent years, deep learning has been widely used in the field of fault diagnosis by virtue of powerful feature learning and efficient massive data processing capabilities [27,28,29,30]. Unfortunately, there exists little research that explores the application of deep learning methods in PEMFC fault diagnosis. In [31], the deep belief network (DBN) was applied to identify four PEMFC states of health. In [32,33], the application of the Long Short-Term Memory (LSTM) network was developed to diagnose the PEMFC water management faults. It should be noted that the studies utilize the collected PEMFC voltage signals for the analysis, which is one-dimensional (1D) data. However, in previous research [34], it has been proved that by converting 1D PEMFC voltage data to 2D image data, more distinguishable features could be obtained, which would lead to better diagnosis performance. However, features extracted from the 2D data were selected with prior knowledge and expert experience. With the bulk of data experienced in PEMFC applications, this method is computational in efficiency and cannot reach a real-time diagnosis. Therefore, it is necessary to explore the possibility of combining converted 2D image data and deep learning methods for PEMFC fault diagnosis, which paves the way for realizing accurate and real-time analysis in PEMFC applications.
This paper proposes a novel PEMFC fault diagnosis method based on the two-dimensional convolutional neural network (2D-CNN), with inputs of 2D image data converted from raw PEMFC voltage measurements. The effectiveness of the proposed method in diagnosing various membrane water content scenarios, including flooding, dehydration, and normal state, is investigated. With the data augmented by adding Gaussian noise of different degrees, the noise robustness of the proposed method is investigated. Moreover, the widely used t-distributed Stochastic Neighbor Embedding (t-SNE) technique [35,36] is selected in this study to visualize the extracted feature separability. Furthermore, a one-dimensional convolutional neural network (1D-CNN) [37,38] is also utilized in PEMFC fault diagnosis for comparison purposes. The main contribution lies in that the technique of using 2D image data with a deep learning method for PEMFC fault diagnosis is proposed and validated, which can facilitate the realization of PEMFC real-time fault diagnosis.
This paper is organized as follows. In Section 2, various approaches used in the study are presented, including PEMFC data pre-processing approaches, a 2D data generation technique, deep learning methods, and the t-SNE technique. Section 3 describes the tested PEMFC bench and corresponding test data at different states of health. In Section 4, the effectiveness of using the proposed method based on the 2D-CNN in identifying PEMFC membrane water content is investigated. From the results, the conclusions are summarized in Section 5.
2. Methods
In this section, the methodologies used in this analysis, including data pre-processing, 2D data generation, CNN model, and feature visualization, will be presented. The process of the proposed 2D-CNN-based PEMFC fault diagnosis method and its comparison with a CNN-based method using 1D data are depicted in Figure 1.
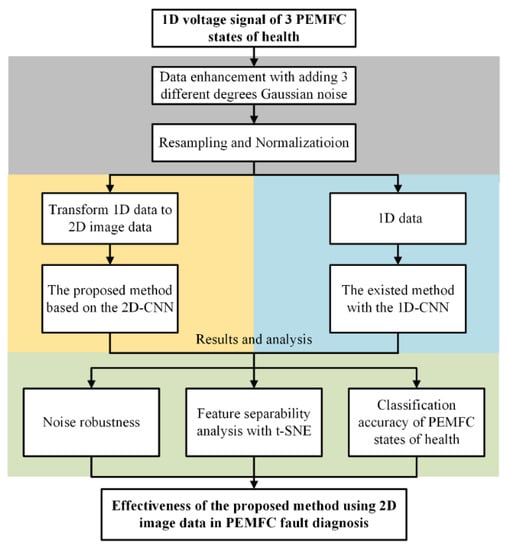
Figure 1.
Flowchart of using the proposed method based on the two-dimensional convolutional neural network (2D-CNN).
2.1. Data Pre-Processing
As a PEMFC failure test is expensive and time-consuming, usually only limited fault test data can be obtained, which greatly hinders the application of deep learning methodologies in PEMFC fault diagnosis. In such a scenario, data enhancement techniques can be used to provide a sufficient dataset [39]. With proper data enhancement methods, diverse data can be generated and overfitting can be alleviated [40].
Data enhancement is usually associated with the application of deep learning methods. Among various data enhancement strategies, the addition of Gaussian noise is the most commonly used method [41,42]. During the operation of electrical systems, the noise and mutual influence between circuit components are the main cause of Gaussian noise. Consequently, in the studies regarding electrical systems, Gaussian noise can be added to simulate the collected raw data. In this study, the addition of Gaussian noise is used for enhancing the PEMFC fault data.
The probability density function of Gaussian noise obeys the Gaussian distribution, which is given below.
where z is the Gaussian noise, µ is the mean of z, σ is the standard deviation of z. Gaussian noise can be generated by the determination of µ and σ, denoted as N (µ, σ2).
Furthermore, as the most commonly used data pre-processing techniques, resampling and normalization are selected herein to improve the data quality and format consistency for the following analysis.
For a specific deep learning model, the size of input data must be the same. Therefore, a resampling operation is required to provide the same length of PEMFC fault data. In this study, the resampling operation is achieved by the linear interpolation technique [43].
Giving a dataset including (x0, y0), (x1, y1), (x2, y2), …, (xn, yn), where xm is between xn−1 and xn, with linear interpolation, and ym can be calculated with Equation (2).
From previous studies [35,36,37,38], normalization is usually applied before data training. In the PEMFC running, there typically exist singular values and impulse noise in the test data, especially for the PEMFC faulty states, which create a negative impact on the feature extraction and training of the DL model. On the one hand, the singular sample can result in an increase in training time or even failure of the model to converge. On the other hand, the impulse noise or singular value will cause some singular features, which cannot represent the sample. In addition, these singular features can have an effect on the distribution of feature space, which will decrease the diagnosis accuracy of the model. By using Z-score normalization, the original PEMFC data obey normal distribution, which not only accelerates the model convergence speed but also improves the model accuracy. Moreover, the Z-score normalization has been used in [44] as data preprocessing for fuel cell fault diagnosis, which further illustrates its reasonability to preprocess PEMFC data. In this study, the Z-score normalization method is selected, which obeys normal distribution [45]. This can be written with Equation (3).
where x is the resampled data, µ is the mean of x, and σ is the standard deviation of x.
2.2. 2D Data Generation Technique
In order to meet the requirements of 2D input data used by 2D-CNN, a widely used 2D data generation technique is applied to transform the 1D voltage data to the corresponding 2D image data, which is presented in Figure 2 [46,47,48]. It can be shown that the 1D voltage signal is described in the left Cartesian coordinate system and the right figure is the converted 2D image data. Through the conversion method, the 1D voltage signal is divided into N data segments by sequence, which will fulfill the 2D image in order.
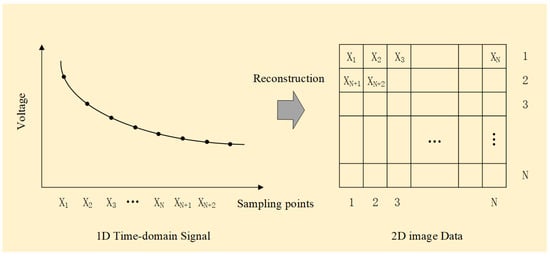
Figure 2.
Illustration of 2D data generation.
According to the previous studies, some other conversion methods have been used to transform the 1D signal into 2D image data [49,50], such as short-time Fourier transform (STFT), wavelet transform (WT), empirical mode decomposition (EMD), Gramian angular field (GAF), and Hilbert-Huang transform (HHT). Unfortunately, these conversion approaches rely greatly on prior information or expert knowledge. In contrast, the conversion technique used in this study can not only remove the requirement of predefined parameters and expert knowledge as much as possible but also retain the details and characteristics of the 1D voltage signal.
2.3. CNN Model Used in the Research
In this section, a 2D-CNN is used to process the 2D data converted from the 1D voltage signal. The structure of the proposed method based on the 2D-CNN is presented in Figure 3a. It can be seen that the conversion technique shown in Figure 2 is used to transform the 1D voltage signal into 2D data. The converted 2D data is then input into the 2D-CNN model. After going through the hidden layers (two convolutional layers, two pooling layers, two fully connected layers, and a softmax layer), the sample represented by the converted 2D data is identified as a specific PEMFC state of health. The details of the 2D-CNN model are shown in Figure 3b, which is determined by a trial-and-error method. In the 2D-CNN model, the Rectified Linear Unit (ReLU) function is used as the activation function and the model overfitting is suppressed by the dropout method.
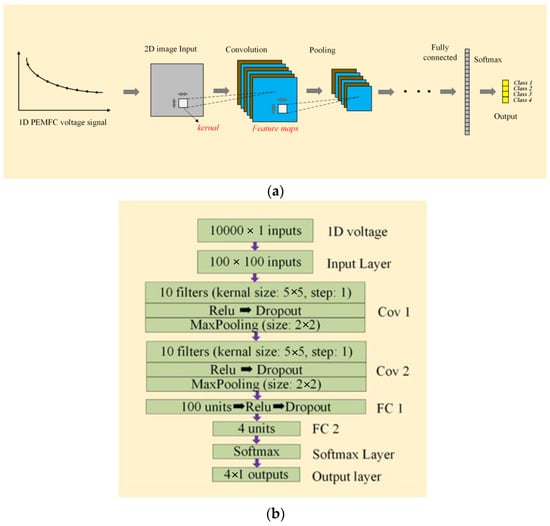
Figure 3.
(a) Structure of the 2D-CNN model. (b) Parameters of the 2D-CNN model.
In order to further verify the high effectiveness of the proposed method based on a 2D-CNN in PEMFC fault diagnosis, a 1D-CNN model used in previous studies for PEMFC fault diagnosis is employed for comparison purposes [51]. The structure and details of the 1D-CNN model are provided in Figure 4.
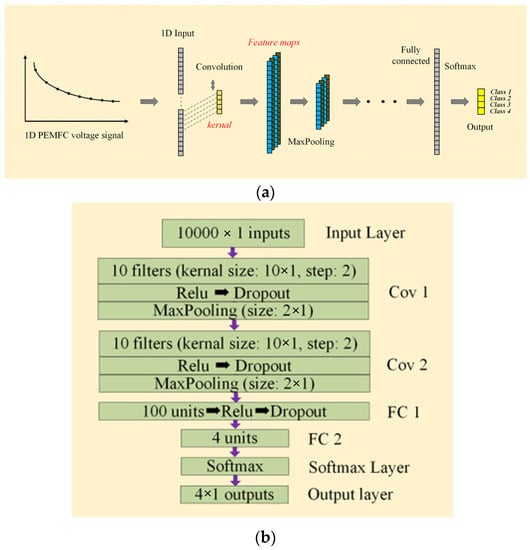
Figure 4.
(a) Structure of the 1D-CNN model (b) Parameters of the 1D-CNN model.
2.4. Feature Separability Analysis
From previous research, t-SNE is the most commonly used technique for data dimension reduction and visualization [35,36]. The details of t-SNE are as follows.
Firstly, SNE is applied to data points, which transforms the high-dimensional Euclidean distances between data points into conditional probabilities that represent similarities. The similarity of data point xj to xi is expressed by the conditional probability Pj|i, as denoted in Equation (4).
After that, the probabilities in the original space are defined as Equation (5).
where n is the size of the data set. “Perplexity” is an input parameter of t-SNE and it can represent the smooth measure of an effective number of neighbors. Perplexity can be denoted as Equation (6).
where H(Pi) is the Shannon entropy, Pi is measured in bits.
Based on the pairwise distances of the points, t-SNE automatically determines the variances σi, such that the effective number of neighbors coincide with the user-provided perplexity.
In order to avoid overcrowding, the Student t-distribution is employed. With this distribution, the probability at low dimension qij can be expressed as Equation (8).
In this study, t-SNE is applied to visualize the features extracted from the convolution layer of the 2D-CNN model using converted 2D data, such that the feature separability can be investigated.
3. Description of PEMFC Tests and Corresponding Test Data
In the analysis, the PEMFC test bench with a rated power of 60 W is used, as depicted in Figure 5. The test bench includes a gas supply system, a humidification system, and the tested single cell. The fuel cell is fabricated using commercial materials and technologies, including the membrane electrode assembly (MEA), silicone-sealing gaskets, bipolar plate, etc. These components have a dramatic influence on the PEMFC performance, especially for the MEA, which serves as the transmission path for gas, proton, and electron. For verifying the robustness of the proposed model on different MEAs, the voltage datasets are collected from two different Nafion MEAs for training and to test the model. Table 1 lists the technical details of the two MEAs used in the PEMFC.
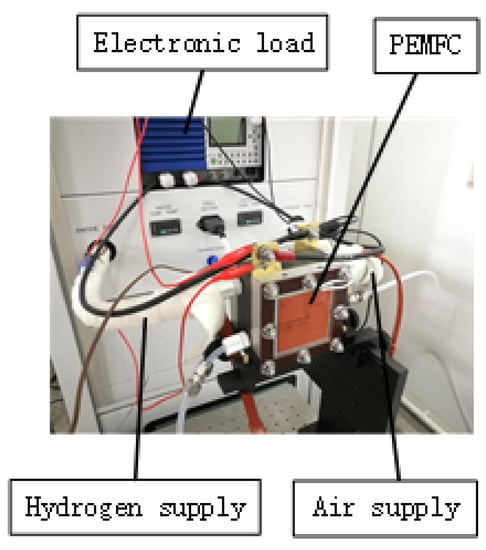
Figure 5.
Proton exchange membrane fuel cell (PEMFC) test setup.

Table 1.
Technical parameters of two membrane electrode assemblies (MEAs) used in the PEMFC.
In the study, three PEMFCs’ states of health are tested, including flooding (membrane contains too much water), membrane dehydration (membrane contains too less water), and normal state (proper water in the membrane).
The details of three PEMFCs’ states of health are described in Table 2, and the corresponding test data are shown in Figure 6. It should be noted that the air stoichiometric rate is the ratio that gives the amount of air required for the complete combustion of the unit amount of hydrogen. The air stoichiometric rate is set as 3.5 at a normal state and the air gas flow is 823 mL/min, which is beneficial for blowing away the water and relieving the PEMFC flooding. For maintaining good proton conductivity, the relative humidity of inlet gases is typically held at a large value to ensure that the membrane remains fully hydrated. At a normal state, the cell temperature is kept at 60 °C, which is the same as that of the humidifiers at the cathode and anode. In that case, the gas relative humidity is 100%. Under such conditions, a constant cell voltage is observed as in Figure 6a. At flooding, the temperatures of humidifiers in the cathode and anode are increased up to 75 °C [17], resulting in a higher gas dew point. When the high-temperature (75 °C) gas in the humidifiers flows into the low-temperature (60 °C) environment within the PEMFC, liquid water will condense and accumulate inside the cell, thus the pores’ gas diffusion and gas flow channel are blocked and the oxygen ingress into the catalyst surface will be hindered, which causes a higher mass transport resistance and reduces the concentration of oxygen ions. Moreover, a long-term operation under excess liquid water may lead both to mechanical degradation of the MEA’s material and local fuel and oxidant starvation. Figure 6b depicts the humidifier temperature increase and the corresponding voltage drop. In the membrane dehydration state, un-humidified gas is used, causing a drop in the gas relative humidity from 100% to 0% [18], therefore, the membrane cannot remain fully hydrated and the electrolyte conductivity of the membrane decreases. Furthermore, a low ionic conductivity hinders the access of protons to the catalyst surface, decreasing the actual number of reactive active sites in the catalyst layer, thus increasing the activation polarization. In addition, severe drying conditions can lead to irreversible membrane degradations. The corresponding cell voltage drop can be observed in Figure 6c.
Table 2.
Test control parameters.
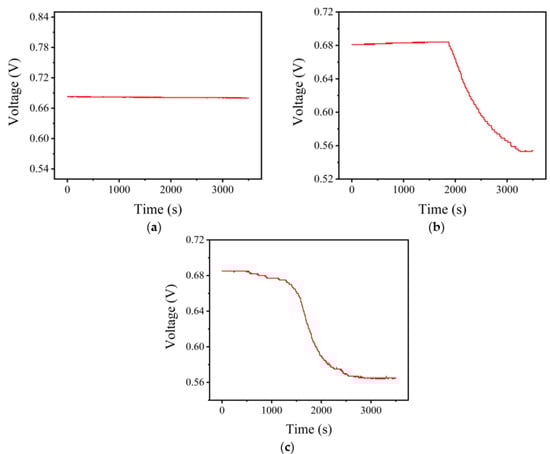
Figure 6.
PEMFC voltage evolution at different PEMFC states. (a) Normal; (b) Flooding; (c) Dehydration.
4. Effectiveness of the Proposed Method in Identifying Improper Membrane Water Content of the PEMFC
As aforementioned, the data enhancement method is used to provide sufficient PEMFC fault data by adding Gaussian noise. As shown in Figure 1, to explore the noise robustness of the proposed method, four different degrees of Gaussian noise are used, including N1 (0, 0.00052), N2 (0, 0.0012), N3 (0, 0.00152), and N4 (0, 0.0022), respectively. The number of raw data set for each PEMFC state of health is 60 and the total number of the raw data set is 240. Table 3 lists augmented PEMFC data. By adding a specific degree of Gaussian noise, the number of the dataset is 9600 after data enhancement, which is divided into 75% for the training set and 25% for the test set. The enhanced data sets with a certain degree of noise are then used to train and test the 2D-CNN and the 1D-CNN respectively. It should be mentioned that the 4-fold cross-validation method is adopted in this study to guarantee the reliability of the results.
Table 3.
Details of data enhancement for different PEMFC states.
With the trained two models, the classification accuracy is depicted in Figure 7. It can be seen that both models converge after 100 iterations of training, but the classification accuracy of the 1D-CNN model is lower than that of the proposed method. Moreover, as the degree of noise increases, the variation in classification accuracy of the proposed method is obviously lower than that of the 1D-CNN. Especially, in the case of N4 having the noise of the largest degree, the classification accuracy of the proposed method is as high as around 95%, which is significantly higher than 85% for the 1D-CNN. It should be noted that the high amplitude Gaussian noises are added to the original voltage signal in the case of N4, which challenges the feature extraction of the model and creates a negative impact on the converging of the model. Especially for the 1D-CNN, it is clear that there exist high fluctuations of classification accuracy in the model training, which illustrates it is more difficult for the 1D-CNN to extract diagnosis information in the case of high amplitude noise for PEMFC fault diagnosis. However, in the case of N4, the classification accuracy of the proposed model remains stable in the model training, which further proves the superior performance of the proposed method on PEMFC fault diagnosis. As listed in Table 4, the classification accuracy on the test sets is displayed, which is consistent with that of the training sets shown in Figure 7. The results demonstrate that the noise robustness of the proposed method based on the 2D-CNN is better than that of the 1D-CNN in the case of diagnosing the PEMFC membrane water content scenario.
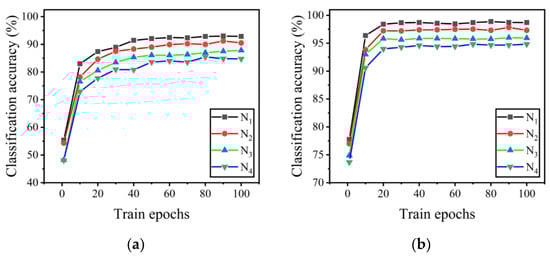
Figure 7.
Classification accuracy of training sets. (a) 1D-CNN; (b) The proposed method.
Table 4.
The Classification Accuracy in Test Sets.
To further verify the effectiveness of PEMFC fault diagnosis using the proposed method, visualization of extracted features is carried out. In the process, a new dataset is generated by adding Gaussian noise, which will be used to train and test the models. As can be seen in Table 5, the dataset contains four different degrees of Gaussian noise. The total number of the dataset is 19,200. The 4-fold cross-validation method is also used in the training and testing of the two deep learning models.
Table 5.
Number of samples for feature visualization.
It is well known that the classification effectiveness of the deep learning model depends on the separability of the features extracted. To perform the feature separability analysis, the features extracted from the 1D and 2D CNN models are obtained. With these features, the t-SNE technique is applied to perform feature dimensionality reduction and visualization. As a comparison, the raw voltage data are also visualized by the t-SNE. The results are shown in Figure 8. It can be seen from Figure 8a that with the raw data, features representing different PEMFC states of health are confused with each other, indicating the difficulty of diagnosing PEMFC faults directly using raw voltage data. From Figure 8b,c, the separability of features extracted by the two deep learning models is significantly better than that of raw voltage data. Furthermore, compared with the 1D-CNN, the proposed method based on the 2D-CNN can extract the features having better separability from the converted 2D data, which is the reason for better diagnostic performance using the proposed method.
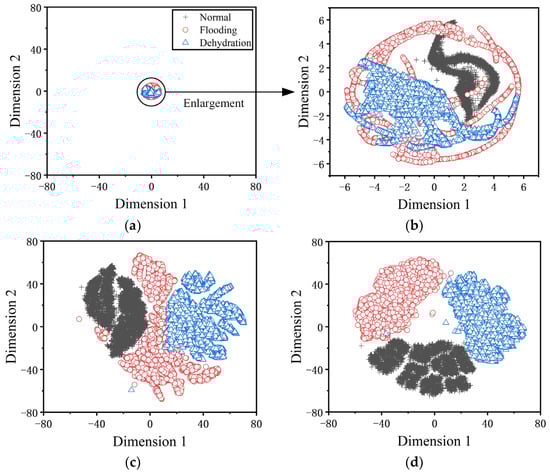
Figure 8.
Feature visualization with the t-distributed Stochastic Neighbor Embedding (t-SNE) technique (red point-flooding, black point-dehydration, green point-normal). (a) Raw data; (b) Enlargement of raw data; (c) 1D-CNN; (d) The proposed method.
The above results are further investigated by studying the classification accuracy and corresponding loss with 1D and 2D CNN models. This is depicted in Figure 9. From the figure, with the proposed method using the 2D-CNN model, the classification accuracy is about 97.5%, while the classification accuracy with the 1D-CNN model is about 90.8%. Moreover, regarding the loss representing the difference between the true value and prediction of the model, the loss of the 2D-CNN is much lower than that of the 1D-CNN, further confirming the superiority of using the proposed method for PEMFC fault diagnosis. In addition, in each training iteration, the average consumed time is 0.8 s for the 2D-CNN and 0.52 s for the 1D-CNN. Although the consumed time of the 2D-CNN is slightly more than the that of the 1D-CNN, the differences can be negligible for real-time fault diagnosis. Therefore, the proposed method not just realizes high-accuracy PEMFC fault diagnosis, but has the characteristic of high computational efficiency, which can make it promising to realize the PEMFC real-time fault diagnosis.
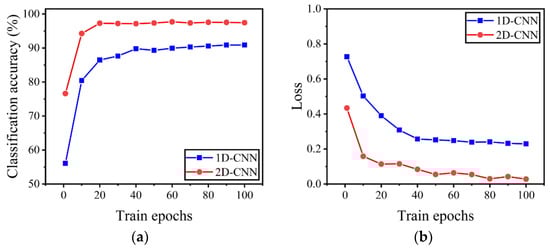
Figure 9.
The iterative process of training sets. (a) Classification accuracy; (b) Loss.
Furthermore, the effectiveness of diagnosing different PEMFC fault states using the proposed method is also investigated. Figure 10 displays the comparison results in test sets of identifying various PEMFC membrane water content scenarios with the proposed method and the 1D-CNN model. Results show that the proposed method can greatly improve the classification accuracy compared with the 1D-CNN, especially in diagnosing membrane improper water content (flooding and dehydration herein).
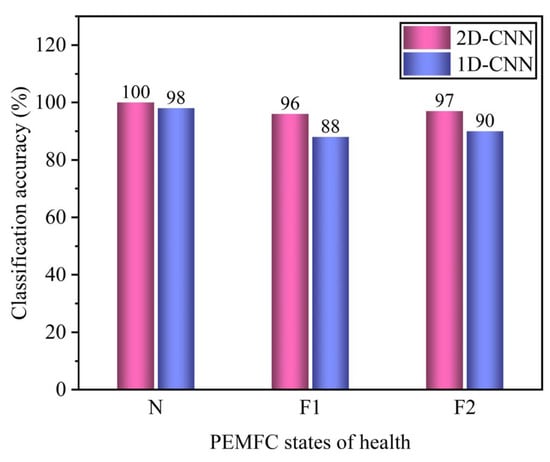
Figure 10.
Classification accuracy in test sets for different PEMFC’s states of health (where N, F1, and F2 represent proper, too much, and too less water content in the PEMFC membrane).
In conclusion, the proposed PEMFC diagnosis method using the 2D-CNN can extract more distinguishable features, with which better PEMFC fault diagnosis performance can be achieved, including accurate diagnosis under different levels of noisy data, and diagnosing various PEMFC membrane water content scenarios.
5. Conclusions
In this study, a novel method based on the 2D-CNN for PEMFC fault diagnosis is proposed, and its performance in identifying different PEMFC states of health, including normal state, flooding, and membrane dehydration, is investigated. In the process, data enhancement and pre-processing techniques are utilized for providing sufficient and unified PEMFC data. Moreover, for accommodating the 2D-CNN model, the 2D data generation method is proposed to transfer the 1D voltage data into 2D data. Moreover, the extracted features and diagnosis results of the proposed method are compared with those using the 1D-CNN model, from which the superiority of the proposed method can be better highlighted.
Results demonstrate that the fault diagnosis accuracy of the proposed method is as high as 97.5%, which is better than 90.8% for the 1D-CNN. Furthermore, with different levels of noisy data, the proposed method can provide better and more consistent diagnosis performance. Moreover, with the proposed method, the improper membrane water content can be identified with good accuracy, which paves the way for taking appropriate mitigations to recover the PEMFC’s performance.
Author Contributions
Conceptualization, H.Z., Z.L. and L.M.; methodology, H.Z.; software, H.Z.; validation, H.Z., Z.L. and W.L.; formal analysis, H.Z.; investigation, H.Z.; resources, L.M.; data curation, H.Z. and Z.L.; writing—original draft preparation, H.Z.; writing—review and editing, W.L. and L.M.; visualization, H.Z.; supervision, L.M.; project administration, L.M.; funding acquisition, L.M. All authors have read and agreed to the published version of the manuscript.
Funding
This research is supported by the National Natural Science Foundation of China (NSFC) (Grant no. 51975549), Key R&D plan of Anhui Province (Grant no. 202104h04020006), Anhui Provincial Natural Science Foundation (Grant no. 1908085ME161), Hefei Municipal Natural Science Foundation (Grant no. 2021022), and CAS Pioneer Hundred Talents Program.
Institutional Review Board Statement
Not applicable.
Informed Consent Statement
Not applicable.
Data Availability Statement
The data can be available upon reasonable request.
Conflicts of Interest
The authors declare no conflict of interest.
References
- Lipman, T.E.; Edwards, J.L.; Kammen, D.M. Fuel cell system economics: Comparing the costs of generating power with stationary and motor vehicle PEM fuel cell systems. Energy 2004, 32, 101–125. [Google Scholar] [CrossRef]
- Lv, X.Q.; Wang, Y.D.; Qin, C.; Liu, G. A comprehensive review on hybrid power system for PEMFC-HEV: Issues and strategies. Energy Convers. Manag. 2018, 171, 1273–1291. [Google Scholar]
- Reddy, K.J.; Sudhakar, N. ANFIS-MPPT control algorithm for a PEMFC system used in electric vehicle applications. Int. J. Hydrog. Energy 2019, 44, 15355–15369. [Google Scholar] [CrossRef]
- Beneito, R.; Vilaplana, J.; Gisbert, S. Electric toy vehicle powered by a PEMFC stack. Int. J. Hydrog. Energy 2007, 33, 1554–1558. [Google Scholar] [CrossRef]
- Rahimi-Esbo, M.; Ranjbar, A.A.; Rahgoshay, S.M. Analysis of water management in PEM fuel cell stack at dead-end mode using direct visualization. Renew. Energy 2020, 162, 212–221. [Google Scholar] [CrossRef]
- Zhou, F.; Andreasen, S.J.; Kar, S.K.; Yu, D.H. Analysis of accelerated degradation of a HT-PEM fuel cell caused by cell reversal in fuel starvation condition. Int. J. Hydrog. Energy 2015, 40, 2833–2839. [Google Scholar] [CrossRef]
- Park, S.; Shao, Y.Y.; Viswanathan, V.V.; Liu, J.; Wang, Y. Non-kinetic losses caused by electrochemical carbon corrosion in PEM fuel cells. Int. J. Hydrog. Energy 2012, 37, 8451–8458. [Google Scholar] [CrossRef]
- Wu, J.F.; Yuan, X.Z.; Martin, J.J.; Wang, H.J.; Zhang, J.J.; Shen, J.; Wu, S.H.; Merida, W. A review of PEM fuel cell durability: Degradation mechanisms and mitigation strategies. J. Power Sources 2008, 184, 104–119. [Google Scholar] [CrossRef]
- Vasilyev, A.; Andrews, J.; Dunnett, S.; Jackson, L. Dynamic reliability assessment of PEM fuel cell systems. Reliab. Eng. Syst. Saf. 2021, 210, 107539. [Google Scholar] [CrossRef]
- Bahrebar, S.; Zhou, D.; Rastayesh, S.; Wang, H.; Blaabjerg, F. Reliability assessment of power conditioner considering maintenance in a PEM fuel cell system. Microelectron. Reliab. 2018, 88, 1177–1182. [Google Scholar] [CrossRef]
- Alegre, C.; Manuel, L.A.; Mustata, R.; Valino, L.; Lozano, A.; Barreras, F. Assessment of the durability of low-cost Al bipolar plates for high temperature PEM fuel cells. Int. J. Hydrog. Energy 2019, 44, 12748–12759. [Google Scholar] [CrossRef]
- Petrone, R.; Zheng, Z.; Hissel, D.; Pera, M.C.; Pianese, C.; Sorrentino, M.; Becherif, M.; Steiner, N.Y. A review on model-based diagnosis methodologies for PEMFCs. Int. J. Hydrog. Energy 2013, 38, 7077–7091. [Google Scholar] [CrossRef]
- Benmouna, A.; Becherif, M.; Depernet, D.; Gustin, F.; Ramadan, H.; Fukuhara, S. Fault diagnosis methods for proton exchange membrane fuel cell systems. Int. J. Hydrog. Energy 2017, 42, 1534–1543. [Google Scholar] [CrossRef]
- Zheng, Z.; Petrone, R.; Pera, M.C.; Hissel, D.; Becherif, M.; Pianese, C.; Steiner, N.Y.; Sorrentino, M. A review on non-model based diagnosis methodologies for PEM fuel cell stacks and systems. Int. J. Hydrog. Energy 2013, 38, 8914–8926. [Google Scholar] [CrossRef]
- Mann, R.F.; Amphlett, J.C.; Hooper, M.A.I.; Jensen, H.M.; Peppley, B.A.; Roberge, P.R. Development and application of a generalised steady-state electrochemical model for a PEM fuel cell. J. Power Sources 2000, 86, 173–180. [Google Scholar] [CrossRef]
- Jemeї, S.; Hissel, D.; Péra, M.C.; Kauffmann, J.M. On-board fuel cell power supply modeling on the basis of neural network methodology. J. Power Sources 2003, 124, 479–486. [Google Scholar]
- Ma, T.; Zhang, Z.L.; Lin, W.K.; Yang, Y.B.; Yao, N.Y. A review on water fault diagnosis of a proton exchange membrane fuel cell system. J. Electrochem. Energy Convers. Storage 2021, 18, 030801. [Google Scholar] [CrossRef]
- Mao, L.; Jackson, L.; Davies, B. Effectiveness of a novel sensor selection algorithm in PEM fuel cell on-line diagnosis. IEEE Trans. Ind. Electron. 2018, 65, 7301–7310. [Google Scholar] [CrossRef]
- Chlipala, M.; Blaszczak, P.; Wang, S.F.; Jasinski, P.; Bochentyn, B. In situ study of a composition of outlet gases from biogas fuelled solid oxide fuel cell performed by the Fourier transform infrared spectroscopy. Int. J. Hydrog. Energy 2019, 44, 13864–13874. [Google Scholar] [CrossRef]
- Damour, C.; Benne, M.; Grondin-Perez, B.G.; Bessafi, M.; Hissel, D.; Chabriat, J.P. Polymer electrolyte membrane fuel cell fault diagnosis based on empirical mode decomposition. J. Power Sources 2015, 299, 596–603. [Google Scholar] [CrossRef]
- Placca, L.; Kouta, R.; Candusso, D.; Blachot, J.F.; Charon, W. Analysis of PEM fuel cell experimental data using principal component analysis and multi linear regression. Int. J. Hydrog. Energy 2010, 35, 4582–4591. [Google Scholar] [CrossRef]
- Du, Z.; Jin, X.Q. Multiple faults diagnosis for sensors in air handling unit using Fisher discriminant analysis. Energy Convers. Manag. 2008, 49, 3654–3665. [Google Scholar] [CrossRef]
- Li, Z.; Giurgea, S.; Outbib, R.; Hissel, D. Online diagnosis of PEMFC by combining support vector machine and fluidic model. Fuel Cells 2014, 3, 448–456. [Google Scholar] [CrossRef]
- Zhang, X.J.; Zhang, T.; Chen, H.C.; Cao, Y.L. A review of online electrochemical diagnostic methods of on-board proton exchange membrane fuel cells. Appl. Energy 2021, 286, 116484. [Google Scholar] [CrossRef]
- Mao, L.; Jackson, L.; Huang, W.G.; Li, Z.N.; Davies, B. Polymer electrolyte membrane fuel cell fault diagnosis and sensor abnormality identification using sensor selection method. J. Power Sources 2020, 447, 227394. [Google Scholar] [CrossRef]
- Davies, B.; Jackson, L.; Dunnett, S. Expert diagnosis of polymer electrolyte fuel cells. Int. J. Hydrog. Energy 2017, 42, 11724–11734. [Google Scholar] [CrossRef][Green Version]
- Shao, S.Y.; Yan, R.Q.; Lu, Y.D.; Wang, P.; Gao, R.X. DCNN-based multi-signal induction motor fault diagnosis. IEEE Trans. Instrum. Meas. 2019, 69, 2658–2669. [Google Scholar] [CrossRef]
- Zhu, J.; Chen, N.; Shen, C.Q. A new deep transfer learning method for bearing fault diagnosis under different working conditions. IEEE Sens. J. 2020, 20, 8394–8402. [Google Scholar] [CrossRef]
- Chen, Z.H.; Wu, M.; Zhao, R.; Guretno, F.; Yan, R.Q.; Li, X.L. Machine remaining useful life prediction via an attention-based deep learning approach. IEEE Trans. Ind. Electron. 2021, 68, 2521–2531. [Google Scholar] [CrossRef]
- Dai, L.; Liu, T.Y.; Liu, Z.Y.; Jackson, L.; Goodall, P.; Shen, C.Q.; Mao, L. An improved deep learning model for online tool condition monitoring using output power signals. Shock. Vib. 2020, 2020, 8843314. [Google Scholar] [CrossRef]
- Zhang, X.X.; Zhou, J.Z.; Chen, W.R. Data-driven fault diagnosis for PEMFC systems of hybrid tram based on deep learning. Int. J. Hydrog. Energy 2020, 45, 13483–13495. [Google Scholar] [CrossRef]
- Liu, J.W.; Li, Q.; Yang, H.Q.; Han, Y.; Jiang, S.N.; Chen, W.R. Sequence fault diagnosis for PEMFC water management subsystem using deep learning with t-SNE. IEEE Access 2019, 7, 92009–92019. [Google Scholar] [CrossRef]
- Gu, X.; Hou, Z.J.; Cai, J. Data-based flooding fault diagnosis of proton exchange membrane fuel cell systems using LSTM networks. Energy AI 2021, 4, 100056. [Google Scholar] [CrossRef]
- Liu, Z.Y.; Pei, M.L.; He, Q.B.; Wu, Q.; Jackson, L.; Mao, L. A novel method for polymer electrolyte membrane fuel cell fault diagnosis using 2D data. J. Power Sources 2021, 482, 228894. [Google Scholar] [CrossRef]
- Yang, H.H.; Meng, C.; Wang, C. Data-driven feature extraction for analog circuit fault diagnosis using 1-D convolutional neural network. IEEE Access 2020, 8, 18305–18315. [Google Scholar] [CrossRef]
- Devassy, B.M.; George, S. Dimensionality reduction and visualisation of hyperspectral ink data using t-SNE. Forensic Sci. Int. 2020, 311, 110194. [Google Scholar] [CrossRef]
- Chen, S.M.; Yu, J.B.; Wang, S.J. One-dimensional convolutional neural network-based active feature extraction for fault detection and diagnosis of industrial processes and its understanding via visualization. ISA Trans. 2021, 122, 424–443. [Google Scholar] [CrossRef]
- Li, Y.; Zou, L.; Jiang, L.; Zhou, X.Y. Fault diagnosis of rotating machinery based on combination of deep belief network and one-dimensional convolutional neural network. IEEE Access 2019, 7, 165710–165723. [Google Scholar] [CrossRef]
- Long, Y.Y.; Zhou, W.N.; Luo, Y. A fault diagnosis method based on one-dimensional data enhancement and convolutional neural network. Measurement 2021, 180, 109532. [Google Scholar] [CrossRef]
- Schlett, T.; Rathgeb, C.; Busch, C. Deep learning-based single image face depth data enhancement. Comput. Vis. Image Underst. 2021, 210, 103247. [Google Scholar] [CrossRef]
- Bilali, A.E.; Taleb, A.; Bahlaoui, M.A.; Brouziyne, Y. An integrated approach based on Gaussian noises-based data augmentation method and AdaBoost model to predict faecal coliforms in rivers with small dataset. J. Hydrol. 2021, 599, 126510. [Google Scholar] [CrossRef]
- Sapkal, A.; Kulkarni, U.V. Modified backpropagation with added white Gaussian noise in weighted sum for convergence improvement. Procedia Comput. Sci. 2018, 143, 309–316. [Google Scholar] [CrossRef]
- Nie, Y.; Zamzam, A.S.; Brandt, A. Resampling and data augmentation for short-term PV output prediction based on an imbalanced sky images dataset using convolutional neural networks. Sol. Energy 2021, 224, 341–354. [Google Scholar] [CrossRef]
- Zhang, Z.; Li, S.; Xiao, Y.; Yang, Y. Intelligent simultaneous fault diagnosis for solid oxide fuel cell system based on deep learning. Appl. Energy 2019, 233, 930–942. [Google Scholar] [CrossRef]
- Wang, Z.J.; Zhao, W.L.; Du, W.H.; Li, N.P.; Wang, J.Y. Data-driven fault diagnosis method based on the conversion of erosion operation signals into images and convolutional neural network. Process Saf. Environ. Prot. 2021, 149, 591–601. [Google Scholar] [CrossRef]
- Guo, X.J.; Chen, L.; Shen, C.Q. Hierarchical adaptive deep convolution neural network and its application to bearing fault diagnosis. Measurement 2016, 93, 490–502. [Google Scholar] [CrossRef]
- Xin, M.; Li, T.; Xu, L.; Liu, L.Z.; Silva, C. Fault diagnosis for rotating machinery using multiple sensors and convolutional neural networks. IEEE/ASME Trans. Mechatron. 2018, 23, 101–110. [Google Scholar]
- Wang, H.Q.; Li, S.; Song, L.Y.; Cui, L.L. A novel convolutional neural network based fault recognition method via image fusion of multi-vibration-signals. Comput. Ind. 2019, 105, 182–190. [Google Scholar] [CrossRef]
- Kang, M.; Kim, J.M. Reliable fault diagnosis of multiple induction motor defects using a 2-D representation of Shannon wavelets. IEEE Trans. Magn. 2014, 50, 8201913. [Google Scholar] [CrossRef]
- Li, B.; Zhang, P.-L.; Liu, D.-S.; Mi, S.-S.; Ren, G.-Q.; Tian, H. Feature extraction for rolling element bearing fault diagnosis utilizing generalized S transform and two-dimensional non-negative matrix factorization. J. Sound Vib. 2011, 330, 2388–2399. [Google Scholar] [CrossRef]
- Shao, M.; Zhu, X.J.; Cao, H.F.; Shen, H.F. An artificial neural network ensemble method for fault diagnosis of proton exchange membrane fuel cell system. Energy 2014, 67, 268–275. [Google Scholar] [CrossRef]


Publisher’s Note: MDPI stays neutral with regard to jurisdictional claims in published maps and institutional affiliations. |
© 2022 by the authors. Licensee MDPI, Basel, Switzerland. This article is an open access article distributed under the terms and conditions of the Creative Commons Attribution (CC BY) license (https://creativecommons.org/licenses/by/4.0/).