1. Introduction
Nowadays, using low-consumption and/or clean fuel vehicles is becoming more and more important. Air pollution from fossil fuels, a critically serious threat to the environment, can be significantly reduced by using electric vehicles (EVs) (Throughout the paper, by EV we mean battery electric vehicle (BEV)). In this regard, people’s attitudes toward the use of EVs have been positive for such reasons as the existence of a cognitive and emotional relationship between the potential buyer and the vehicle, the growth of public awareness about green environment initiatives, and the promotion of governmental incentive policies [
1,
2]. The development of the EVs market calls for a better understanding of customer behavior and driving styles, as well as improving the quality of EVs [
3]. Since 2008, advances in design, battery technology, power grid management, concerns about oil prices, and the harsh environmental needs of the planet to reduce greenhouse gases have led to a major shift towards the production of EVs [
4]. However, EVs have some obvious limitations compared to those fueled by gasoline, which are likely to affect transportation behavior in several ways. This includes, for instance, lack of long travel range capability and a long battery charge [
5]. Due to customers’ concerns about the battery charge and the high price of EVs, their sales have not yet reached their targets. In its new scenario, EV30 @ 30, the International Energy Agency, predicts that by 2030 the market share for EVs will be 30 percent [
6]. According to IHS Marketing Research Center, EVs will account for 15 to 35 percent of new vehicle sales by 2040 [
7]. However, all of these predictions depend on increasing customer interest in purchasing this type of vehicle.
EVs are nowadays recommended for large cities in Iran, in particular due to a fast liberalization of gasoline prices, thereby sharply increasing urban air pollution caused by the country’s daily use of 86 million gallons of gasoline [
8]; the high cost of domestic production of gasoline together with import constraints; and finally, the old age of gasoline cars and insufficient substitution rates by new energy efficient ones. Article 44 of the Sixth Five-Year Development Plan Law urges the reduction of carbon emission in the transport sector. The replacement of old vehicles is also encouraged in article 46 of the Plan [
9].
Now, the question is what kind of EV with what features to produce and how to stimulate customers’ demand for EVs? These all call for a need for understanding customer’s perceptions (including awareness, impressions, and opinions) about the comparative advantages of EVs. While the only EVs supplied in the Iranian car markets are those imported, the policymakers have developed a number of policy measures aimed at market expansion, including import tariff exemptions for hybrid cars as well as non-financial policy instruments (e.g., construction of EV charging points in large, polluted cities like Tehran and Mashhad).
There is, in fact, a kind of attitude-behavior gap in people’s demand for EVs. There may be numerous causes for such a gap, including the lack of market options, mistrust due to no consumption experience, and high prices for sustainable products [
10]. Therefore, recognizing the way customers accept the product calls for the prediction of their willingness to pay [
11]. Several recent studies attempt to understand EVs’ demand, penetration, and policy implications. Quarles et al. [
12] conducted a public opinion questionnaire of 1426 Americans via an online Qualtrics survey in 2017. The simulation with statistical models predicts that the market share of hybrid-electric and plug-in hybrid vehicles will comprise over 40% of the private fleet by 2050, while battery-electric vehicles will rise to between 5% and 7%, and gasoline vehicle ownership will fall sharply. Of course, they state that the accuracy of their results will be influenced by several changing factors, including population age distribution, technological innovations, manufacturer and fleet operator pricing decisions, and social network effects. Dutta and Hwang [
13] conducted a survey of 262 Taiwanese residents. The authors found that not only measurements of vehicle performance, namely safety, reliability, and range, but other factors, such as purchasing price, charging facility, and maintenance and battery cost, also influenced consumers’ sustainable consumption intentions. Chen et al. [
14] conducted a much larger and more internationally based survey of residents from Denmark, Finland, Iceland, Norway, and Sweden. They found that battery life and driving range were more important to conventional fuel vehicle owners than current and former EV owners. In return, former EV owners considered vehicle-to-grid capability and charging time more important than current EV and conventional car owners.
Alongside these studies, our paper identifies that the factors affecting customers’ preferences for purchasing an EV are based on discrete choice experiments with realistic choice settings. In these settings, respondents choose which new vehicle to buy from two possible electric vehicle models and one non-electric vehicle with a wide variety of attributes, including travel range, price, and energy cost, among others. This allows us to estimate the stated preferences for cars and simulate the real market in an agent-based model (ABM) using data from the discrete choice model (DCM).
Section 2 of the paper reviews the literature on the subject. The research methodology is discussed in
Section 3.
Section 4 presents the estimation results, while the scenario simulation and validation are analyzed in
Section 5.
Section 6 concludes and discusses the paper.
3. Research Methodology
As pointed out in the previous section, we have no choice but to apply a stated preference method in countries where there are no EVs in use. This method is ideal for eliciting monetary values. Contingent valuation (CV) and choice experiments (CE) are popular stated preference techniques. CE divides goods into attributes, where each attribute has different levels. The respondents are then presented with a series of option sets, including various combinations of attribute levels paired with a price attribute. This experimental design indirectly elicits information about respondents’ exchange between payments and changes in the attributes of the commodities [
36].
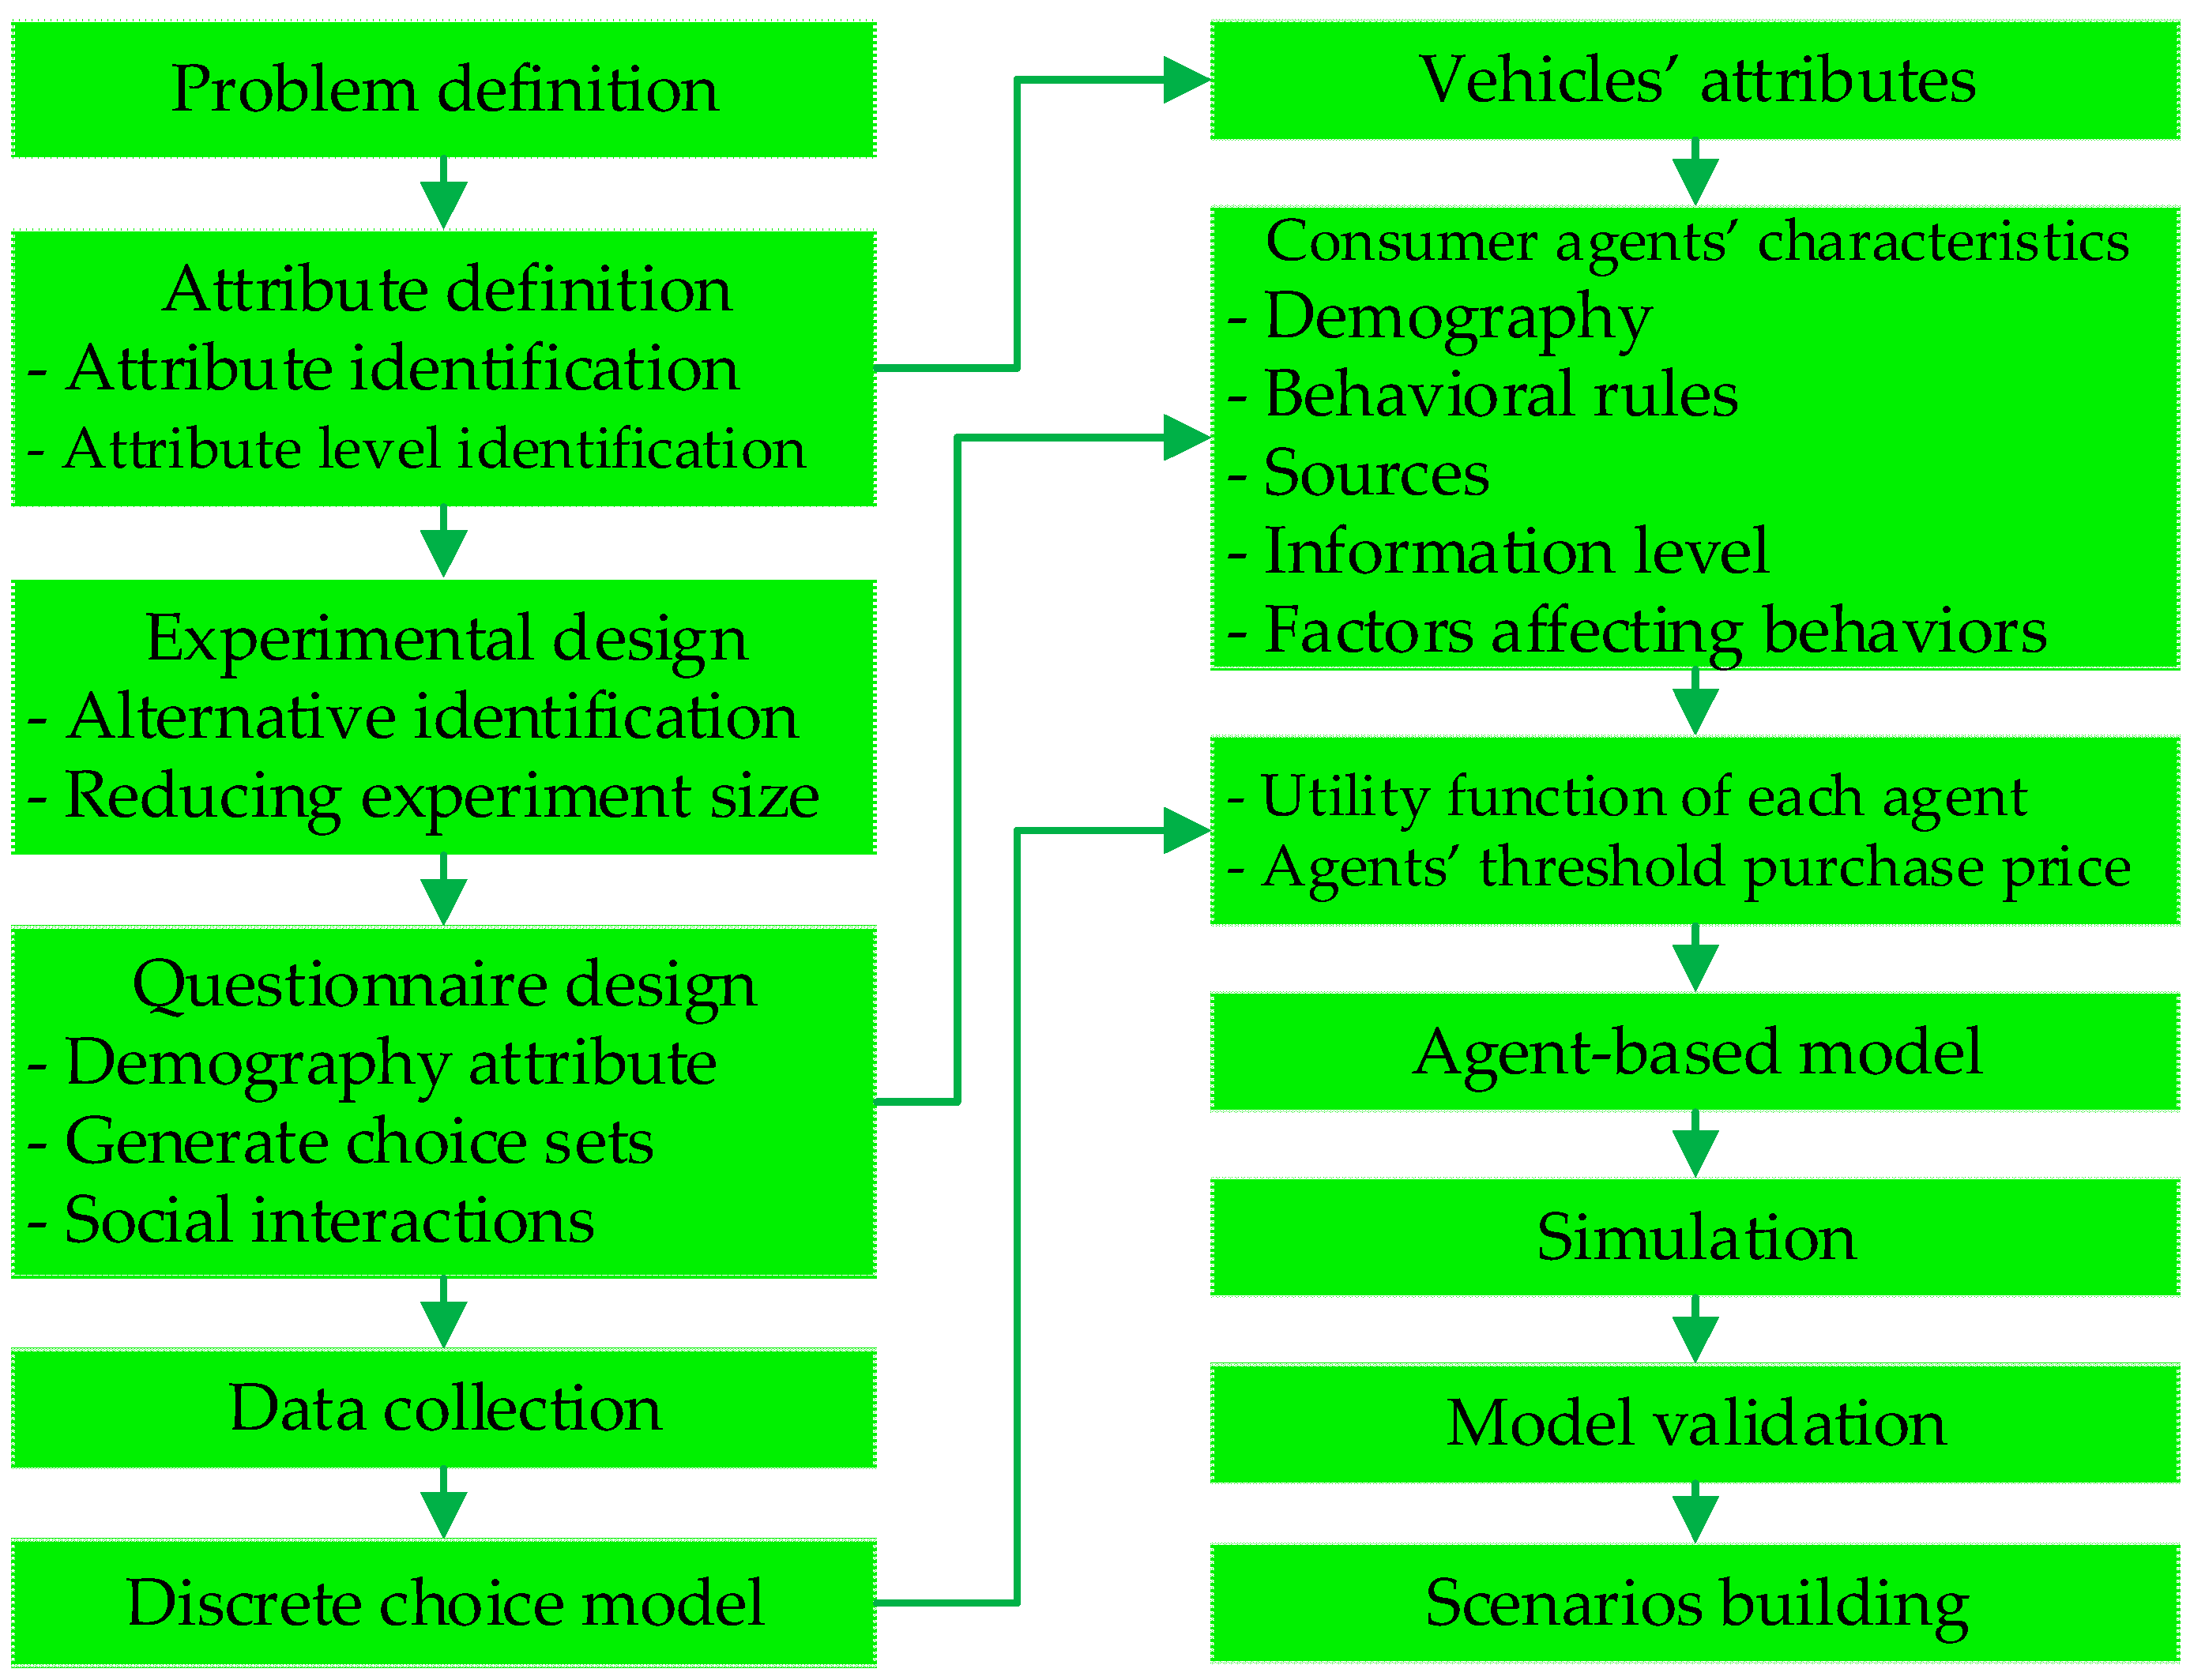
Figure 1 illustrates the methodological procedures of the study.
This approach allows customers/agents to evaluate the relative attractiveness of vehicles according to their attributes and construct a preferential order based on which they choose from different EVs and NEVs.
3.1. Formulation of the Model
The research begins with the identification of the EV attributes that motivate customers’ willingness to pay. The second step is to identify the features or components of the car. These attributes should include all the components of the car. Based on the research background in
Section 2, the six attributes of travel range, charge duration, top speed, charge cost, government incentives, and price are selected from the literature. Then, different levels are assigned to each of the attributes in order to make alternative attribute combinations for respondents to choose from. Alternative levels on all vehicle attributes other than price are chosen based on the features of the EVs currently available in the market (namely Renault Zoe, Renault Megane, Volkswagen ID.3, BMW ix3, and Mercedes EQS AMG) [
37].
Questionnaires are distributed among a target group randomly chosen from potential buyers of NEVs (including 30 taxi drivers, 20 civil servants, 25 engineers, and 20 freelancers) in order to study their preferences and attitudes toward EVs. The reason for such a divergence in the social groups chosen is that they have different life and job styles, resulting in a variety of attitudes towards price, environmental pollution, and the travel range per day.
Members of the sample were examined for their driving habits and the price of the vehicle they are likely to pay in the future. This lets us control the vehicle design (interior and exterior decoration), size, and safety. To identify the vehicle price, both reservation and internal reference prices are used to calculate a single price. To do so, the internal reference price (the most preferred price for purchasing a NEV) is determined first. Then, by considering the higher configuration of the EV, a price that is higher than the internal reference price is set for the EV. This premium must be paid in order to enjoy the EV’s advantages. The highest and lowest price that a buyer or seller is willing to buy or sell for is the reservation price.
The participants announced their willingness to pay for a vehicle in the range of 8 to 18 thousand dollars for respective attributes. As a result, we consider five prices, namely 8000, 10,000, 12,000, 14,000, and 18,000 dollars. The statistics on NEVs (namely Quik R, Peugeot 206, Samand LX, Hyundai Santa Fa, and BMW 5-series sorted by lowest to highest top speed) are collected from the respective car’s homepage. The key attributes of the vehicles and their levels are summarized in
Table 3.
The combination of all attributes and prices and their corresponding levels results in 9375 possible options for an EV and 750 possible options for a NEV. D-optimal design is used to compute and present the optimal combinations of the attribute levels. “D-optimal design is constructed to minimize the overall variance of the predicted regression coefficient by maximizing the value of determinant of the information matrix” [
38]. Applying a D-optimal algorithm in MATLAB software, eight pairs of optimal attributes set for EV option 1, EV option 2, and NEV are finally selected for our customer questionnaires, as is shown in
Table 4.
3.2. Questionnaire Design & Data Collection
The questionnaire consists of three sections. First, respondents are asked about their demographic characteristics, including gender, age, educational level, occupation, marital status, and income range.
The second section of the questionnaire targeted respondent preferences for various vehicles attributes. For instance, one of the eight choice sets offered to the respondents is illustrated in
Table 5.
Questions in the third section of the questionnaire refer to social interactions. A five-point Likert scale (never (1), rarely (2), usually (3), strongly (4), and very strongly (5)) is used. The statements are designed to analyze the social network and relationship between customer agents in the ABM—the details of which are demonstrated in
Table 6.
The study’s statistical population is potential buyers of gasoline, hybrid, plug-in, or electric cars in two large cities, namely Tehran and Mashhad. The sample includes those who have already bought or intended to buy a car in the last six months. Data is collected from 376 customers who were randomly selected from 140 automobile stores in Tehran and 75 in Mashhad. It should be noted that the population census data officially reported by the Statistical Center of Iran is indicative of less than a 0.003% difference between the demographic characteristics of people in the two cities under study [
39].
3.3. Discrete Choice Model
McFadden’s discrete choice is based on Thurstone’s random utility model [
40,
41]. Random utility theory assumes that an individual behaves rationally and chooses the option that has the highest level of utility. As all factors affecting the actual utility of individuals are not observable and the necessary and sufficient information about customer choice is not available, the utility function in the random utility model is a conditional indirect utility function (subject to option choice).
After identifying the attributes of the EV and the random utility model, the conditional indirect utility (generally assumed to have a linear form) can be written as Equation (1) below.
where U is the utility gain by customers; X is the attributes of the EV (k = 1, 2, 3, 4, 5); price is the price of the EV; S refers to the demographic variables; i is vehicle options (choosing a value of 1 and 2 for two EVs with different sets of attributes, and 3 for NEV); q represents the customers (here 376); k represents the EV attribute; and n represents personality traits of individuals. α, β, and γ are the explanatory variable parameters to be estimated.
is a stochastic component distributed independently and uniformly with an infinite value. This distribution, known as the Gumbel distribution, is a special case of the generalized limit value distribution, which is described by a scale parameter
and a location parameter
in practice.
Depending on the assumptions made for the shape of the random component distribution, different possible choice models can be considered for Equation (1). This paper uses the random-parameter logit model to find heterogeneity in people’s behavior. Heterogeneity of data is inevitable in the real world. A random-parameter logit model is then used to account for data heterogeneity [
42]. The stochastic component of the model
in the mixed logit model consists of two parts. In the first part, log-normal, uniform, triangular, gamma, or any other distribution can be used, and the second part, like the standard logit model, consists of a limited amount of distribution with independent and identical distribution, so it has fewer limiting assumptions. Given its capabilities, this model is expected to have more predictive power. By considering the appropriate distributions for the characteristics of the coefficients in the utility function, the behavior of different models with random utility can be approximated [
43]. Based on this, as an integral of the logit model, the random coefficients model is defined on the density function of the
parameters, shown as Equation (2), is the probability of a mixed logit.
where
refers to
;
refers to the distribution parameter (mean and standard deviation) assigned to the coefficients. This way, it is possible to calculate the distribution parameters by considering the appropriate distribution for the coefficients. Normal-distributed random coefficients are used to estimate the coefficients of
to further improve the logarithmic value of the likelihood function and to use the mixed logit model in the agent-based model.
Mixed logit is well suited to simulation methods for estimation [
44]. The probability of a mixed logit in Equation (2) can be approximated using a Monte Carlo integration approach, as in Equation (3).
where
refers to the number of draws;
is an unbiased estimator of
by construction; and
represents random draw
from the normal density
4. Survey
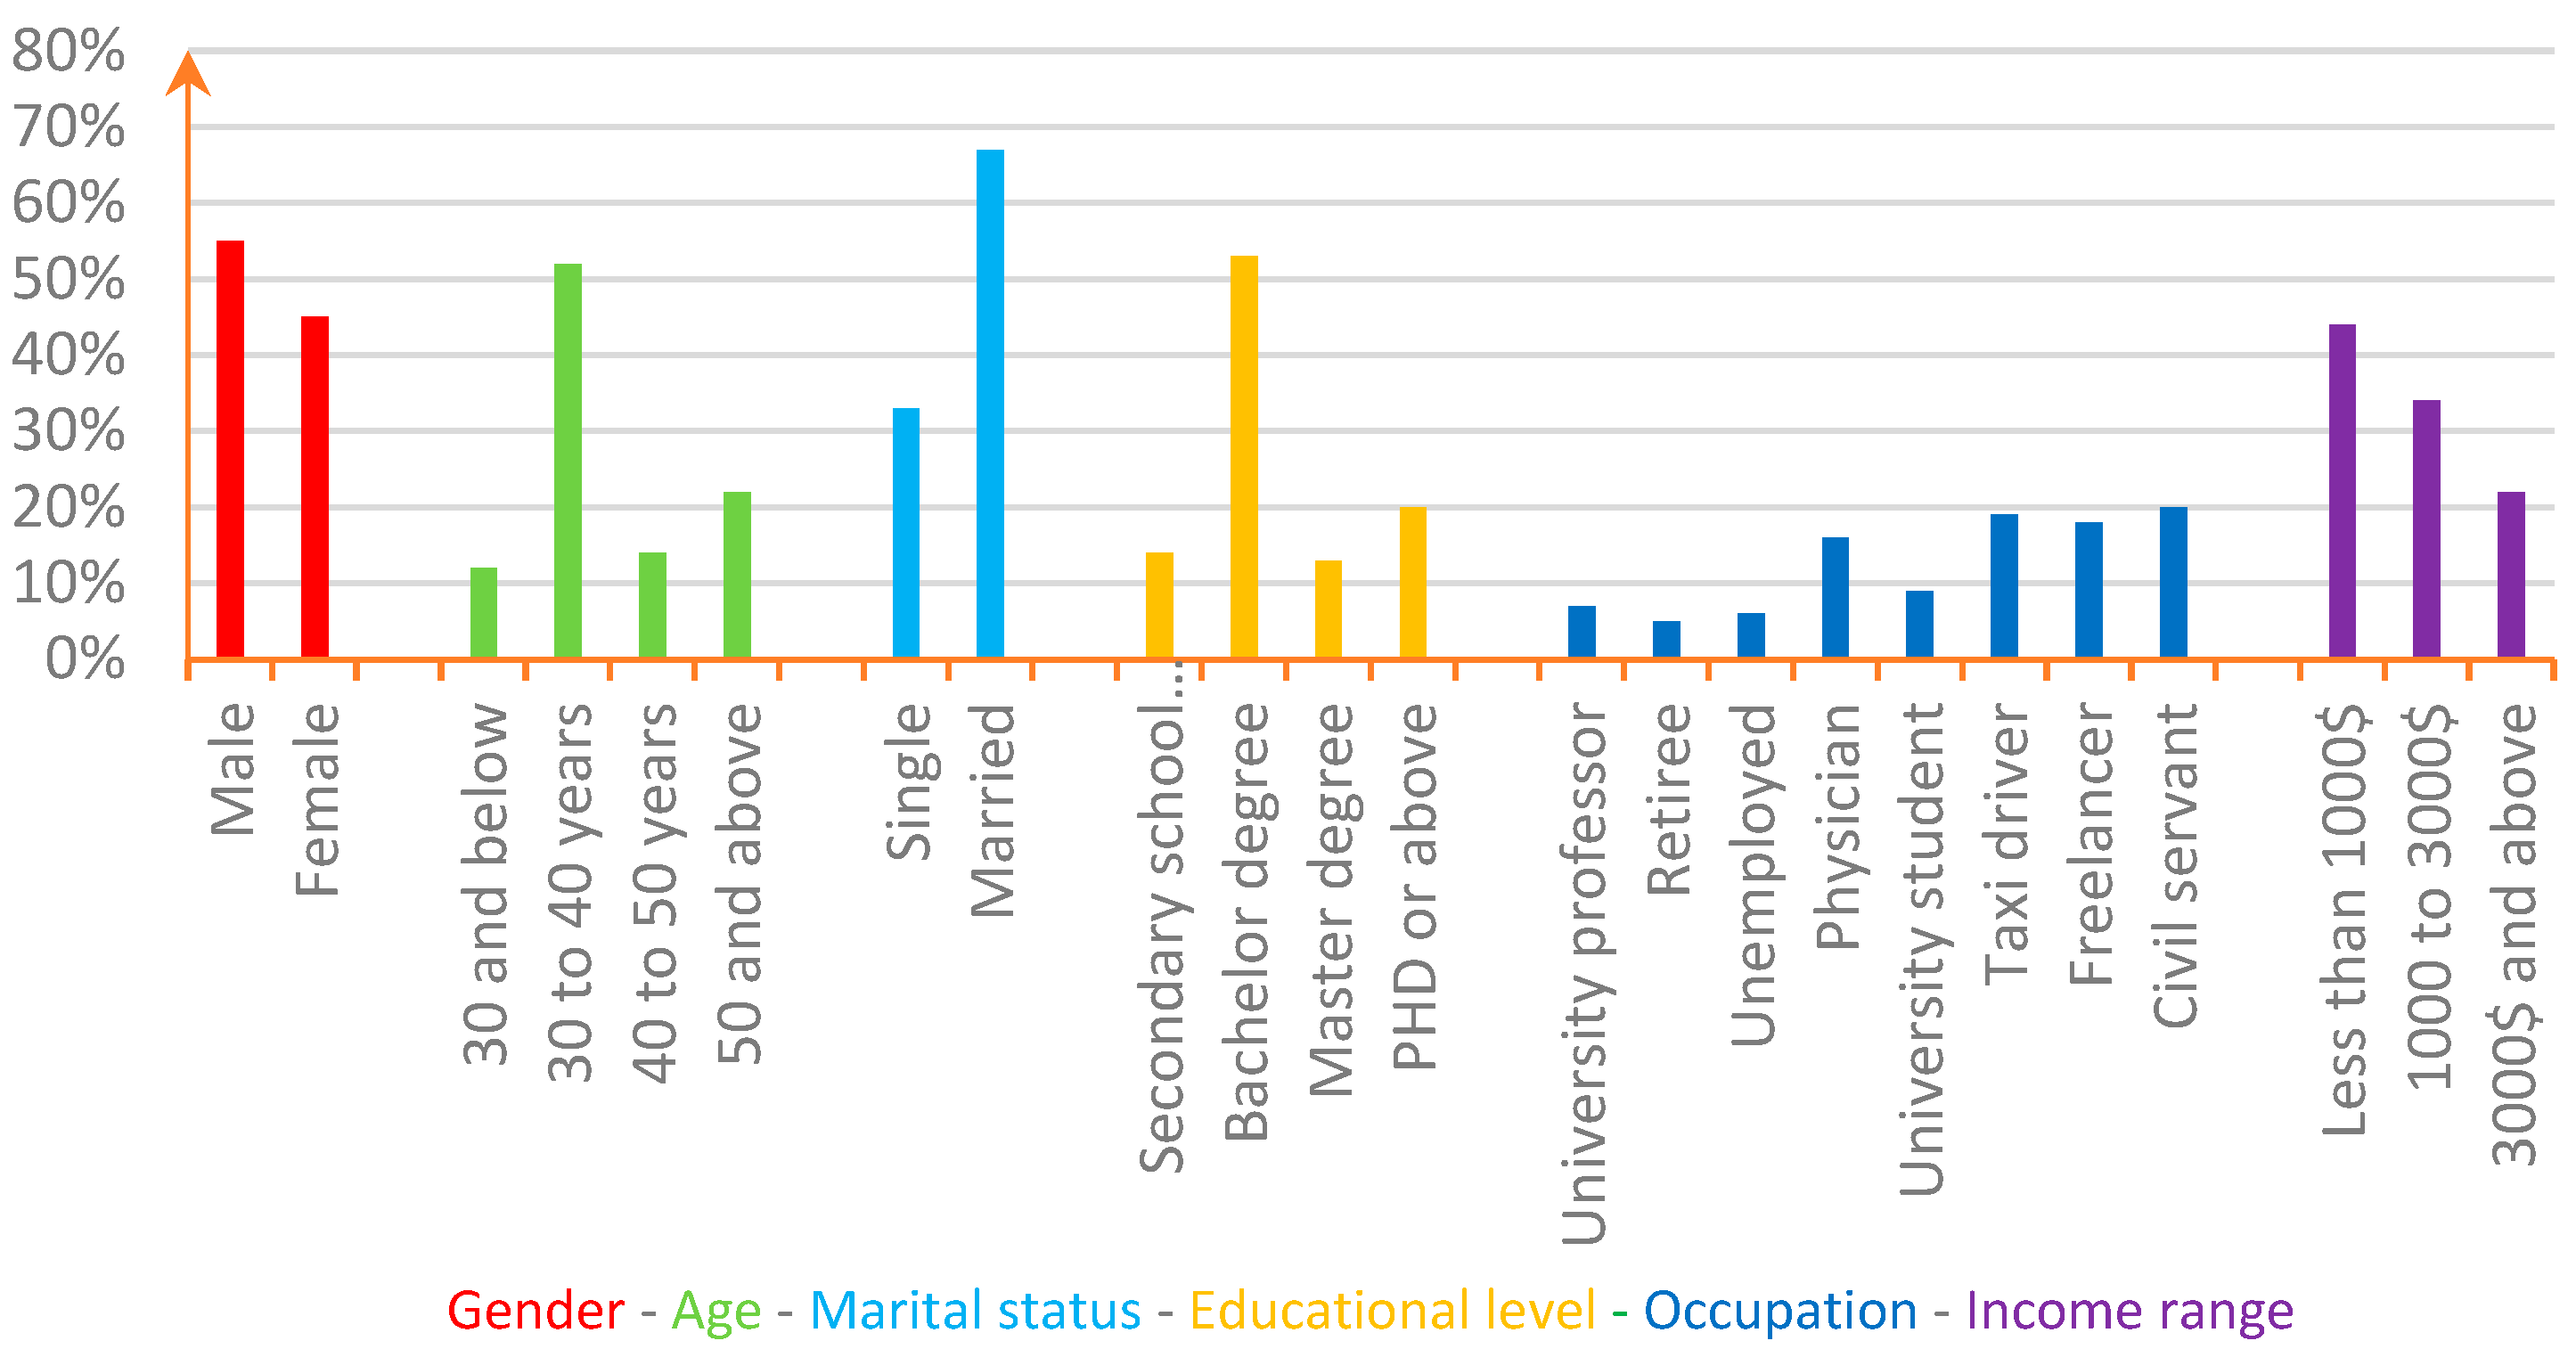
The demographic statistical description of our sample customers and their social communication structure (as classified in
Table 5) are illustrated by
Figure 2 and
Table 7, respectively.
A total weighted average of 4.11 out of 5 is indicative of a high social interaction of respondents.
According to the estimation results of the mixed logit choice model, preferences vary from individual to individual with respect to energy cost and refueling duration; while all individuals of the sample have constant preferences with respect to price, government incentives, travel range, and top speed.
According to the preliminary results, the estimated parameter of refueling duration is statistically insignificant. Therefore, the refueling duration variable is excluded from the model. The final estimation result is demonstrated by
Table 8.
The estimated fixed coefficients (of price, travel range, top speed, and government incentives) are all statistically significant at a probability level of 10% or below, which represents the probability of preferring an EV in response to changes in respective attributes. The estimated mean of the normally-distributed random coefficients on energy cost is −0.0069, with a standard deviation of 0.0566, indicating heterogeneity across sample individuals.
5. Agent-Based Model
5.1. Vehicle Choice Algorithm
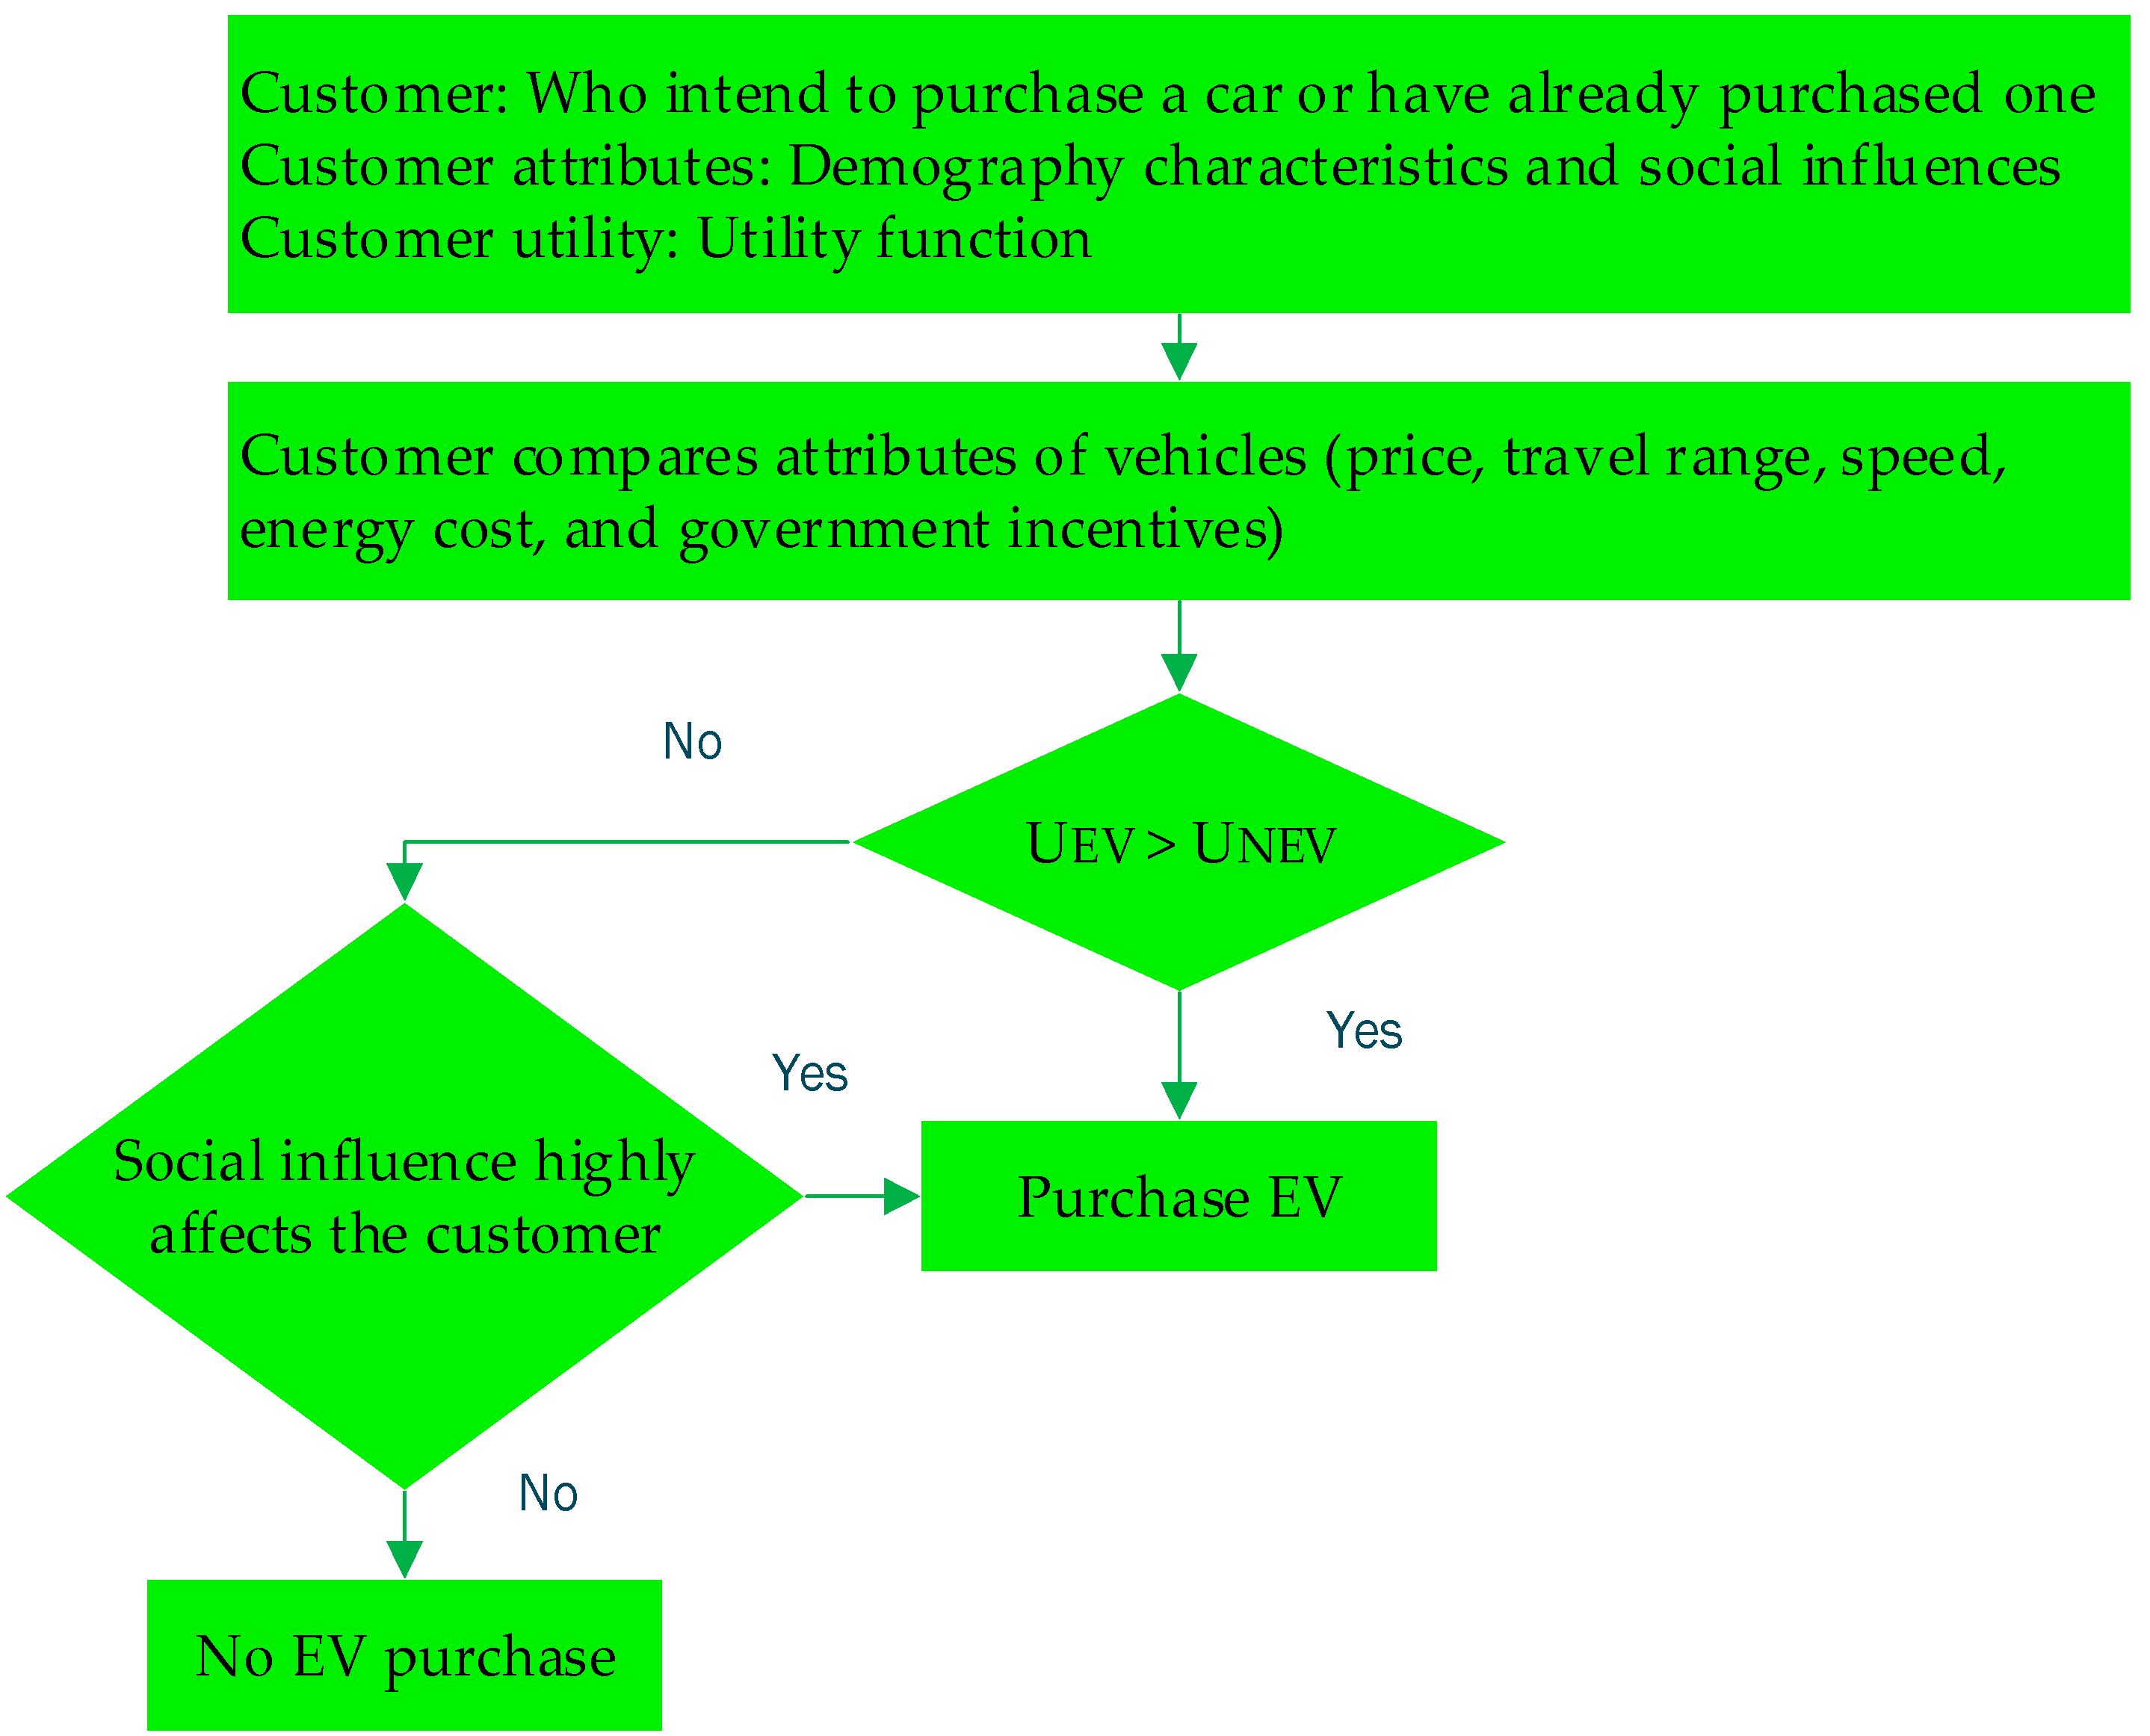
Figure 3 presents an algorithm through which customers make their choice. They make decisions based on demographic characteristics and vehicle attributes. The customer’s decision to purchase EVs may also be affected by social influences (including marketing, advertisement, and the word-of-mouth opinion of current owners of EVs).
The utility of each customer agent for the vehicle is determined by the following algorithm:
If UEV ≥ TR Then U = UEV Else U ≠ UEV
If UNEV ≥ TR Then U = UNEV Else U ≠ UNEV
If UEV ≥ TR & UNEV ≥ TR Then U = Max {UEV, UNEV}
0 ≤ UEV, UNEV ≤ 1 TR = 0.35 (Research result)
Where U is the utility gain, UEV is the utility gain from EV (Equation (1)), UNEV is the utility gain from NEV, and TR refers to the threshold purchase price. The agent compares the value of satisfaction from an EV with its respective threshold purchasing price. If the value of satisfaction exceeds that threshold, the agent chooses EV; otherwise, he/she does not buy an EV. The threshold purchasing price or the internal reference price is the most preferred price for purchasing a NEV.
5.2. Social Network
To study a large-scale social network, one should identify its (community or modular) subnets. A “community” may be defined as a collection of individuals who share a common aim, interest, or likewise connections [
45]. In Iran, in particular, social networks are very strong, such that any news (good or bad) is promptly diffused among all members of the community.
Each customer agent has two types of interaction: (i) interaction with vehicle regarding its price, top speed, travel range, energy cost, and government incentives; and (ii) interaction with other customer agents (social influence of each agent on another). To measure the latter, a social network approach has been applied. A randomly generated social network does not represent the structure of real-world networks, so a preferential attachment process is applied in which each customer agent knows others.
Agents differ in choice alternatives and their interactions with each other. The dynamics of the agents in the social network are described by preferential attachment, where the preferred behavior of the agents is formed by their interaction with other agents and by obtaining more information [
46]. A new connection is established over time between the agents, resulting in a preferential attachment and creating new links in the communication chain. In a social network based on preferential attachment, a few nodes have many links, and new nodes connect with multiple links [
47]. A social network with preferential attachment is one in which new agents (customers) join the network by connecting to those agents with high levels of connectedness. Net Logo coding is used to design such a social network.
5.3. Simulation
The agent-based model is formulated using Net Logo 6.1.0. in order to examine the agents’ attitudes towards the five attributes of vehicles. Given the importance of income in customers’ preference construction, they are divided into three income categories: high, middle, and low. The respective coefficient of variables for each group are assigned as a normal random value with an interval
, where
and
are the mean and standard deviation, respectively. The results of the logit estimation are as depicted in
Table 9.
The results of customers’ choice estimation and the sensitivity of customer behavior to each of the vehicles’ attributes by income group (as in
Table 8 and
Table 9) are used in the ABM.
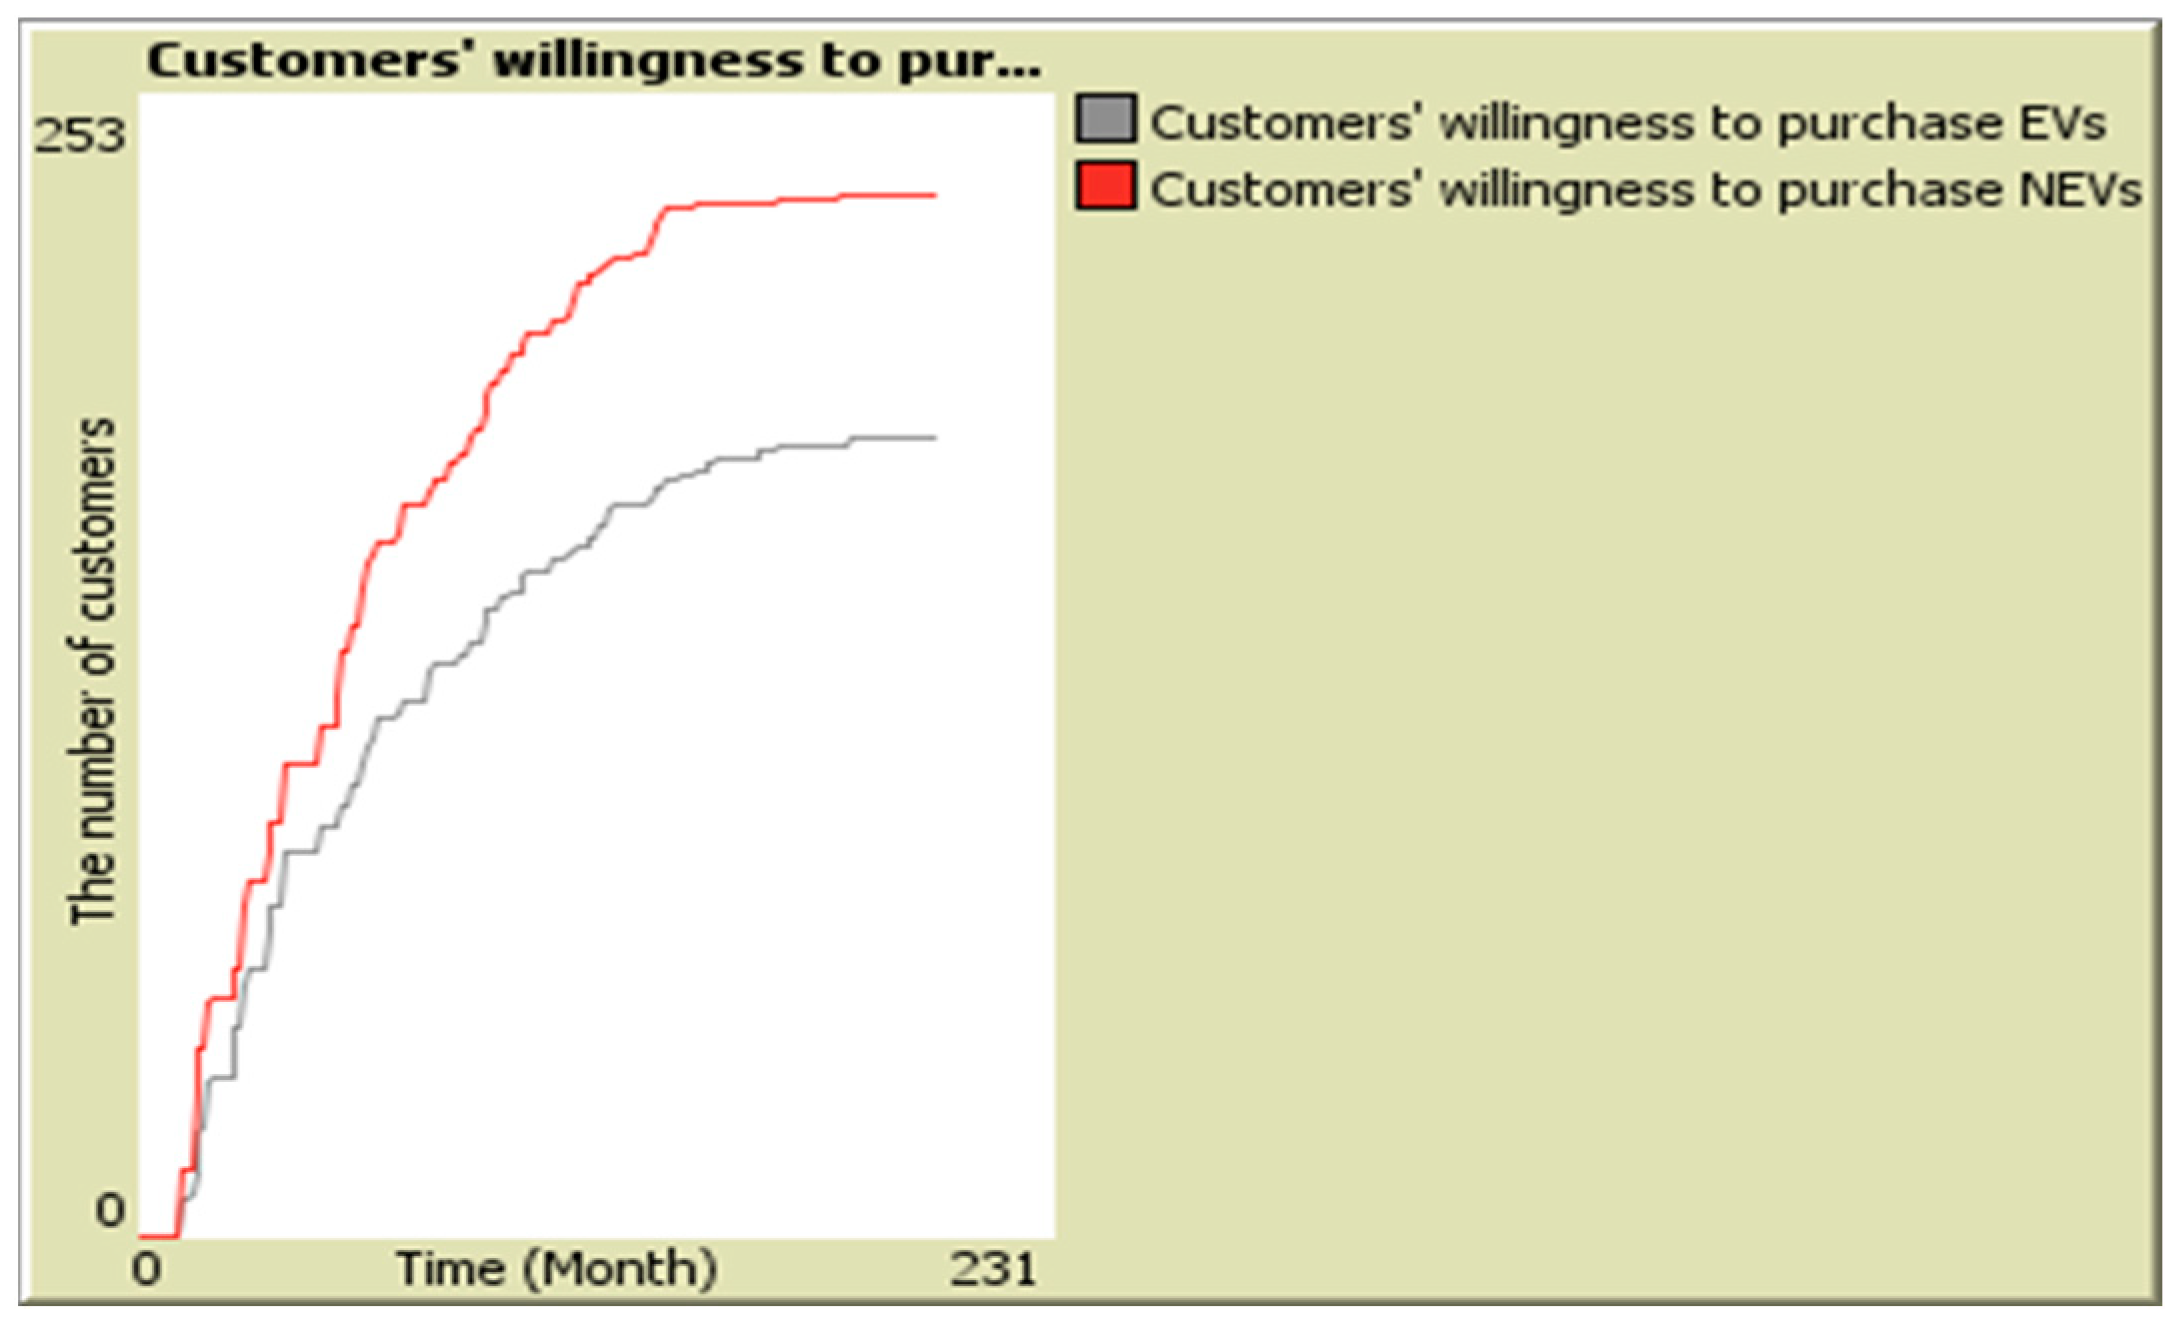
Figure 4 is indicative of a steadily increasing pattern in the willingness to purchase EVs.
5.4. Model Verification and Validation
There are three steps to verify the model results [
48]: (i) The conceptual design and the implemented model are first documented; (ii) next, the code of the model is tested and the required statistical meaningfulness of the parameters is examined; and finally (iii), the model functions are examined to ensure it operates as expected. For instance, an extreme value test is done to check if no agent is willing to purchase when the threshold indicator is set to 1, otherwise with a threshold level of 0, all agents purchase quickly, and the purchase curve moves upwards exponentially. Also, relative value testing is employed in order to ensure the conformity of results with the literature review.
In order to ensure model validation, we examined customer behavior in the real world according to behavioral economics assumptions and theories. According to neoclassical economics’ hypotheses, individuals maximize utility or short-term personal gain. Richard Thaler, however, argues that cognitive abilities, self-control, and motivation can vary significantly across different individuals [
49]. People make decisions in a world with asymmetric knowledge and information, the inability to manage personal habits, and specific social concerns. As a result, to simulate the vehicle market in ABM, we ensured that elements as well as processes and patterns of the implemented model correspond to the real world by employing a stochastic sampling approach. As a result, the model’s output may be claimed to reflect the expected behavior in the real world. Given that Iranian customers only have a mental image of an EV, we employed the principles of behavioral pricing, internal reference pricing, and reserve pricing to ensure the accuracy of EV pricing. Customer agent data are collected from a representative sample of society using a discrete choice questionnaire. In the real world, individuals are not homogeneous in their sensitivity to vehicle features. With this in mind, the data is processed using the Monte Carlo simulation method with random parameter logit modeling. Given this, the operational model’s input is calibrated using real-world data. A validation process is used that combines specific “face validation techniques” with statistical methods (sensitivity analysis and calibration of parameters), the results of which are available from the authors upon request.
5.5. Scenario Building
The main question is how a willingness to purchase EVs could be motivated by intervening instruments. Different scenarios for the price, energy cost, government incentives, travel range, and top speed are considered based on experts’ opinions.
5.5.1. Scenario 1: EV Price
The production cost of an EV is twice as much as a currently produced gasoline car with similar attributes [
50]. This scenario, however, allows a 10-percent drop in the EV-NEV price gap as a result of cost efficiencies due to returns to scale and technology learning in time.
5.5.2. Scenario 2: NEVs Energy Costs
The customer price of gasoline is $0.15 a liter at the moment. This scenario considers a 10-percent rise in petrol price each year. This scenario is also a reasonable one in light of extreme sanctions and the government’s willingness to finance its budget deficit through higher petrol prices.
5.5.3. Scenario 3: EVs Government Incentives
In this scenario, the government allocates a subsidy equivalent to 20-percent of EV prices in order to encourage customers to purchase EVs rather than NEVs. This subsidy might be through different types, i.e., directly through customer tax cuts and imports tariff reductions for EVs and indirectly by increasing customer tax and imports tariff for NEVs.
5.5.4. Scenario 4: EVs Travel Range
Recent technological advances are going to enable producers to extend the travel range of EVs to about 400 km on a single charge in the near future [
51]. This scenario, therefore, considers a 30-percent increase in travel range.
5.5.5. Scenario 5: EVs Top Speed
The same argument as discussed for scenario 4 above holds for considering a 30-percent increase in the top speed of EVs.
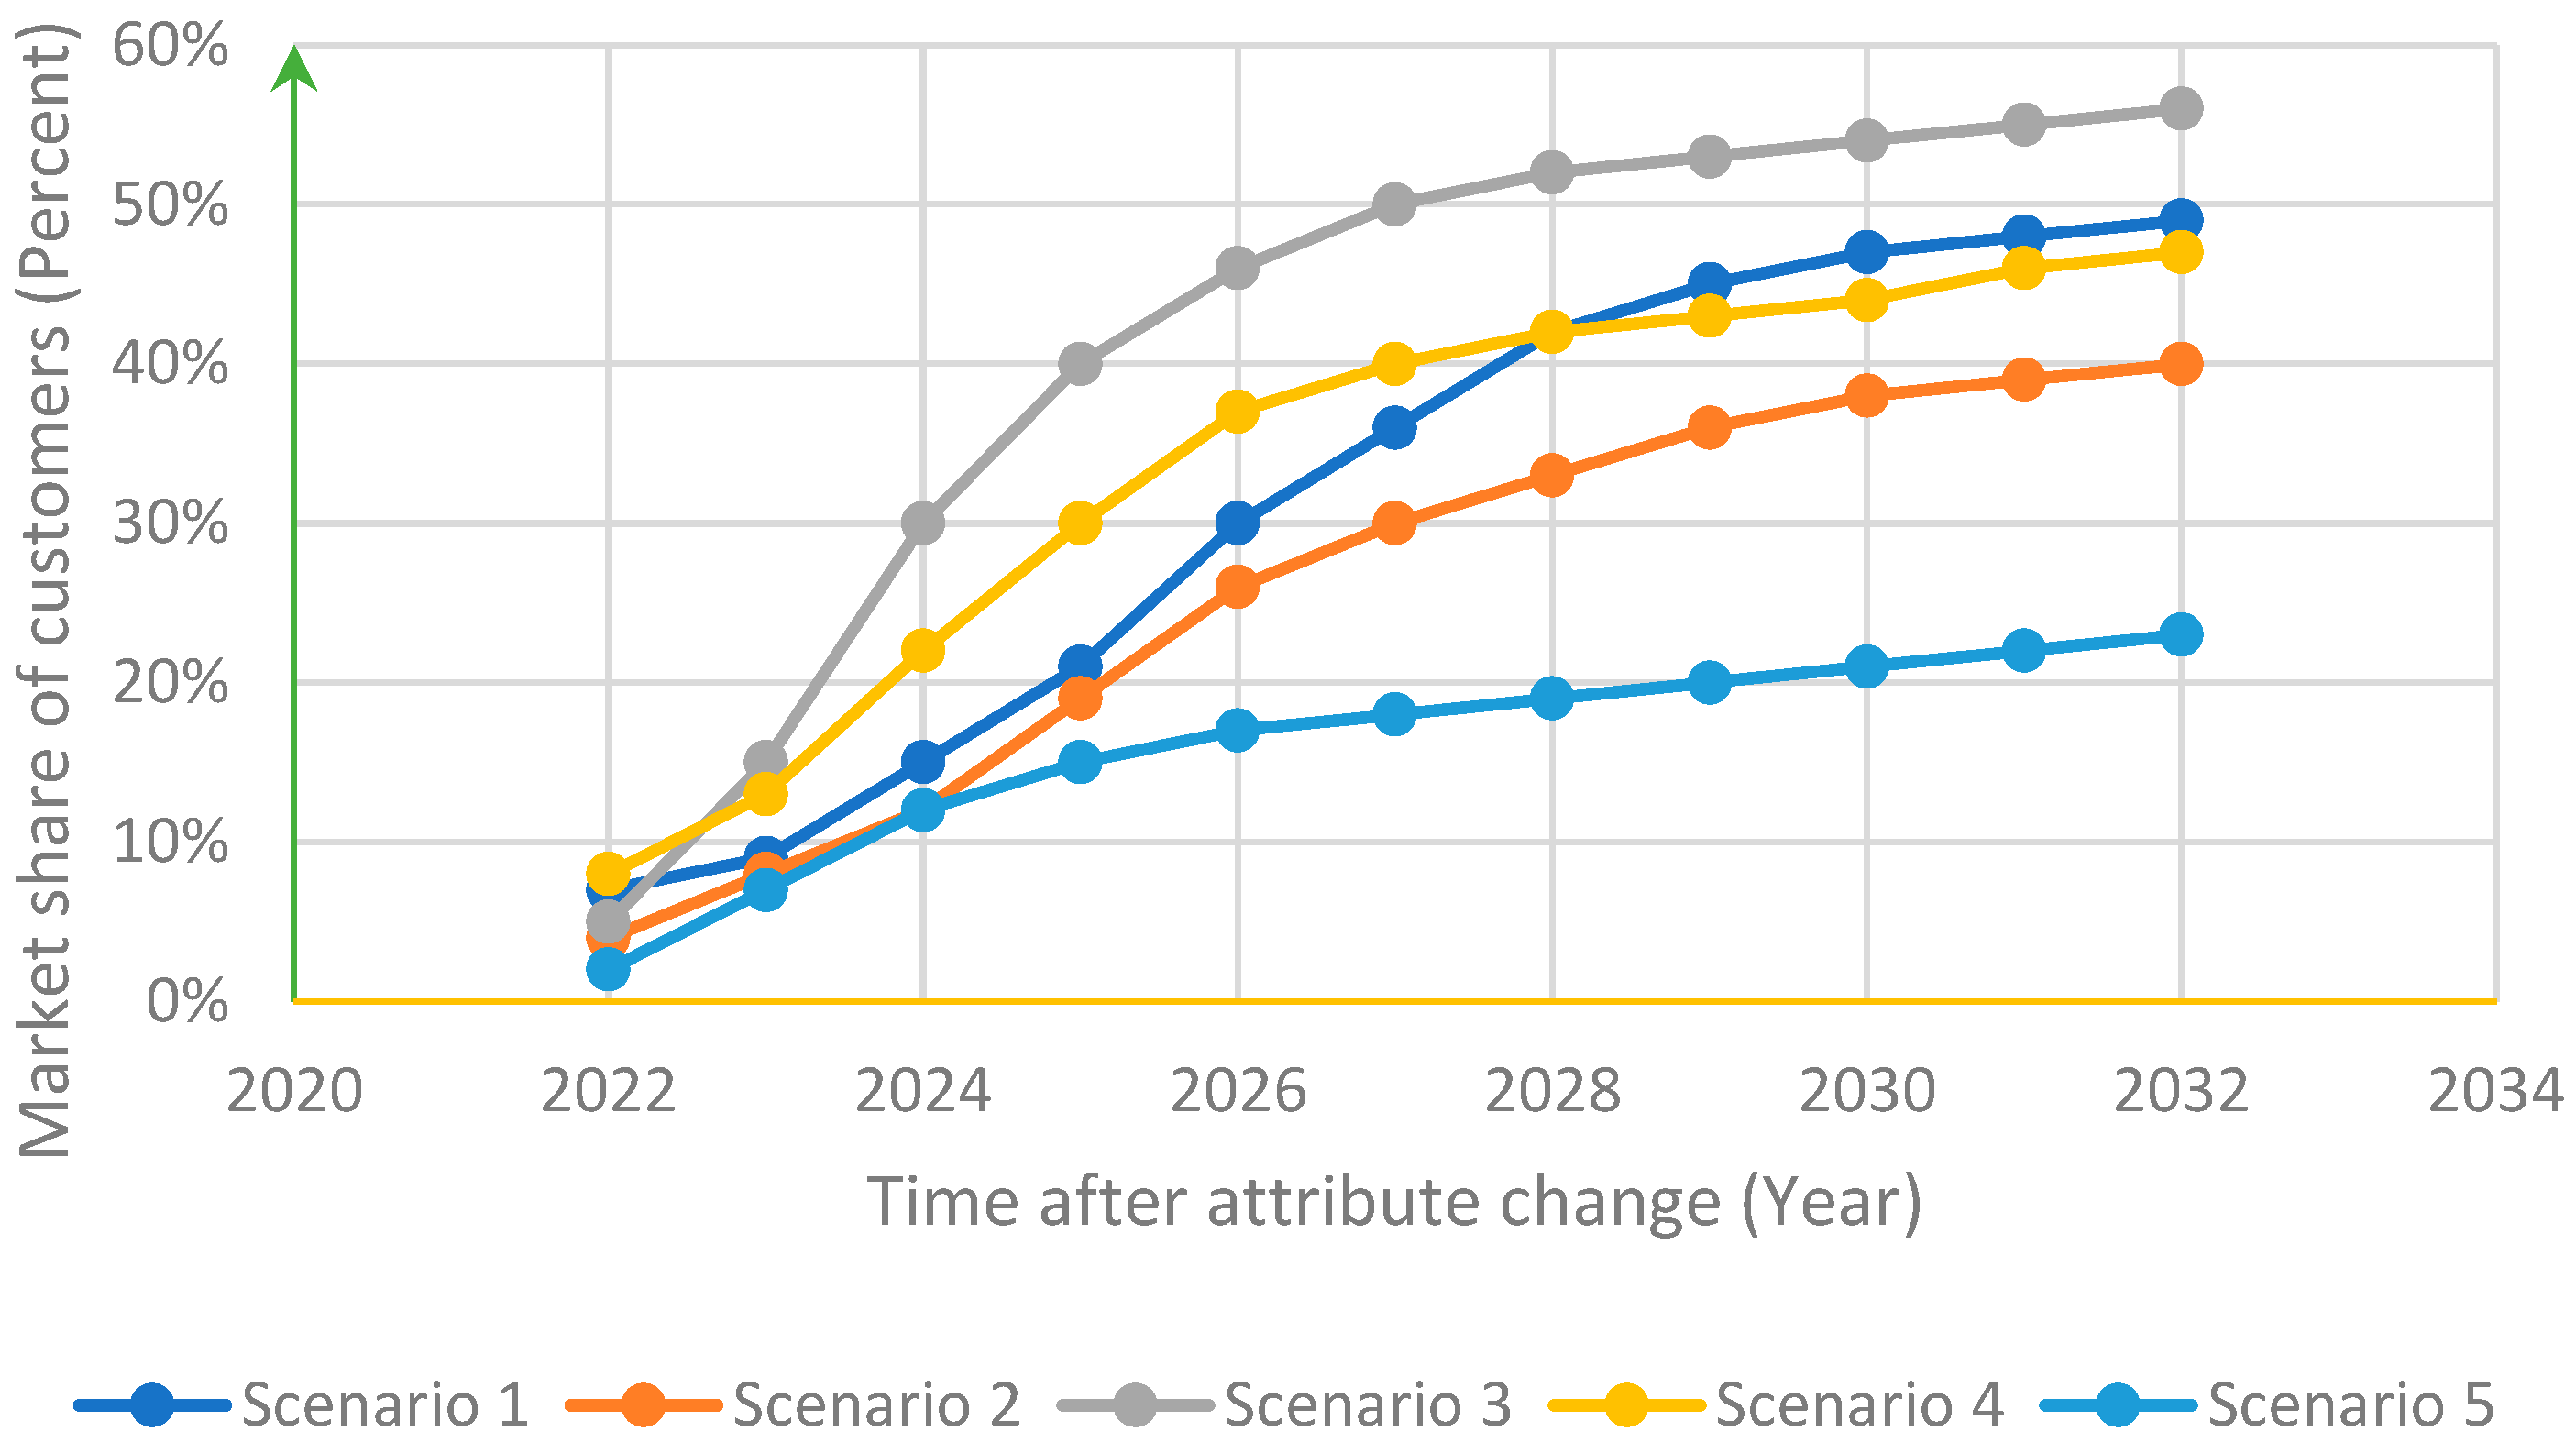
Figure 5 shows the market share of EVs as a result of implementing each scenario over a period of 10 years from 2022 to 2032.
6. Conclusions and Discussion
An agent-based model is applied to study the willingness to purchase electric vehicles. The results indicated that there is a heterogeneity of willingness to purchase NEVs and EVs. Five vehicle attributes have proved to have a significant effect on the willingness to purchase an EV in a mixed logit choice model. Applying the information derived from DCM in ABM, different scenarios on vehicle price, energy price, top speed, travel range, and government incentives are considered. The scenario priorities, in terms of their effectiveness in encouraging the purchase of EVs over a 10-year period after implementation, are the allocation of government incentives for EVs (56%), decreasing the EVs-NEVs price gap (49%), increasing EV travel range (47%), increasing gasoline prices (40%), and enhancing EV top speed (23%).
Given the effectiveness of government incentives, the government is recommended to follow incentive policies aimed at encouraging the use of clean fuel vehicles. This may include further construction of charging stations and providing car and battery manufacturers with low-cost financial support. The government budget is also recommended to target the purchase of EVs instead of NEVs for its own uses. Large and coordinated car purchases (e.g., taxi fleet) can also guarantee the minimum demand required for a fruitful start to the EV industry. The government owned broadcasting system may also play a crucial role in directing people’s demand towards the EV market. The issue of education about electric mobility, which can help influence the public’s approach to electric cars, is essential. Pollák et al. [
52] find that changing people’s mindset towards EVs is a big challenge to market development. Also, Turoń et al. [
53] declare that each form of dissemination of knowledge using appropriate educational methods in the field of electric mobility (e.g., from the classic methods as lectures and working with books to new educational solutions like e-learning) could raise public awareness about the advantages of EVs. Similarly, our findings about the effect of social networks calls for the need to encourage EV consumption instruments through education systems to enhance people’s awareness of sustainable transport advantages.
6.1. Comparative Analysis of the Results
A number of studies such as Brown utilize an agent-based mixed logit models to study the EV markets [
27]. Comparing our results with those of other studies is proof of the validity of our study. Eggers and Eggers [
54] and Brown conclude that a low price is the main source of competitive advantage for EVs, followed by travel range and financial incentives during the early years. Noori and Tatari [
18] and Danielis et al. [
23] also argue that government subsidies play an important role in the willingness to purchase EVs. Besides, according to Noori and Tatari [
18], increasing the travel range or speed of EVs has little impact compared to other financial-based scenarios. Shafiei et al. [
28] suggest increases in gasoline prices, followed by decreases in EV prices, which would bring considerable market shares for EVs. In contrast with this article, Byun et al. [
16] and Hidrue et al. [
20] conclude that drivers prefer shorter charging times, as respondents were willing to pay extra to reduce the charging time. One possible reason is that most respondents have not actually been faced with the problem of long charging times in the real world, as most of them have not experienced owning an EV. Similar to our results, however, they suggest that the government should build a charging infrastructure to encourage the use of electric vehicles.
This study, while confirming the result of other studies, provides an intervention policy package tailored for Iranian car industry policymakers.
6.2. Research Suggestions
We faced a number of limitations in this research. First, as the statistical data is collected from customers in two large cities, Tehran and Mashhad, the results may be generalized to the whole of Iranian cities only with due care. Of course, the results of the study may be generalized to other Iranian megacities like Isfahan, Karaj, Shiraz, Tabriz, Qom, and Ahwaz, which have populations of more than 1 million (totally more than one fourth of the country’s population) and where there are a sufficient number of charging points and high potential demand for EVs. Second, as there is no active market for EVs in Iran, we were left with no option but to apply a DCM approach to identify customer preferences. One, however, may employ other approaches like that of Kotler [
55], which is based on a Stimulus-Response Model (SRM), to provide a better understanding of customers’ buying behavior.


 ,
, 


