Article

Probing the Coalescence Mechanism of Oil Droplets in Fluids Produced by Oil Wells and the Microscopic Interaction between Molecules in Oil Films

1
Key Laboratory of Enhanced Oil Recovery, Ministry of Education, College of Petroleum Engineering, Northeast Petroleum University, Daqing 163318, China
2
College of Oil and Gas Engineering, Chongqing Academy of Science and Technology, Chongqing 401331, China
*
Authors to whom correspondence should be addressed.
Energies 2022, 15(12), 4274; https://doi.org/10.3390/en15124274 (registering DOI)
Submission received: 28 April 2022 / Revised: 2 June 2022 / Accepted: 8 June 2022 / Published: 10 June 2022

Abstract

:
The microscopic interactions between oil droplets during the coalescence process have an important impact on the stability of the emulsion. In this paper, a model that can present the phenomenon of coalescence of oil droplets was established. Experiments were carried out to evaluate the stability of the emulsion. Combined with molecular dynamics simulation technology, the coalescence behaviors of emulsified oil droplets in fluids produced by oil wells were studied. Factors affecting the coalescence of emulsified oil droplets were analyzed. The results show that the fluid velocity was relatively high at the position where two oil droplets were close to each other. After the coalescence of oil droplets was completed, the emulsion system became stable. There was no obvious correlation between oil droplet size and coalescence time. When two adjacent oil droplets with different radii coalesced, the larger oil droplet moved a shorter distance overall. At the initial moment, there was a clear boundary between the oil film and the water phase. The longer the carbon chain, the more stable the emulsion. Among the following four crude oil molecules with the same number of carbon atoms, chain-like saturated hydrocarbons were the most stable, followed by chain-like carbon–carbon double bonds in component crude oil. Crude oils containing chain-like carbon–carbon triple bonds were the third most stable. Cyclane were the least stable. An increase in the asphaltene content was an important reason for the enhancement of the emulsifying ability and stability in the emulsion system. This work can help improve oil–water separation efficiency, thus reducing storage and transportation burden of crude oil.

1. Introduction

The distribution of oil and water in fluids produced by oil wells is complex. Under the synergistic action of surfactant and shear stirring of porous medium in formation, oil–water emulsion with good stability is easily produced in the produced fluid [1]. The existence of oil–water emulsion can cause great damage to its transportation pipeline equipment, resulting in a significant reduction in the service life. In the surface treatment process of crude oil, the existence of toxic chemical can not only easily cause harm the human body, but also promote the occurrence of high equipment corrosion and increase the burden of storage and transportation process. The existence of emulsion is extremely harmful, so it is necessary to destroy the emulsion to achieve oil–water separation. The process of demulsification is generally divided into three small stages: the aggregation of emulsion droplets, the oil film discharge between oil droplets, and the coalescence of oil droplets. Coalescence of oil droplet is an important step in crude oil demulsification. The phenomenon of small oil droplets gradually moving towards to large oil droplets occurred during the coalescence process of emulsified oil droplets. Then, the coalescence was completed, and Ostwald ripening phenomenon appeared [2]. Aarts Dirk G A L et al. [3] observed the coalescence of droplets in variable viscosity molecular systems and colloid-polymer mixtures with ultra-low surface tension. When the solution viscosity in the system is large or the interfacial tension between colloidal particles and polymer is small, it can be found that the opening of the liquid bridge initially proceeds at a constant speed set by the capillary velocity. Chen et al. [4] systematically studied the droplet trajectories, the time-dependent orientation angle of the droplet pair, and the droplet deformation prior to the coalescence event, and provided a comparison between the confined and the unconfined situation. Rayhani et al. [5] studied the effects of ion concentration and ion type on the stability of natural water-in-oil emulsion. It was believed that the ion concentration and ion type of the aqueous phase both had a certain impact on the stability of the emulsion. Properly decreasing the salinity of aqueous phase was beneficial to improving the stability of emulsion. The coexistence of sulfate ions and divalent cations could also improve the stability of the emulsion. Shardt Orest et al. [6] simulated the collision and coalescence of droplets in a simple shear flow using the free-energy binary-liquid lattice Boltzmann method. It was found that the ratio between the droplet radius and the interface thickness had the greatest impact on the effect of droplet coalescence. Zhao et al. [7] proposed a comprehensive numerical model VDROP, which can simulate the transient distribution of droplet size in the turbulent region. The results show that when the viscosity of dispersed phase was high, the method of adding surfactant to reduce oil–water interfacial tension (IFT) had little effect on droplet breakage. Angardi et al. [8] conducted a comprehensive analysis of emulsion stability and characterization techniques in petroleum processing. The chemical and physical factors which affected the separation efficiency and stability of emulsion dispersions were summarized, and the mathematical explanation of oil droplet coalescence was given. E Weiwei et al. [9] took the water–oil mixture as the research object, and established a new relation formula to predict liquid–liquid separation kinetics. In the new relation formula, the coalescence rate was predicted according to the volume fraction of oil–water and the initial diameter of oil droplets. Cui et al. [10] studied the preparation method and formation factors of emulsion. The small oil–water emulsions were prepared by shearing method. The formation mechanism of foaming agent emulsion prepared by the shearing method was revealed through the analysis of the emulsifier type, the shearing time, the shearing rate, the emulsifier dosage, and the content of foaming agent. It is believed that an ionic emulsifier could form an electric double layer, which further prevented the coalescence of oil droplets and improved the stability of emulsion through electrostatic repulsion. Laben et al. [11] explored the emulsifying stability of produced liquid under alkali, surfactant, and polymer (ASP) flooding conditions. The sizes and rheological properties of oil–water emulsion in produced fluids of ASP flooding were measured. It is considered that the stability of the emulsion could be improved only when the concentration of AOS surfactant was higher than 100 ppm, and only high concentration of sodium carbonate could increase the stability of the emulsion. Jerzy et al. [12] investigated the formation conditions of oil–water emulsions. It is found that simple high salinity did not play any role in stability. The speculation mechanism of salinity on the stabilization effect of Ostwald ripening was not applicable to these emulsions. At present, there were few studies on emulsion stability of the fluids produced by oil wells. Therefore, it is necessary to study the process of oil droplets coalescence and coalescence mechanism of oil droplets.
According to previous studies, it could be found that the density and viscosity of oil phase and interfacial properties between oil and water had a great influence on the coalescence behavior of oil droplets [13]. The coalescence of oil droplets is essentially a process in which the interfacial film is broken and recombined [14]. For oilfield development, crude oil components affect the adsorption capacity of water phase at the position of oil film, and then the motion behavior of oil droplets and the density distribution of different components can change [15]. The content of resin and asphaltene in crude oil, the content of carbon–carbon double bond, the proportion of long carbon chain components in crude oil, and the properties of surfactant in the aqueous phase are the internal reasons that affect the coalescence of oil droplets [16].
Therefore, a model that could present the phenomenon of coalescence of oil droplets was established, and the microscopic characteristics and influencing factors of coalescence process of oil droplets in fluid produced by oil wells were analyzed. The molecular dynamics simulation and emulsion stability experiment were combined to study the motion behavior of molecules in the oil film during the coalescence of oil droplets. The internal relations between macroscopic phenomena of oil droplet coalescence and free movement of crude oil molecules and water molecules were analyzed. The influence of crude oil components on the coalescence of oil droplet was studied. This work further improves the coalescence theory of oil droplets, which is of great significance to improve the oil–water separation efficiency of crude oil and reduce the burden of crude oil storage and transportation.

2. Experiments and Models

2.1. Theoretical Part

2.1.1. Fluid Flow Equation in the Process of Coalescence of Oil Droplets

Considering the complexity of fluid interaction during the coalescence of oil droplets, the following basic assumptions were set:
(1)
The system was not affected by gravity during the coalescence of oil droplets.
(2)
During the coalescence of oil droplet, the water phase in the system was stable, and flow phenomenon did not occur.
(3)
The variation of viscosity with temperature during the coalescence of oil droplet was ignored.
(4)
The influence of the components of crude oil on coalescence was ignored.
In the coalescence of oil droplets in the water phase, the flow equations of the oil phase and the water phase are demonstrated in Equation (1) [17]:
ρ u t + ρ ( u ) u = [ p I + K ] + F
ρ u = 0
K = μ ( u + ( u ) T )
where ρ is the density of the oil phase, kg/m3; ρref is the density of the water phase, kg/m3; u is the velocity, m/s; p is the net pressure or the average pressure, Pa; g is the acceleration of gravity, m/s2; F is the surface tension; μ is the dynamic viscosity, N∙s/m2; I is the unit tensor; and K is the deviatoric stress tensor.
The gravity of oil droplets can affect the movement direction of oil droplets, thus affecting the coalescence process of oil droplets. Therefore, the gravity equation was considered as follows [18]:
ρ u t + ρ ( u ) u = [ p I + K ] + F + ( ρ ρ r e f ) g
The distribution characteristics of the two phases satisfied the following equation:
φ t + u φ = γ ( ε l s φ φ ( 1 φ ) φ | φ | ) , φ = p h i l s
where ϕ is the saturation of the system, dimensionless; εls is interface thickness and control parameters, m; phils is the level set variable; γ is the re-initialization parameter, m/s.
According to the above model, combined with the properties of oil droplets in the process of actual oilfield development (Table 1), the geometric model of oil droplets coalescence was established.

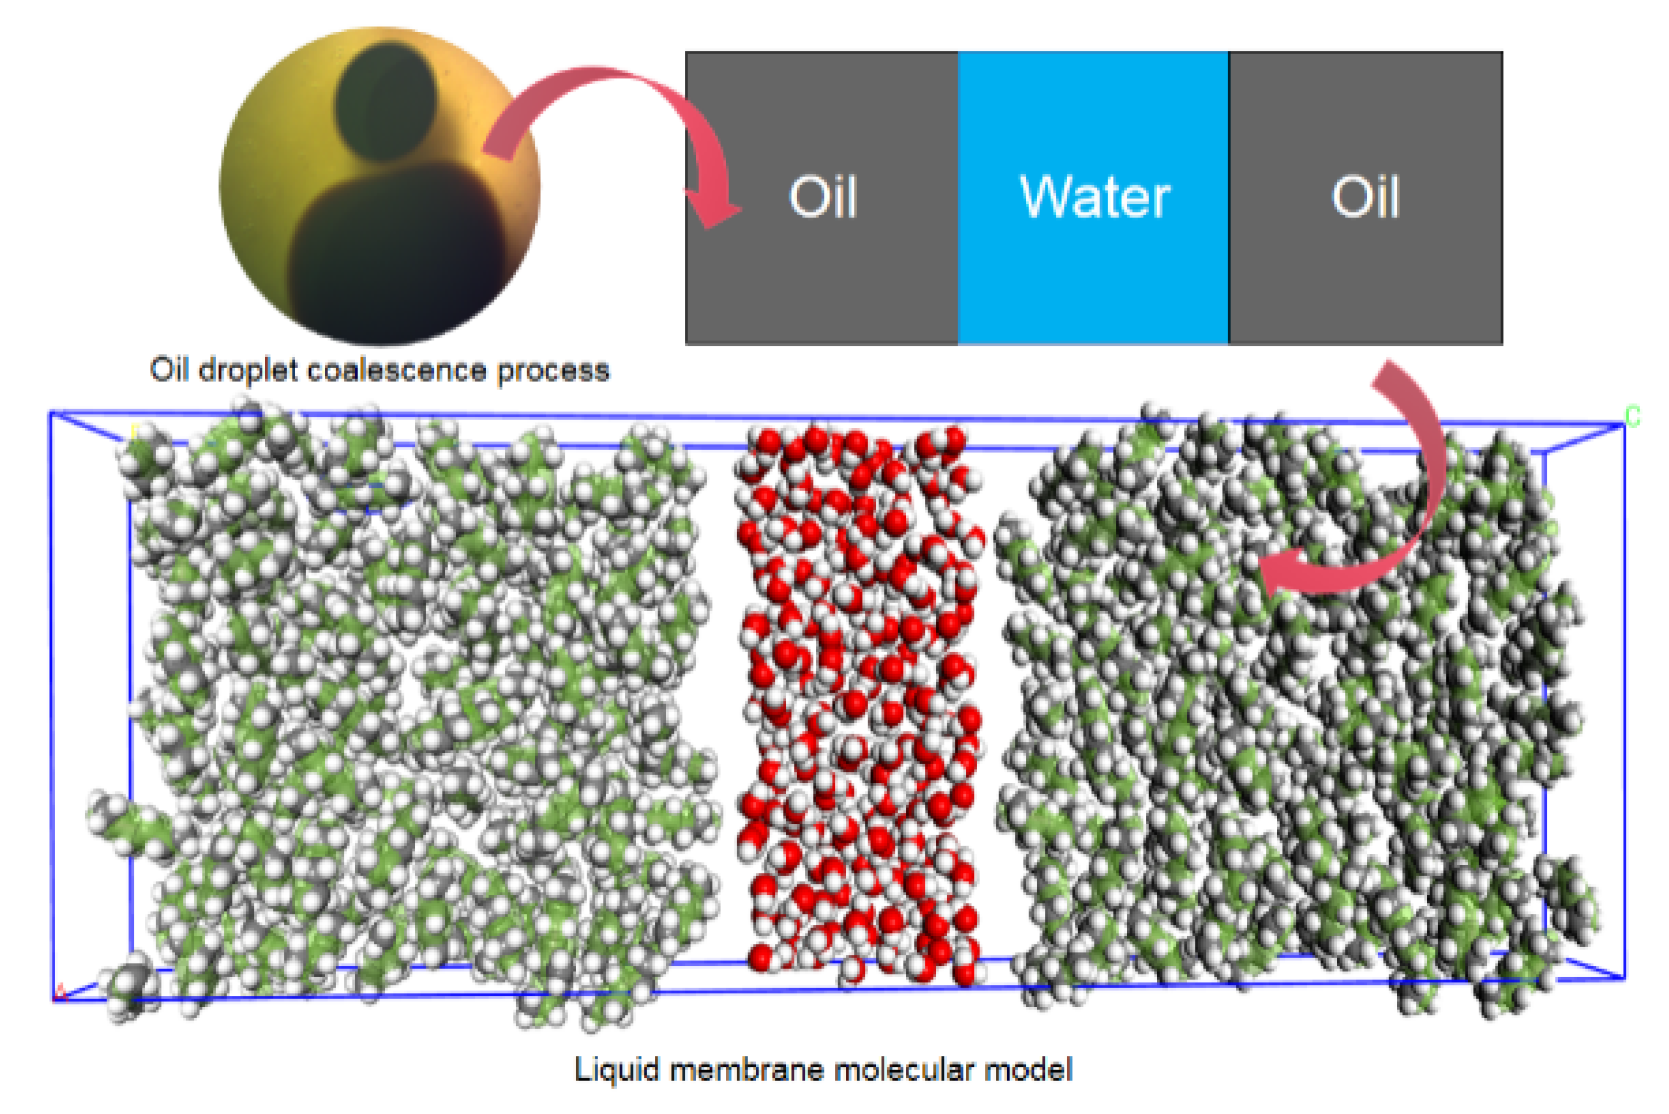
2.1.2. Molecular Simulation Model of Oil Droplet Coalescence

The coalescence of oil droplets was studied by establishing a molecular model within a narrow distance between oil droplets. In order to study the effect of different crude oil components on the coalescence of oil droplets, hydrocarbons with different carbon chain lengths, carbon–carbon double bonds, carbon–carbon triple bonds, and cycloalkanes were selected to simulate crude oil components. The model is shown in Figure 1.
The molecular model that can present the phenomenon of coalescence of oil droplets is shown in the figure, and the TIP4P model [19] was used for water molecules. Firstly, C1–C6 was randomly placed into the box, of which the total number was 60, and the number of asphaltenes was 2. The surfactant molecules were then placed outside the crude oil component and the lipophilic group was oriented towards the crude oil component. Finally, the water molecules, of which there were 140, were placed near the hydrophilic group of surfactant molecules. The Lennard–Jones potential [20] was used for the intermolecular interaction potential of the model, and the truncation radius was 12.5 Å. The long-range coulomb force was calculated using the particle–particle particle–mesh (PPPM) algorithm. The system was simulated in the NVT (canonical ensemble) ensemble for 1 ns, and the temperature of the system was controlled by a Nose–Hoover thermostat at 293.15 K with a time interval of 0.5 ps.

2.2. Experimental PART

2.2.1. Experimental Materials

The crude oil was supplied by Liaohe Oilfield, Daqing Oilfield No. 10 Production Plant and Xinjiang Oilfield, respectively. The distilled water, kerosene, and water-in-oil surfactants (called-10) were used to carry out the experiments. The beakers, test tubes, glass rods, homogenizer, thermostats, and other experimental equipment were used in experiments.

2.2.2. Experiment on Composition Measurement of Simulated Oil Group

Crude oil, white oil, and kerosene were selected for compounding the proportion shown in Table 2. Due to the high content of saturated hydrocarbon in kerosene and white oil, compounding occurred by adding different amounts of kerosene and white oil into the crude oil. The crude oil after compounding could be used to compare the effects of saturated hydrocarbon components on emulsion stability. In addition, the content of aromatic hydrocarbons in white oil was higher than that in kerosene, and the effect of aromatic hydrocarbons on emulsion stability could be compared by adjusting the proportion of white oil. The content of resin in Xinjiang Oilfield was high, and the content of asphaltene in crude oil from Liaohe Oilfield was high. The crude oil after compounding was compared with the No. 10 oil production plant of Daqing Oilfield to analyze the influence of different components on emulsion stability.
The group composition of the simulated oil was measured according to the method of Zhang et al. [21]. Firstly, 20~50 mg of crude oil was weighed and 30 mL of n-hexane was used to dissolve the crude oil samples, which were placed in a small beaker and sealed. Then, the crude oil samples dissolved in n-hexane were filtered. The insolubles of crude oil filtered by n-hexane were mechanical impurities and asphaltenes, in which asphaltenes were dissolved in chloroform and collected. Finally, the n-hexane filtrate was passed through a chromatographic column fitted with chromatographic silica gel and neutral alumina. The saturated alkanes in crude oil after compounding were collected by n-hexane leaching. The aromatic hydrocarbons in crude oil after compounding were collected by leaching with n-hexane–dichloromethane mixed solvent. The resin was collected by alternate leaching with chloroform and ethanol. In the above process, the constant weight beakers were used as the containers for collection. The solvents were placed in a ventilating cabinet to volatilize. The saturated alkanes and aromatic hydrocarbons were volatilized to dryness, constant weight, and weighing at 35 °C. The resin and asphaltene were volatilized to dryness, constant weight, and weighing at 55 °C. Finally, the group composition of crude oil was calculated.

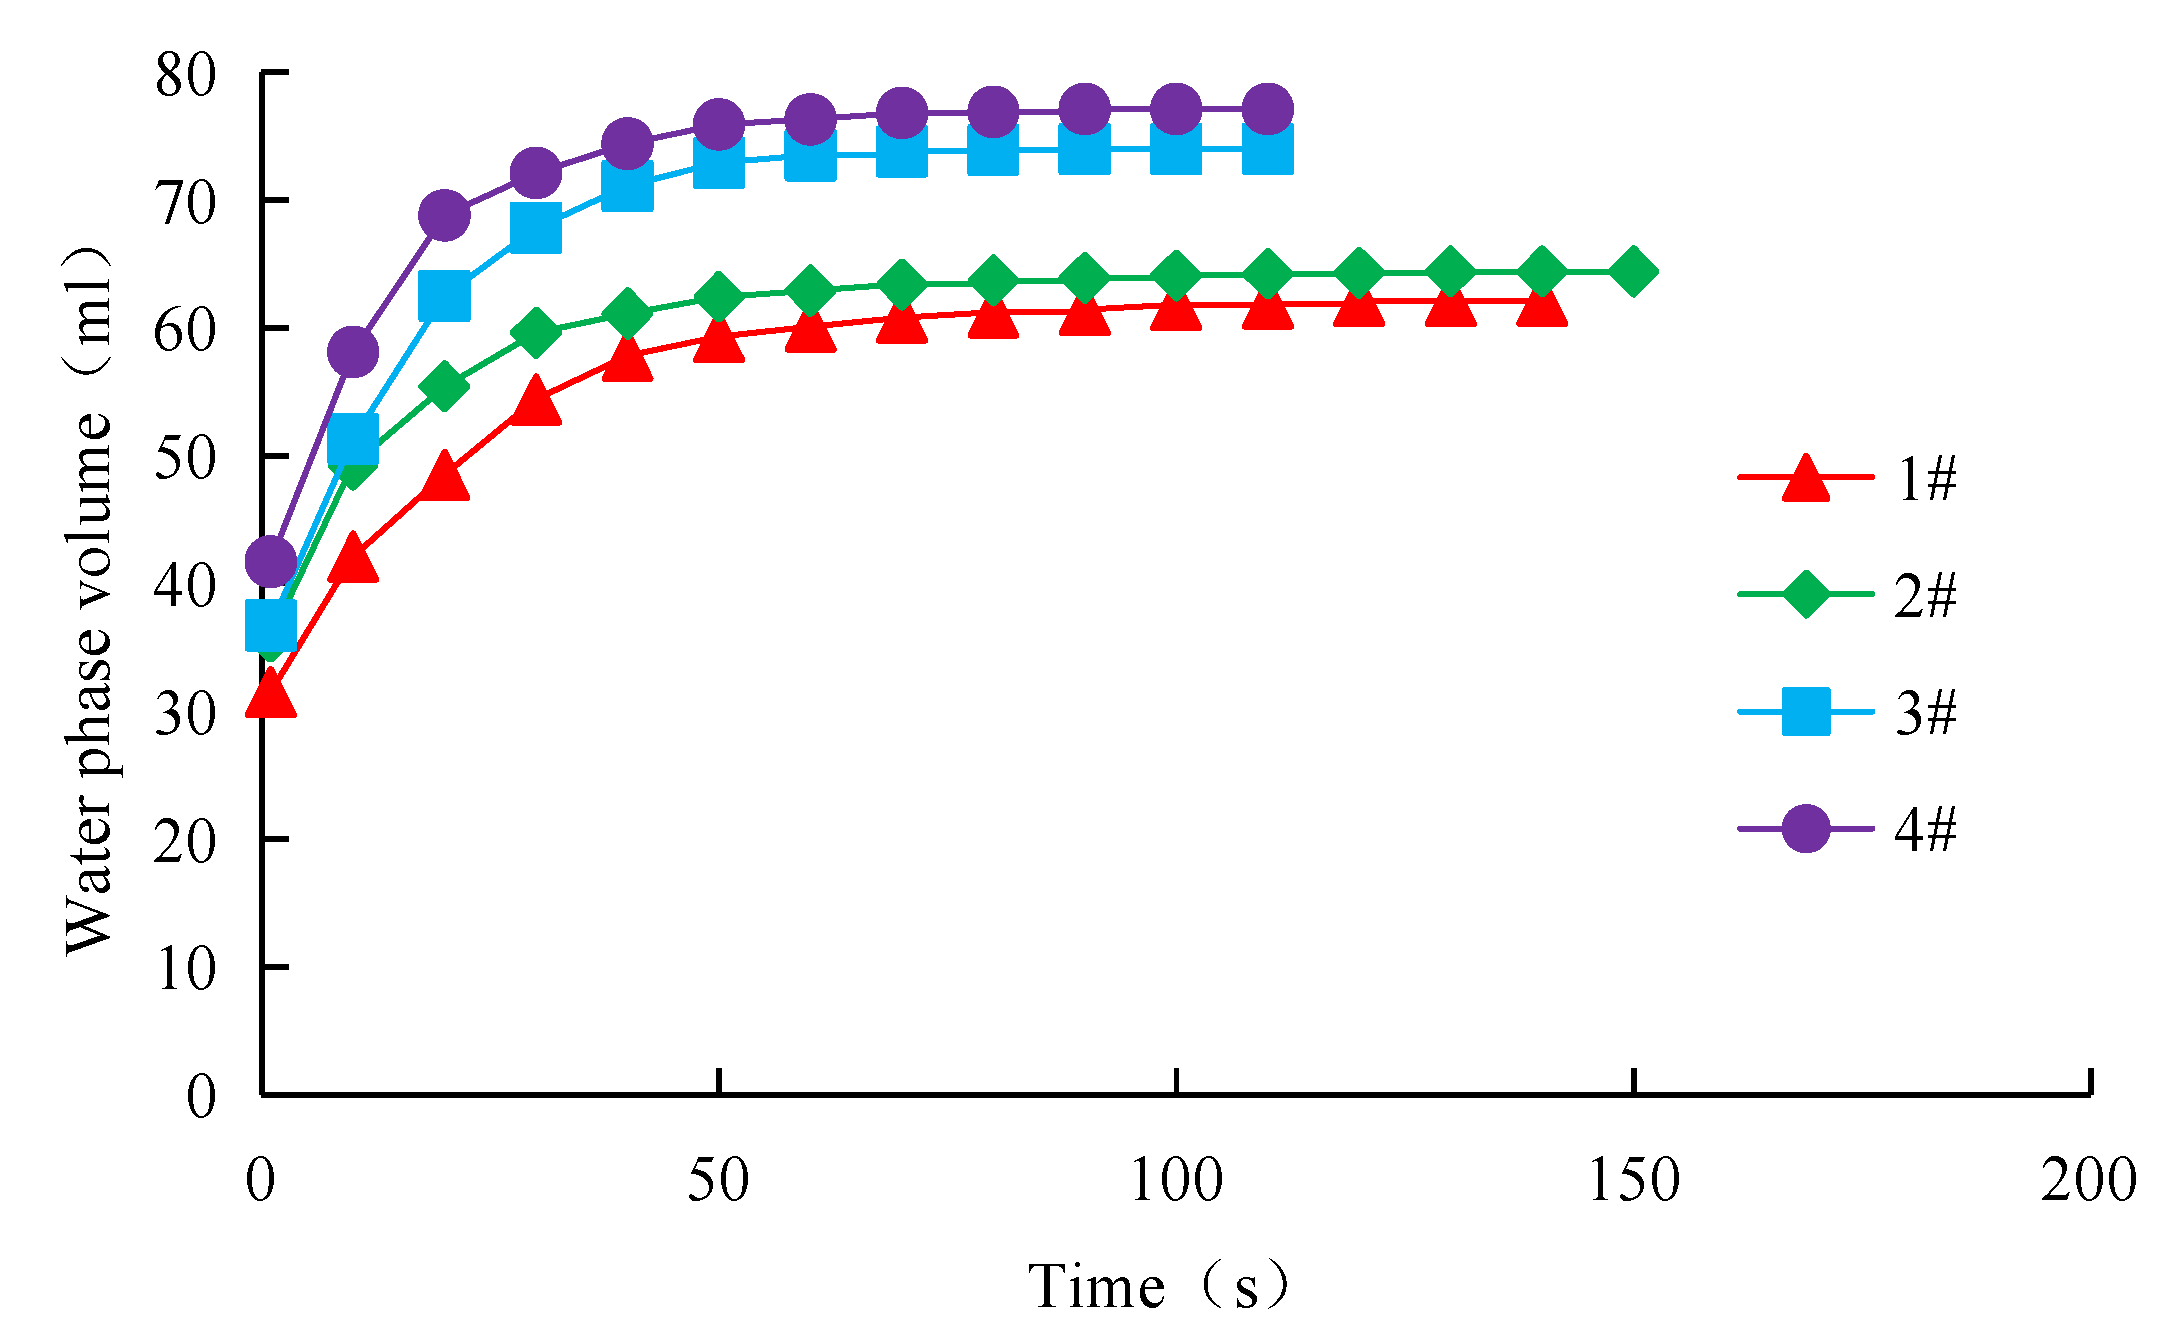
2.2.3. Experiment of Emulsion Stability Evaluation

The stability of the oil–water emulsion in fluids produced by oil wells was poor. Therefore, in order to facilitate the measurement, the surfactant solution with the concentration of 0.2% was prepared by adding O-10 surfactant to deionized water. It is used to strengthen the emulsifying ability of the oil–water two-phase, so that the emulsion after stirring maintained strong emulsifying stability, which is convenient for quantitative measurement. Twenty milliliters of sample oil and eighty milliliters of surfactant solution were sealed and placed in 60 °C thermostat to ensure that the sample oil and surfactant solution were in the selected temperature during the process of emulsification. When the sample oil and surfactant solution stabilized at 60 °C, they were removed from the thermostat. The surfactant solution was put into an emulsion bottle and fully stirred with a glass rod. Then, the emulsion bottle containing surfactant solution was placed under the homogenizer, and the position of the emulsion bottle and the homogenizer head was adjusted, so that the homogenizer head was in the central position of the surfactant solution, and the speed was adjusted to 30,000 r/min. Then, the crude oil of 60 °C was gradually added into the surfactant solution which was stirred by the homogenizer, so that the crude oil and the surfactant solution could be fully mixed to achieve better emulsifying effect. At this time, the outside of the emulsion bottle was heated in a water bath to ensure that the emulsion system was always at 60 °C in the stirring process. After the crude oil and surfactant solution were continuously stirred for 1 min, the emulsion formed after stirring was observed in a water bath, and the corresponding time after stratification was recorded.

3. Result Analysis

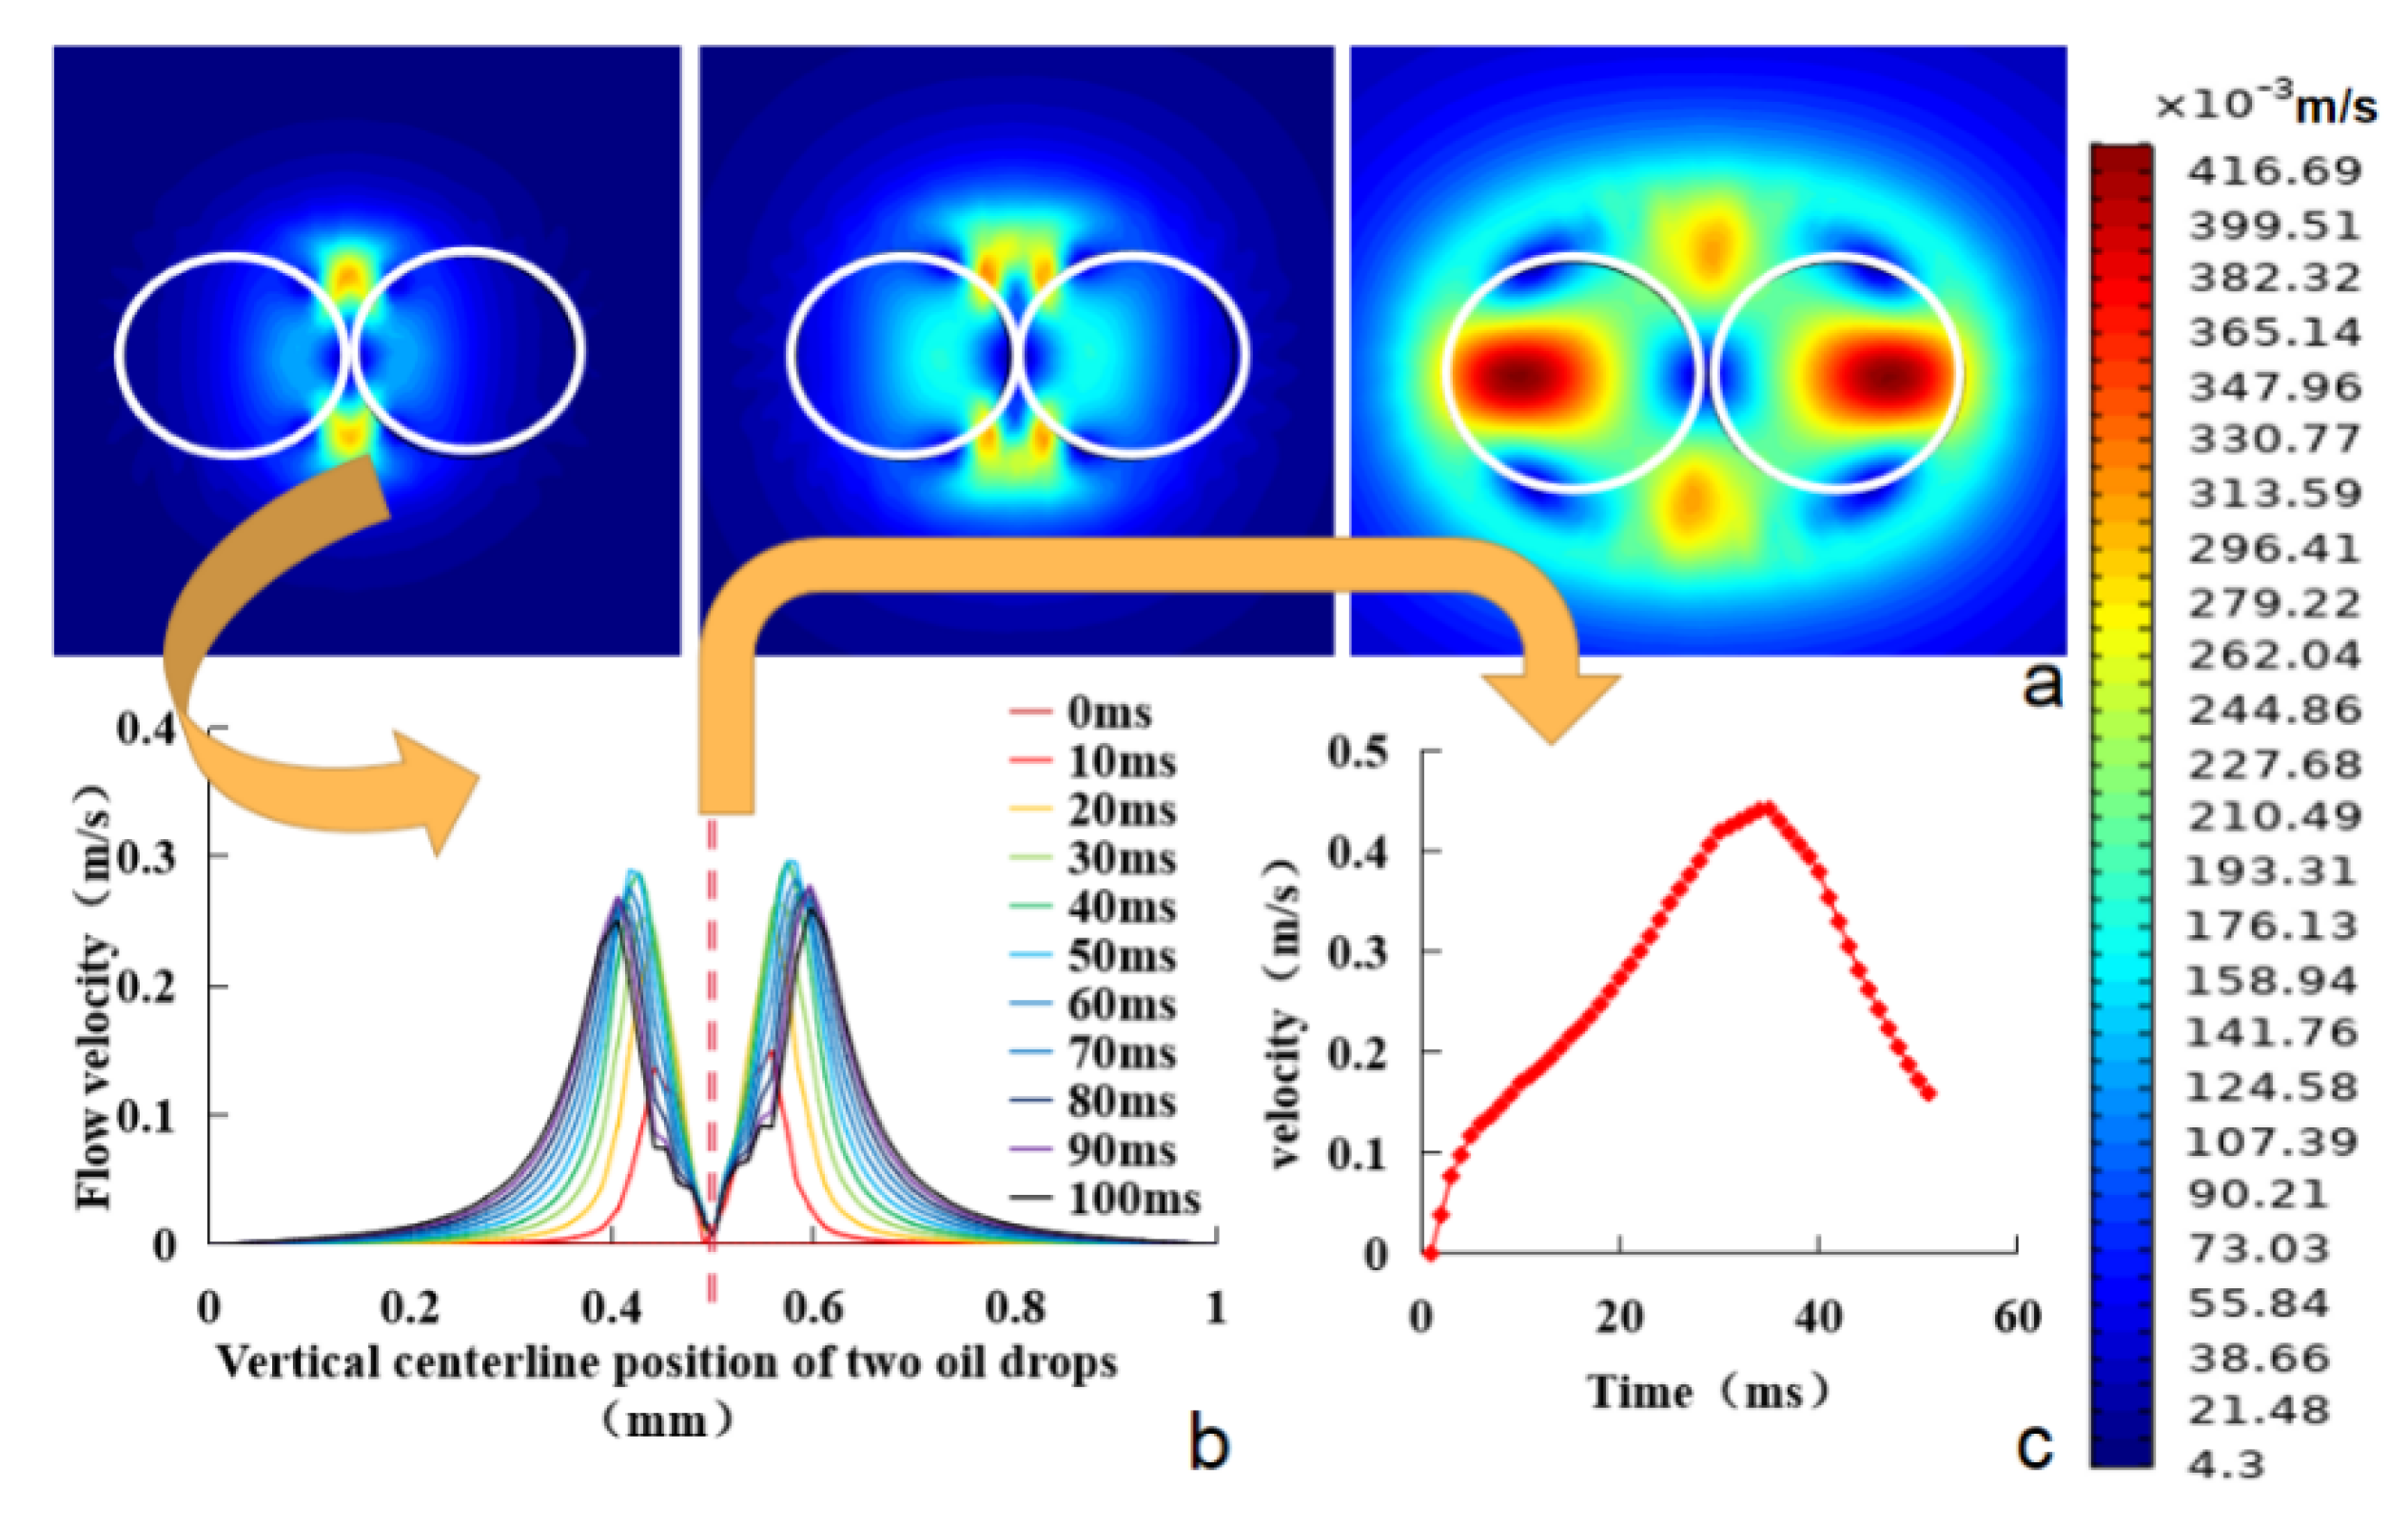
3.1. Microscopic Characteristics of Oil Droplets Coalescence Process

Changes in the volume fraction of the oil phase in the system were calculated as time elapsed during the coalescence of oil droplets, as shown in Figure 2.
Figure 2 shows that the oil phase saturation at the center line of the system gradually increased as the simulation progressed during the coalescence of oil droplet. This indicates that the two oil droplets gradually moved towards each other, and finally formed a large oil droplets. At about 30 ms, the volume fraction of the oil phase reaches about 90%, which was determined to be the initial time for the coalescence of oil droplets.
In 0–30 ms, the saturation of the oil phase at the vertical position in the system was low, which was because the two oil droplets moved towards each other but did not have any contact. When the oil droplets began to contact, the saturation of the oil phase at the vertical line in the system gradually increased, indicating that the two oil droplets tend to coalescence and become one large oil droplet (Figure 3a). The oil droplets in the process of coalescence showed an ellipsoidal shape. After the coalescence of oil droplets was completed, the big oil droplet gradually shrank and deformed under the action of interfacial tension between oil and water, and finally formed a regular sphere. When the radius of the two droplets was the same, the coalescence of the two droplets depended mainly on the mutual attraction of the two droplets. The liquid flow inside the original emulsion oil droplets not only gradually shrank and gathered inward, but also moved to the middle position between the two oil droplets, and finally gathered at this position to form a new oil droplet. However, when the radius of the two oil droplets was different, the coalescence of two droplets did not occur at the middle position between the two oil droplets. It was obvious that there was a significant migration from the relatively small oil droplets to the larger ones (Figure 3b), and the overall moving distance of the larger oil droplets was small. This was consistent with the results observed in the experiment (Figure 3c). It can be seen that when the size of the two oil droplets was not equal, the coalescence of the two oil droplets was evident as large oil droplets attracted small oil droplets to move towards themselves, so as to coalescence into larger oil droplets.
In addition, due to the influence of the interaction force between the two oil droplets, the pressure and the fluid velocity of the two oil droplets at each position in the water phase can significantly change. The fluid velocity distribution of the two oil droplets is shown in Figure 4.
It can be seen from the fluid velocity field cloud image in Figure 4a that the fluid velocity at the position where the two oil droplets close to each other was significantly higher than that at other positions. Under the action of the macroscopic interface of oil–water two-phase fluid, the relatively large force and violent fluctuation appeared at the position where the two oil droplets were close to each other. Therefore, with an increase in time, under the continuous action of the force, the components in the two oil droplets continued to aggregate, and eventually the phenomenon of coalescence occurred. Due to the difference of fluid concentration and surface tension between the two fluids, there was also a fluid velocity difference and a relative motion trend at the interface between oil phase and water phase. During the coalescence of two droplets, due to the continuous flow of the fluid, the force position of the two droplets was also changing at any time, which caused changes in pressure and velocity.
In 100 ms, with an increase in the simulation time, the fluid velocity at the center line of the system showed a gradually increasing trend, indicating that the oil droplets had gradually begun to aggregate. In the position of vertical line (0.5 mm), the fluid velocity hardly changed with time, in 0.3–0.45 mm and 0.55–0.7 mm position, and the fluid velocity significantly changed with time (Figure 4b). This suggests that the oil droplets at the position of vertical line (0.5 mm) were greatly affected by the Coulomb force and repel each other, and the other positions were greatly affected by the van der Waals force and attract each other. In order to further analyze the variation of fluid velocity in the coalescence of oil droplets, the fluid velocity at the position of the vertical line (0.5 mm) was selected to analyze the coalescence of oil droplets (Figure 4c). It can be seen from Figure 4c that the fluid velocity increased obviously at 0–3 ms, indicating that the distance between the two oil droplets was far, and the speed of coalescence between the two oil droplets was faster due to the influence of van der Waals force. With an increase in the simulation time, the increase extent of the fluid velocity gradually decreased. At 35 ms, the fluid velocity of the fluid at the vertical position reached the maximum value of about 0.45 m/s. During the coalescence of oil droplets, a change in the fluid velocity of the system gradually increased. However, as the distance between the two droplets gradually decreased, the electrostatic repulsion between the two oil droplets gradually increased, resulting in a decrease in the increase extent of the fluid velocity. Finally, the coalescence was completed at the position of the maximum fluid velocity. After the coalescence was completed, the fluid velocity in the system gradually decreased until it reached stability.

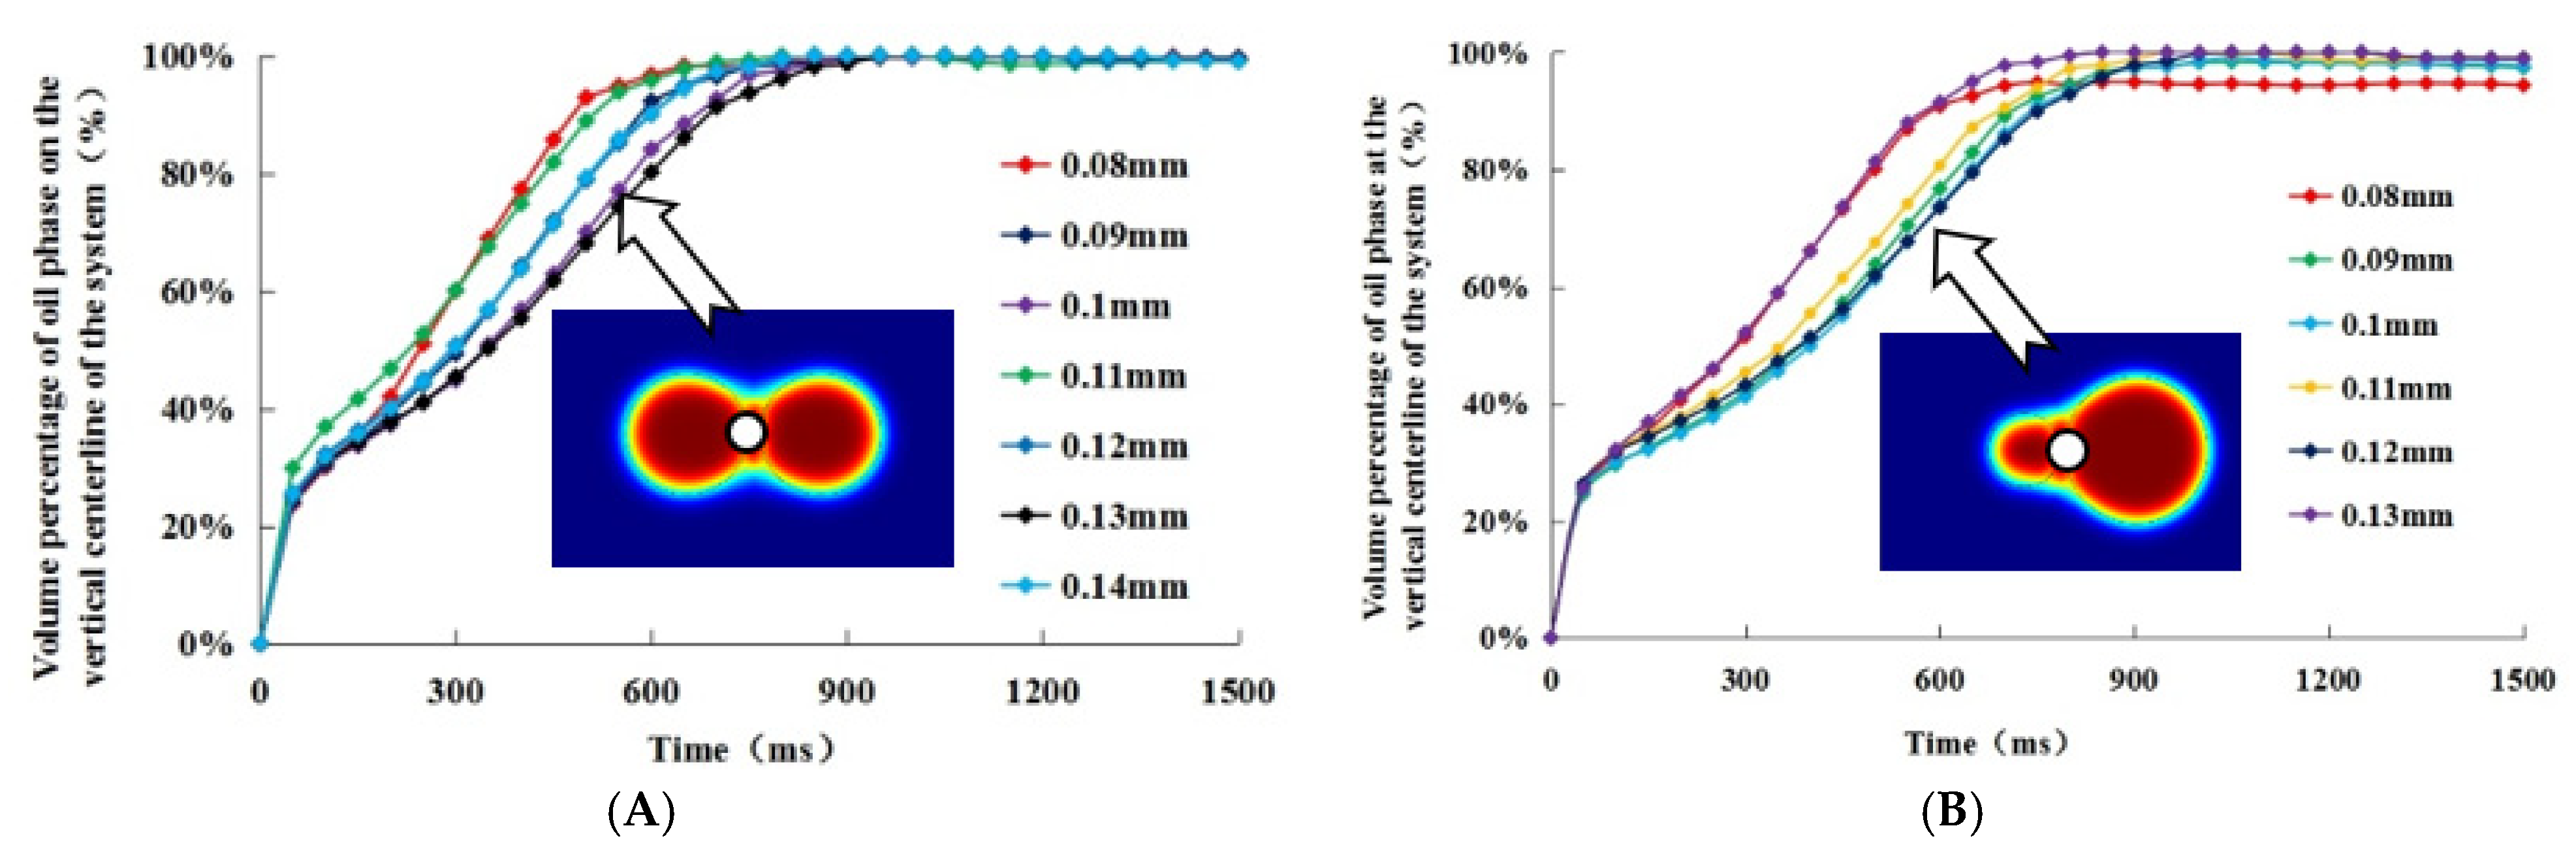
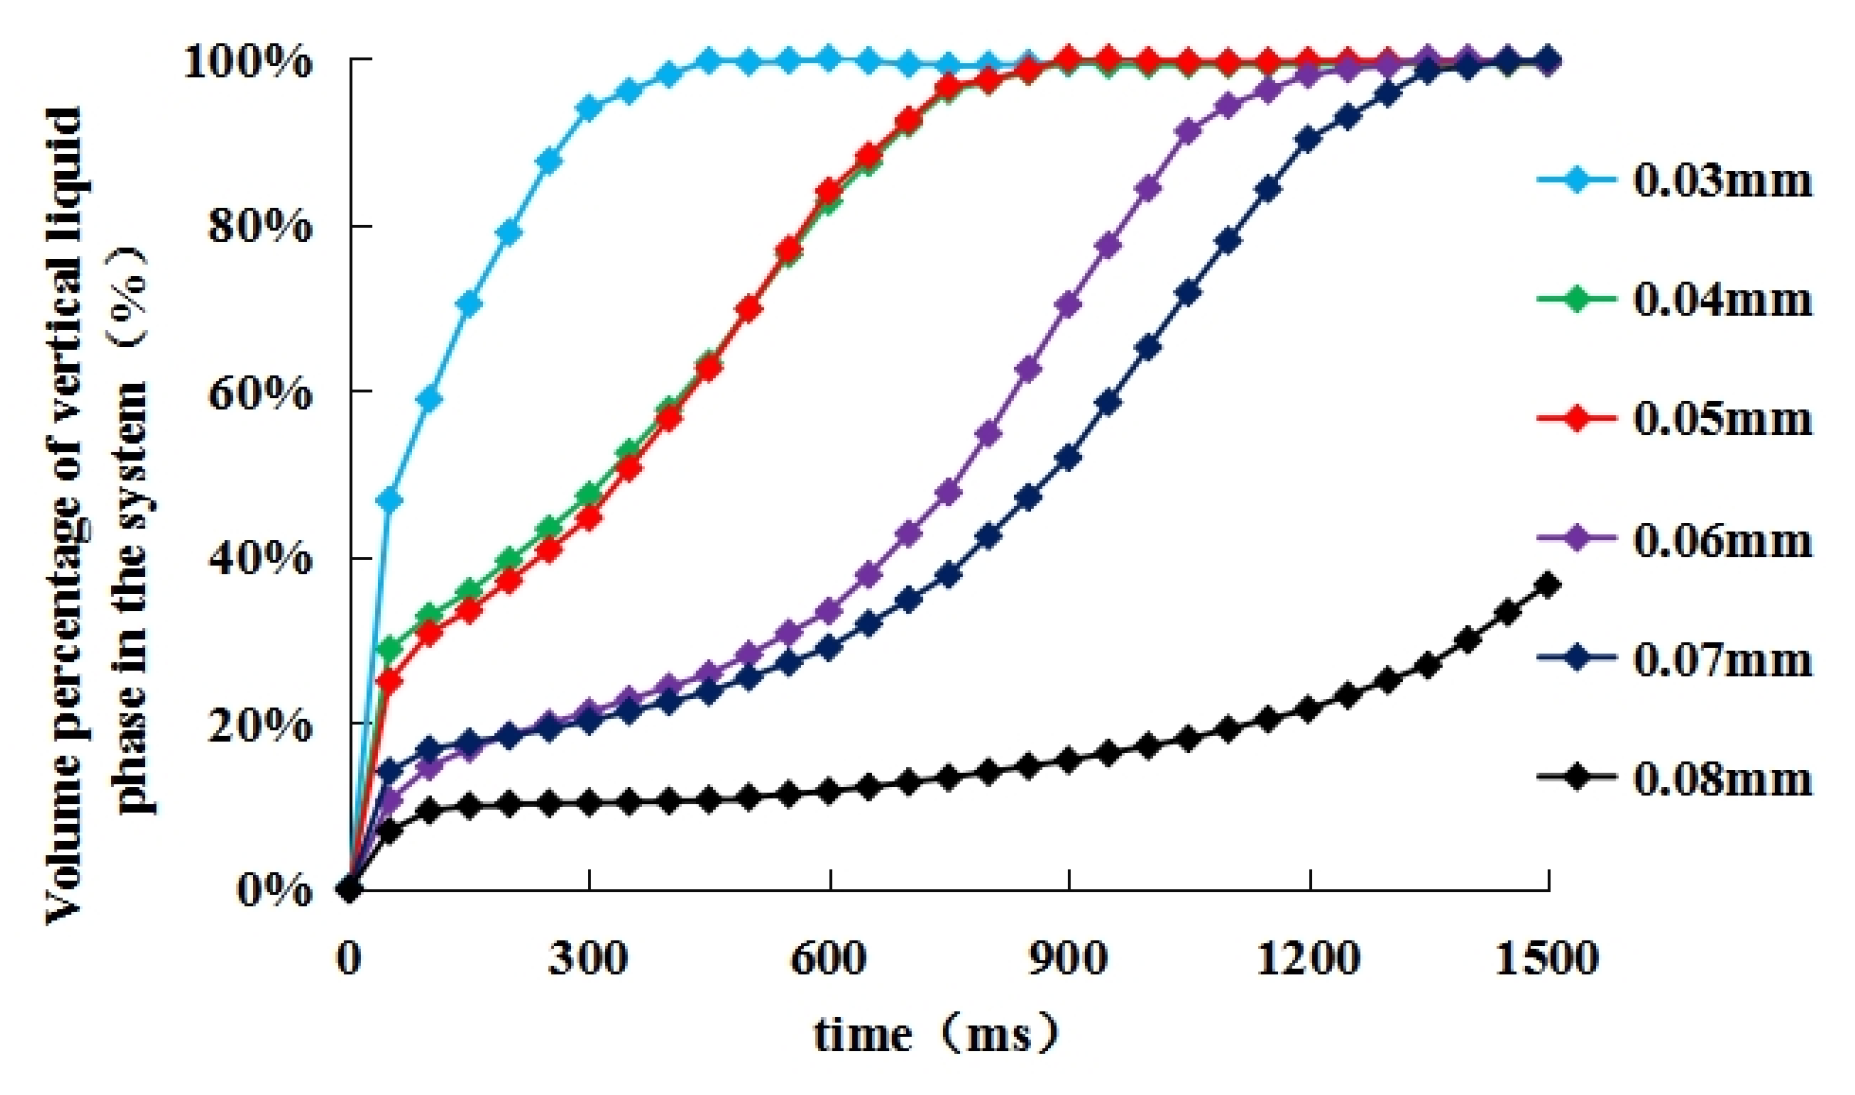
3.2. Effects of Droplet Size and Distance between Two Droplets on the Efficiency of Oil Droplet Coalescence

The sizes of oil droplets in emulsions formed under different shear rates, shear strengths, and emulsifier types were also quite different. The volume fraction of the oil phase at the midpoint in the coalescence of the two oil droplets at different droplet sizes was calculated, as shown in Figure 5.
It can be seen from Figure 5 that there was no obvious relationship between oil droplet sizes and coalescence times under different experimental conditions. However, this does not mean that the droplet sizes had no effect on the coalescence time. This is because the relationship between the suction potential energy and its radius between the two oil droplets was complex [22,23], and because of the combined effect of the attraction potential energy and the repulsive potential energy under different distances between the center of the two oil droplets.
According to the DLVO theory [24], the total potential energy between oil droplets was numerically equal to the sum of the van der Waals potential energy and the potential energy of the electric double layer (Equation (6)). The positive direction of Y-axis represented the repulsive potential energy between particles, the negative direction of Y-axis represented the attraction potential energy between particles, and the X-axis represented particle distance, as shown in Figure 6.
V = V R + V A
where V is the total potential energy; VA is the attraction potential energy; VR is the repulsive potential energy.
It can be seen from the potential energy curve in Figure 6 that the slope of the repulsive potential energy curve was relatively low. When the distance between two oil droplets was large, the repulsive potential energy tended to be zero. When the distance between oil droplets was gradually shortened, the repulsion potential energy increased with a decrease in the distance, and finally became infinitely close to a certain value. The slope of the curve was low when the distance between the two oil droplets was far, and the attraction potential energy was close to 0 when the distance was far enough. However, the slope of the curve gradually increased as the two oil droplets gradually approached. When the distance between the two oil droplets approached zero, the attraction potential energy approached infinity. By analyzing the curve, it can be seen that when the two oil droplets were slowly approaching each other from a long distance, the attraction between the two oil droplets first occurred. When the two oil droplets reached the second minimum (point A) in the process of gradually approaching, the repulsion potential energy between oil droplets played a leading role. Then, when the two oil droplets gradually approached the maximum peak (point B), the attraction potential regained the dominant position and gradually reached the first minimum (point C). The position of the second minimum was related to the surface potential, particle size, and symmetry characteristic of the oil droplets. However, in the process of the two oil droplets approaching each other, the second minimum may not appear. The total potential energy was equal to the sum of repulsion and suction potential energy, where the highest point VMAX was the value of net repulsion potential energy between particles, known as the ‘potential barrier’. When the two colloidal particles were close to each other, they could only continue to close by crossing this ‘potential barrier’; thus, the attraction potential between the two oil droplets needed to be dominant. This explains why the distance between two oil droplets and the coalescence time showed a linear function on the whole, but when the distance between oil droplets was within a certain range, the fluid velocity significantly fluctuated.
On the basis of the original model, only the distance between the two oil droplets in the model changed, and other basic parameters remained unchanged. The coalescence of two oil droplets was simulated, as shown in Figure 7.
It can be seen from Figure 7 that the smaller the distance between the two droplets, the steeper the volume fraction versus time curve, indicating that the shorter the distance between the droplets, the less time required for coalescence. When the distance between the two oil droplets was 0.08 mm, the curve was very flat relative to the other smaller distances, and the volume fraction of the oil phase at the vertical position reached the peak at 1600 ms, but at this moment two oil droplets failed to appear the phenomenon of coalescence. At 300 ms, when the distance between the two oil droplets was 0.03 mm, the volume fraction of oil phase at the vertical line basically reached the peak, and the coalescence of two oil droplets was on the point of completion. This shows that the smaller the initial distance between the two oil droplets, the shorter the time required for coalescence. When the distance between the two droplets was 0.8 mm, the coalescence did not occur due to the large distance.

3.3. Micro-Motion Characteristics of Oil Film Position Molecules during the Coalescence of Oil Droplet

According to the molecular model established in Section 2.1.2, the movement process of multi-carbon and water molecules at different oil film positions during the coalescence of oil droplet was simulated, as shown in Figure 8.
It can be seen from Figure 8a that at the initial time, the molecules in the position of oil film were relatively stable, and there was a clear boundary between the oil film and the water phase. With an increase in the simulation time, the whole system was gradually confused, and the boundary between the oil film and the water phase was gradually blurred. After marking the oil film, it was found that the oil film was pulled, the oil film in the middle moved towards each other, and the oil film on the upper and lower sides moved outward. In other words, during the coalescence of oil droplets, the oil film fluctuated violently, which could affect the original stable emulsion system, and then cause the oil film to break.
The motion trend of molecules is expressed by a mean square displacement. The larger the linear coefficient of the mean square displacement, the stronger the free motion ability of the molecule at this position. It can be seen from Figure 8b,c that the molecular free motion ability of the oil film on both sides was stronger, so it has the trend of outward extension. At the same time, the relative motion occurred between the molecules in the middle position, the oil films contacted with each other (Figure 8d), and finally the coalescence was completed. It is shown that the coalescence ability between oil droplets was not only reflected in the outward diffusion ability of oil droplets at both sides, but also in the relative motion ability of oil droplets at the middle position. Taking into account the uncertainty of the movement of oil droplets on both sides, and the similarity of the free movement ability of oil droplets at the same temperature and pressure. In order to better study the influence of the movement of molecules in the position of oil film on the coalescence of oil droplets, the density distribution of oil phase molecules in the middle position was calculated. The effects of different crude oil components and different surfactants on the coalescence of oil droplets were studied using the density distribution characteristics of oil droplets. The density distribution of oil film molecules with different carbon chain lengths was simulated, as shown in Figure 9.
It can be seen from Figure 9 that the oil film on both sides was relatively stable and kept in a higher density range, while the molecular density of the oil film in the middle position was lower. This shows that the molecules on both sides were mainly crude oil molecules, and the low-density molecular segments in the middle position were mainly water molecules. With an increase in the carbon chain length of oil film molecules, a longer the space length of intermediate water molecules increased the stability in the emulsion system.
The density distribution of oil film molecules under different molecular structures of chain-like saturated hydrocarbon, chain-like carbon–carbon double bonds, chain-like carbon–carbon triple bonds, and cyclane structures was further simulated, as shown in Figure 10.
It can be seen from Figure 10 that under the condition of the same number of carbon atoms, a more complex molecular structure of carbon chain can increase the space occupied by water molecules between oil films. This means that a more complex molecular structure of crude oil in the emulsion system can increase the strength of liquid film between oil droplets as well as the stability in the emulsion system. Among the following four crude oil molecules with the same number of carbon atoms, chain-like saturated hydrocarbons were the most stable, followed by chain-like carbon–carbon double bonds in component crude oil. Crude oils containing chain-like carbon–carbon triple bonds were the third most stable. Cyclanes were the least stable.
In order to further analyze the influence of crude oil components on the stability of emulsion, according to the experimental method in Section 2.2.2, the group components of simulated oil with different components were measured, as shown in Table 3.
It can be seen from Table 3 that the contents of saturated hydrocarbons, aromatic hydrocarbons, resins, and asphaltenes in the simulated oil changed with the different proportions of crude oil and separated oil (separated oil in this paper refers to kerosene and white oil, which are separated from crude oil and contain more saturated hydrocarbon) in the simulated oil. The content of saturated hydrocarbons was the highest, followed by the content of aromatic hydrocarbons, and resin and asphaltene content was the least. Fingas and Neto et al. [25,26] believed that the content of asphaltene in crude oil can affect the formation of emulsion. When the content of asphaltene was higher, the emulsion was easier to form in the fluid produced from oil wells. Resin and aromatic hydrocarbons in crude oil could avoid emulsion formation by dissolving and dispersing asphaltenes. In order to verify this statement, the emulsion stability of different simulated oil samples was measured according to the method in Section 2.2.3, as shown in Figure 11.
The emulsion in fluid produced by oil wells was mainly conducted by the water-in-oil emulsion system, and the oil phase volume was difficult to judge. Therefore, a change in the water phase volume in the figure could represent the difference in emulsion stability. Thus, the more stable the emulsion was, the less volume of the water phase was.
It can be seen from Figure 11 that there were large differences in the stability of emulsions in simulated oil samples with different saturated hydrocarbon contents. Compared with Table 3, the emulsion stability decreased with an increase in the saturated hydrocarbon content in the range of 100–150 s. This is because the carbon chain length of saturated hydrocarbon was relatively short, and the free movement ability of crude oil molecules was strong. However, there was also a certain difference in the volume of the water phase at the initial time and the end time of the experiment. With an increase in the saturated hydrocarbon content, the volume of water phase in the emulsion at the initial time gradually increased, and the volume of water phase in the emulsion at the termination time also gradually increased. This indicates that the composition of crude oil not only affected the stability of oil–water emulsion, but also affected the emulsifying ability of the emulsion. The stability and emulsifying ability of emulsions with different aromatic hydrocarbon, resin, and asphaltene contents were further measured, as shown in Figure 12.
It can be seen from Figure 12A that with an increase in the aromatic hydrocarbon content in simulated oil, there was no obvious change trend of water phase volume at the initial time, while at the end of the experiment, the volume of water phase showed a slight increase trend. This indicates that the aromatic hydrocarbon content had certain influence on the emulsification stability of crude oil: the higher the content of aromatic hydrocarbons, the worse the emulsifying stability. It can be seen from Figure 12B that a change in the asphaltene content could lead to a reduction in the water volume at the initial and final moments compared with a change in the resin content. It shows that an increase in the asphaltene content was an important reason for the enhancement of the emulsifying ability and stability in the emulsion system.

4. Conclusions

(1)
In the coalescence of oil droplets, the fluid velocity at the vertical position between the two emulsified oil droplets showed a gradually increasing trend. The fluid velocity at the position where two oil droplets were close to each other was relatively higher than other positions, and a relative movement trend was generated at the same time. Finally, the coalescence was completed at the position of the maximum fluid velocity. When the coalescence was completed, the fluid velocity in the system decreased gradually and finally reached a stable state.
(2)
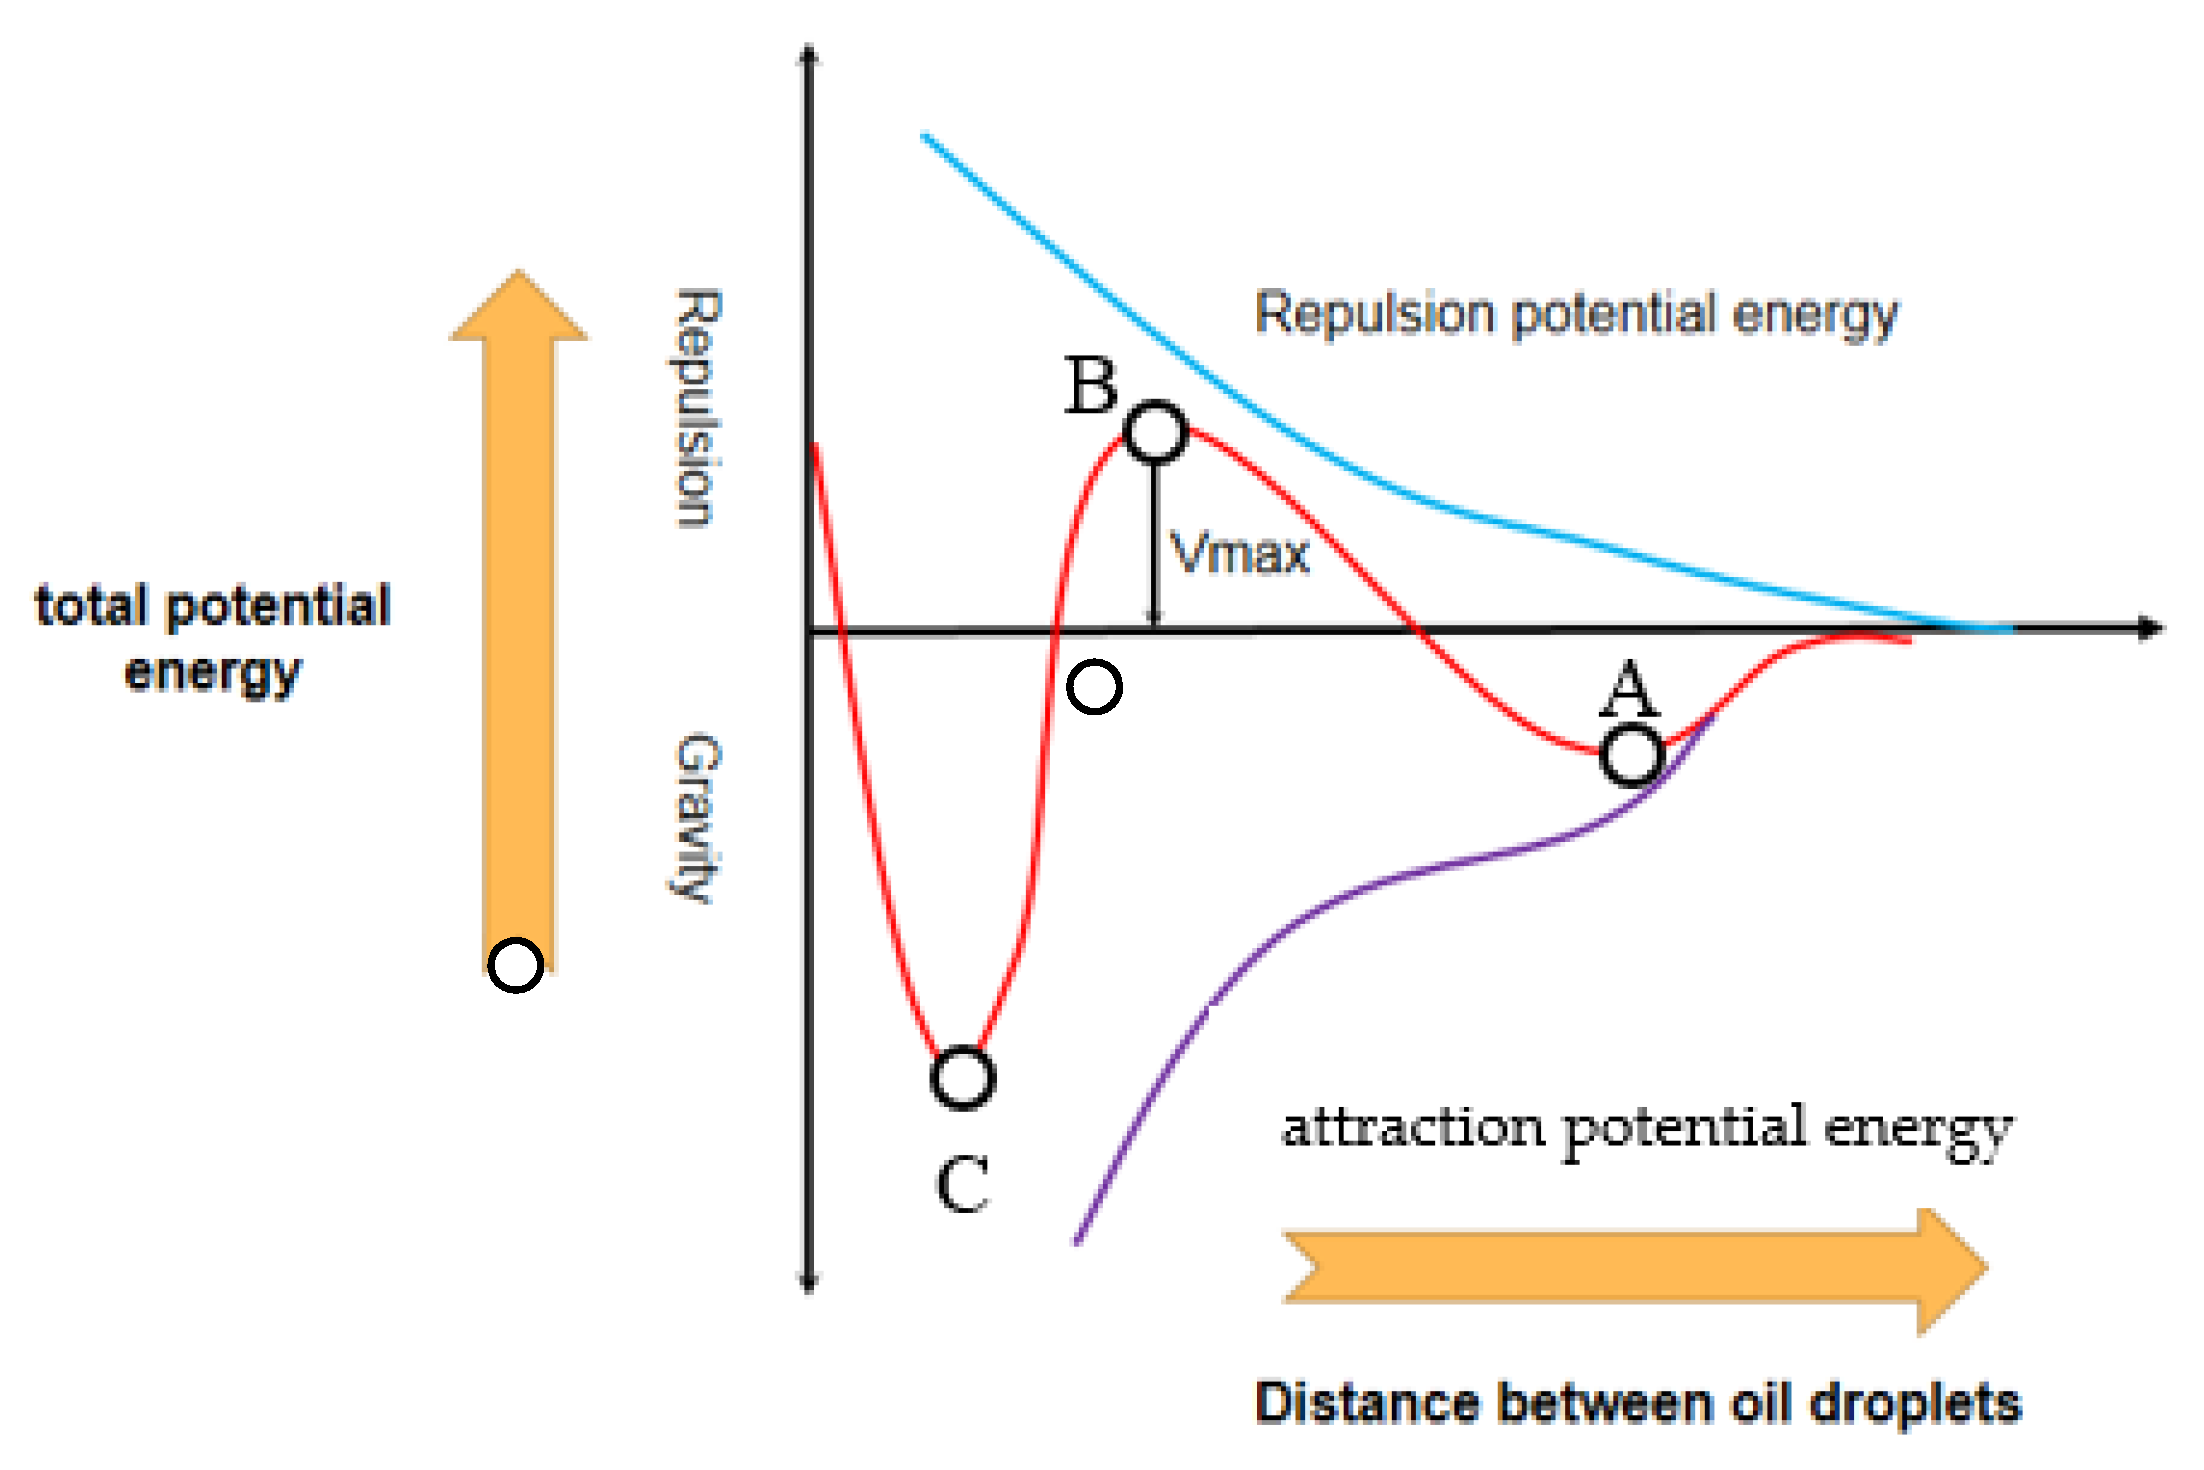
There was no obvious correspondence between different oil droplet sizes and coalescence time due to the combined effect of the attraction potential energy and the repulsive potential energy under different distance between the center of the two oil droplets. However, this does not mean the droplet size had no effect on the coalescence time. When the radius of two oil droplets was same, the two oil droplets moved towards the middle at the same time and gathered together at the vertical position to form a new large oil droplet. When the radius of the two oil droplets was different, the coalescence of two droplets did not occur at the middle position between the two oil droplets. It was obvious that there was a significant migration from the relatively small oil droplets to the larger ones. The coalescence of the two oil droplets could be seen as large oil droplets attracted small oil droplets to move towards themselves, so as to coalescence into larger oil droplets.
(3)
At the initial time, the molecules in the position of oil film were relatively stable, and there was a clear boundary between the oil film and the water phase. During the coalescence of oil droplets, the oil film pulled, oil film in the middle moved towards each other, and the oil film on the upper and lower sides moved outwards, and the boundary between the oil film and the water phase was gradually blurred. With an increase in the carbon chain length of oil droplets, the emulsion system was more stable.
(4)
Under the condition of the same number of carbon atoms, a more complex molecular structure of carbon chain increased the space occupied by water molecules between the oil films. This means that a more complex molecular structure of crude oil in the emulsion system increased the strength of the liquid film between oil droplets, and increased the stability in the emulsion system. Among the following four crude oil molecules with the same number of carbon atoms, chain-like saturated hydrocarbons were the most stable, followed by chain-like carbon–carbon double bonds in component crude oil. Crude oils containing chain-like carbon–carbon triple bonds were the third most stable. Cyclanes were the least stable. An increase in the asphaltene content was an important reason for the enhancement of emulsifying ability and stability in the emulsion system.

Author Contributions

Writing—original draft preparation: B.H. and X.N.; conceptualization: B.H. and X.N.; methodology: C.F.; formal analysis: X.N. and W.L.; investigation: C.F. and S.W.; writing—review and editing: X.N., W.G. and L.Z.; supervision: B.H. and C.F.; funding acquisition: B.H. All authors have read and agreed to the published version of the manuscript.

Funding

This research was funded by National Natural Science Foundation of China grant number 51974088.

Institutional Review Board Statement

Not applicable.

Informed Consent Statement

Not applicable.

Data Availability Statement

Not applicable.

Acknowledgments

This research was conducted at the Key Laboratory of Enhanced Oil and Gas Recovery of Ministry of Education at Northeast Petroleum University (Daqing, China).

Conflicts of Interest

The authors declare no conflict of interest.

References

  1. Bai, Y.; Cao, G.; Nan, X.; Li, S.; An, H.; Wang, X.; Wang, Z. Effect of sodium fluosilicate particles in acidification flowback fluid on emulsification stability of crude oil. J. Pet. Sci. Eng. 2021, 202, 108484. [Google Scholar] [CrossRef]
  2. Khurana, E.; DeVane, R.H.; Kohlmeyer, A.; Klein, M.L. Probing peptide nanotube self-assembly at a liquid−liquid interface with coarse-grained molecular dynamics. Nano Lett. 2008, 8, 3626–3630. [Google Scholar] [CrossRef] [PubMed] [Green Version]
  3. Aarts, D.G.; Lekkerkerker, H.N.; Guo, H.; Wegdam, G.H.; Bonn, D. Hydrodynamics of droplet coalescence. Phys. Rev. Lett. 2005, 95, 164503. [Google Scholar] [CrossRef]
  4. Chen, D.; Cardinaels, R.; Moldenaers, P. Effect of confinement on droplet coalescence in shear flow. Langmuir 2009, 25, 12885–12893. [Google Scholar] [CrossRef] [PubMed]
  5. Rayhani, M.; Simjoo, M.; Chahardowli, M. Effect of water chemistry on the stability of water-in-crude oil emulsion: Role of aqueous ions and underlying mechanisms. J. Pet. Sci. Eng. 2022, 211, 110123. [Google Scholar] [CrossRef]
  6. Shardt, O.; Derksen, J.J.; Mitra, S.K. Simulations of droplet coalescence in simple shear flow. Langmuir 2013, 29, 6201–6212. [Google Scholar] [CrossRef]
  7. Zhao, L.; Torlapati, J.; Boufadel, M.C.; King, T.; Robinson, B.; Lee, K. VDROP: A comprehensive model for droplet formation of oils and gases in liquids—Incorporation of the interfacial tension and droplet viscosity. Chem. Eng. J. 2014, 253, 93–106. [Google Scholar] [CrossRef]
  8. Angardi, V.; Ettehadi, A.; Yücel, Ö. Critical review of emulsion stability and characterization techniques in oil processing. J. Energy Resour. Technol. 2021, 144, 040801. [Google Scholar] [CrossRef]
  9. Pope, K.; Duan, X. Droplet Coalescence in Liquid/Liquid Separation. J. Fluids Eng. 2020, 142, 111402. [Google Scholar]
  10. Cui, H.; Cao, G.; Zhu, S.; Mu, J.; Chou, X. Study on the preparation and formation factors of frother emulsion. Colloids Surf. A Physicochem. Eng. Asp. 2022, 636, 128155. [Google Scholar] [CrossRef]
  11. Laben, A.B.; Kayiem, H.H.A.; Alameen, M.A.; Khan, J.A.; Belhaj, A.F.; Elraies, K.A. Experimental study on the performance of emulsions produced during ASP flooding. J. Pet. Explor. Prod. Technol. 2021, 179, 841–854. [Google Scholar] [CrossRef]
  12. Kizling, J.; Kronberg, B. On the formation of concentrated stable w/o emulsions. Adv. Colloid Interface Sci. 2001, 89–90, 395–399. [Google Scholar] [CrossRef]
  13. Zhapbasbayev, U.K.; Kudaibergenov, S.E.; Mankhanova, A.E.; Sadykov, R.M. Experimental study of alkaline-surfactant-polymer compositions for ASP-flooding of cores from highly viscous oil reservoirs. Thermophys. Aeromech. 2018, 25, 909–916. [Google Scholar] [CrossRef]
  14. Kirkpatrick, R.; Lockett, M. The influence of approach velocity on bubble coalescence. Chem. Eng. Sci. 1974, 29, 2363–2373. [Google Scholar] [CrossRef]
  15. Bai, Y.; Cao, G.; An, H.; Zhang, H. Generation laws and distribution characteristics of carbon dioxide hydrate in a reaction kettle. Exp. Therm. Fluid Sci. 2020, 116, 110125. [Google Scholar] [CrossRef]
  16. Xu, B.; Kang, W.; Wang, X.; Meng, L. Influence of Water Content and Temperature on Stability of W/O Crude Oil Emulsion. Pet. Sci. Technol. 2013, 31, 1099–1108. [Google Scholar] [CrossRef]
  17. Huang, B.; Nan, X.; Fu, C.; Guo, T. Study of the bubble collapse mechanism and its influencing factors on stability under ultra-low surface tension. Colloids Surf. A Physicochem. Eng. Asp. 2021, 618, 126440. [Google Scholar] [CrossRef]
  18. Gao, S.; Chen, S.; Pu, H.; Gong, L.; Ma, S.; Luo, Q.; Wang, X.; Gao, A.; Zhang, B. Fine characterization of large composite channel sandbody architecture and its control on remaining oil distribution: A case study of alkaline—surfactant—polymer (ASP) flooding test area in Xingshugang oilfield, China. J. Pet. Sci. Eng. 2019, 175, 363–374. [Google Scholar] [CrossRef]
  19. An, H.; Cao, G.; Bai, Y.; Wang, D.; Meng, F. Study on the stability of emulsion based on molecular dynamics. J. Dispers. Sci. Technol. 2021, 42, 1723–1732. [Google Scholar] [CrossRef]
  20. Wang, J.; Huang, Y.; Zhou, F.; Song, Z.; Liang, X. Study on reservoir damage during acidizing for high-temperature and ultra-deep tight sandstone. J. Pet. Sci. Eng. 2020, 191, 107231. [Google Scholar] [CrossRef]
  21. Zhang, Z.; Cao, G.; Zuo, J.; Bai, Y. Rheological properties and plugging behavior of active crude oil. Pet. Sci. Technol. 2020, 38, 131–145. [Google Scholar] [CrossRef]
  22. Kong, X.; Wang, J.; Liang, Z.; Zhang, L.; Zhao, J. Design, Synthesis and Characterization of Bitumen Emulsifiers Based on Molecular Simulation. Kem. Ind. Časopis Kemičara Kem. Inženjera Hrvat. 2019, 68, 1–6. [Google Scholar] [CrossRef]
  23. Cao, G.; Cheng, Q.; Liu, Y.; Bu, R.; Zhang, N.; Wang, P. Influencing Factors of Surfactant Stripping Crude Oil and Spontaneous Imbibition Mechanism of Surfactants in a Tight Reservoir. ACS Omega 2022, 7, 19010–19020. [Google Scholar] [CrossRef]
  24. Boyle, E.J.; Scriven, L.; Davis, H.T. The generalized van der Waals theory applied to the electrical double layer. J. Chem. Phys. 1987, 86, 2309–2318. [Google Scholar] [CrossRef]
  25. Fingas, M.; Fieldhouse, B. Studies on crude oil and petroleum product emulsions: Water resolution and rheology. Colloids Surf. A Physicochem. Eng. Asp. 2009, 333, 67–81. [Google Scholar] [CrossRef]
  26. Neto, D.M.C.; Sad, C.M.S.; Silva, M.; Santos, F.D.; Pereira, L.B.; Corona, R.R.B.; Silva, S.R.C.; Bassane, J.F.P.; Castro, E.V.R.; Filgueiras, P.R.; et al. Rheological study of the behavior of water-in-oil emulsions of heavy oils. J. Pet. Sci. Eng. 2019, 173, 1323–1331. [Google Scholar] [CrossRef]
Figure 1. Molecular dynamics model of oil film between oil droplets during coalescence.
Energies 15 04274 g001
Figure 2. Change in the volume fraction of the oil phase in the system during oil droplet coalescence.
Energies 15 04274 g002
Figure 3. The movement trend of liquid flow in oil droplet during coalescence. (a) Schematic diagram of coalescence of oil drops of the same size. (b) Schematic diagram of coalescence of oil drops with different sizes. (c) Microscopic observation results of oil droplet coalescence with different sizes.
Energies 15 04274 g003
Figure 4. The variation of fluid velocity with time at a vertical position in the system. (a) Variation of velocity field in oil droplet coalescence system. (b) Velocity variation of vertical centerline of oil droplet coalescence system. (c) Velocity variation at the midpoint of the system during oil droplet coalescence.
Energies 15 04274 g004
Figure 5. Saturation change in the central line during the coalescence of two oil droplets. (A) Saturation change in the central line during the coalescence of two oil droplets of the same size. (B) Saturation change in the central line during the coalescence of two oil droplets of the different sizes.
Energies 15 04274 g005
Figure 6. Curves of gravitation, repulsion, and total potential energy.
Energies 15 04274 g006
Figure 7. The volume fraction of oil phase at the vertical position of two oil droplets at different distances.
Energies 15 04274 g007
Figure 8. Free motion process of molecules at oil film positions at different moments. (a) Deformation of liquid film molecules during coalescence of oil droplets. (b) Movement trend of middle and side molecules. (c) Root mean square displacement of intermediate and bilateral molecules. (d) Density distribution of oil molecules in the system.
Energies 15 04274 g008
Figure 9. Density distribution of oil film molecules with different carbon chain lengths. (A) C1H4 crude oil molecular density distribution. (B) C2H6 crude oil molecular density distribution. (C) C3H8 crude oil molecular density distribution. (D) C4H10 crude oil molecular density distribution. (E) C5H12 crude oil molecular density distribution.
Energies 15 04274 g009
Figure 10. Density distribution of oil film molecules with different molecular structures. (A) Molecular density distribution of C7H14 crude oil containing chain-like C-C double bonds. (B) Molecular density distribution of C7H14 crude oil containing cyclane. (C) Molecular density distribution of C7H16 crude oil containing chain-like saturated hydrocarbon. (D) Molecular density distribution of C7H12 crude oil containing chain-like C-C triple bond.
Energies 15 04274 g010
Figure 11. Variation of the volume of water phase in the emulsion system with time under different saturated hydrocarbon contents.
Energies 15 04274 g011
Figure 12. Influence of unsaturated hydrocarbon on emulsifying effect of crude oil. (A) The effect of aromatic hydrocarbon content on emulsifying effect. (B) Influence of colloid and asphaltene on the emulsifying effect.
Energies 15 04274 g012
Table 1. The physical and geometric parameters of oil droplet aggregation and simulation.
NumberProjectParameterNumberProjectParameter
1Oil drop radius0.08–0.14 mm7Oil droplet spacing0.03–0.08 mm
2Oil drop density0.8 × 103 kg/m38Oil phase temperature293.15–353.15 K
3Water phase density103 kg/m39Water phase temperature358.15–453.15 K
4Interfacial tension7 × 10−2 mN/m10System size1 mm × 1 mm
5Oil phase viscosity1–1000 mPa·s11Simulation time1500 ms
6Water phase viscosity0.5–500 mPa·s12Time Step1 ms
Table 2. Volume ratio of different types of oil phase in simulated oil.
Sample NumberKeroseneWhite OilCrude Oil from Liaohe OilfieldCrude Oil from Daqing OilfieldCrude Oil from Xinjiang Oilfield
1#11010
2#21010
3#31010
4#41010
5#12010
6#13010
7#14010
8#11100
9#11001
Table 3. Group components of different components in simulated oil.
Sample NumberSaturated Hydrocarbon (%)Aromatic Hydrocarbon (%)Resin (%)Asphaltene (%)
1#53.125.88.612.5
2#68.816.76.28.3
3#74.214.35.46.1
4#78.412.73.85.1
5#58.427.16.18.4
6#58.729.95.26.2
7#5932.23.75.1
8#44.726.48.720.2
9#49.627.815.86.8
Publisher’s Note: MDPI stays neutral with regard to jurisdictional claims in published maps and institutional affiliations.

