1. Introduction
The transport sector in Europe accounts for 24% of the total pollutant emissions into the atmosphere. Of these, 72% are from road transport, and this ratio grows to 95% if only the domestic transport within each country is considered [
1]. In contrast with emissions from the rail and domestic navigation sectors, which have seen their emissions continuously drop since 1990, the emissions from road, aviation, and international maritime transport have risen in the same period [
1]. Therefore, as a means to contain the rise in transport greenhouse gas (GHG) emissions, in 2019, the European Commission agreed on the “European Green Deal” to achieve net-zero emissions of GHG by 2050, with a special focus on the reduction of 90% of transport GHG emissions, since this is a major polluter in the European context [
2].
The World Health Organization (WHO) estimates that nine in every ten people breathe very polluted air, which results in the death of more than 7 million people annually, in addition to reduced lung growth and function in children and schematic heart disease and strokes in adults [
3,
4]. In Europe, air pollution is considered the biggest environmental risk, and induces degradation in people’s quality of life and the premature death of about 400,000 people [
5].
In order to reduce and eradicate the harm caused by air pollution, the “European Strategy for Low-Emission Mobility” was launched in 2016 to outline the main actions to decarbonize the transport sector. Among others, the measures include increasing the efficiency of transport systems, accelerating the development of low-carbon energy for transport, and introducing zero-emission vehicles [
6]. This change in the transport sector includes the role of cities and local authorities in the implementation of the strategy. This strategy includes the effort to modernize the public transport vehicle fleet with low- and zero-emission vehicles [
7], the local use of renewable energy sources, and the implementation of other policies and incentives to improve the attractiveness and usage of public transport in society.
The urgency for transport modernization and its role in sustainable development was also stated in the context of the implementation of the Sustainable Development Goals (SDGs) by the United Nations [
8]. This document focuses on seventeen sustainable development goals that are a basis for actions by the State Members. The document includes sustainable transport as an important component of the measures to be taken to achieve a healthy living environment and sustainable development in cities, in addition to the promotion of healthy lives and well-being for people of all ages, along with the possibility to make cities more inclusive, safe, and resilient.
According to Olabi et al. [
9], the SDGs can be used as a strategy to implement pollution control measures, which can decrease the emission of GHGs to the atmosphere. These measures include information and communication technology, public transport, renewable energy, and disaster risk reduction [
10]. Regarding the public transport sector, the electrification of the bus fleet can be considered one of the pollution prevention strategies, along with the modernization of the electricity production [
11].
In the sense of achieving carbon neutrality in the public transport sector, electrification has emerged as a leading option for decarbonizing surface transportation [
12,
13,
14]. Currently, the leading commercial options are battery electric vehicles (BEVs) and hydrogen fuel-cell vehicles (HFCVs) [
15]. For BEVs, the propulsion is exclusively provided by an electric motor, using electricity stored in an onboard battery that is charged through dedicated charging equipment. By comparison, in HFCVs, propulsion is exclusively provided by an electric motor, using electricity generated onboard by a fuel cell powered by compressed hydrogen (H
2) and using oxygen from the atmosphere. As in the case of BEVs, this type of vehicle has no pollutant emissions, and only generate steam.
The transition to electric buses would be valuable to decrease the emissions from the transport sector, as electrification can help to reduce local air pollution caused by buses in the inner city [
16]. The environmental benefits of bus electrification also show positive advantages when compared to diesel buses or compressed natural gas buses [
17]. However, the positive impact caused by the electrification of buses will only be maximized if the transport network is efficient, accessible, and of sufficient quality. Such an approach will contribute to attracting customers, pushing citizens from individual transport, and pulling them to the public transport network [
18].
From this perspective, this paper aims to situate the issue of decarbonization of the urban public road transport sector within the scope of the theme of combating climate change and reducing atmospheric pollution. It also aims to develop a bus scrapping and replacement scenario, based on maximum age and zero-emission engine criteria, and the investment required for the replacements in the Portuguese scenario. Therefore, the scientific hypothesis proposed by this article is: taking into account the current standards of bus production, would it be possible and feasible to decarbonize the bus fleet in urban centers by 2050? Furthermore, would this transition to decarbonization be economically viable for local governments?
2. Characterization of the Urban Bus Fleet in Portugal
2.1. Bus Fleet Size
The characterization of the bus fleet in Portugal uses data from 2020 for all registered vehicles as at 31 December 2020, which were provided by the Portuguese Institute of Mobility and Transport (IMT). As a criterion for urban service, buses with standing seats were considered in three size categories: minibus, standard, and articulated. Four types of fueling were considered: diesel, gas/CNG, battery electric vehicles (BEVs), and fuel-cell vehicles. The database contained 14,390 buses of all types; of these, a total of 5633 buses met the urban bus criteria.
Regarding the bus capacity, the three main categories of buses in Portugal that were considered are: (i) minibuses (capacity of 20 to 50 passengers), (ii) standard buses (capacity of 50 to 105 passengers), and (iii) articulated buses (capacity higher than 105 passengers); this categorization is aligned with the literature [
19].
In the Portuguese urban bus fleet (5633 buses), the average age of the buses is around 15.9 years. More than 85% of the buses are standard, around 10% are minibuses, and around 5% are articulated. The data on the number of urban buses in each category, their respective average age, and the type of fuel for each category can be seen in
Table 1.
Considering the age of the bus fleet, most of the vehicles are between 15 and 16 years of age, although a slight change can be seen in the last five years regarding the acquisition of low-pollutant buses. The acquisition numbers indicate that almost 10% of the buses bought in the last five years are electrically powered, and more than 40% are fueled by gas/CNG. This shows a shift in the fuel consumed by buses in Portugal; however, most of the fleet is still fueled by diesel—mainly buses that are around ten to twenty-six years of age. Considering this age range of the bus fleet, 94% of the buses are fueled by diesel, almost 6% are fueled by CNG, and less than 1% are powered by electrical batteries.
The data presented above correlate with the age of the bus fleet in Europe and, more specifically, the Portuguese reality over the years. In 2011, almost 60% of the bus fleet in Portugal was 10 years or older, whereas, in countries such as Austria, the Netherlands, the United Kingdom, Germany, Romania, Belgium, Slovenia, and Spain, less than 40% of the fleet is older than 10 years [
20]. In 2022, the average age of the bus fleet in the European Union was 12.8 years, which reveals that Portugal still needs to work on decreasing the bus fleet age when it is above the EU average. In addition, other countries, such as Austria (bus fleet with average age of 4.9 years), France (8.1 years), the Netherlands (9.3 years), and Spain (11.4 years), are more advanced in terms of a renovated bus fleet that is more environmentally friendly [
21].
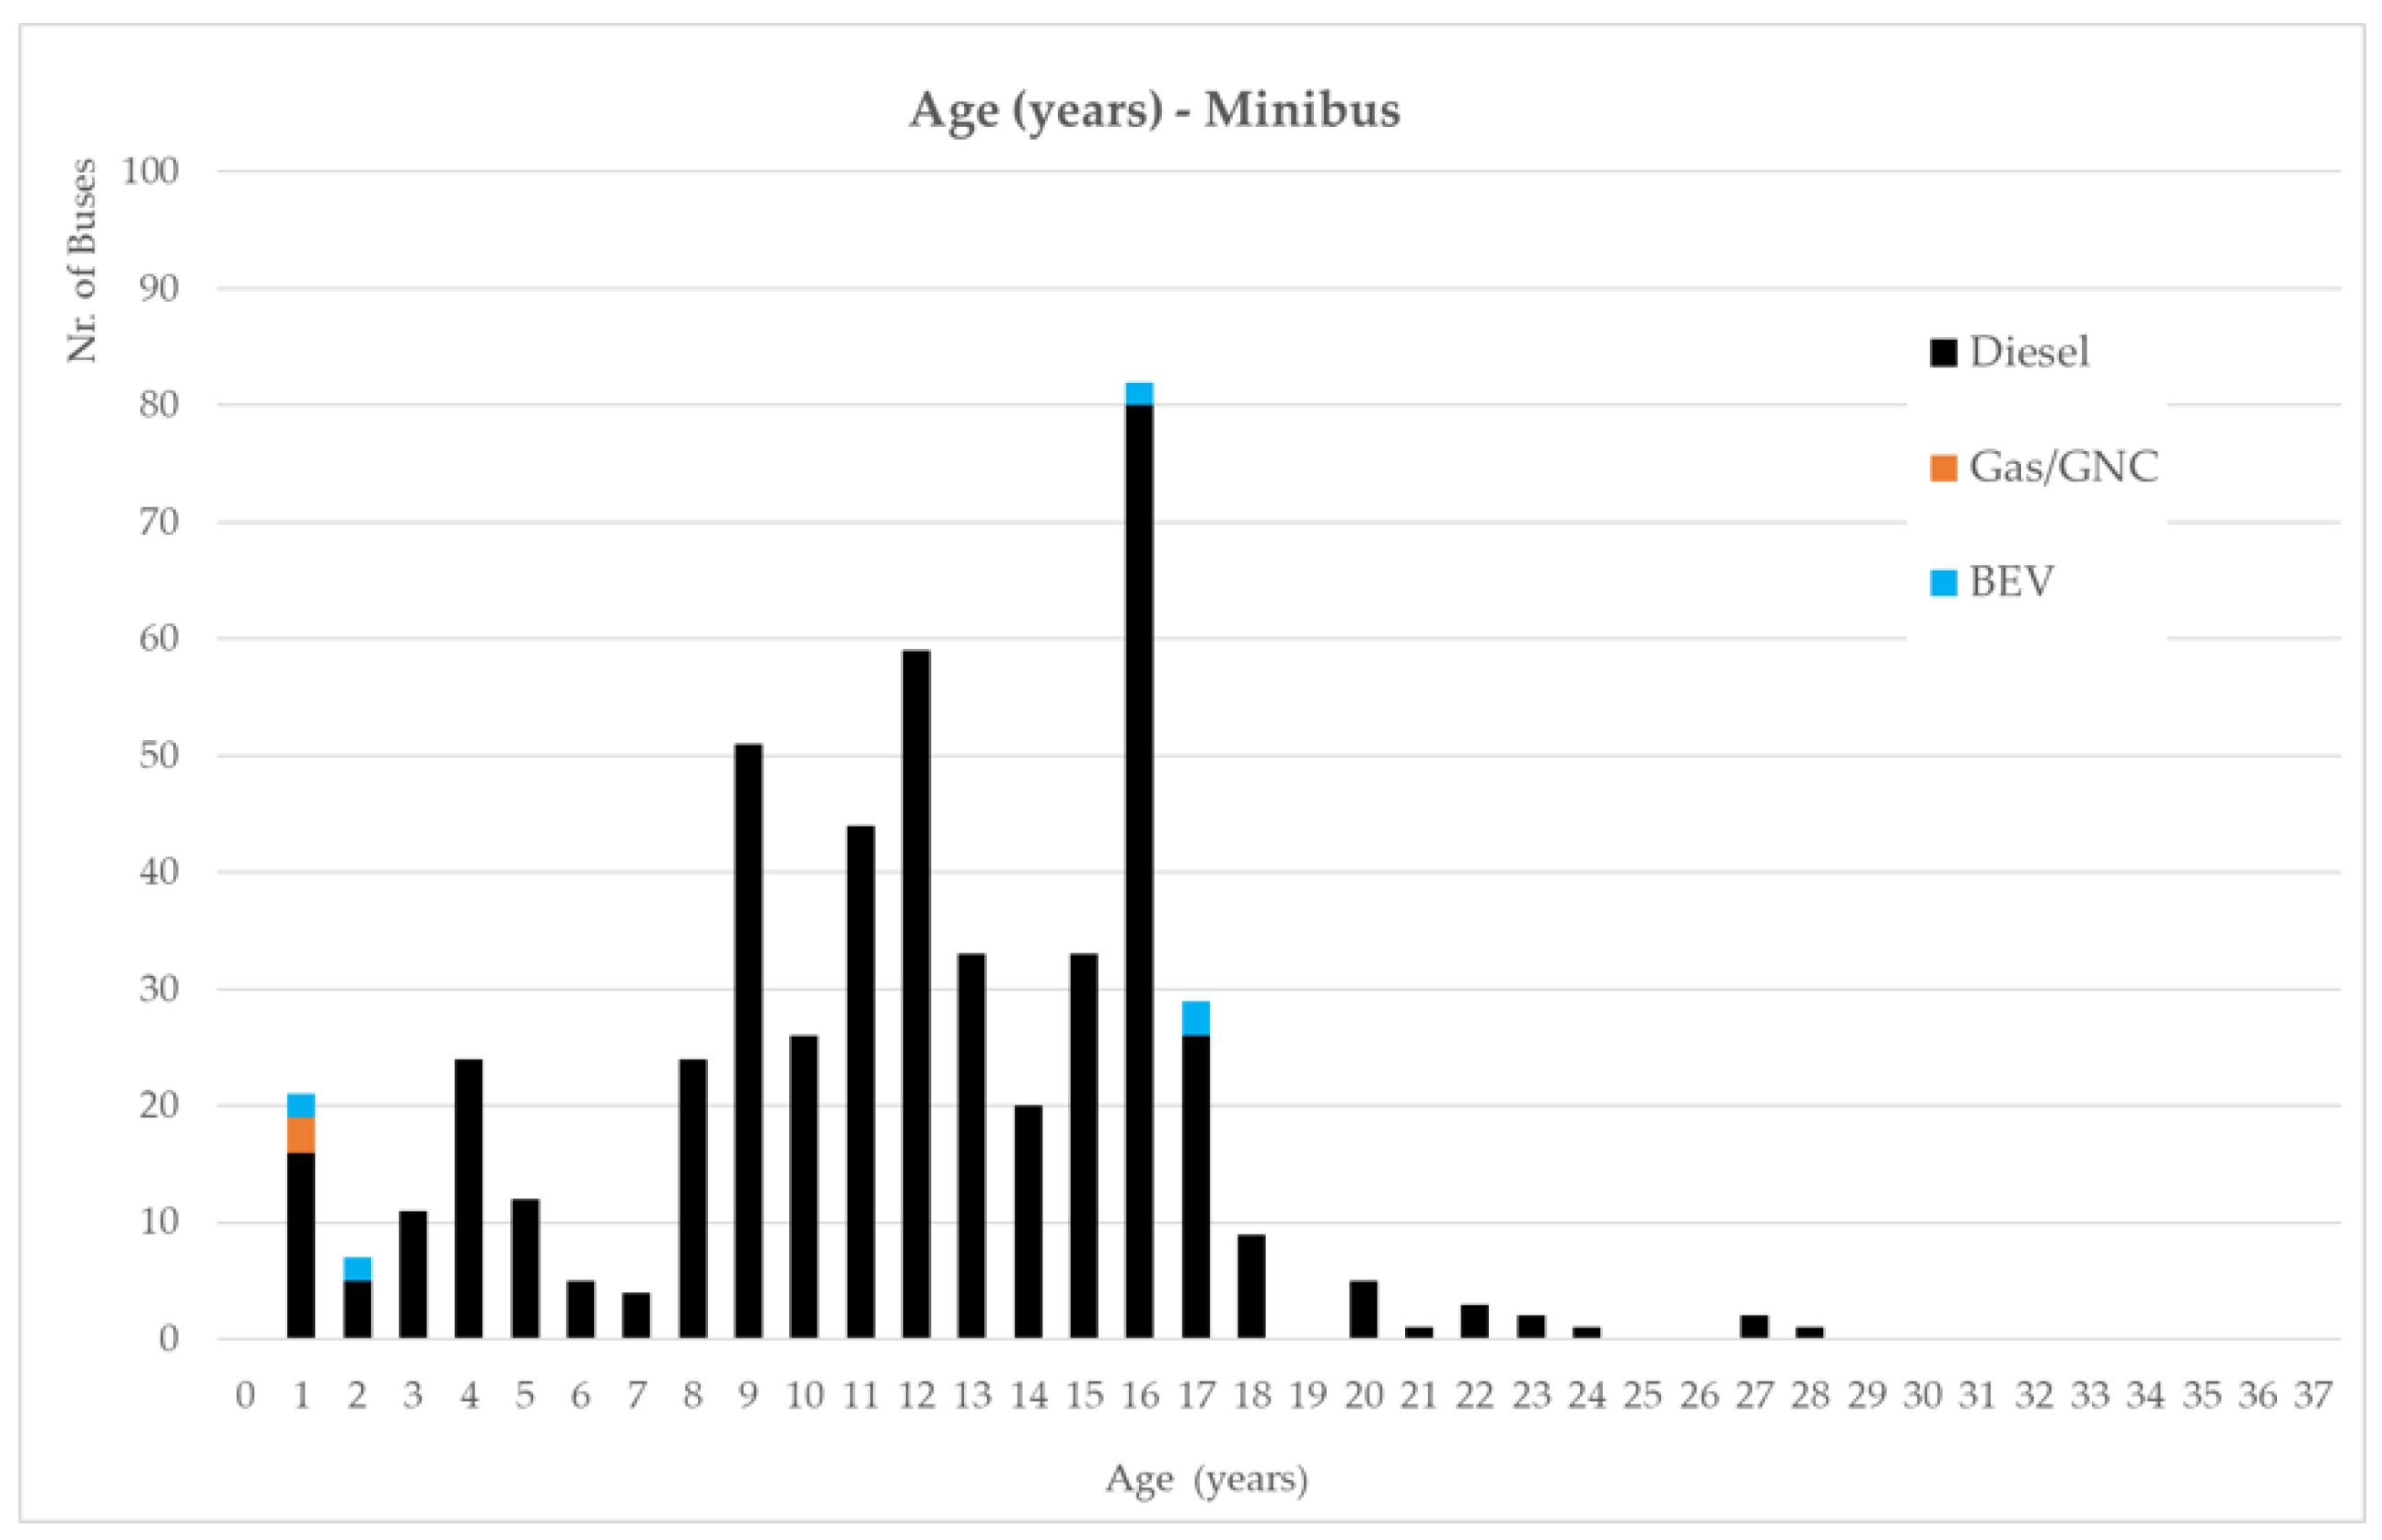
When the age distribution is examined considering the different types of buses (e.g., minibus, standard, and articulated), it is possible to see that the minibus fleet is relatively new, compared to other types of buses, and that the introduction of CNG and electric buses is almost nonexistent (
Figure 1). The biggest change in the bus fleet throughout the years can be seen in the standard bus fleet, for which the last three years represented a considerable shift to more sustainable fuel options. Standard buses aged fewer than three years are mostly CNG fueled, and the number of electric buses is also considerable (
Figure 2). By comparison, almost the entire fleet of articulated buses comprises diesel-fueled engines, CNG represents only 9% of the entire fleet, and electric buses are nonexistent. This is explained by the small and very recent offer of this type of vehicle by bus manufacturers, due to the size of the buses, which makes it difficult to power them by an electric battery (
Figure 3).
According to
Table 2, it is possible to conclude that the distribution is relatively homogeneous and similar between the three types of buses, and it is also possible to observe that the average age of minibuses is about 4 years less than that of standard and articulated buses. In addition, the age range is approximately 30 years, with the maximum age being 35 years for standard buses. From the analysis of the quartiles, it can be seen that more than 75% of minibuses, standard, and articulated buses are over 9, 12, and 10 years old, respectively; that is, close to an age at which they should be replaced (
Section 3.1).
From the data presented in the above figures and table, it is possible to infer that most of the urban bus fleet used in Portugal consists of old standards for pollutant emissions that include CO2, PM10, and NOx, which are considered harmful to the health of the people who live in cities. Thus, the next section presents the differences between emission standards and where the bus fleet in Portugal is positioned.
2.2. Bus Emission Classification
Emissions from road vehicles have been controlled by European legislation since the 1970s, which has led vehicle manufacturers to continuously improve their engine technologies and introduce various emission-control systems [
22]. Thus, modern vehicles have emission levels for regulated pollutants (e.g., CO, NO
x), which are more than an order of magnitude lower than those of vehicles entering service two decades ago [
22].
The European regulation that addresses pollutant emissions from vehicle engines is a concrete commitment to the decrease in air pollution across Europe. The benefits of these European emission standards extend far beyond the borders of the European Union since most of the G20 members and several emerging economies in Asia and Latin America set standards based on the European-devised system [
23]. However, the advancement in technologies and the shift in the bus fleet for more sustainable engines do not happen evenly on all continents.
The buses considered for purchase in the European Union follow the emission protocols set by the European standards since 1988, when Euro 0 was created, with the last update in 2014 with the advent of Euro VI. The specific European standard for emissions from buses and heavy-duty vehicles can be seen in
Table 3.
Considering that other countries take measures to shift their bus fleet into more sustainable options, Portugal has tried to accommodate more buses from Euro IV, V, and VI in its fleet to achieve sustainability goals.
Table 4 and
Figure 4 show the number and percentage of buses by each emission category.
It is possible to conclude that most of the urban bus fleet in Portugal is still fueled by diesel and is within the Euro III emission range, followed by Euro II, when considering the standard buses, which comprise the majority of the bus fleet in the country. The distribution of the Portuguese bus fleet over the Euro emission standards is not very different from the general scenario in Europe, as 28% of all buses rely on Euro III standards, 25% on Euro V, and 18% on Euro II [
25]. This information reveals the urgency for a shift in the bus fleet technology to more efficient and sustainable options, and to both less polluting (e.g., Euro V and VI buses) and fully electric buses, not only in Portugal, but in Europe as a whole.
In Cologne, for example, since 2007, only electric engine vehicle (EEV) buses have been acquired, and, in 2015, the city of Amsterdam regulated that all buses should at least conform to the EEV norm. In other cities, such as Brussels, Oslo, Hamburg, and Stockholm, regulations were implemented after 2015 that stipulated buses operating with renewable fuels will be prioritized to replace the old bus fleet [
20].
3. Method for the Replacement of the Bus Fleet According to the Vehicle Age
Given that most of Portugal’s bus fleet is composed of old buses that are included in the pollution range of Euro III and Euro II, it is important that strategies of fleet replacement are implemented, so that public transport can become more sustainable and resilient. Thus, in this section of the paper, the criteria for the bus fleet replacement in Portugal are presented in order to stimulate the sustainability of the urban public transport sector with the total substitution of diesel-fueled buses for electric vehicles, so Portugal can achieve the goals for the reduction in GHG emissions in the transport sector. Thus, a trajectory of replacement is defined to ensure the complete decarbonization of the urban bus fleet, which will have a maximum age of fourteen years.
3.1. Criteria of Replacement
Starting from 2021, all urban buses will be replaced when they reach a predetermined age. As of 2021, buses older than 21 years will be replaced, and, in 2022, buses older than 20 years will be replaced. In the following years, the rule stays the same, which will allow all buses fueled by fossil fuels to be replaced by BEVs and HFCVs by 2028 (
Table 5). However, for articulated vehicles, due to their size and weight, it is considered that an electric battery is not the most suitable option, due to increasing operating costs from the weight of the batteries required for this type of bus [
26]. Nonetheless, the market is now starting to develop articulated buses fueled by hydrogen. Thus, it is considered that the replacement only should start in 2024, in order to provide more time for the industry to prepare and respond to the market needs.
Thus, for minibuses, all fossil-fueled and electric vehicles will be replaced by BEVs. Articulated vehicles fueled by fossil fuels will be replaced by HFCVs, and standard urban buses will be replaced by both BEVs and HFCVs, following the percentages presented in
Table 6.
It is important to mention that the replacement of the bus fleet presented in this research work is a proposition by the authors, which was delineated by the collection of data on the usage of electric buses and the bus fleet replacement programs adopted by the European Union. According to research conducted by the authors with electric bus manufacturers, electric buses need to have their batteries replaced every seven years, at almost the cost of a new bus, although the replacement of these vehicles every seven years would generate a huge amount of waste because the other parts of the buses would not be reused. Thus, the methodology of replacement considers a 14-year life for electric buses, considering one battery replacement in year seven, in order to reduce the environmental footprint caused by the replacement of entire buses every seven years.
The replacement of minibuses for electric engine buses is already a reality in some countries and cities. In Nottingham, for example, minibuses that transport children with reduced mobility are electric, which also provides benefits in terms of the clean air the children are exposed to when riding the buses [
27]; in addition, the city plans to convert its fleet of 467 minibuses to improve air quality [
28]. In Portugal, the plan is to convert the entire minibus, standard, and articulated urban bus fleet to an electric-powered engine fleet by 2034, as explained in the next section.
4. Trajectory of the Urban Bus Fleet Replacement in Portugal
In Portugal, more than EUR 50.9 million will be invested in the next few years to acquire electric buses for cities such as Lisbon, Porto, Guimarães, Braga, Coimbra, Aveiro, and Faro. The move to an electric bus fleet in these towns will result in a reduction of 8271 tons of CO
2 emissions to the atmosphere [
29]. Moreover, as part of the strategy to develop the country in the coming years, which is called “Portugal 2030”, the government has the target to reduce the greenhouse gas emissions of the transport sector by 40% by 2030 [
30]; to help achieve this goal, EUR 509 million will be invested to promote the decarbonization of the public transport sector [
31].
According to this study, in Portugal, the total replacement of the urban bus fleet is expected to be concluded in 2034, which represents a fourteen-year timeframe toward a zero-emission bus fleet for public transport in all Portuguese cities.
This section explains, in detail, the yearly replacement rate that needs to be achieved by each type of bus (e.g., minibus, standard bus, and articulated buses), and the costs associated with this change to achieve a green bus public transport in Portugal.
The replacement proposal for the minibus fleet can be seen in
Table 7 and
Figure 5. It is important to mention that, in this work, the number of buses remains constant over time, and does not take into consideration the possible increase in public transport demand in the country, which is in line with the 2021 Census [
32].
As it is possible to observe from
Table 6 and
Figure 6, minibuses will be replaced in a fourteen-year timetable. This period will be crucial to enable a regulated shift from fossil fuels to sustainable modes. It is important to mention that, in this period, even the BEVs will be replaced with newer vehicles in some years, for example, in 2023, 2021, and 2033, to maintain the age of the minibus fleet under fourteen years.
Next, the timeframe for the replacement of standard buses is presented in
Table 8 and
Figure 6.
The time frame of fourteen years is also used for the replacement of standard buses in Portugal. In this case, it is possible to see that both BEVs and HFCVs are used instead of fossil-fueled buses; however, electric batteries are still preferred when replacing the fleet, as they will represent more than 85% of the bus fleet in 2034. It is also important to refer to the new fleet of BEVs and HFCVs throughout the timeframe because, in 2026, 2030, 2032, 2033, and 2034, old BEVs will be replaced with new ones to ensure the age of the fleet remains under fourteen years of age.
For the articulated buses, the only option for replacement is the hydrogen fuel cell (HFCV). As the market is still not ready to offer a regular number of this type of bus, the replacements are planned to occur only by 2024.
Table 9 and
Figure 7 present the expected shift for the articulated fleet throughout the years until 2034, when it is expected that all articulated buses will be environmentally friendly.
It is possible to conclude that the rate of replacement of articulated buses is increased only in 2024, although, by this year, both the minibus and standard bus fleets will have started their shift to sustainable engines. In contrast to the other bus types, which undergo a replacement of the electric bus fleet in some years, the articulated buses will remain almost the same from 2027 until 2034, because the existing articulated buses were acquired over a concentrated period of 5 years; therefore, they do not reach the replacement age of fourteen years.
4.1. Trajectory of the Average Age of the Bus Fleet
As expected, the average age of the bus fleet in Portugal will vary over time due to the constant replacement of vehicles with decarbonized buses. It is expected that the average age of the fleet will decrease by more than ten years from 2024 until 2028; after this, the expected average age will remain around seven to nine years. In 2019, the average age of the bus fleet in Europe was 11.7 years [
33], which indicates that the Portuguese fleet is somewhat older than the European fleet. However, with investments in urban bus replacements in the coming years, this reality can change, as shown in
Table 10.
The average age of the urban bus fleet is expected to drop for all types of buses, although this decrease for articulated buses will only be felt from 2024 when the vehicles start to be replaced. The year 2027 will represent the lowest average age for all types of buses; in this year, the articulated vehicles will have the lowest average age compared to minibuses and standard buses. After 2027, the average age of the entire fleet will start to increase continuously; however, the average age will no longer reach the levels seen in the first years of replacement (e.g., 15.9 years of age in 2020). This will contribute to maintaining the engines at a good level of fitness to ensure sustainable transport for the population can continue to be supplied.
4.2. Trajectory of Investments for the Replacement of the Bus Fleet
Among the main challenges for introducing clean buses in a municipality is the purchase price of the vehicles, because the most advanced technologies can be very expensive, which can cause a rise in the price of public transport [
34]. However, in some cases, special funding from local, national, or European authorities is available. For example, Belgium which obtained EUR 80m from regional government grants to renew its bus fleet with green options, and Germany was granted EUR 650m from the German Ministry of Transport and Digital Infrastructures to acquire electric or hybrid buses [
35].
In Portugal, a major part of the National Investment Program is focused on the transport sector and mobility, and represents financial support for the acquisition of more sustainable public transport, including electric buses [
36].
Within the scope of this work, the cost of the presented replacement of the bus fleet focuses on the price of the three different types of buses (i.e., minibus, standard bus, and articulated bus). This was provided by Portuguese bus operators, taking into account their recent bus acquisitions (
Table 11), to be purchased according to the replacement rate within the timeframe of fourteen years, from 2021 to 2034 (
Table 12).
The costs of the new bus fleet, and achieving sustainable public transport in Portugal, are high. However, the European Union, as a means to decarbonize the transport sector, approved a funding alternative to help Member States to replace their urban fleet with greener options. Battery, fuel-cell, and battery trolleybuses are available for funding, in addition to the infrastructure required and feasibility studies [
37]. Thus, the investments shown here for the Portuguese context may soon be feasible according to the EU vision of zero emissions for the public transport sector.
5. Discussion
In Portugal, the transport sector is responsible for 28% of the total GHG emissions; in 2019, about 17 megatons of CO
2eq resulting from the burning of fossil fuels in vehicle engines were emitted to the atmosphere [
38]. Replacing fossil fuels with electricity in urban public transport can make a very significant contribution to reducing GHG emissions, within the framework of the SDGs and the Portuguese National Energy and Climate Plan 2030 (PNEC 2030) objectives. These frameworks have a goal to reduce the global CO
2 emissions by up to 55% by 2030 [
39], and reduce the CO
2 emissions of the transport sector by 40%. These measures can create a more sustainable and resilient way of living for the population in general.
Regarding the specific problem of old European standard emission buses in Portugal, which have contributed to the rise in pollutant emissions by the public transport sector, Varga et al. [
40] showed that the replacement of highly polluting Euro III diesel buses with electric buses, in the city of Cluj-Napoca, Romania, can considerably reduce CO
2 and other pollutant emissions, thus improving air quality and the population’s health. This could also be the case in Portugal of the methodology of bus fleet replacement was applied.
Certainly, there are some other scenarios that could have been drawn regarding the replacement of the bus fleet in Portugal (e.g., more time for the replacement of old buses, or usage of other fuel options). However, the option presented in this research can easily accomplish the goals and expectations of decarbonization of the transport sector, and within the time-frame needed to decrease the harm caused to the environment by the massive use of fossil fuels used in public transport.
Brdulak et al. [
41] estimate that Portugal will not be able to replace the traditional fleet of diesel buses with Zero Emissions Buses (ZEBs) by 2050. However, this study clearly shows that local governments and public administrations can, if they so wish, implement a program that allows the objective of carbon neutrality to be achieved by 2034. As noted by Konečný et al. [
42], this cannot be achieved without the significant support of public passenger transport, e.g., measures to support bus public transport powered by alternative fuels and the development of mobility using alternative energy sources.
By comparison, some works [
43] indicate that a potential scenario of renewal of bus fleets, involving the replacement of diesel buses by CNG/LNG-powered buses, would allow a progressive reduction in CO
2 emissions at a lower cost, especially in comparison with the replacement by ZEBs.
In this context, the work of Kim et al. [
44], which compares TCO battery electric and hydrogen fuel cell buses, shows that the replacement of diesel buses by ZEBs will be possible and competitive within 10 years (2020–2030). It is also anticipated that the bus body cost and fuel cost parameters will dominate TCO in 2030, in contrast to the battery costs, which dominated TCO in 2020. Study of the increase in demand and the consequent increase in the number of buses needed would be a direction for further research.
6. Conclusions
As of 31 December 2020, there were 5633 urban buses in Portugal, of which 509 were minibuses, 4808 standard buses, and 316 articulated buses. The average age of the fleet was 15.9 years, with 23% of the fleet over 21 years old. In the urban bus fleet (as of 2020), 91% of the vehicles are powered by diesel, 8% by natural gas, and 1% by electricity. Among fossil-powered vehicles, 39% meet Euro IV or later standards, whereas 61% meet Euro III or earlier standards.
In this work, a broader approach was proposed, consisting of a replacement program for the urban bus fleet for the entire country that meets the following criteria: complete decarbonization of the fleet by 2034; maximum vehicle age of fourteen years; replacement of diesel and gas vehicles with electric vehicles; and introduction of hydrogen in articulated buses (100%) and standard buses (50% progressively until 2034). In the proposed method of replacement for the urban bus fleet, more effective and faster decarbonization would be achieved, since the average age of the vehicles would decrease from 15.9 years (2020) to a minimum of 4.3 years (2026), and reach 9.9 years in 2034. In the replacement of the fleet of 5633 vehicles, 4675 (83%) would be battery electric (BEV) and 958 (17%) would be hydrogen electric (HFCV), with 68% of replacements concentrated in the first five years due to the elimination of vehicles aged greater than 21 years.
The estimated total investment to replace the country’s urban fleet of 5633 buses, to be borne by the transport operators, would be EUR 2592 million over 14 years. Subtracting the normal cost of replacement with other fossil-fuel vehicles, a decarbonization cost of EUR 1323 million is obtained. This would be a feasible investment if financial instruments were provided by the Portuguese authorities as planned (Portuguese Recovery and Resilience Plan (PRR), Portugal 2020, Portugal 2030, and National Budget) in order to support the renewal cost of the urban bus fleet of EUR 770 million, to be available until 2030, and corresponding to 65% of the decarbonization component of the investment required.
It is also important to mention that this work focused only on the investment in the renewal of the bus fleet. However, there are other costs associated with the implementation of BEVs and HFCVs, such as charging stations, and the installation of a public hydrogen supply network for mobility to overcome the current market gap, that must have to be accounted for. Another issue not regarded in the framework of the bus fleet replacement is the possible addition of buses to accommodate a possible increase in public transport demand in the next few years, which may further increase the investment needed for a zero-emission national bus fleet.
In summary, this paper demonstrated the need and possibility to change public transport from a perspective of zero emissions in a European country. This trajectory demands a large amount of work and investment. However, this aim can be achieved with proper planning to provide the necessary financial resources according to the existing different financial supporting instruments that a country can leverage at the national or international levels. Moreover, the method presented here to replace the urban bus fleet with zero-emission vehicles can be replicated in other contexts to aid policymakers and companies to become greener, and to combat climate change and its impacts.


