Review

A Review of Models for Photovoltaic Crack and Hotspot Prediction

by
Georgios Goudelis
1,
Pavlos I. Lazaridis
1 and
Mahmoud Dhimish
2,*
1
Department of Engineering and Technology, University of Huddersfield, Huddersfield HD1 3DH, UK
2
Department of Electronic Engineering, University of York, Heslington, York YO10 5DD, UK
*
Author to whom correspondence should be addressed.
Energies 2022, 15(12), 4303; https://doi.org/10.3390/en15124303
Submission received: 9 January 2022 / Revised: 25 May 2022 / Accepted: 26 May 2022 / Published: 12 June 2022

Abstract

:
The accurate prediction of the performance output of photovoltaic (PV) installations is becoming ever more prominent. Its success can provide a considerable economic benefit, which can be adopted in maintenance, installation, and when calculating levelized cost. However, modelling the long-term performance output of PV modules is quite complex, particularly because multiple factors are involved. This article investigates the available literature relevant to the modelling of PV module performance drop and failure. A particular focus is placed on cracks and hotspots, as these are deemed to be the most influential. Thus, the key aspects affecting the accuracy of performance simulations were identified and the perceived relevant gaps in the literature were outlined. One of the findings demonstrates that microcrack position, orientation, and the severity of a microcrack determines its impact on the PV cell’s performance. Therefore, this aspect needs to be categorized and considered accordingly, for achieving accurate predictions. Additionally, it has been identified that physical modelling of microcracks is currently a considerable challenge that can provide beneficial results if executed appropriately. As a result, suggestions have been made towards achieving this, through the use of methods and software such as XFEM and Griddler.

1. Introduction

With the rising demand of renewable energy sources, the use of solar energy systems is growing rapidly and is becoming ever more important. As a result, the PV community and industry have made considerable efforts to reduce the cost of PV power. This is dependent on the system’s manufacturing cost, its efficiency and lifetime. In this regard, the durability of PV modules is a key aspect for the financial viability of installations that will determine the rate at which the technology is implemented to meet environmental demands. It is therefore also not unexpected that extensive research is being conducted on PV module performance output. This review article summarizes the critical state-of-the-art research relating to the failure and performance drop of PV modules, with an aim to explain the mechanisms and origins of defects in PV modules. This is crucial for being able to predict the performance of PV modules over long periods of time and therefore a particular focus has also been placed on simulations and modelling approaches While the main interest of this paper is to predict how PV modules will behave during operation, understanding their previous life stages is vital in achieving this accurately and as a result, be able to preserve their long-term performance. The goal of this review, more specifically, is to summarize and clarify the simulation methods and approaches that can be used to approximate the occurrence of failures in PV installations. This will ultimately make the use of PV systems more efficient and therefore viable.
This survey commences by outlining the external causes of PV module failures, explaining how they affect physical components and their performance. As a result, an investigation of the types and modes of failure follows, in which microcracks and hotspots are found as the most critical. To better understand these two critical failures, each one is investigated from its roots, recognizing a potential but not clear correlation between the two. Next, the available methods for detecting these failures, mainly microcracks, are discussed, examining which detection methods are suitable for PV installations. This is followed by a detailed outline of the characteristics and classifications of microcracks that provides a more structured approach for predicting failures and their severity. The most impactful and relevant contributions from available literature that focus on the performance of PV installations are reviewed to improve understanding. This will in turn aid in the development of better and more realistic models. For the same reason, the available literature that utilizes PV simulation models, both in terms of methods and conclusions, is critically analyzed. Using this literature review, the possibilities for modelling PV cracks and hotspots are investigated. Finally, plans for mitigating such failures are proposed.

2. Causes of Reduced Performance and PV Failures

Manufacturers give PV good performance guarantees of 20 to 25 years based only on quality certification tests and not based on tests that assess their long-term reliability [1]. Additionally, one of the few studies evaluating the performance of PV modules over a long period of time, resulted in 17.6% of the PV modules failing using a performance warranty of 90% power after ten years and 80% after 25 years [2]. As a result, there is a need for methods that accurately estimate individual PV module performance. However, as they are installed around the world in sites with different environments, it is important to understand all the possible stresses that can be imposed on modules due to the surrounding climate. To determine a PV module’s long-term performance output correctly, the external effects and severity of conditions need to be established for each specific scenario [1].

2.1. Failure Caused by Climate Stress

The PV performance effects caused by such climatic phenomena dramatically depend on the severity of the stress imposed, depending on the specific site location and the time of the year. For example, the following factors are likely to impact the performance of the PV systems:
  • Humidity: Humidity can affect the performance of polymers, which can happen when it enters the PV module, the active layer (semiconductor), and metallic elements like fingers, grids, and connectors. It can also affect the adhesion between polymer layers in combination with heat;
  • Snow and wind: snow can cause heavy static mechanical loads and wind can cause both static and dynamic loads on PV modules;
  • Hail: hail causes impact stress, depending on its size and velocity, and can have a high local impact;
  • High temperature: High temperature can change the polymeric material properties drastically if the glass transition point is reached. When there are temporary high-temperature fluctuations, this can cause thermo-mechanical stress. The thermal stress concentrates at the interfaces between layers, which can result in considerable module failure and degradation rates. This can be seen in the thermal cycling tests performed on PV cells/modules [3,4,5];
  • Air: air with high salt concentrations can cause the corrosion of metallic components and degradation of polymers, especially in areas near the sea;
  • Sand and dust: Both elements combined with wind can be abrasive or, with many dry and wet cycles, result in layer build up on the panels, especially in the Sun Belt area of the continents. Their deposition and accumulation adversely affect the PV panel’s energy yield by either reflecting or absorbing the solar radiation [6]. More particularly, dust, depending on its size and density, causes a reduction in transmittance, resulting in particle shading. Additionally, the difference in temperature between dusted and non-dusted areas causes a reduction in open and short-circuit voltage. A summary of experiments that assess PV power output affected by dust is outlined by [6];
  • Gases: gases of certain types can, alone or in combination with humidity, cause corrosion, particularly in areas near industrial plants or main roads.
Among all the climate stresses that PV modules are facing, temperature and humidity are deemed as the two major ones causing performance degradation [3]. For this reason, there is a lot of research conducting thermal and humidity cycling. Extended thermal cycling tests are the best way to simulate longer term environmental impacts, as deemed by IEC 61215 standards. The application of 500 cycles in the thermal cycling test has been reported to correspond to 20 years of PV module exposure [1]. Additionally, not only can such tests be good for determining service lifetime but can also reveal defects that trace back to incorrect manufacturing process, as has been shown by [5]. They found, for example, that conducting thermal cycling tests with 600 cycles allowed them to detect degradations caused by solder bond failure. In general, these effects on the PV performance have been extensively examined. Furthermore, the relationship between the temperature and the illumination conditions, becomes important as this is generally where PV installations are desirable. It has, for example, been established that lowering the operating temperature of a PV module, will allow for better PV cell performance, especially during high light illumination [7]. As high illumination itself can be the cause of increased operating temperatures, this was found to induce higher cell performance losses. In this case, the main reason for this occurrence is an increased leakage in current and Auger recombination. At this stage, it must be mentioned that UV exposure can also play a significant role in power degradation, especially when it is combined with high temperature. This is not an uncommon scenario, particularly in hot and dry climatic zones. UV radiation aids the generation of acetic acid from the encapsulant material, which leads to the chemical corrosion of finger electrodes. This has been considered by [8] to be the main origin of degradation when PV modules were exposed to UV radiation in a combined acceleration test. However, as the detailed analysis of the climatic stress impacts on PV performance is outside of this paper’s scope, they have not been further explored individually.

2.2. PV Failure Modes

In general, polymers seem to be the weakest point of PV modules. Additionally, silicon (Si) wafer contributes about 40% to the cost of a silicon solar cell [9]. The active semiconductor (Si) is the most important part of a PV module, where both types of mechanical loads can induce or worsen microcracks. This causes cell breakage, which can already be a part of the runaway production process. Cell vibrations, mechanical and thermomechanical stress can cause finger disconnection and can impact modules in various ways [1]. It is therefore important to understand which of the failure modes impact the performance of PV modules and how easily they can be detected. For this reason, all failure modes are outlined in Table 1.
The fact that certified PV modules are sometimes also observed to fail on the field prior to their estimated lifetime proves that IEC standards are not severe enough. Nevertheless, it is still important to consider that 1/3 of new modules fail during testing for certification in the laboratories, allowing for better quality control. Climate chamber tests, hotspot tests, and mechanical load tests are the most severe in the current standards, but a combined testing approach needs to be developed for more robust testing [1]. Additionally, while failure modes found in outdoor and indoor tests are similar, the relation between the two in terms of stress factors and failure modes must be defined more clearly to be able to diagnose PV module lifetimes more accurately.
As indicated in Table 1, many failure modes correlate to each other and should therefore not be considered in isolation. For example, it is very common for breakages and cracks to be followed by corrosion, discoloration, and delamination. Nevertheless, it is clear that the critical failure modes requiring further investigation involve microcracks (shown in Figure 1a) and PV hotspots (shown in Figure 1b), since cell breakage is the result of microcrack propagation, and they all have a high impact on performance. While it might be interesting to also investigate further the other failure modes and their relationships with hotspots and microcracks, this route was opted out to avoid generalizations and drawing fragmentary conclusions. That being said, there is a contradictory amount of evidence to conclude whether pre-existing microcracks partially cause hotspots. However, microcrack initiation is predominantly attributed to stresses generated during the assembly of the PV modules [10]. These then propagate, resulting in cell breakage due to climatic stresses, and therefore, it is vital to investigate the exact causes of microcracks during production [9]. It must also be mentioned that the physical stress generated during transportation [11] and handling [12,13] are also influential sources of microcracks, as well as causes of their propagation. It was found that the loads subjected during transport induce stresses, which are the leading cause of crack growth in solar panels [11]. The typical loading situations during transport involve shocks and vibrations that can break the glass or solar cells [14].

2.3. Root Cause of Microcracks

Starting with the crystalline material block, the first stage in production is wire sawing. The heat involved in the process can cause thermally induced stress, which, together with the sawing forces, can result in the initiation and propagation of microcracks in the material. It has been found that microcracks are usually introduced at the wire sawing stage of blocks [10].
The detection of microcracks during this stage is challenging, since they are hidden in the bulk of the wafer. Other stages that can induce microcracks during production involve firing, soldering, and lamination. During firing and soldering, temperature and time are key parameters, since the processes involve high temperatures causing thermo-mechanical stresses in cells that can lead to crack formations in PV cells [16,17,18]. The lamination process of Si solar cells creates residual stress in the wafers due to the high temperature and pressure [19]. The losses resulting from microcracks can be as high as 5–10% in a typical manufacturing facility [20]. During the last decade, the PV industry is constantly trying to decrease the thickness of silicon cells, making them both more efficient and reducing their manufacturing costs [21]. However, this has increased their susceptibility to thermomechanical damage during handling, processing, and operation [22].

2.4. PV Hotspots

The main reason for the presence of hotspots is the fluctuation of the solar and ambient temperature affecting the PV modules. They are also likely to occur from an increasing amount of shading in the cells [23]. This shading can be caused by bird droppings, leaves and dust patches, which inhibit the cells’ function and block the current generated from other cells. As a result, the cell diode operates in reverse bias mode, thus heating the cell and causing hotspots [6]. Of course, as with microcracks, hotspots can also be caused by other things such as contamination, broken diodes and PIDs [24,25,26], some of which are explained further in Section 3.
Solar cell hotspots are mainly detected using a thermal imaging camera, as we show in our experiment in Figure 2. In this case, we have found that the temperature increased by nearly 13 degrees compared with non-hot-spotted solar cells. However, in different settings, this can increase to be as high as 50 degrees. Additionally, more recently, the measurement of the I–V characteristic and resistance of each string is sometimes measured to verify for any leakage current in the p–n junctions. This occurs when solar cells are partially shadowed.

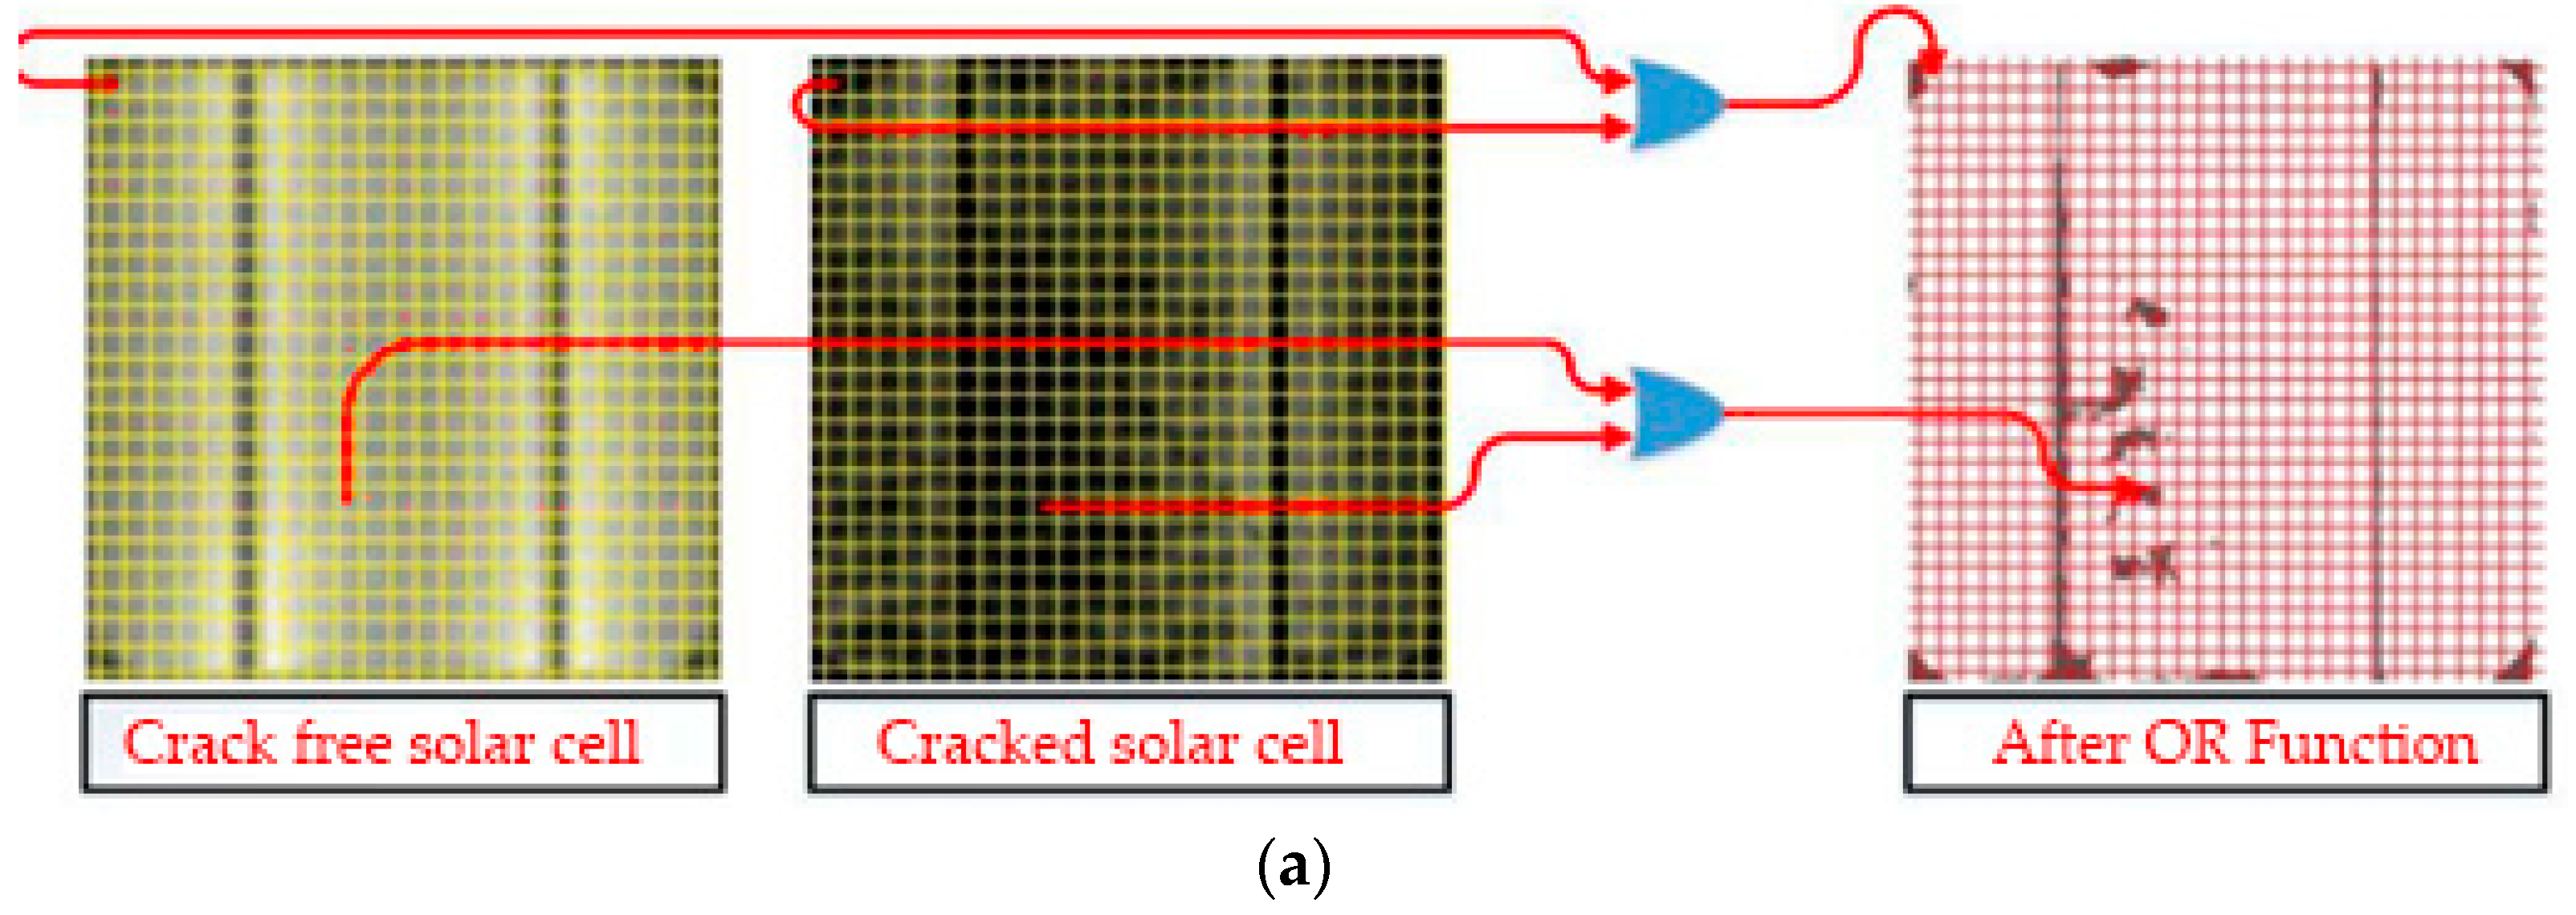
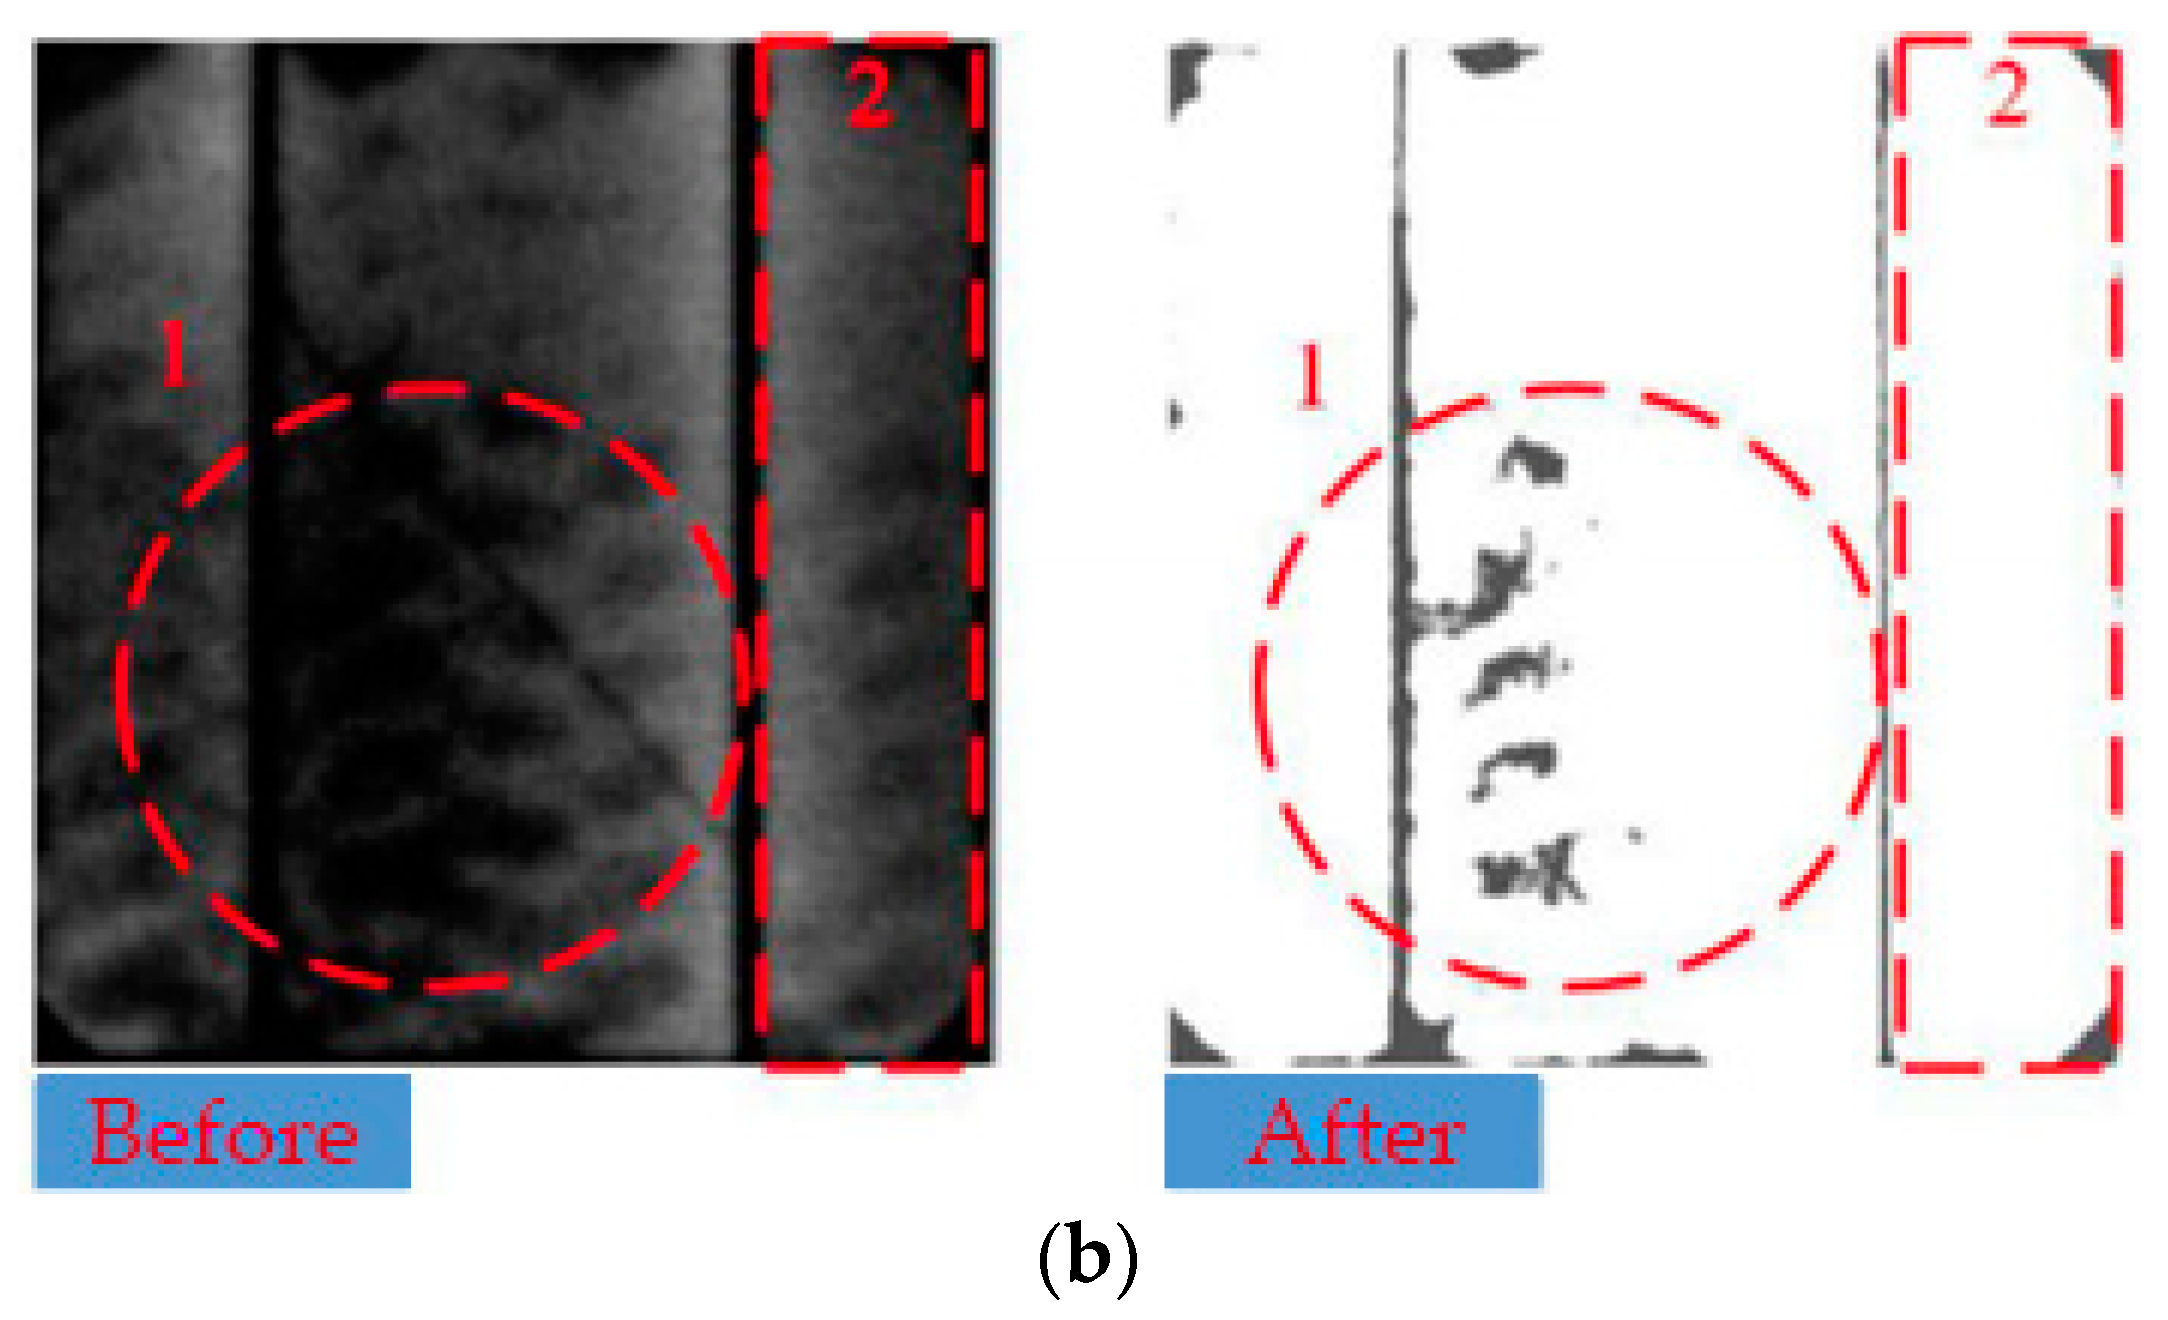
2.5. Detection and Characteristics of PV Microcracks

One of the most crucial but also challenging aspects of microcracks is their detection, as it requires complex technical equipment and expertise. Several methods for this exist, one of which is the ultrasonic resonance vibrations (RUV) technique, which uses a transducer to emit ultrasonic vibrations on the silicon wafer as described in [27,28]. This method is sensitive to crack length and location. However, it does not identify the precise location and is only used to determine whether to accept or reject a wafer. As a result, the Photoluminescence (PL) technique was developed, which solves this issue by employing various illumination patterns allowing for a more accurate detection of microcracks [29]. One PL setup proposed in [30] enables the use of homogeneous and arbitrary illumination to extend the imaging applications for the characterization of silicon wafers and solar cells. Their PL setup proposed in [30] is shown in Figure 3. More recently, PL images have been acquired solely through sun illumination (outdoor testing) by using optical filtering and modulation of PV [31]. The advantage of PL imaging is the fact that it can be implemented during almost any point in the production process [32].
Another technique for detecting microcracks is electroluminescence (EL), whereby inducing an electrical current to the solar cell causes electrons to become excited in the conduction band. This method is advantageous because it can be used on both small size solar cells as well as full scale PV modules [33,34]. Recently, in 2019, we proposed a novel technique [35], which uses EL with a three-stage processing method. The results, as seen in Figure 4, which were validated using various solar cell samples, show that using this technique makes it easier to identify microcrack size, location, and orientation compared with other up-to-date PV detection methods.
In some cases, infra-red (IR) imaging is used for detecting electrical and thermal failures in PV modules. By exposing panels to IR imaging, solar cells with poor performance appear as bright hotspots compared to others due to heat dissipation. By applying light or inducing an external current, the PV panel displays a temperature gradient that aids in analyzing thermal images, indicating areas with potential problems. One of the issues of this detection method is that it is difficult to apply in large-scale farms. An example of this has been given by [36], where conventional hotspot detection methods using IR would take up to 210 days for a 30 MW PV farm because these methods cannot detect faults fast and continuously. That faults are detected continuously is especially important in this case, as it is crucial for predicting defects at an early stage, so that the necessary action can be taken to avoid or minize the impact on performance. As a result, the authors [36] proposed the use of a detection system using a fish eye lens, which can simultaneously monitor 10 rows of PV modules that are 100 m long.
Considering the demand of the industry, there is a need for achieving a certain level of defect detection accuracy as well as methods that are quick and outdoor-compatible that do not disrupt field operations. As a result, camera-based imaging has been gaining a considerable amount of popularity for identifying module defects. One such emergent method involves the fluorescence of the encapsulant excited by ultraviolet light (UVF), which promises rapid cell cracking identification in the field. Fluorescent species develop in the encapsulant as the degradation of the constituent polymer and/or additives occur [37], as shown in Figure 5a. Before the thermal stress is applied, the entire area of the solar cell nearly shows one dotted area corresponds to the actual crack. However, after the stress is applied to the solar cell, the location of the real crack starts to be visible. The EL image was taken to capture the cracks’ precise location, which nearly matches the area shown in the UVF images. There is undergoing research in developing UVF models that can precisely allocate cracks in solar cells. This technique does not require the disconnection of the PV strings whilst doing the experimentation work, making it a favorable testing exercise for PV operators. Another high throughput and low-cost UVF detection system was proposed by [38] that utilizes high-power UV sources and a consumer capture camera allowing for 1000 modules/hour. The inspection method was tested in 11 sites with modules ranging in age from 1 to 20+ year(s) old, while being able to detect many faults and achieving a crack detection accuracy of 91.7%.
Interestingly, the rise of fluorophores has been correlated with long-term encapsulant yellowing [39,40], resulting in differences in UVF contrast along silicon cracks. While UVF is currently less understood compared with EL and PL methods, it possesses various advantages by detecting cell cracks in their chronological order of occurrence and identifying different module bills of materials in the polymer part of the PV modules. By being able to differentiate between old and new cracks, UVF demonstrates its value for insurance claims, but more importantly can be used as the basis of predicting crack growth [38]. This can also be used together with IR thermography to find missing cell cracks, with the only complication being their need for unequal environmental conditions. Alternatively, a combination of UVF with EL can differentiate cell cracks from crystal defects and hotspots [39]. Finally, the combination of IR and EL can also be used instead.
In general, microcracks can be classified either based upon their direction or speed of propagation. A crack that is smaller than 30 μm in width is conventionally referred to as μ-crack (or microcrack) and, therefore, larger ones can be indicated as solar cell cracks [41]. In terms of their position, they can be classified as either facial, occurring on the surface of the wafer, or sub-facial, being under it, even when just partially. It must also be mentioned that microcracks are usually also classified in terms of their orientation as this can have a very different impact on the power output of PV modules. A crack that causes an electrical separation of an important part of the cell can significantly reduce the power output of the module [42]. As a result, by observing Figure 5b, microcrack orientation is commonly defined with respect to busbars as:
  • Diagonal crack (+45°);
  • Diagonal crack (−45°);
  • Parallel to busbars crack (vertical);
  • Perpendicular to busbars crack (horizontal);
  • Multiple directions crack.
Finally, considering the scope of this report, it is also important to cover technologies and methods used for detecting faulty units installed in the fields. To date, the method of detecting faults in installed units required technicians to individually inspect each unit. However, with the rise of drone-based technology, there has been a considerable amount of research proposing the use of thermal-camera-equipped drones for the monitoring of PV installation sites [43,44,45]. While a considerable amount of research on this is based on a technician controlling the drone himself, a new research article has proposed and tested an automatic detection system using drones [46]. This autonomous solution involves drones mounted with both RGB (Red, Green, Blue) and thermal cameras. This method was found to be able to detect and estimate the precise location of defect PV modules among hundreds or even thousands of modules. As shown in Figure 6, the proposed automatic-flight-path planning algorithm removes the need for the manual control of the drones, which was tested with high success on a 1 MW power plant in South Korea.

3. Literature on the Performance Modelling of PV Systems

Before explaining the available literature on simulations concerning PV module failure, it is critical to understand how they perform when implemented through actual experimental data retrieved from solar farms or similar installations. This will serve as a reference point when analyzing and structuring the development of effective models. Consequently, the most recent and relevant studies examining defects in a wide range of implemented PV samples and their findings are outlined below.
In an analysis of 3000 PV installations comprising of Mono-Si, Poly-Si and CdTe, maximum degradation rates were found to be −0.81%/year, −0.94%/year and −1.43%/year, respectively, as shown in Table 2. The study indicates that degradation and performance depend highly on the location of the installation. For example, CdTe installations suffer higher degradation in the south than in the north or middle of the UK due to a higher and more unstable day-to-day temperature as well as higher humidity [47].
Photovoltaic cell degradation rate is a key aspect for financial projections, especially focusing on the long-term performance of modules. As modelling performance of PV systems becomes more advanced, the assumption of degradation rates being linear may not be sufficiently accurate. In a Monte Carlo simulation model conducted by the NREL [48], the effect of the shape of degradation rate curves has been shown to be significant when quantifying the levelized cost of energy. As a result, identifying non-linearities in degradation paths with accuracy has a strong financial incentive and is essential for service lifetime predictions. The most commonly occurring degradation mode is encapsulant discoloration, which can usually be approximated with a linear decline, correlating to short circuit current losses. However, it is possible for modules to display significant non-linear declines that are difficult to detect. This is, for example, seen in the cases of hotspots caused by cracked cells or solder bond failures and corrosion [49]. Generally, degradation percentages are stated to have decreased in installations after the year 2000 and were found more frequent with a wider range of modes occurring in hot and humid climates than desert and moderate climates [47,50]. This can be correlated to delamination and diode/j-box problems that are more common in this type of climate. The most important and challenging cause of degradation in newer installations (Si crystalline) in the last 10 years is due to hotspots followed by internal circuitry discoloration [50].
In one of our studies, we assessed the impact of polycrystalline PV microcracks using 4000 cracked solar cells, where we found the output power loss to be anywhere between 0.9% and 42.8%. The findings also suggest that microcracks are the main cause of hotspots, having analyzed tested cracked panels (cells, busbars, and fingers) using thermal imaging, showing an increase in temperature initiating from the crack locations, depending on the crack size [51]. This is also evident in Figure 7.
As previously mentioned, the microcrack position and orientation significantly influence how it affects a module’s power output. In terms of crack orientations, Grunow et al. found in their research that cracks parallel to and centered between busbars only yielded a power drop of less than 4% [52]. On the other hand, if the cracks were parallel on both sides of both busbars, a power drop of 60% occurred. Similarly, Köntges et al. concluded that, if the crack is parallel to the bus bar, it results in a significant module power output drop. However, it was emphasized that the power output stability of the PV installation is closely related to the total cell area that can become electrically separated due to a crack. Moreover, in one of their studies [46], they showed that artificially induced micro-cracks do not reduce the power generation by more than 2.5%, with the exception when the crack harms the electrical connection between cell fragments. If the microcracks in a solar cell separate apart less than 8% of the cell area, no power loss occurs. These claims are also in line with our recent research, showing that the effects of diagonal and parallel cracks on the PV power performance are only significant when they are present in several cells and a certain amount of area [53].
In general, vertical and multiple orientation microcracks have been deemed by the literature as the most critical types causing significant power output drops [54,55].
Additionally, it has been shown that power drop in PV modules can be identified by dark areas with microcracks in them [56,57]. Cell areas that are darker within an EL image sample indicate that less or no current is passing through them, resulting in lower power generation. However, Ref. [56] clearly displays the further need for research to precisely figure out the relation between microcrack performance and their shape, location, and the number of busbars.
However, a study described in [58] implies that snail trails indicate the presence of microcracks. This study was concluded by testing 31 PV samples that have been in operation since 2012. Their performance was compared to a commercial module of the same technology, displaying that cell cracks can reduce energy production by 29% in some cases. The degree of performance losses was found to be correlated to the amount of cell cracks present, which is in line with our own research in [53]. Finally, while snail trails can indirectly affect the performance of the PV modules, their evolution was found to be very limited by analyzing their long-term behavior, thereby posing no further threat regarding power losses.
Finally, a study that examined annual production data from 100,000 photovoltaic systems, as well as comments relating to their performance, provides an accurate representation of the reliability of current PV systems [59]. It was considered to possess valuable insights, as the analysis consists of a large sample size including performance data of up to 5 years, as well as monthly production data. The conclusion reports that most of the systems performed within 10% of what had been predicted, with a relatively low occurrence of failures. However, in the first few years, considerable hardware issues were found suggesting a need for stricter certificates, training, and standards for installations. In general, the rapid detection of failures and performance impacting issues was found more evident in utility level installations, where issues were taken care of within a few days, as opposed to residential and commercial systems. This implies that the current method of rapid detection is considerably costly, hinting to a need for its improvement.
All stages where a PV module is subjected to stress loads can influence its lifetime performance and these involve production, transport, installation, and operation in the field. For example, the thermo-mechanical stresses induced during manufacturing may initially not affect a PV module’s output. However, as it is subjected to environmental loads in the field, the effect can become quite significant, affecting its reliability [60]. In addition, usually for small-scale PV systems, the leading cause of degradation is the potential-induced degradation (PID). In Figure 8a, we demonstrate the EL image of a solar cell before the PID test and after a 96 h PID test and, as is evident in Figure 8b, the cracks gradually increased, and the mismatching condition (black area) is more evident.
In terms of modelling cracks in PV modules, many aspects are desirable to produce a realistic model. However, to that extent, very little is available in simulations, where no known commercial software can be used to model PV cracks and their effect on the cell’s output power performance. Hence, considering the aim of this review, a more prominent focus has been placed on Finite Element Analysis (FEA) that can simulate the stresses induced during on-site operation. First, the methods of modelling microcracks and cracks caused by climatic, mechanical, and thermomechanical stresses are presented, including their limitations. This is then followed by findings and conclusions obtained from studies related to PV module long term performance. It must be noted that these models inherently involve nonlinearities, of which geometric nonlinearity and contact nonlinearity must be considered when performing FEA [62].
During the operation on the field, the PV panels are subjected to static and dynamic loads [63]. Starting from static loads, the IEC 61215 standard mechanical load test comprises three cycles of pressure and suction loads depending on climatic stress. This protocol can be used to simulate static environmental loads, such as wind and snow, including stresses induced from production and transport in the model. Unfortunately, the IEC 61215 standard only covers static loading conditions, even though studies have shown that the dynamic nature of some environmental loads can cause considerable damage to PV modules [64,65]. For this reason, IEC have published other protocols to cover the missing aspects of IEC 61215. One of these is the IEC TS 62782, which covers a dynamic cyclic mechanical load testing, aiming to identify whether fragile parts, such as the cells can withstand ambient dynamic stress conditions. Moreover, the recent issue of IEC TS 63209 aims to supplement IEC 61215 baseline testing, by focusing more on the longer-term reliability of PV modules.
Finally, it is also important to consider thermal loads since PV modules are subjected to extreme temperatures during operation that induce stress. This is tested using thermal cycling and can be modelled again according to the IEC temperature cycling test. It needs to be mentioned that there are no well-defined tests in IEC 61215 standards for long-term power degradation due to cell cracking [9].
Cracks that are often also invisible to the naked eye could cause electrically disconnected cell regions, resulting in a linear decrease in short-circuit current and higher series resistance, therefore lowering power output. A report of IEA PVPS Task 13 characterized cracks as the dominant cause of PV performance degradation in the first two years of operation. Cracks strongly depend on how they have been initiated, but most simulation studies neglect the history of Si cells (production and installation). Additionally, the effect of cracks on the reliability and electrical characteristics of PV modules is still debatable [9]. At present, there is no simulation tool able to quantify the impact of cracks on the electrical efficiency and durability of PV modules [11].
One method used to determine thermomechanical stresses from the manufacturing process is Raman spectroscopy, while also controlling the solar cells for cracks using EL imaging. In one study [66], the stress of PV cells was measured using this method, before (after metallization and other cell processes) and after soldering and after the lamination process. The results of the two later stages were compared to a Finite Element Model (FEM) simulating the same stresses, for which they agreed very well. However, the FEM results after the lamination were slightly overestimated due to the linear elastic material model used for EVA [66].
The lifetime of PV modules is estimated to be around 25 years, during which the power output is expected to drop around 20% [67]. During operation, PV modules experience mechanical and thermal loads due to a coefficient of thermal expansion (CTE) mismatch because of the dissimilar materials within the laminate inducing thermomechanical stresses. A PV module’s layers are fragile compared to their lengths, and therefore, it is possible to model it in shells, realizing each layer in a 2D simulation. This was conducted in [67] for a PV module during its operation, which found that the performance of the laminate is dominated by glass, as it covers most of the thickness of the module. The stress in the cells is compressive as they are forced to contract as much as glass. This phenomenon is more present in the cells under the interconnect regions due to copper’s high stiffness and hardening (see Figure 9). Additionally, it was seen that the encapsulant plays an essential role in decreasing the stress induced during thermo-mechanical movements within the laminate.
The critical role and impact of the interconnection on the reliability of a PV module’s performance has also been emphasized in [68]. The researchers in [68] identified its link to the presence of cracks. In this study, FEA was employed to examine how different dimensions of the interconnection geometry affect crack initiation and propagation rate. The realization of this dynamic model was approached through the Extended Finite Element Method (XFEM), which allows for local enrichment discontinuous functions and numerical approximations to be combined [69]. Essentially, XFEM models a crack within an enriched element with special displacement functions, meaning that there is no need to define the crack location beforehand and model its geometry during the simulation itself, unlike in the conventional FEM [70]. The results showed that the configuration of the interconnection ribbon has a significant influence on both crack initiation and propagation rate. Additionally, it was demonstrated that microcracks initiate at the edge of the Inter Metallic Compound (IMC) layer and that cracks have the tendency to propagate in the shear direction.
A summary of the key findings from the above literature can be found in Table 3 and Table 4.

4. Results and Discussions

After summarizing the literature available, which is necessary to understand the factors affecting PV module performance, the possible approaches for its improvement will be explored. This is split into two parts, first incorporating microcracks of a PV module into a simulation and second, using it to determine the module’s performance output. Finally, mitigation techniques and methods that can be used in conjunction with such a model are also discussed to ultimately be able to improve the reliability of PV installations.

4.1. Modelling Solar Cell Microcracks

The act of modelling microcracks can be broken down into two further parts, which can be relatively challenging. The first is accurately detecting and defining microcracks in a way that can be implemented into a model. The second is converting these findings into the necessary form of data and incorporating them into the model.
Starting from their detection, all currently relevant methods were mentioned in Section 2, where each has its advantages depending on the application. In this case, there is a need for accurate, but rapid, on-site microcrack detection. Therefore, using EL with our technique proposed in [35], combined with IR thermal imaging, we can achieve the desired results. It must be mentioned that using such equipment is also not an unreasonable expectation for commercial PV installations since obtaining such images is necessary in order to comply with IEC standards. Using both will detect microcracks and hotspots, yielding images representing them both geometrically and in terms of their position within cells. This is crucial for microcracks since, if their characteristics are deduced and mapped out virtually, they can then be imported into a computer-aided design (CAD) model used for FEA. However, this poses some challenges starting from the clarity of the image, which depends on the method of image processing used. In one of our papers [35], a processing method was introduced aimed at a solar cell inspection manufacturing execution system, which generates high-quality and low-noise EL images, allowing for easier identification of microcrack size, location, and orientation. This is achieved by using a proposed OR function, which involves six different methods to combine crack-free and cracked solar cell samples. These processes calibrate image pixels bit-by-bit, which removes noise and yields improved quality solar cell images, displaying the presence of cracks more clearly, as shown in Figure 10. Once micro cracks are visible, the next step is converting them into shapes in a two-dimensional drawing, which can then be incorporated into a CAD model. The detection and geometric recognition of image contours in this specific desired manner are possible with various methods, which can also be found as features integrated into various CAD software. The obstacle in this scenario would be to achieve this in high accuracy both in terms of the recognition yield and the position of the microcracks with respect to the full-scale PV module. One available approach to solve this issue has been proposed in [71], where an innovative image analysis technique is used to identify grains and grain boundaries. This is shown to result in more accurate finite element meshes that involve cracks, as their simulations demonstrate how grain boundaries and silicon bulk properties influence the crack pattern.
The following essential aspect of the model is the method with which microcracks are simulated for propagation. This can be realized in an iterative manner, in which the mesh in and around cracks is constantly redefined and regenerated. One such approach has been demonstrated in [72], where quadratic node elements are used in ANSYS to obtain the singular stress field and necessary meshing around the crack tips. Once this is generated, loads can be applied, and the nodal displacement, i.e., propagation, can be calculated. Alternatively, as mentioned in the previous section, XFEM can be used, which offers a dynamic approach to this issue, as shown in [68].

4.2. Modelling PV Performance Output

To successfully model the performance output of a PV module, given a specific environmental stress load and the simulated propagation of its microcracks, two variables need to be defined. First, the effect of cracks on performance, according to their orientation and severity, needs to be determined. Second, the eventuality of hotspots arising in some module regions needs to be assessed, considering the possible influence of microcracks, as indicated by some instances of the literature, and any other external factors, such as temperature.
Starting from determining the possible impact of microcracks, and assuming their propagation, it is clear from Section 3 that not all cracks have a significant effect. As a result, classifying them in terms of their potential impact is crucial. However, establishing this can be complex, as it depends on various factors. Nevertheless, from the literature discussed in the previous section, it can be deduced that the key characteristics that determine the impact significance of a crack are its orientation and position within the cell(s) as well as its severity. Analyzing these with sufficient understanding should theoretically allow for accurate estimations of the impact of a crack on performance. In one of our studies [33], a statistical approach was taken to achieve such categorization, using two techniques: the T-test and the F-test. Additionally, it was possible to determine their theoretical output performance by analyzing the I–V and P–V curves of the examined PV modules.
Another method to determine the PV performance, which has been described in a recent study [73], combines EL images and Griddler, a solar cell FEM simulation program. This software is used to map out open-circuit voltage, Voc, and short-circuit current density, Jsc, in addition to the maximum power output. Analyzing these additional parameters can help obtain a clearer picture of the cells’ performance, particularly for predicting and detecting hotspots. In this case, all three parameters were investigated for both uniform and nonuniform distribution of cracks, with various irradiance levels. For cracks to be classified as uniform, they must be evenly distributed across the solar cell surface. This is the case when they evenly affect all areas between the busbars or in the form of a diagonal line-crack across the cell. Investigating the open-circuit voltage map, generated by Griddler, of nonuniform crack distribution, it was concluded that cracks could locally reduce Voc, as indicated by the darker areas in Figure 11b [73]. This image is taken from the Griddler software after processing the original EL image shown in Figure 11a.
Additionally, Figure 11c depicts the short-circuit current density with negative values in the two cracks indicated, which implies a reverse current is flowing that will consequently become a hotspot. This was also seen when examining uniform distribution crack samples, which depicted a uniform decrease in Jsc and, hence, did not display any overheating. All in all, this suggests that uniformly distributed cracks have less of an impact on output power when compared to nonuniformly distributed cracks. This was also validated by a comparative investigation of different samples, which showcased considerably higher losses at higher irradiance levels. To provide reasoning behind this conclusion, nonuniformly distributed crack samples were investigated under an electron microscope, for which all cases displayed discontinuity in finger connections and affected rear busbars that consequently influenced power output. These findings are a big step forward in understanding and classifying cracks in terms of their potential impact. This report was shown to be important in successfully predicting PV cell performance. While other recent studies have also examined crack distributions [51,74,75], they fail in pointing out their distinguishing differences and then analyzing their consequent impact on solar cell performance.
Griddler provides a visualization of how cracks impact cells and creates simulations by analyzing EL images of PV solar cells. This aids in better understanding and formulating predictions of the overall PV cell performance. The simulation involves the mapping of P–Voc and Jsc–V curves by comparing desired EL images with an appropriate set of PV solar cell EL images used as a reference. Of course, it must also be mentioned at this point that the Griddler Team offers a module version where a collection of individual cells and/or also full-scale modules can be imported and simulated. This software has been considered more relevant when compared to other modelling methods used, such as the two-model diode [26]. The reason is that it allows the individual representation of the solar cell planes through the FEM, providing more customizability in terms of the model simulation itself. This allows for a more accessible but also relatively accurate estimation of power loss, which then also offers the ability of scaling. As a result, the software is helpful for research purposes and can also become applicable for commercial usage. Aside from other features, it allows to modify inputs, surroundings, and designing grid patterns, and it also provides the option to import DXF files from CAD. This element could potentially provide the means for integrating three-dimensional CAD models within multi-physics simulation processes, which could significantly improve prediction accuracy and allow for more complex estimations. One such potential method would be exploring crack propagation when exposed to various environmental stresses using a three-dimensional CAD model and exporting the results in a DXF drawing format. In this case, the biggest challenge faced remains in the complexity of successfully simulating crack propagation on a three-dimensional level.

4.3. PV Hotspot Mitigation Techniques

There are currently examinations on why and how PV hotspots occur, particularly in large scale PV installations. Some researchers propose that PV hotspots are present due to the accelerated change in the night-to-day temperature [75], especially in coastal areas [76]. For example, Dhimish et al. [77] remarked that a flawless hotspot string within a PV module could lead to a 25% loss in output power, while the temperature could also progress by up to 65 °C. The tested PV sub-strings were operated indoors in this study under standard test conditions (STC). Others have marked that PV hotspots are inducted due to cracks in the solar cells [9,78]. In addition to elevated cell temperatures, the hotspots can cause a significant drop in the output power of the impacted PV modules and, in some instances, could even break (short-circuit) the bypass diodes [79,80].
The best practice to detect PV hotspots involves the usage of thermal imaging cameras. Nevertheless, some new studies [81,82] have introduced machine learning models to diagnose PV hotspots based on measured PV performance data, such as the output current, voltage, and dynamic series resistance.
Although all the methods mentioned above refer to field diagnostics (i.e., only used to detect hotspots reactively), to date, only a small number of procedures have been developed for hotspots mitigation. Varied approaches have used the principle of dual metal-oxide-semiconductor field-effect transistors (MOSFETs) to employ the connection of pair MOSFETs, one in parallel while the other in series with the PV module, as shown in Figure 12a [32]. Both MOSFETs serve as a switch, assuring a passive current delivery from the PV module by turning ON/OFF the MOSFETs at a high-frequency rate (>50 kHz).
Another concept, shown in Figure 12b, is the bipolar junction transistor (BJT)-based bypass, introduced by d’Alessandro et al. [83]. This mitigation technique is based on the operation of two MOSFETs to enable/restrain the BJT transistor automatically. In addition, an antiparallel Schottky diode can also be used to regulate the BJT transistor under critical partial shading conditions [84,85]. The main limitation of these mitigation concepts is that a conventional switching device (microcontroller) must be used. Additionally, they cannot be combined within a PV sub-string, becoming complicated and costly to use in large-scale PV installations.
In a recent study [86], the authors demonstrated advanced mitigation techniques to avoid PV mismatched conditions, including hotspots and shading. The foundation of the proposed circuit is fundamentally based on an input buffer that allows high impedance input voltages and an operational amplifier circuit that controls the current flow using a current limiter circuit. In Figure 13, we show that, using this mitigation technique, the temperature of the hotspots drops from nearly 19 to 13 °C. Hence, the hotspots were fully recovered.

5. Comparative Study

We compared our work with other recent literature review studies [6,9], for which the summary can be found in Table 5. From this comparison, it became clear that, while the other reviews explored in more detail certain specifics, our work was able to provide enough detail for both microcracks and hotspots. This is in line with the scope of this report, which is to be able to provide the bigger picture of long-term PV performance output. With this, the use of complex models, such as multi-physics simulations, is executed more effectively, ultimately leading to a higher overall prediction accuracy.

6. Conclusions

This paper commenced by outlining the causes of PV module failure, which are in the form of climatic stresses. Their impact on performance heavily depends on the site location and time of year. Next, mechanical failure modes were introduced, for which microcracks and hotspots were found to have a high impact on performance. To develop a better understanding, both were further investigated in terms of their nature and root causes. Additionally, a plethora of microcrack detection methods was explored together with their advantages and disadvantages. The literature found that combining the techniques of UVF with IR or EL, or EL with IR results in a more accurate microcrack detection. Next, the findings of the relevant literature focusing on the PV solar installation performance were summarized to understand better its mechanics and how it is influenced. During this investigation, it was discovered that the position, orientation, and severity of a microcrack determines how it impacts a PV solar cell’s output power. Therefore, microcrack categorization using these characteristics is required to achieve accurate estimations of PV yield performance.
Similarly, various attempts of modelling the performance of PV cells were assessed to pinpoint gaps in the literature and then explore how they can be filled. As a result, it was discovered that one of the biggest hurdles in accurately modelling performance is modelling microcracks. While adopting processes such as XFEM can potentially provide a solution, it is an area that definitely requires further research. The successful realization of such models would produce substantial contributions to the industry. Finally, modelling the performance itself has had numerous contributions recently and is therefore progressing rapidly. Moreover, the adoption of software such as Griddler can provide significant benefits to the industry.

Author Contributions

Conceptualization, G.G. and M.D.; methodology, G.G.; software, M.D.; validation, G.G., and P.I.L.; writing—original draft preparation, G.G.; writing—review and editing, P.I.L. and M.D. All authors have read and agreed to the published version of the manuscript.

Funding

This research received no external funding.

Data Availability Statement

Not applicable.

Conflicts of Interest

The authors declare no conflict of interest.

References

  1. Wohlgemuth, J.H.; Cunningham, D.W.; Monus, P.; Miller, J.; Nguyen, A. Long Term Reliability of Photovoltaic Modules. In Proceedings of the IEEE 4th World Conference on Photovoltaic Energy Conference, Waikoloa, HI, USA, 7–12 May 2006; pp. 2050–2053. [Google Scholar] [CrossRef]
  2. Skoczek, A.; Sample, T.; Dunlop, E.D. The results of performance measurements of field-aged crystalline silicon photovoltaic modules. Prog. Photovoltaics: Res. Appl. 2009, 17, 227–240. [Google Scholar] [CrossRef]
  3. Khan, F.; Kim, J.H. Performance Degradation Analysis of c-Si PV Modules Mounted on a Concrete Slab under Hot-Humid Conditions Using Electroluminescence Scanning Technique for Potential Utilization in Future Solar Roadways. Materials 2019, 12, 4047. [Google Scholar] [CrossRef] [PubMed]
  4. Zhu, J.; Koehl, M.; Hoffmann, S.; Berger, K.A.; Zamini, S.; Bennett, I.; Gerritsen, E.; Malbranche, P.; Pugliatti, P.; Di Stefano, A.; et al. Changes of solar cell parameters during damp-heat exposure. Prog. Photovolt. Res. Appl. 2016, 24, 1346–1358. [Google Scholar] [CrossRef]
  5. Kawai, S.; Tanahashi, T.; Fukumoto, Y.; Tamai, F.; Masuda, A.; Kondo, M. Causes of Degradation Identified by the Extended Thermal Cycling Test on Commercially Available Crystalline Silicon Photovoltaic Modules. IEEE J. Photovolt. 2017, 7, 1511–1518. [Google Scholar] [CrossRef]
  6. Santhakumari, M.; Sagar, N. A review of the environmental factors degrading the performance of silicon wafer-based photovoltaic modules: Failure detection methods and essential mitigation techniques. Renew. Sustain. Energy Rev. 2019, 110, 83–100. [Google Scholar] [CrossRef]
  7. Khan, F.; Baek, S.-H.; Kim, J. Wide range temperature dependence of analytical photovoltaic cell parameters for silicon solar cells under high illumination conditions. Appl. Energy 2016, 183, 715–724. [Google Scholar] [CrossRef]
  8. Ngo, T.; Heta, Y.; Doi, T.; Masuda, A. Effects of UV on power degradation of photovoltaic modules in combined acceleration tests. Jpn. J. Appl. Phys. 2016, 55, 052301. [Google Scholar] [CrossRef]
  9. Papargyri, L.; Theristis, M.; Kubicek, B.; Krametz, T.; Mayr, C.; Papanastasiou, P.; Georghiou, G.E. Modelling and experimental investigations of microcracks in crystalline silicon photovoltaics: A review. Renew. Energy 2020, 145, 2387–2408. [Google Scholar] [CrossRef]
  10. Abdelhamid, M.; Singh, R.; Omar, M. Review of Microcrack Detection Techniques for Silicon Solar Cells. IEEE J. Photovolt. 2013, 4, 514–524. [Google Scholar] [CrossRef]
  11. Köntges, M.; Kajari-Schröder, S.; Kunze, I.; Jahn, U. Crack Statistic of Crystalline Silicon Photovoltaic Modules. In Proceedings of the 26th European Photovoltaic Solar Energy Conference and Exhibition, Hamburg, Germany, 5–9 September 2011; pp. 3290–3294. [Google Scholar] [CrossRef]
  12. Brun, X.F.; Melkote, S.N. Analysis of stresses and breakage of crystalline silicon wafers during handling and transport. Sol. Energy Mater. Sol. Cells 2009, 93, 1238–1247. [Google Scholar] [CrossRef]
  13. Sander, M.; Henke, B.; Schweizer, S.; Ebert, M.; Bagdahn, J. PV module defect detection by combination of mechanical and electrical analysis methods. In Proceedings of the 35th IEEE Photovoltaic Specialists Conference, Honolulu, HI, USA, 20–25 June 2010; pp. 1765–1769. [Google Scholar] [CrossRef]
  14. Köntges, M.; Siebert, M.; Morlier, A.; Illing, R.; Bessing, N.; Wegert, F. Impact of transportation on silicon wafer-based photovoltaic modules. Prog. Photovolt. Res. Appl. 2016, 24, 1085–1095. [Google Scholar] [CrossRef]
  15. Dhimish, M.; Lazaridis, P.I. An empirical investigation on the correlation between solar cell cracks and hotspots. Sci. Rep. 2021, 11, 1–11. [Google Scholar] [CrossRef] [PubMed]
  16. Kaule, F.; Wang, W.; Schoenfelder, S. Modeling and testing the mechanical strength of solar cells. Sol. Energy Mater. Sol. Cells 2014, 120, 441–447. [Google Scholar] [CrossRef]
  17. Popovich, V.A.; Maris, M.P.F.H.L.V.; Janssen, M.; Bennett, I.J.; Richardson, I.M. Understanding the Properties of Silicon Solar Cells Aluminium Contact Layers and Its Effect on Mechanical Stability. Mater. Sci. Appl. 2013, 4, 118–127. [Google Scholar] [CrossRef]
  18. Popovich, V.A.; Janssen, M.; Bennett, I.J.; Richardson, I.M. Microstructure and mechanical properties of a screen-printed silver front side solar cell contact. In EPD Congress 2015; Springer International: New York, NY, USA, 2016; pp. 265–272. [Google Scholar]
  19. Israil, M.; Anwar, S.A.; Abdullah, M.Z. Automatic detection of micro-crack in solar wafers and cells: A review. Trans. Inst. Meas. Control 2013, 35, 606–618. [Google Scholar] [CrossRef]
  20. Rupnowski, P.; Sopori, B. Strength of silicon wafers: Fracture mechanics approach. Int. J. Fract. 2009, 155, 67–74. [Google Scholar] [CrossRef]
  21. Gonzalez, M.; Govaerts, J.; Labie, R.; Wolf, I.D.; Baert, K. Thermo-mechanical challenges of advanced solar cell modules. In Proceedings of the 23rd European photovoltaic solar energy conference, Valencia, Spain, 1–5 September 2008; pp. 258–260. [Google Scholar] [CrossRef]
  22. Popovich, V.; Yunus, A.; Janssen, M.; Richardson, I.; Bennett, I. Effect of silicon solar cell processing parameters and crystallinity on mechanical strength. Sol. Energy Mater. Sol. Cells 2011, 95, 97–100. [Google Scholar] [CrossRef]
  23. Bayrak, F.; Oztop, H.F. Effects of static and dynamic shading on thermodynamic and electrical performance for photovoltaic panels. Appl. Therm. Eng. 2020, 169, 114900. [Google Scholar] [CrossRef]
  24. Bouraiou, A.; Hamouda, M.; Chaker, A.; Mostefaoui, M.; Lachtar, S.; Sadok, M.; Boutasseta, N.; Othmani, M.; Issam, A. Analysis and evaluation of the impact of climatic conditions on the photovoltaic modules performance in the desert environment. Energy Convers. Manag. 2015, 106, 1345–1355. [Google Scholar] [CrossRef]
  25. Luo, W.; Khoo, Y.S.; Hacke, P.; Naumann, V.; Lausch, D.; Harvey, S.P.; Singh, J.P.; Chai, J.; Wang, Y.; Aberle, A.G.; et al. Potential-induced degradation in photovoltaic modules: A critical review. Energy Environ. Sci. 2017, 10, 43–68. [Google Scholar] [CrossRef]
  26. Ko, S.W.; Ju, Y.C.; Hwang, H.M.; So, J.H.; Jung, Y.-S.; Song, H.-J.; Song, H.-E.; Kim, S.-H.; Kang, G.H. Electric and thermal characteristics of photovoltaic modules under partial shading and with a damaged bypass diode. Energy 2017, 128, 232–243. [Google Scholar] [CrossRef]
  27. Monastyrskyi, A.; Ostapenko, S.; Polupan, O.; Maeckel, H.; Vazquez, M. Resonance Ultrasonic Vibrations for in-line crack detection in silicon wafers and solar cells. In Proceedings of the 33rd IEEE Photovoltaic Specialists Conference, San Diego, CA, USA, 11–16 May 2008; pp. 1–6. [Google Scholar] [CrossRef]
  28. Ostapenko, S.; Dallas, W.; Hess, D.; Polupan, O.; Wohlgemuth, J. Crack Detection and Analyses using Resonance Ultrasonic Vibrations in crystalline silicon wafers. In Proceedings of the Crystalline 4th World Conference on Photovoltaic Energy Conversion, WCPEC-4, Waikoloa, HI, USA, 7–12 May 2006; pp. 920–923. [Google Scholar] [CrossRef]
  29. Liu, Z.; Peters, M.; Shanmugam, V.; Khoo, Y.S.; Guo, S.; Stangl, R.; Aberle, A.G.; Wong, J. Luminescence imaging analysis of light harvesting from inactive areas in crystalline silicon PV modules. Sol. Energy Mater. Sol. Cells 2016, 144, 523–531. [Google Scholar] [CrossRef]
  30. Zhu, Y.; Juhl, M.; Trupke, T.; Hameiri, Z. Photoluminescence Imaging of Silicon Wafers and Solar Cells With Spatially Inhomogeneous Illumination. IEEE J. Photovolt. 2017, 7, 1087–1091. [Google Scholar] [CrossRef]
  31. Bhoopathy, R.; Kunz, O.; Juhl, M.; Trupke, T.; Hameiri, Z. Outdoor photoluminescence imaging of photovoltaic modules with sunlight excitation. Prog. Photovolt. Res. Appl. 2018, 26, 69–73. [Google Scholar] [CrossRef]
  32. Dhimish, M.; Holmes, V.; Mather, P.; Sibley, M. Novel hot spot mitigation technique to enhance photovoltaic solar panels output power performance. Sol. Energy Mater. Sol. Cells 2018, 179, 72–79. [Google Scholar] [CrossRef]
  33. Dhimish, M.; Holmes, V.; Mehrdadi, B.; Dales, M. The impact of cracks on photovoltaic power performance. J. Sci. Adv. Mater. Devices 2017, 2, 199–209. [Google Scholar] [CrossRef]
  34. Hu, X.; Chen, T.; Xue, J.; Weng, G.; Chen, S.; Akiyama, H.; Zhu, Z. Absolute Electroluminescence Imaging Diagnosis of GaAs Thin-Film Solar Cells. IEEE Photon. J. 2017, 9, 1–9. [Google Scholar] [CrossRef]
  35. Dhimish, M.; Holmes, V.; Mather, P. Novel Photovoltaic Micro Crack Detection Technique. IEEE Trans. Device Mater. Reliab. 2019, 19, 304–312. [Google Scholar] [CrossRef]
  36. Pramana, P.A.A.; Dalimi, R. Hotspot Detection Method in Large Capacity Photovoltaic (PV) Farm. IOP Conf. Ser. Mater. Sci. Eng. 2020, 982, 012019. [Google Scholar] [CrossRef]
  37. Sulas-Kern, D.B.; Johnston, S.; Owen-Bellini, M.; Terwilliger, K.; Meydbray, J.; Spinella, L.; Sinha, A.; Schelhas, L.T.; Jordan, D.C. UV-Fluorescence Imaging of Silicon PV Modules After Outdoor Aging and Accelerated Stress Testing. In Proceedings of the IEEE Photovoltaic Specialists Conference, Online Conference, 15 June–21 August 2020; pp. 1444–1448. [Google Scholar] [CrossRef]
  38. Gilleland, B.; Hobbs, W.B.; Richardson, J.B. High Throughput Detection of Cracks and Other Faults in Solar PV Modules Using a High-Power Ultraviolet Fluorescence Imaging System. In Proceedings of the 2019 IEEE 46th Photovoltaic Specialists Conference (PVSC), Chicago, IL, USA, 16–21 June 2019. [Google Scholar] [CrossRef]
  39. Kontges, M.; Morlier, A.; Eder, G.; Fleis, E.; Kubicek, B.; Lin, J. Review: Ultraviolet Fluorescence as Assessment Tool for Photovoltaic Modules. IEEE J. Photovolt. 2020, 10, 616–633. [Google Scholar] [CrossRef]
  40. Patel, A.P.; Sinha, A.; Tamizhmani, G. Field-Aged Glass/Backsheet and Glass/Glass PV Modules: Encapsulant Degradation Comparison. IEEE J. Photovolt. 2019, 10, 607–615. [Google Scholar] [CrossRef]
  41. Chiou, Y.; Liu, J.; Liang, Y. Micro crack detection of multi-crystalline silicon solar wafer using machine vision techniques. Sens. Rev. 2011, 31, 154–165. [Google Scholar] [CrossRef]
  42. Köntges, M.; Kunze, I.; Kajari-Schröder, S.; Breitenmoser, X.; Bjørneklett, B. The risk of power loss in crystalline silicon based photovoltaic modules due to micro-cracks. Sol. Energy Mater. Sol. Cells 2011, 95, 1131–1137. [Google Scholar] [CrossRef]
  43. Addabbo, P.; Angrisano, A.; Bernardi, M.L.; Gagliarde, G.; Mennella, A.; Nisi, M.; Ullo, S. A UAV infrared measurement approach for defect detection in photovoltaic plants. In Proceedings of the IEEE International Workshop on Metrology for AeroSpace (MetroAeroSpace), Padua, Italy, 21–23 June 2017; pp. 345–350. [Google Scholar] [CrossRef]
  44. Zhang, P.; Zhang, L.; Wu, T.; Zhang, H.; Sun, X. Detection and location of fouling on photovoltaic panels using a drone-mounted infrared thermography system. J. Appl. Remote Sens. 2017, 11, 16026. [Google Scholar] [CrossRef]
  45. Alsafasfeh, M.; Abdel-Qader, I.; Bazuin, B.; Alsafasfeh, Q.; Su, W. Unsupervised Fault Detection and Analysis for Large Photovoltaic Systems Using Drones and Machine Vision. Energies 2018, 11, 2252. [Google Scholar] [CrossRef]
  46. Henry, C.; Poudel, S.; Lee, S.-W.; Jeong, H. Automatic Detection System of Deteriorated PV Modules Using Drone with Thermal Camera. Appl. Sci. 2020, 10, 3802. [Google Scholar] [CrossRef]
  47. Dhimish, M.; Schofield, N.; Attya, A. Insights on the Degradation and Performance of 3000 Photovoltaic Installations of Various Technologies Across the United Kingdom. IEEE Trans. Ind. Inform. 2020, 17, 5919–5926. [Google Scholar] [CrossRef]
  48. Short, W.; Packey, D.; Holt, T. A manual for the economic evaluation of energy efficiency and renewable energy technologies. In A Manual for the Economic Evaluation of Energy Efficiency and Renewable Energy Technologies; Office of Scientific and Technical Information (OSTI): Washington, DC, USA, 1995. [Google Scholar]
  49. Jordan, D.C.; Silverman, T.J.; Sekulic, B.; Kurtz, S.R. PV degradation curves: Non-linearities and failure modes. Prog. Photovoltaics Res. Appl. 2016, 25, 583–591. [Google Scholar] [CrossRef]
  50. Jordan, D.C.; Silverman, T.J.; Wohlgemuth, J.H.; Kurtz, S.R.; VanSant, K.T. Photovoltaic failure and degradation modes. Prog. Photovoltaics Res. Appl. 2017, 25, 318–326. [Google Scholar] [CrossRef]
  51. Dhimish, M. Micro cracks distribution and power degradation of polycrystalline solar cells wafer: Observations constructed from the analysis of 4000 samples. Renew. Energy 2019, 145, 466–477. [Google Scholar] [CrossRef]
  52. Grunow, P.; Clemens, P.; Hoffmann, V.; Litzenburger, B.; Podlowski, L. Influence of micro cracks in multi-crystalline silicon solar cells on the reliability of PV modules. In Proceedings of the European Photovoltaic Solar Energy Conference and Exhibition (EU PVSEC), Barcelona, Spain, 6–10 June 2005. [Google Scholar]
  53. Dhimish, M.; Holmes, V.; Dales, M.; Mather, P.; Sibley, M.; Chong, B.; Zhang, L. The impact of cracks on the performance of photovoltaic modules. In Proceedings of the IEEE Manchester PowerTech, Manchester, UK, 18–22 June 2017; pp. 1–6. [Google Scholar] [CrossRef]
  54. Spataru, S.; Hacke, P.; Sera, D. Automatic detection and evaluation of solar cell micro-cracks in electroluminescence images using matched filters. In Proceedings of the IEEE 43rd Photovoltaic Specialists Conference (PVSC), Portland, OR, USA, 5–10 June 2016; pp. 1602–1607. [Google Scholar] [CrossRef]
  55. Bdour, M.; Al-Sadi, A. Analysis of different microcracks shapes and the effect of each shape on performance of PV modules. IOP Conf. Series Mater. Sci. Eng. 2020, 876, 012005. [Google Scholar] [CrossRef]
  56. Bdour, M.; Dalala, Z.; Al-Addous, M.; Radaideh, A.; Al-Sadi, A. A Comprehensive Evaluation on Types of Microcracks and Possible Effects on Power Degradation in Photovoltaic Solar Panels. Sustainability 2020, 12, 6416. [Google Scholar] [CrossRef]
  57. Dolara, A.; Leva, S.; Manzolini, G.; Niccolai, A.; Votta, L. Impact of Cell Microcracks Size and Spatial Distribution on Output Power of PV Modules. In Proceedings of the IEEE International Conference on Environment and Electrical Engineering and 2018 IEEE Industrial and Commercial Power Systems Europe (EEEIC/I&CPS Europe), Palermo, Italy, 12–15 June 2018; pp. 1–6. [Google Scholar] [CrossRef]
  58. Dolara, A.; Lazaroiu, G.C.; Leva, S.; Manzolini, G.; Votta, L. Snail Trails and Cell Microcrack Impact on PV Module Maximum Power and Energy Production. IEEE J. Photovolt. 2016, 6, 1269–1277. [Google Scholar] [CrossRef]
  59. Jordan, D.C.; Marion, B.; Deline, C.; Barnes, T.; Bolinger, M. PV field reliability status—Analysis of 100,000 solar systems. Prog. Photovolt. Res. Appl. 2020, 28, 739–754. [Google Scholar] [CrossRef]
  60. Zarmai, M.T.; Ekere, N.N.; Oduoza, C.; Amalu, E. A review of interconnection technologies for improved crystalline silicon solar cell photovoltaic module assembly. Appl. Energy 2015, 154, 173–182. [Google Scholar] [CrossRef]
  61. Dhimish, M.; Hu, Y.; Schofield, N.; Vieira, R.G. Mitigating Potential-Induced Degradation (PID) Using SiO2 ARC Layer. Energies 2020, 13, 5139. [Google Scholar] [CrossRef]
  62. Li, G.; Akram, M.; Jin, Y.; Chen, X.; Zhu, C.; Ahmad, A.; Arshad, R.; Zhao, X. Thermo-mechanical behavior assessment of smart wire connected and busbarPV modules during production, transportation, and subsequent field loading stages. Energy 2019, 168, 931–945. [Google Scholar] [CrossRef]
  63. Assmus, M.; Jack, S.; Weiss, K.-A.; Koehl, M. Measurement and simulation of vibrations of PV-modules induced by dynamic mechanical loads. Prog. Photovolt. Res. Appl. 2011, 19, 688–694. [Google Scholar] [CrossRef]
  64. Dong, J.; Yang, H.; Lu, X.; Zhang, H.; Peng, J. Comparative Study on Static and Dynamic Analyses of an Ultra-thin Double-Glazing PV Module Based on FEM. Energy Procedia 2015, 75, 343–348. [Google Scholar] [CrossRef]
  65. Kilikevičius, A.; Čereška, A.; Kilikevičienė, K. Analysis of external dynamic loads influence to photovoltaic module structural performance. Eng. Fail. Anal. 2016, 66, 445–454. [Google Scholar] [CrossRef]
  66. Beinert, A.; Romer, P.; Büchler, A.; Haueisen, V.; Aktaa, J.; Eitner, U. Thermomechanical stress analysis of PV module production processes by Raman spectroscopy and FEM simulation. Energy Procedia 2017, 124, 464–469. [Google Scholar] [CrossRef]
  67. Hasan, O.; Arif, A.F.M.; Siddiqui, M.U. Finite Element Modeling and Analysis of Photovoltaic Modules. In Proceedings of the ASME In-ternational Mechanical Engineering Congress and Exposition, Proceedings (IMECE), Houston, TX, USA, 9–15 November 2012; pp. 495–505. [Google Scholar] [CrossRef]
  68. Majd, A.E.; Ekere, N.N. Crack initiation and growth in PV module interconnection. Sol. Energy 2020, 206, 499–507. [Google Scholar] [CrossRef]
  69. Fries, T.-P. Extended Finite Element Methods (XFEM). In Encyclopedia of Continuum Mechanics; Springer: Berlin/Heidelberg, Germany, 2018; pp. 1–10. [Google Scholar]
  70. ABAQUS. Abaqus 6.11 Theory Manual. 2017. Available online: http://130.149.89.49:2080/v6.11/pdf_books/THEORY.pdf (accessed on 13 September 2021).
  71. Infuso, A.; Corrado, M.; Paggi, M. Image analysis of polycrystalline solar cells and modelling of intergranular and transgranular cracking. J. Eur. Ceram. Soc. 2014, 34, 2713–2722. [Google Scholar] [CrossRef]
  72. Ahmar, J.A.; Wiese, S. Analysis and simulation of cracks and micro cracks in PV cells. In Proceedings of the 14th International Conference on Thermal, Mechanical and Multi-Physics Simulation and Experiments in Microelectronics and Microsystems (EuroSimE), Wroclaw, Poland, 15–17 April 2013; pp. 1–4. [Google Scholar] [CrossRef]
  73. Dhimish, M.; D’Alessandro, V.; Daliento, S. Investigating the Impact of Cracks on Solar Cells Performance: Analysis Based on Nonuniform and Uniform Crack Distributions. IEEE Trans. Ind. Inform. 2021, 18, 1684–1693. [Google Scholar] [CrossRef]
  74. Zhu, Y.; Heinz, F.D.; Juhl, M.; Schubert, M.C.; Trupke, T.; Hameiri, Z. Photoluminescence Imaging at Uniform Excess Carrier Density Using Adaptive Nonuniform Excitation. IEEE J. Photovolt. 2018, 8, 1787–1792. [Google Scholar] [CrossRef]
  75. Su, B.; Chen, H.Y.; Chen, P.; Bian, G.-B.; Liu, K.; Liu, W. Deep Learning-Based Solar-Cell Manufacturing Defect Detection With Complementary Attention Network. IEEE Trans. Ind. Inform. 2020, 17, 4084–4095. [Google Scholar] [CrossRef]
  76. Sinha, P.; Wade, A. Addressing Hotspots in the Product Environmental Footprint of CdTe Photovoltaics. In Proceedings of the 43rd Photovoltaic Specialists Conference (PVSC), Portland, OR, USA, 5–10 June 2017; pp. 2005–2010. [Google Scholar] [CrossRef]
  77. Dhimish, M.; Mather, P.; Holmes, V. Evaluating Power Loss and Performance Ratio of Hot-Spotted Photovoltaic Modules. IEEE Trans. Electron. Devices 2018, 65, 5419–5427. [Google Scholar] [CrossRef]
  78. Dhimish, M.; Badran, G. Photovoltaic Hot-Spots Fault Detection Algorithm Using Fuzzy Systems. IEEE Trans. Device Mater. Reliab. 2019, 19, 671–679. [Google Scholar] [CrossRef]
  79. Dhimish, M.; Chen, Z. Novel Open-Circuit Photovoltaic Bypass Diode Fault Detection Algorithm. IEEE J. Photovolt. 2019, 9, 1819–1827. [Google Scholar] [CrossRef]
  80. Vieira, R.; Araújo, F.D.; Dhimish, M.; Guerra, M. A Comprehensive Review on Bypass Diode Application on Photovoltaic Modules. Energies 2020, 13, 2472. [Google Scholar] [CrossRef]
  81. Huang, J.-M.; Wai, R.-J.; Yang, G.-J. Design of Hybrid Artificial Bee Colony Algorithm and Semi-Supervised Extreme Learning Machine for PV Fault Diagnoses by Considering Dust Impact. IEEE Trans. Power Electron. 2020, 35, 7086–7099. [Google Scholar] [CrossRef]
  82. Zhao, Y.; Ball, R.; Mosesian, J.; Palma, J.-F.D.; Lehman, B. Graph-Based Semi-supervised Learning for Fault Detection and Classification in Solar Photovoltaic Arrays. IEEE Trans. Power Electron. 2014, 30, 2848–2858. [Google Scholar] [CrossRef]
  83. D’Alessandro, V.; Guerriero, P.; Daliento, S. A Simple Bipolar Transistor-Based Bypass Approach for Photovoltaic Modules. IEEE J. Photovolt. 2013, 4, 405–413. [Google Scholar] [CrossRef]
  84. Liu, W.; Badel, A.; Formosa, F.; Zhao, C.; Zhu, Q.; Hu, G. Comparative Case Study on the Self-Powered Synchronous Switching Harvesting Circuits with BJT or MOSFET Switches. IEEE Trans. Power Electron. 2018, 33, 9506–9519. [Google Scholar] [CrossRef]
  85. Yousefzadeh, B.; Makinwa, K.A.A. A BJT-Based Temperature-to-Digital Converter With a ±0.25 °C 3σ-Inaccuracy From −40 °C to +180 °C Using Heater-Assisted Voltage Calibration. IEEE J. Solid-State Circuits 2019, 55, 369–377. [Google Scholar] [CrossRef]
  86. Dhimish, M.; Badran, G. Current limiter circuit to avoid photovoltaic mismatch conditions including hot-spots and shading. Renew. Energy 2019, 145, 2201–2216. [Google Scholar] [CrossRef]
Figure 1. Failure modes in solar cells: (a) Microcracked solar cell, this image is taken using an Electroluminescent (EL) imaging camera; (b) hotspot solar cell (this image was taken using a FLIR thermal imaging camera) [15].
Energies 15 04303 g001
Figure 2. The experimental result of observing hotspots in a PV module. The temperature of the hotspots is nearly 13 degrees higher than adjacent non-hot-spotted solar cells [15].
Energies 15 04303 g002
Figure 3. Proposed PL setup in [31]: (1) UHP lamp and concave mirror; (2) and (3) lens; (4) DMD; (5) 950 nm short pass filter; (6) Si CCD camera; (7) long pass filter; (8) sample; (9) stage; and (10) light sink [30].
Energies 15 04303 g003
Figure 4. Before and after using the proposed EL detection method proposed by. Points 1 and 2 show how shadows that might seem are cracks are eliminated [35].
Energies 15 04303 g004
Figure 5. Solar cell cracks: (a) UVF images after outdoor exposure, but before stress testing, and (right) images after either damp heat or thermal cycling [37]; (b) different microcrack orientations indicated by red circles as described by [33].
Energies 15 04303 g005
Figure 6. Block diagram displaying the system configuration of an automatic detection process of faulty PV modules using drones [46].
Energies 15 04303 g006
Figure 7. Heatmap distribution of a cracked solar cell sample, operating under standard test conditions. Images were captured using a FLIR thermal camera: (a) After 10 s; (b) after 60 s; (c) after 120 s—This level of temperature remains steady [51].
Energies 15 04303 g007
Figure 8. EL image of an examined solar cell sample: (a) before the PID test; (b) after the PID test with a duration of 96 h [61].
Energies 15 04303 g008
Figure 9. Cross section of a PV module [67].
Energies 15 04303 g009
Figure 10. EL enhancement technique for solar cell crack detection: (a) process of achieving higher quality cracked solar cell images through a novel detection technique [35]; (b) before and after images using the detection technique [35].
Energies 15 04303 g010aEnergies 15 04303 g010b
Figure 11. Solar cell affected by a nonuniform distribution of cracks [73]: (a) EL image; (b) Voc; (c) Jsc maps.
Energies 15 04303 g011aEnergies 15 04303 g011b
Figure 12. PV hotspot mitigating techniques: (a) dual MOSFET concept [32]; (b) BJT-based bypass concept [83].
Energies 15 04303 g012
Figure 13. Impact of proposed mitigation technique on hotspots of the PV module, that are present due to partial shading. (a) Thermal image of PV module before using technique (b) Thermal image after using technique [86].
Energies 15 04303 g013
Table 1. PV mechanical failure modes.
Failure ModeCause Other FailuresPower Loss *Detection
Yellowing/browning of encapsulants and back sheets
-
Hotspots
NoneSimple detection method
Delamination of encapsulants and back sheet
-
Microcracks, cell breakage
-
Corrosion of connection
-
Bubble formation
LowRequires technical equipment to detect, e.g., IP cameras
Bubble formation
-
Worsens delamination of encapsulant
-
Microcracks, cell breakage
Low
Oxidation formation
-
Encapsulant delamination
Low
Discoloration of busbars Medium
Corrosion of connection and cracks of back sheet
-
Discoloration of busbars
Medium
Hotspots High
Cell breakage Low–high **
Microcracks
-
Can cause hotspots (more below)
Low–high **
* Power loss indicated as an output drop of: Low < 5%, 5% < Medium < 10%, High > 10%. ** Please note that, depending on the breakage direction and orientation, the power loss from microcracks and cell breakage varies (more explained in Section 2.5 and Section 3).
Table 2. Summary of the annual degradation rate per PV technology [47].
PV TechnologyAnnual Measured Degradation Rate (%/year)Degradation Rate Confidence Interval (%/Year)
Mono-Si−0.81−0.78 to −0.83
Poly-Si−0.94−0.92 to −0.95
CdTe−1.43−1.41 to −1.45
Table 3. Summary of the key findings from the literature outlining the origin and mechanisms of microcracks and hotspots.
ReferenceCause/OriginMechanisms Impacting Degradation/Failure Severity
[47]Degradation rates highly depend on location of installationHigher and more unstable temperature, as well as higher humidity causes higher degradation rates.
[51]Findings suggest microcracks to be the main cause of hotspotsThermal imaging found an increase in temperature initiating from crack locations. Output power was found between 0.9% and 42.8%, depending on crack size.
[67,68]Dissimilar materials within the laminate cause a CTE mismatch that induces thermomechanical stressesThese stresses are more present in the cells under the interconnection. The configuration of the interconnection ribbon was found to have significant influence on both crack initiation and propagation.
[49]The most common degradation modes is encapsulant discoloration, which is approximated with linear declineHowever, modules can also display non-linear declines that may be difficult to detect. Some of these invovle hotspots caused by cells or solder bonds and corrosion.
[50]The most important and challenging cause of degradation in newer installations are hotspots followed by internal circuitry discolorationDegradation rates are considerably higher in hot and humid climates than those in desert and mdoerate climates.
Table 4. Summary of the key findings from the literature outlining how the severity of microcracks with respect to power output can be recognized.
ReferenceIndicator Type Description of Indicator Impact Severity
[52]Crack orientationCracks parallel to and centered between busbars Power drop of less than 4%
[52]Crack orientationCracks parallel on both sides of both busbarsPower drop of 60%
[53]Crack sizeIf area separated by microcrack in a solar cell is less than 8%No power loss
[46]Crack sizeDiagonal and parallel orientation cracksSignificant power loss only when present in several cells and over enough area
[54,55]Crack orientationVertical and multiple orierntation microcracks Deemed as the most critical types causing significant power output drops
Table 5. Comparative study of our work compared with previously published work.
Comparison[9][6] Our Work
Outline and analysis of environmental factors causing performance dropSome factors sporadically mentioned throughoutEnvironmental factors are outlined and analyzedEnvironmental factors are outlined
Analysis of main performance drop causesYes, only for microcracksOnly mentioning of various failure modesYes, microcracks and hotspots that were found to be the most critical were analyzed in detail
Description and comparison of detection methods to analyze the cause of performance dropNoYesYes, for both in a relatively detailed manner
Suggestions for further work to aid in more PV performance predictionsInvestigations to predict and quantify the long-term impact and propagation of cracking under different meteorological conditionsFurther work in forecasting and modelling of environmnetal parameters with respect to solar plantsTo investigate further the modelling of microcracks through processes such as XFEM used in combination with Griddler to determine PV performance output
Publisher’s Note: MDPI stays neutral with regard to jurisdictional claims in published maps and institutional affiliations.

