
The Identification of Travelling Waves in a Voltage Sensor Signal in a Medium Voltage Grid Using the Short-Time Matrix Pencil Method


Abstract
1. Introduction
2. The Identification of Fault Impulses in a Medium Voltage Grid
2.1. The Short-Time Matrix Pencil Method
- y(t)—measurement signal,
- n(t)—noise,
- x(t)—original signal,
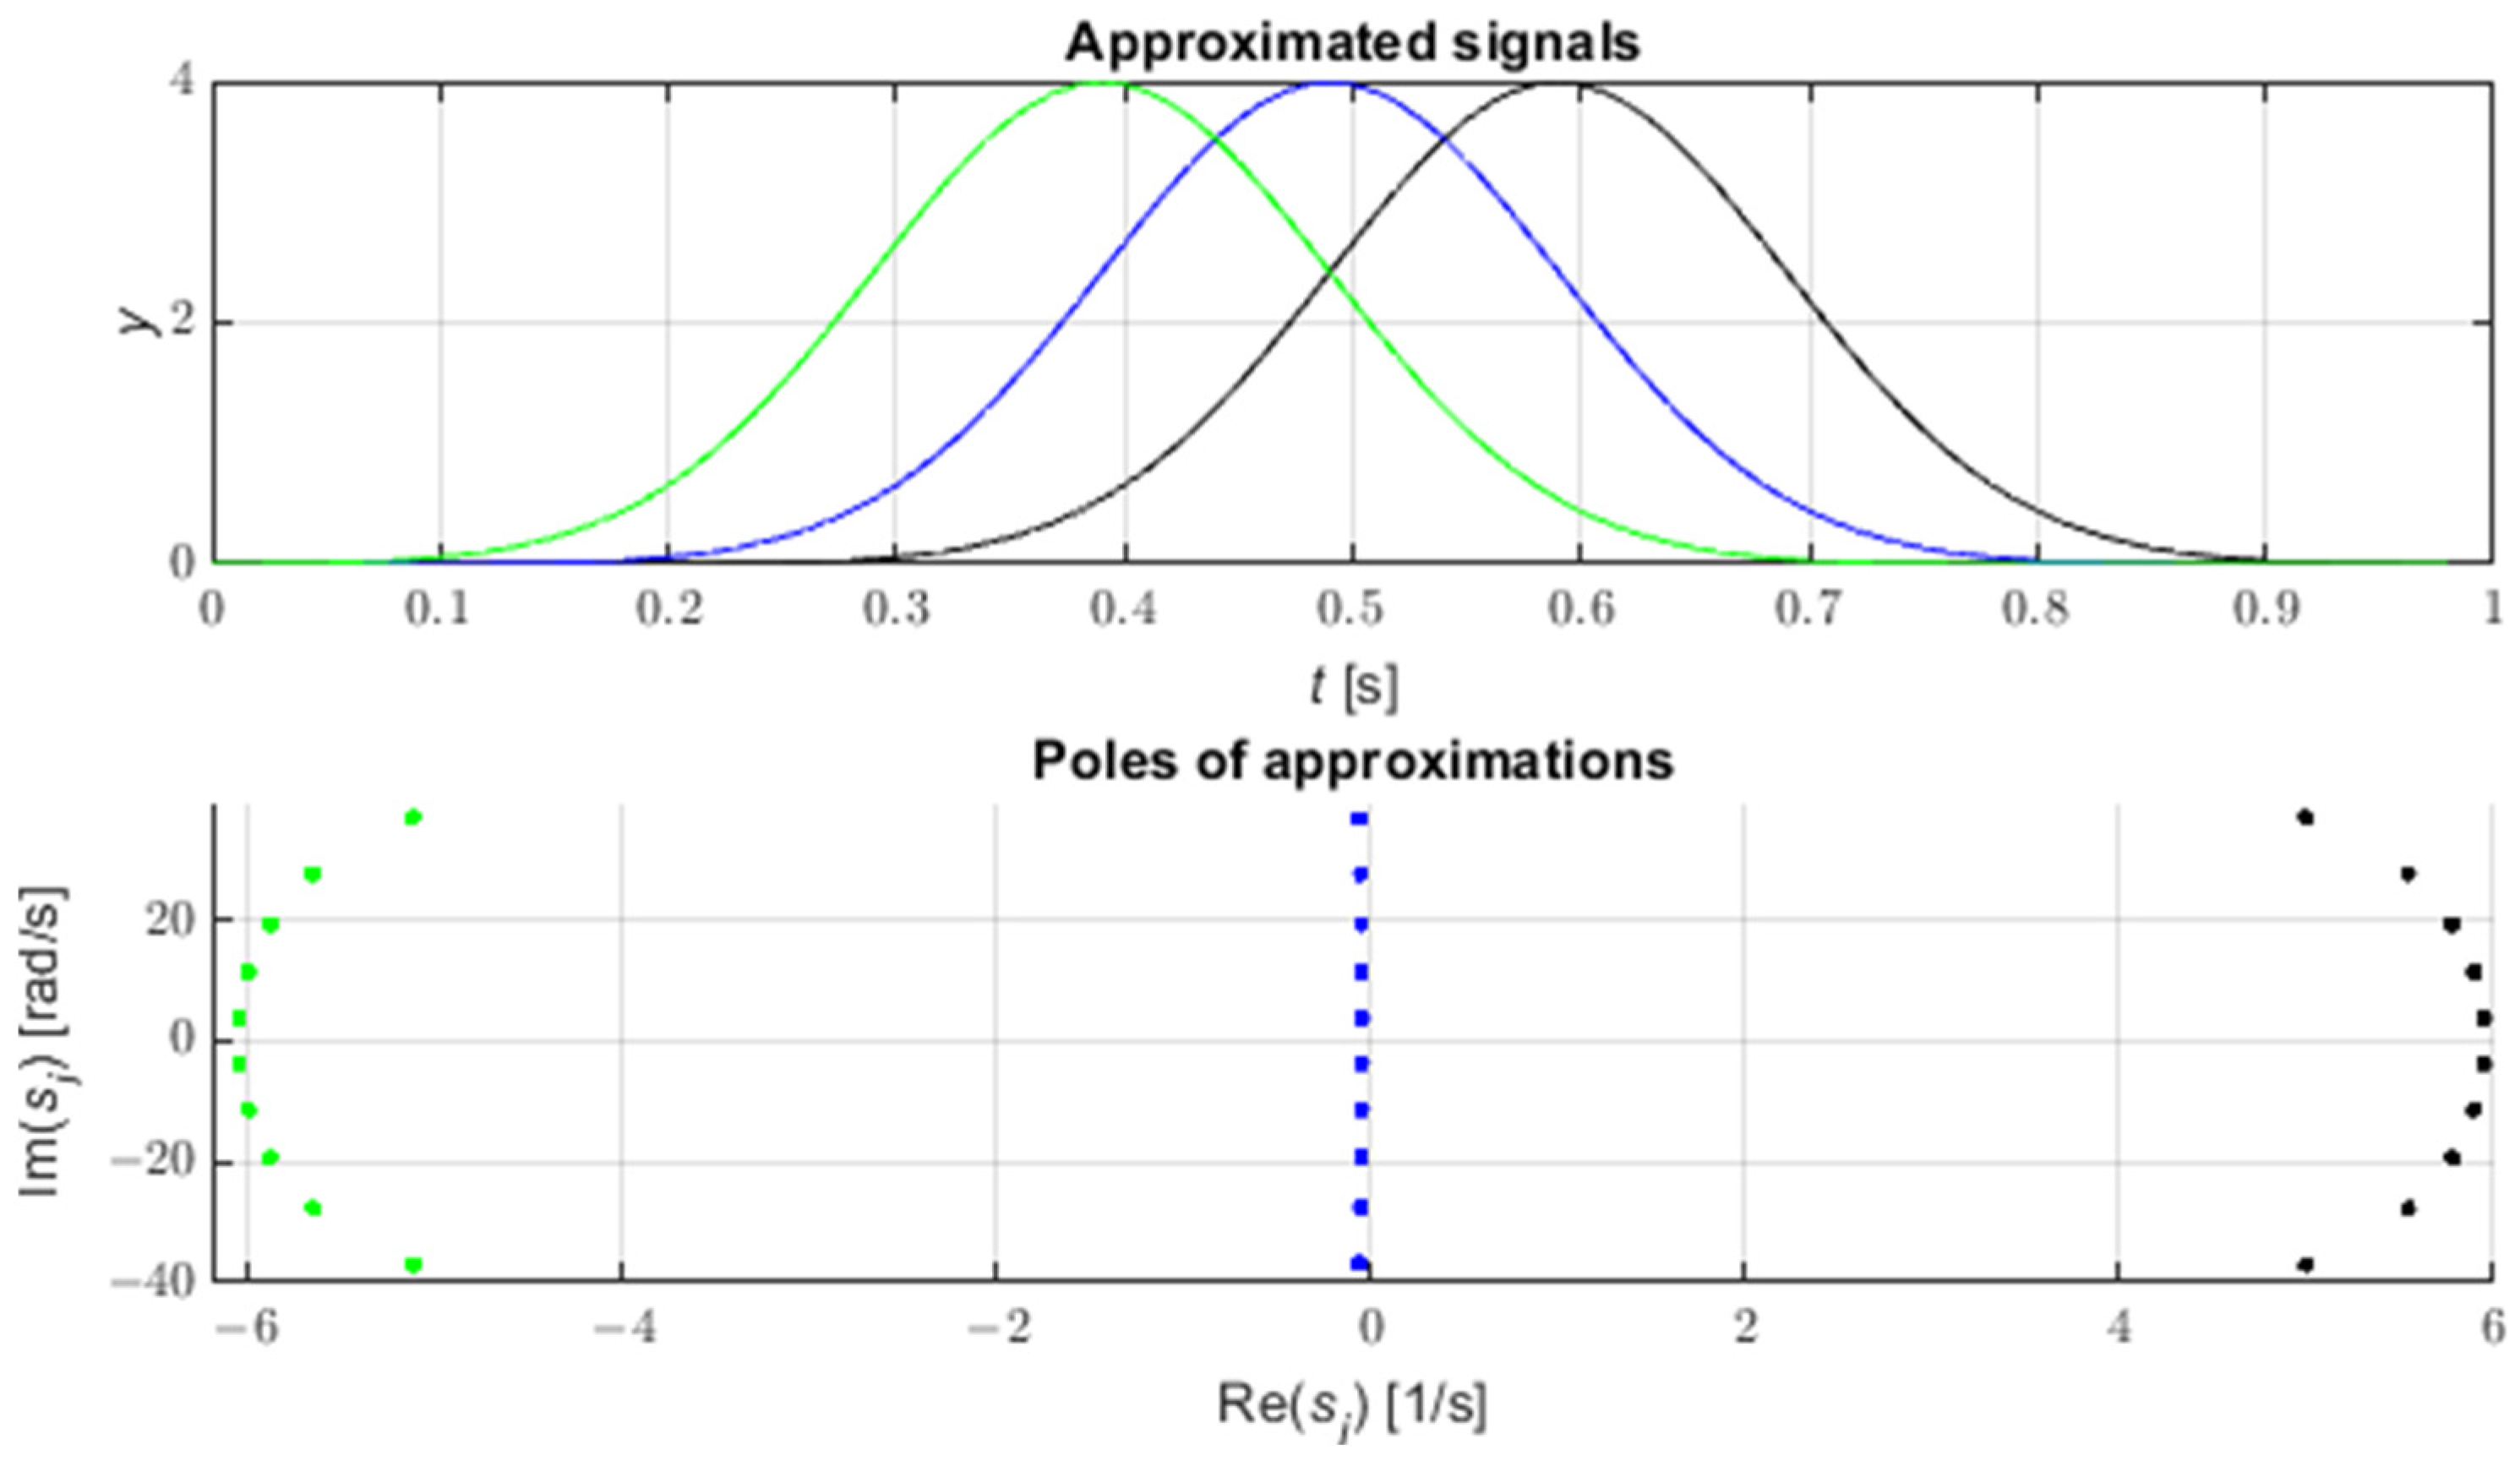
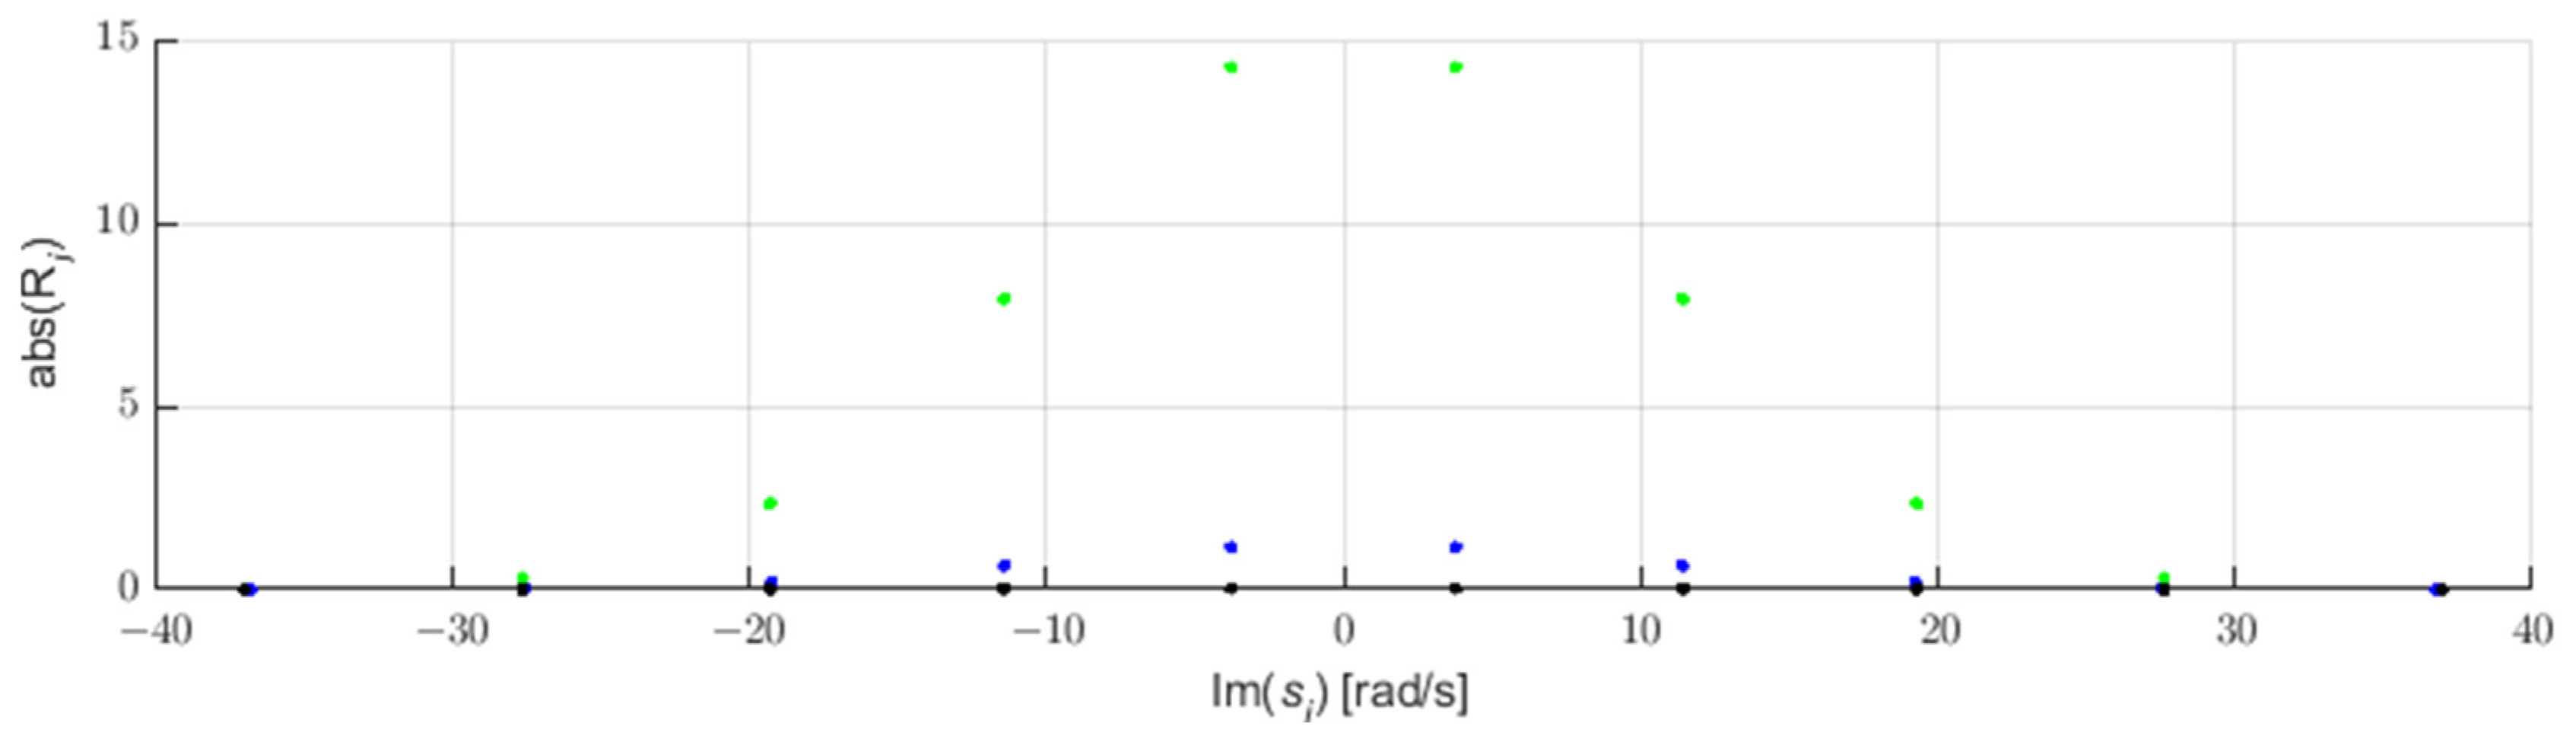
- Ri—residua or complex amplitudes of components,
- Si—complex poles and
- M—number of approximation components.
- Ts—sampling period and
- N—number of samples.
- U—unitary matrix of ( − ) × ( − ) size,
- Σ—rectangular diagonal matrix of singular values with size of ( − ) × ( + 1) and
- V—unitary matrix of ( + 1) × ( + 1) size.
- Matrix of size ( − ) × is created by leaving columns corresponding to the singular values satisfying Condition (7) and removing the others;
- Square diagonal matrix is formed by removing the columns and rows of the matrix, which contain singular values that do not satisfy Condition (7);
- Matrix of size ( + ) × is formed by leaving the columns corresponding to the singular values satisfying Condition (7) and removing the others.
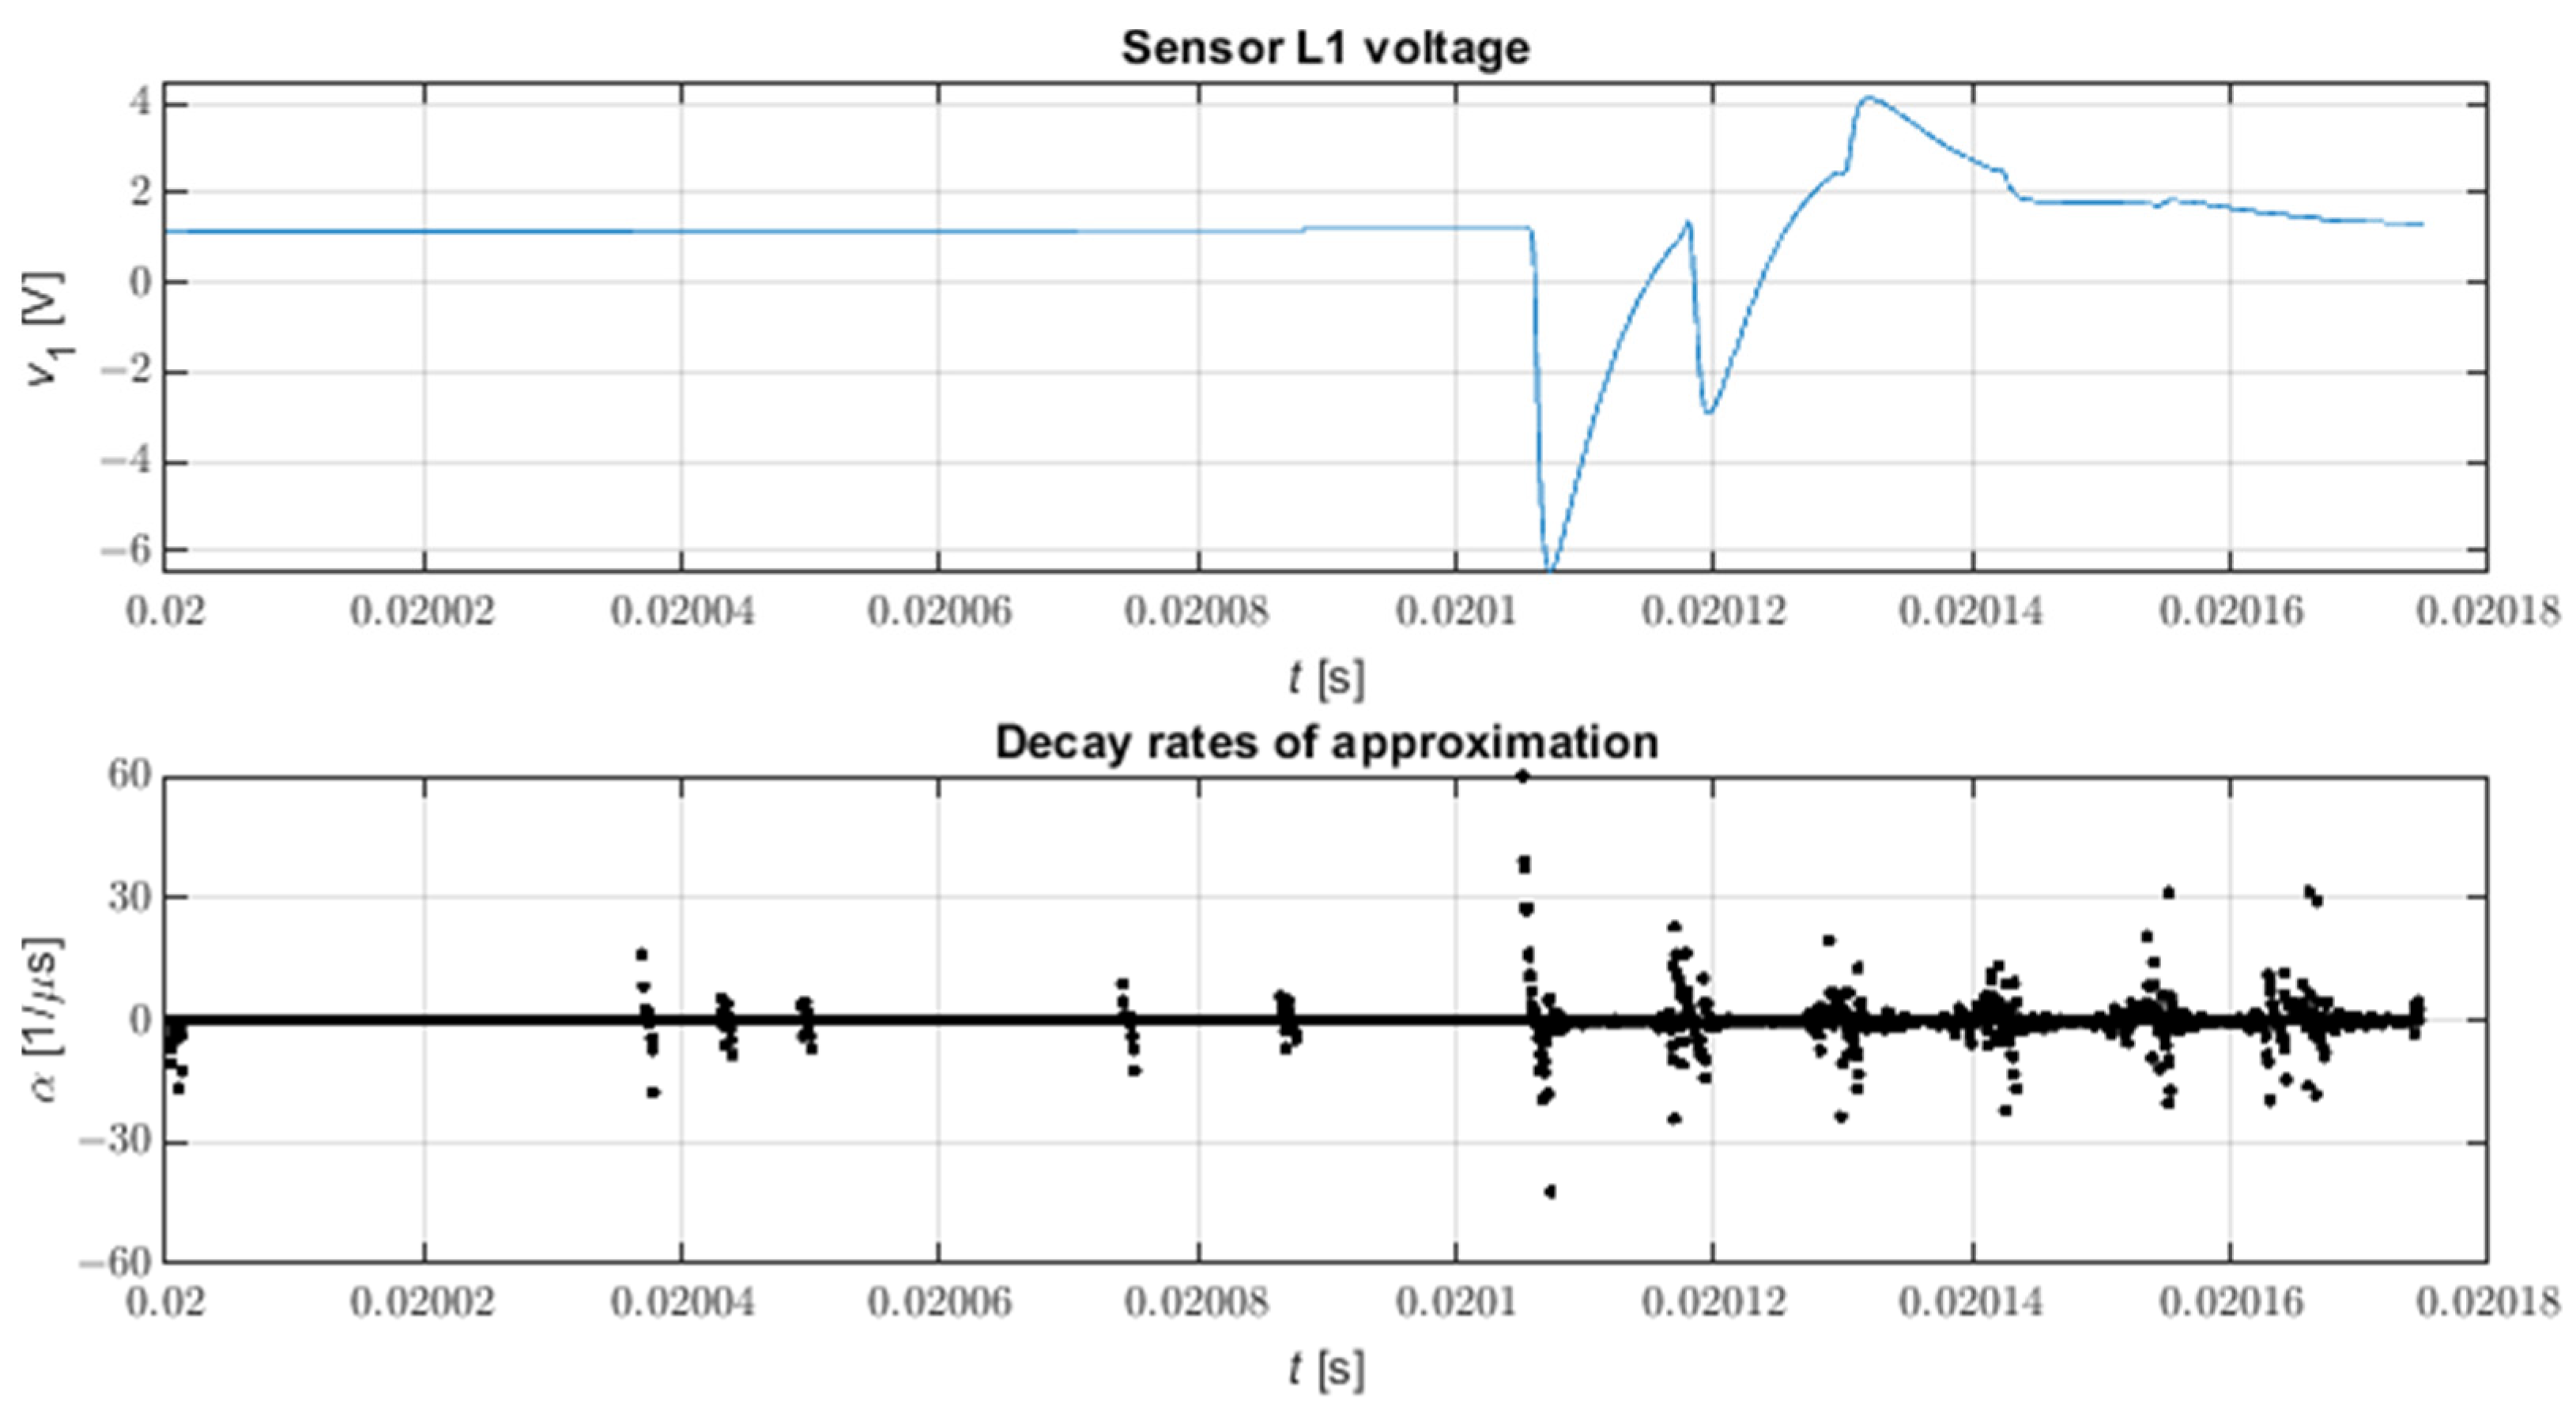
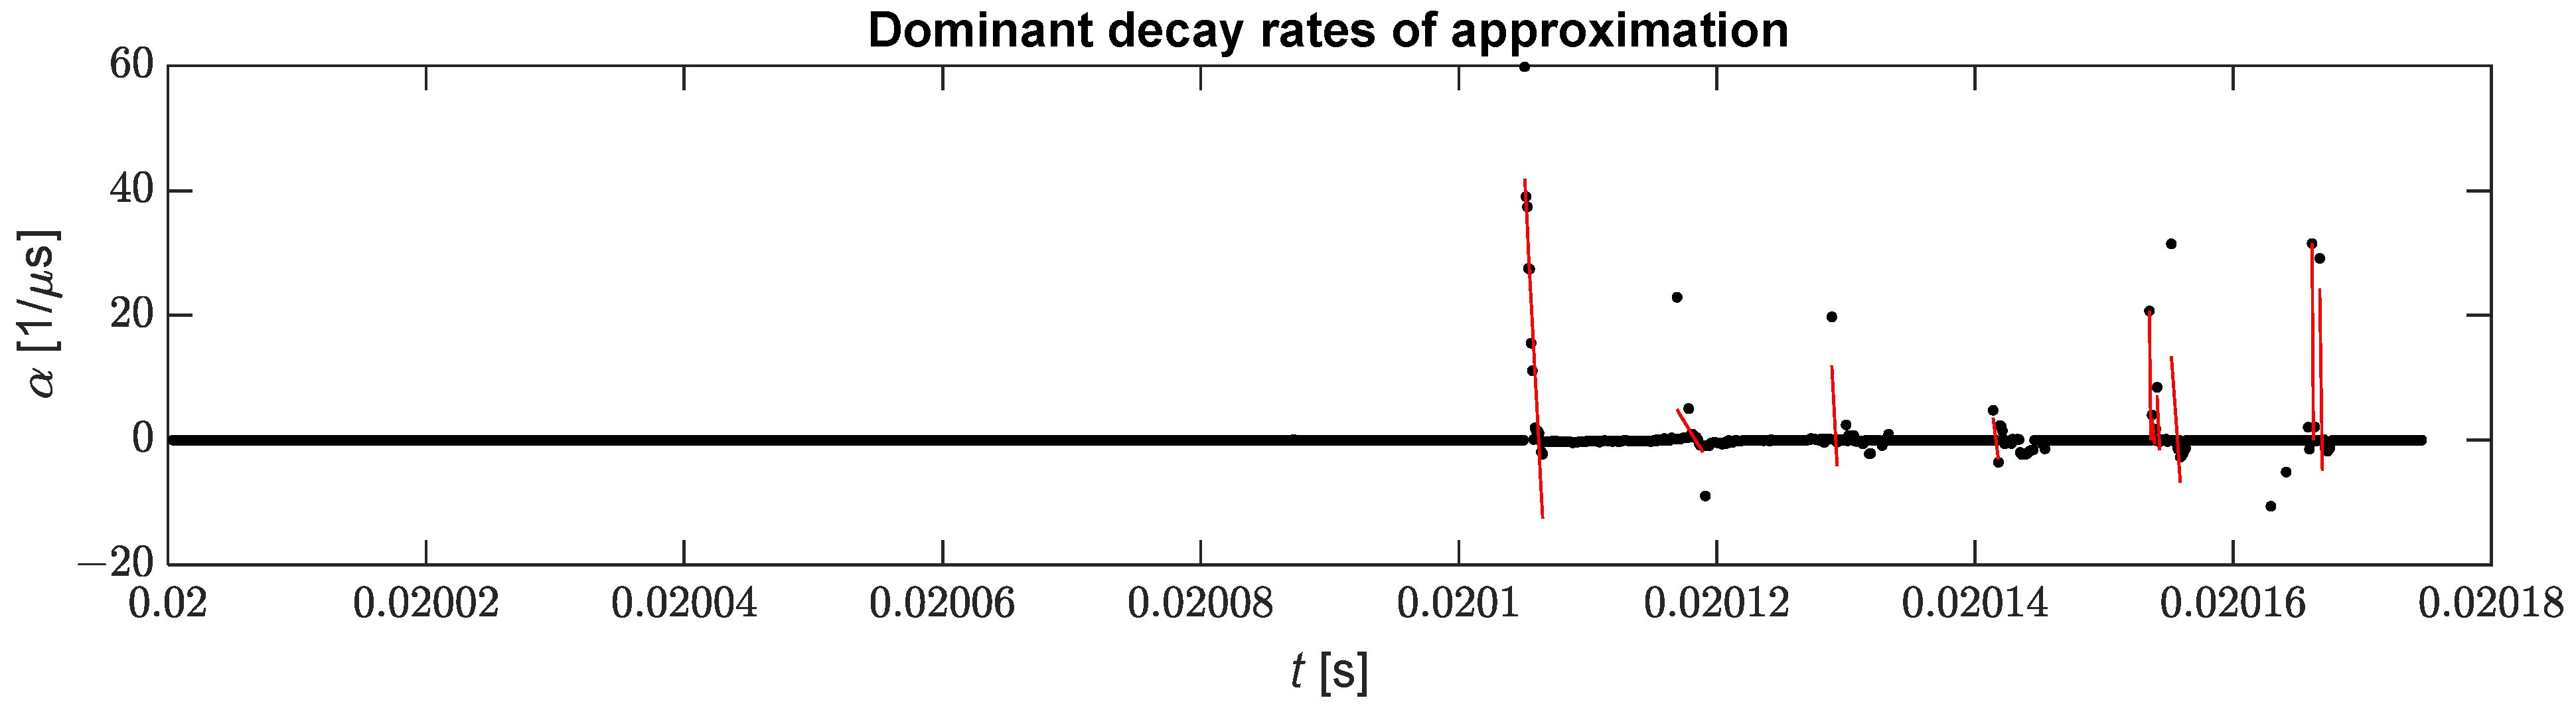
2.2. The Behaviour of the Component Poles in the Vicinity of a Pulse
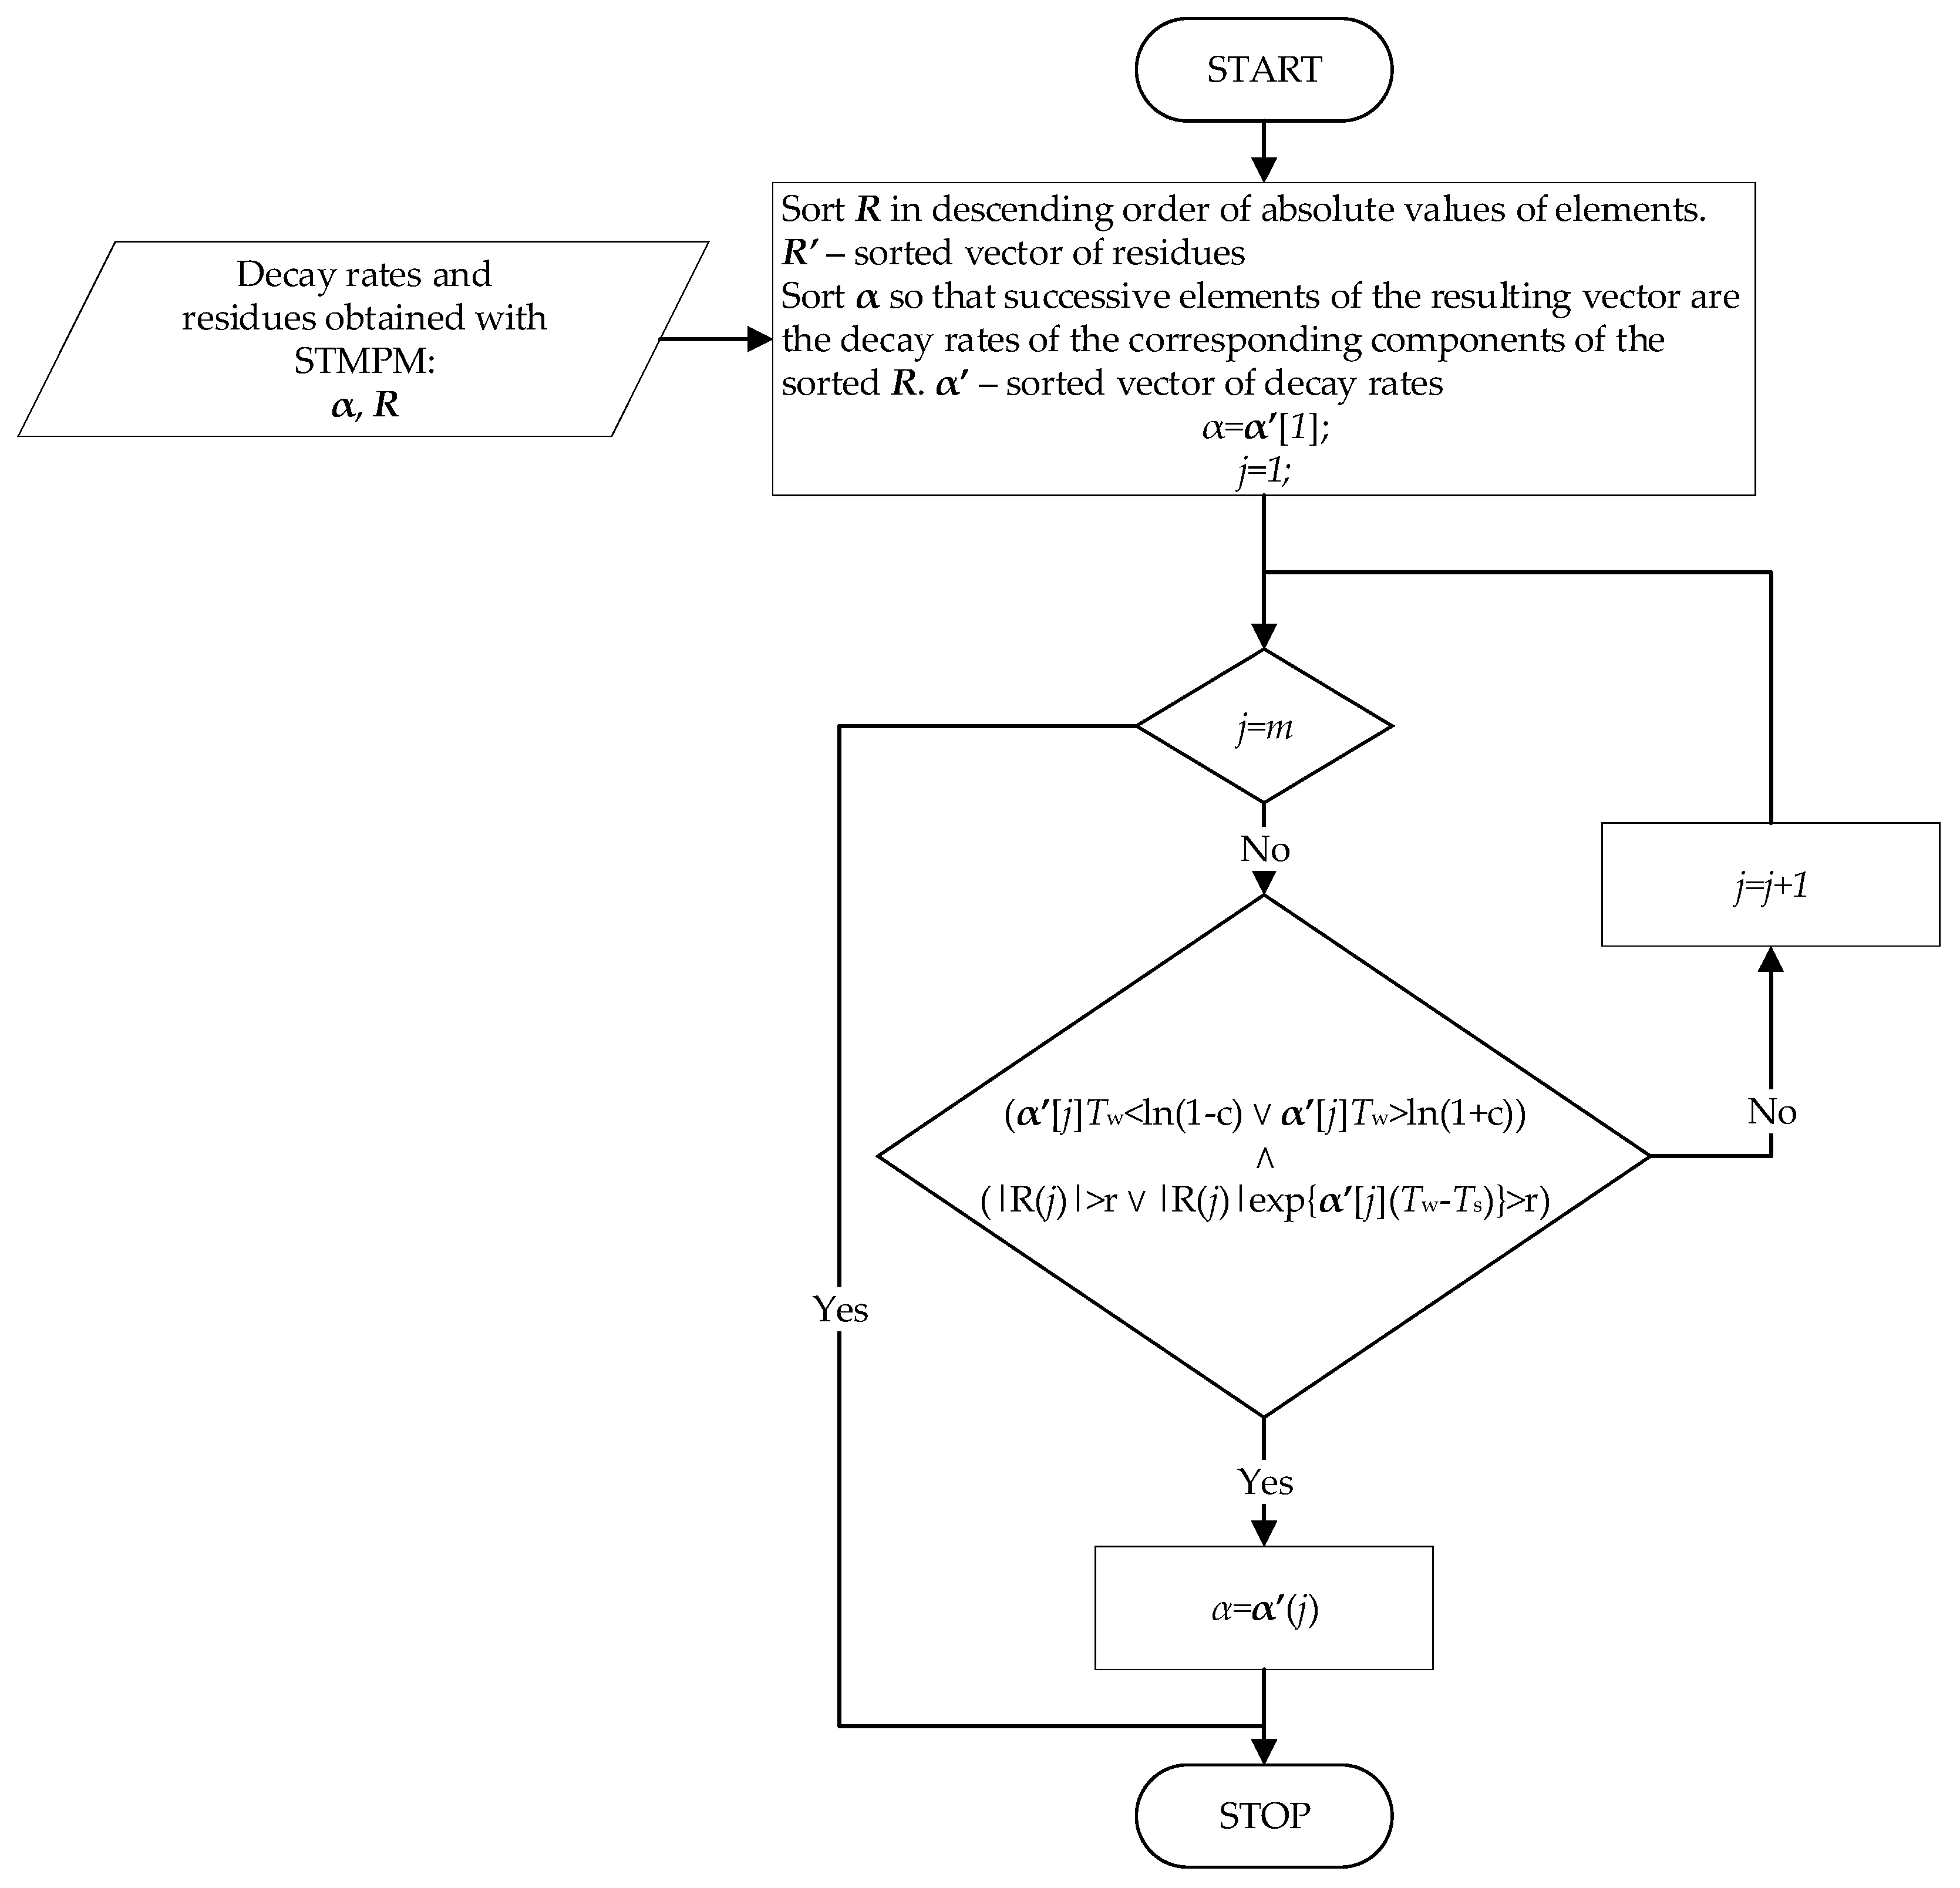
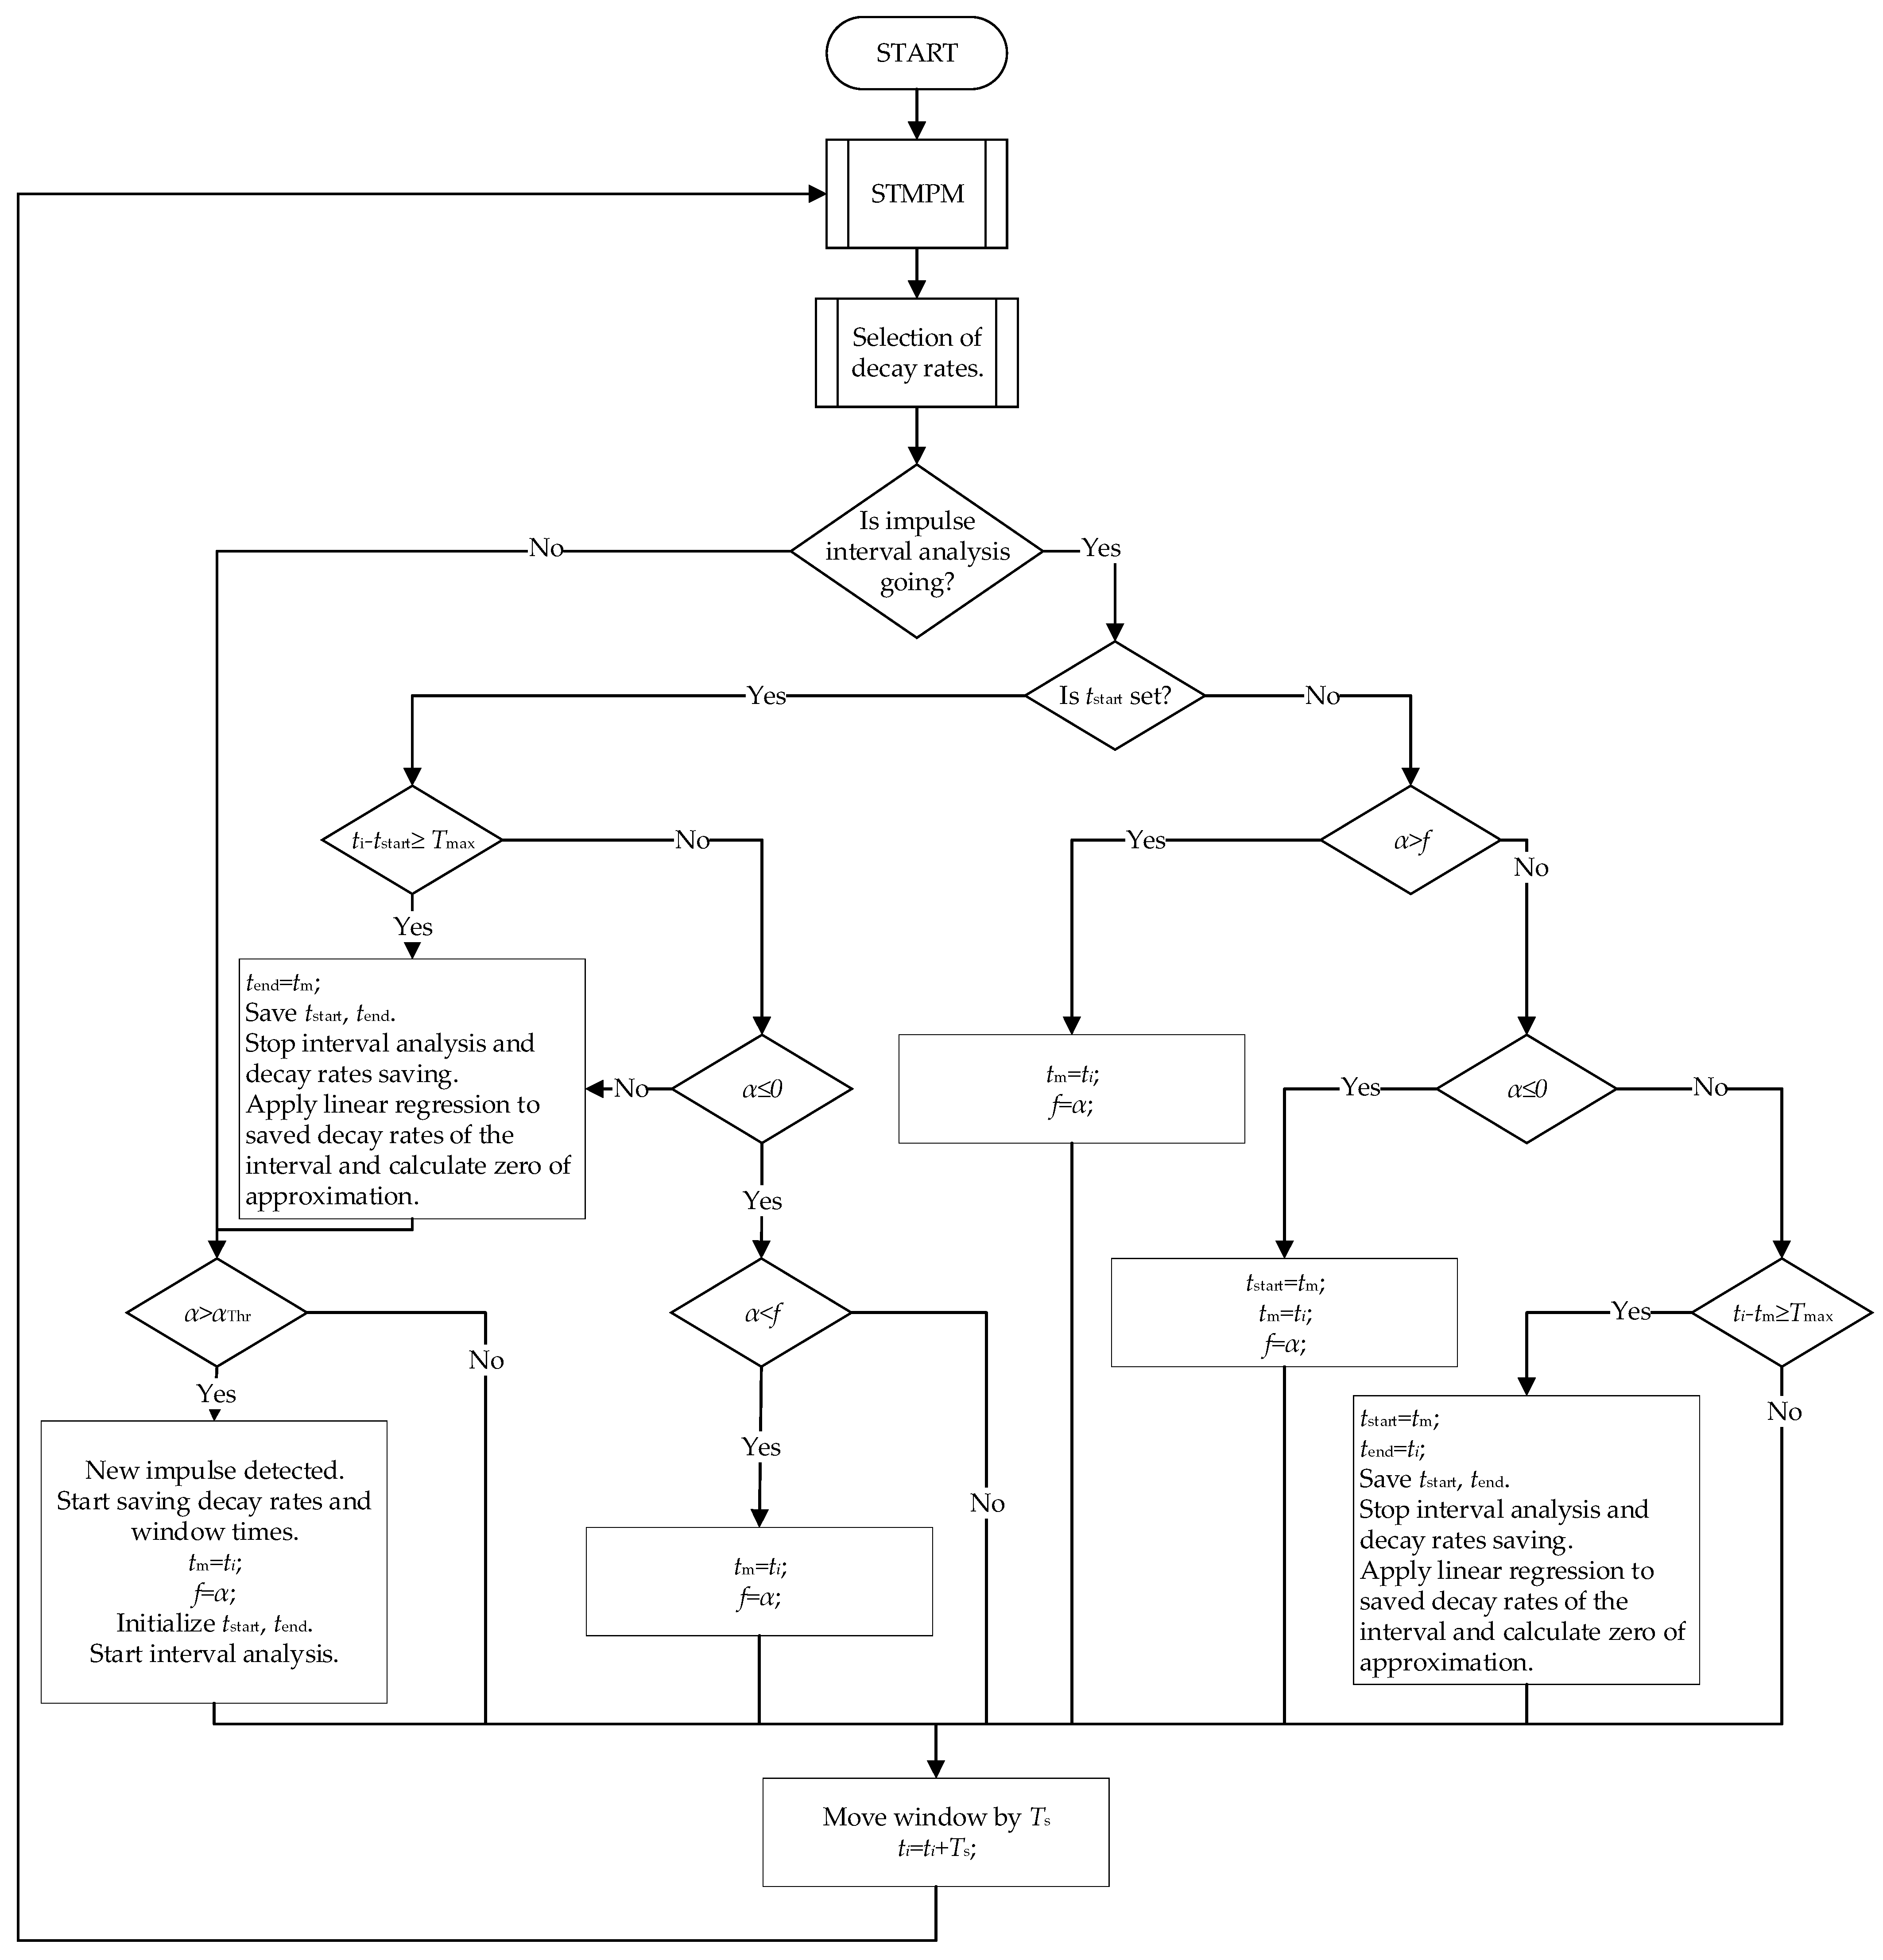
2.3. The Real-Time Pulse Detection Algorithm
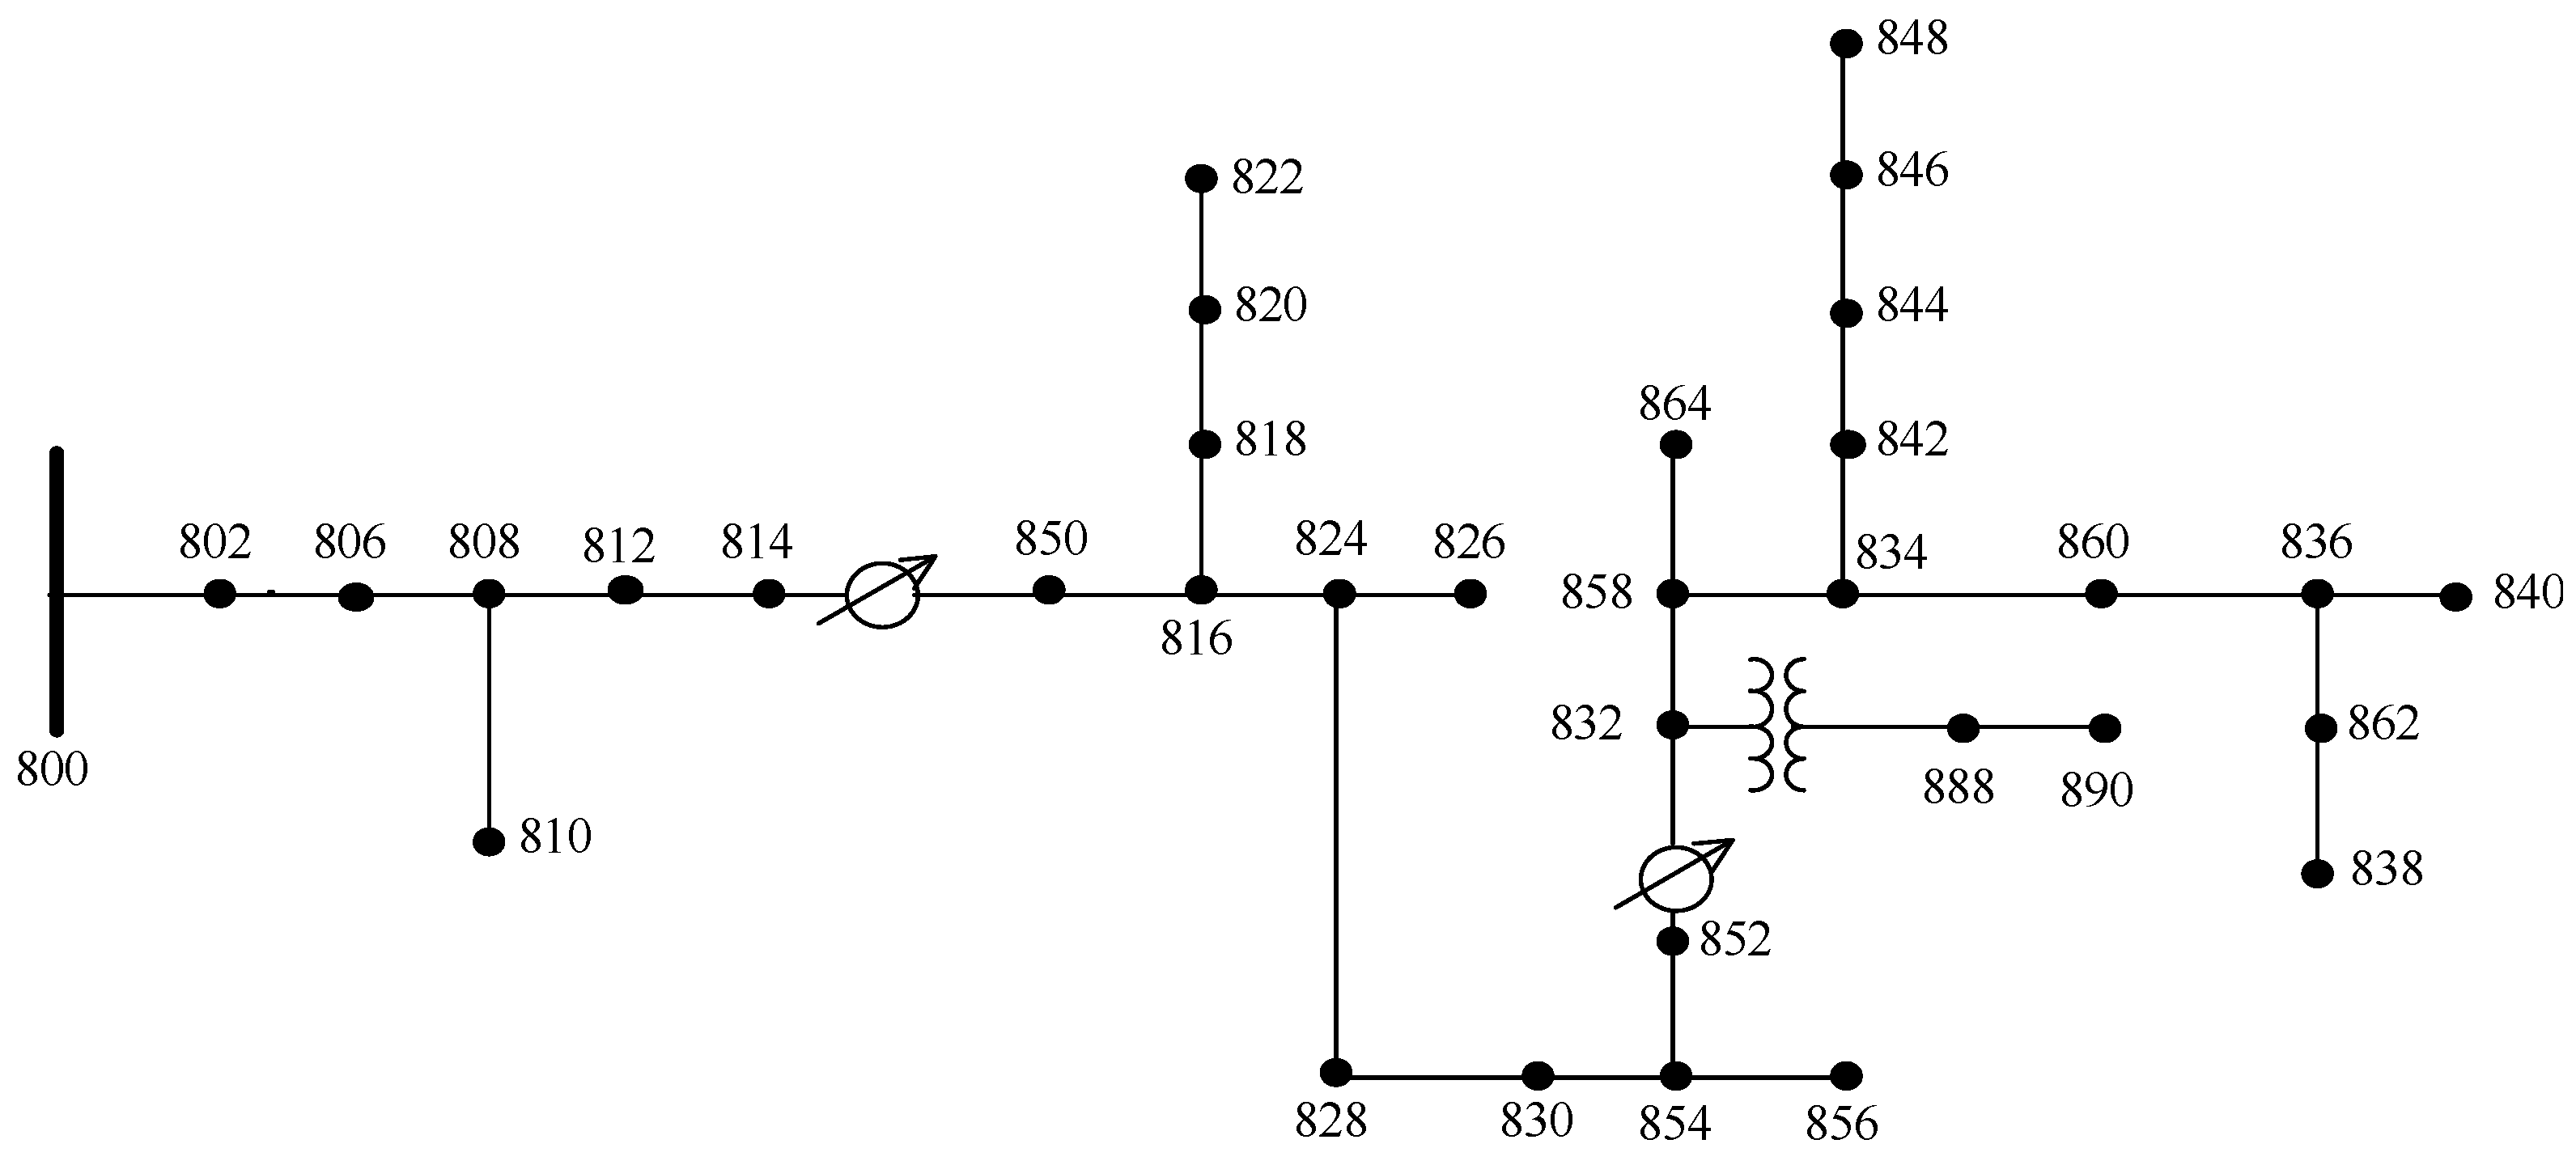
2.4. The Adapted IEEE 34-Bus Test Feeder
- Grid voltage was changed from 24.9 kV to 16.5 kV;
- All sections of power lines were assumed to be overhead lines with the same parameters;
- Voltage regulators were removed;
- The distributed loads were assumed to be lumped at buses at the far end of the loaded lines;
- Loads were connected to the medium voltage grid via distribution transformers;
- High/medium voltage transformer neutral point was disconnected from grounding.
- 50 Hz frequency;
- 115.5 kV line voltage;
- Resistance 0.00227 Ω.
- Symmetrical source with phase shift of L1 phase equal to 0°.
- Voltage ratio 115.5/16.5;
- Vector group of high voltage winding Yg;
- Vector group of low voltage winding D11;
- Power 6.3 MVA;
- Relative short-circuit voltage 7.5%;
- Short-circuit resistance equal to 0.49% of equivalent impedance.
- Voltage ratio 15.75/0.4;
- Vector group of high voltage winding D11;
- Vector group of low voltage winding Yg;
- Power 630 kVA;
- Relative short-circuit voltage 6%;
- Short-circuit resistance equal to 17.2% of equivalent impedance.
- Three-phase line without neutral;
- One conductor per phase;
- Conductor diameter ;
- T/D ratio 0.311;
- DC resistance 0.5939 Ω/km;
- Horizontal positions of conductors ;
- Vertical positions of conductors ;
- Ground resistivity .
3. Results
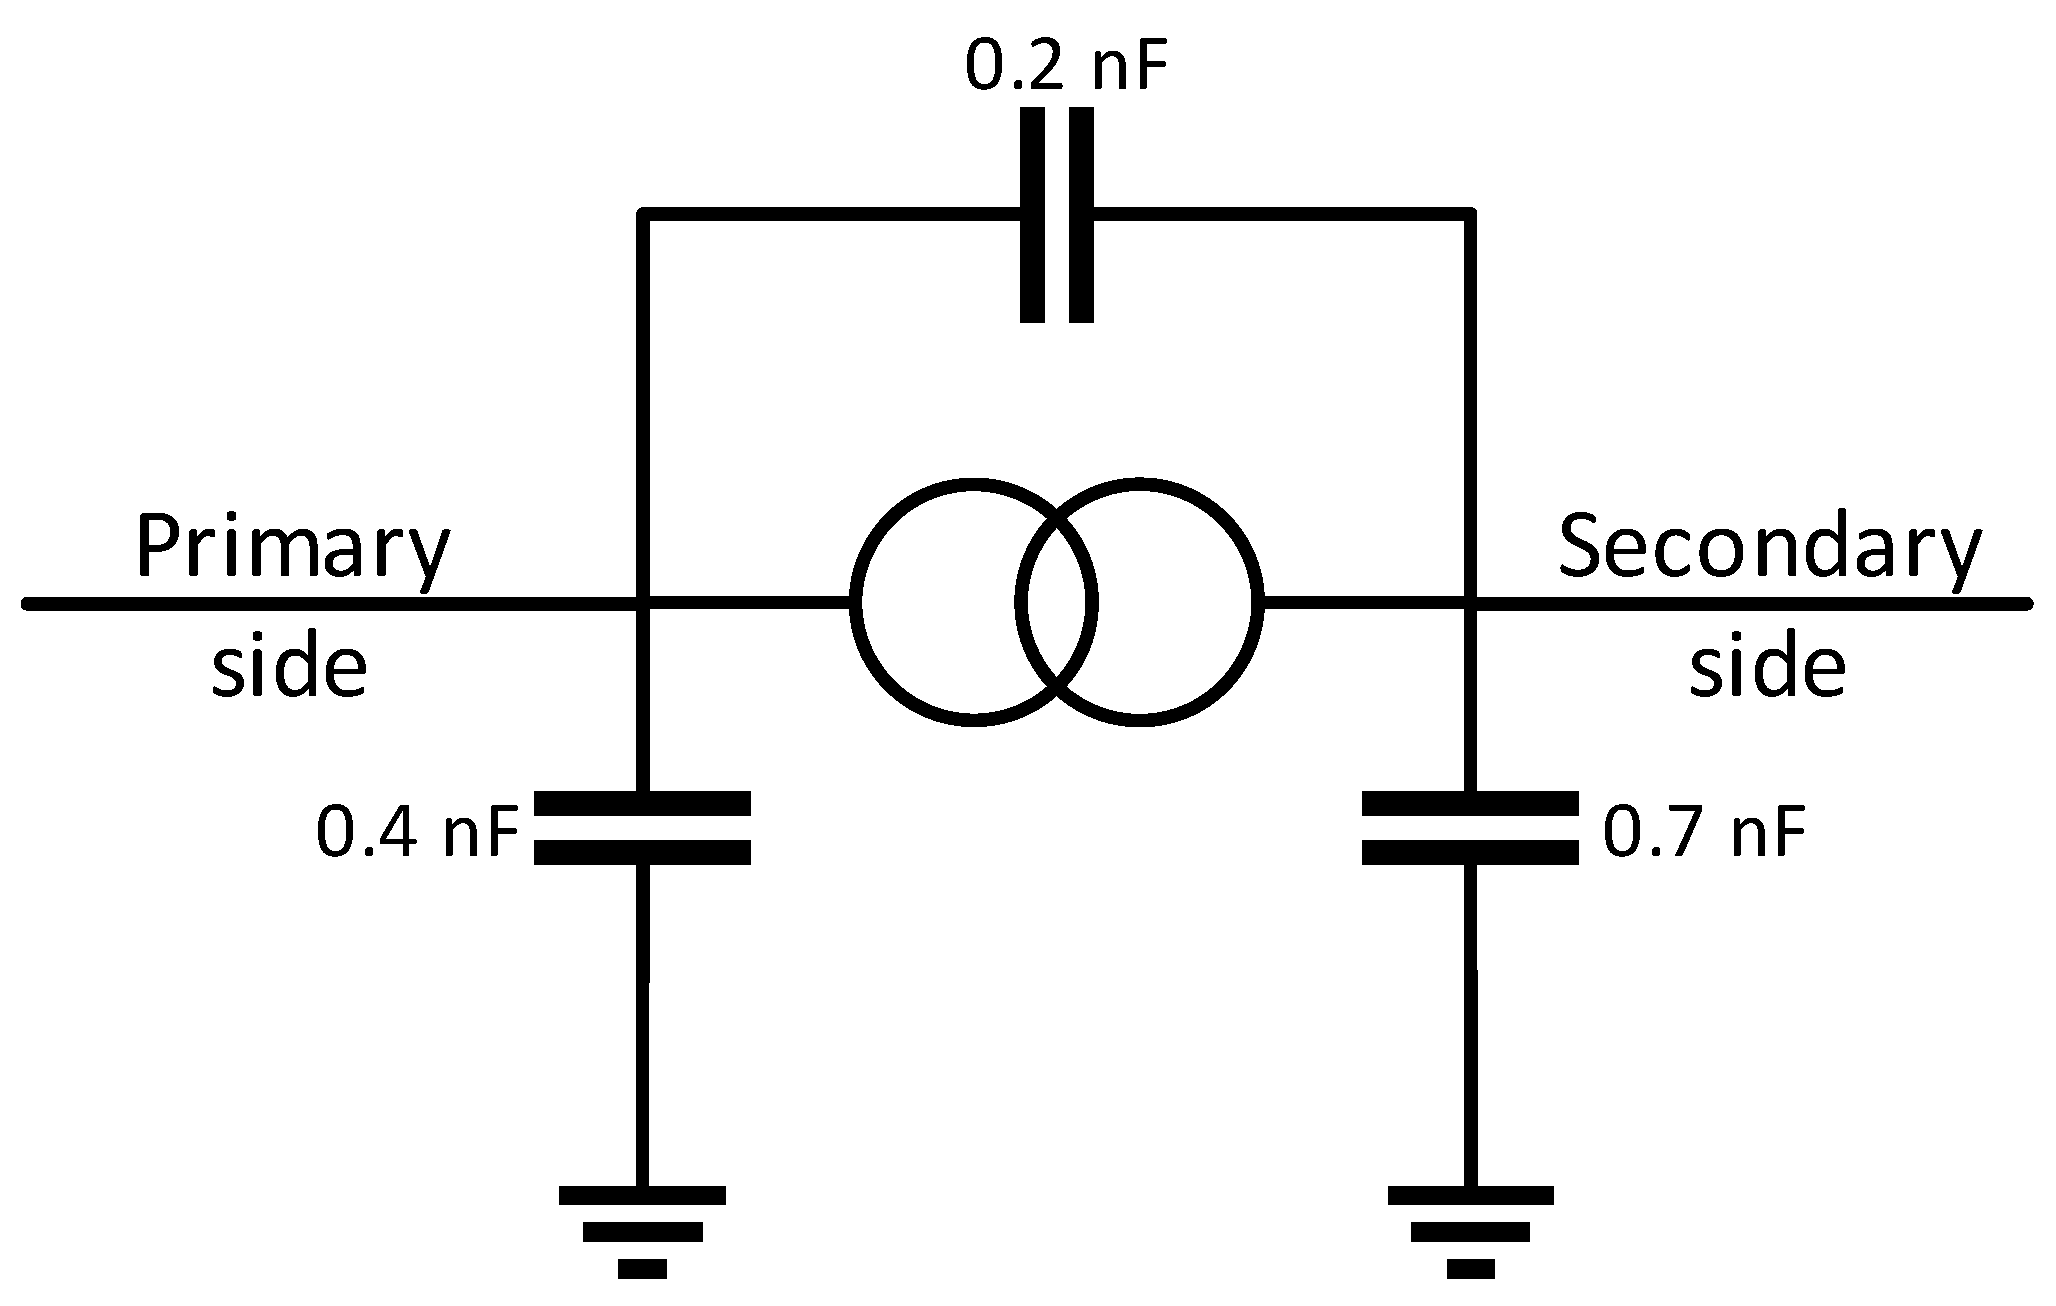
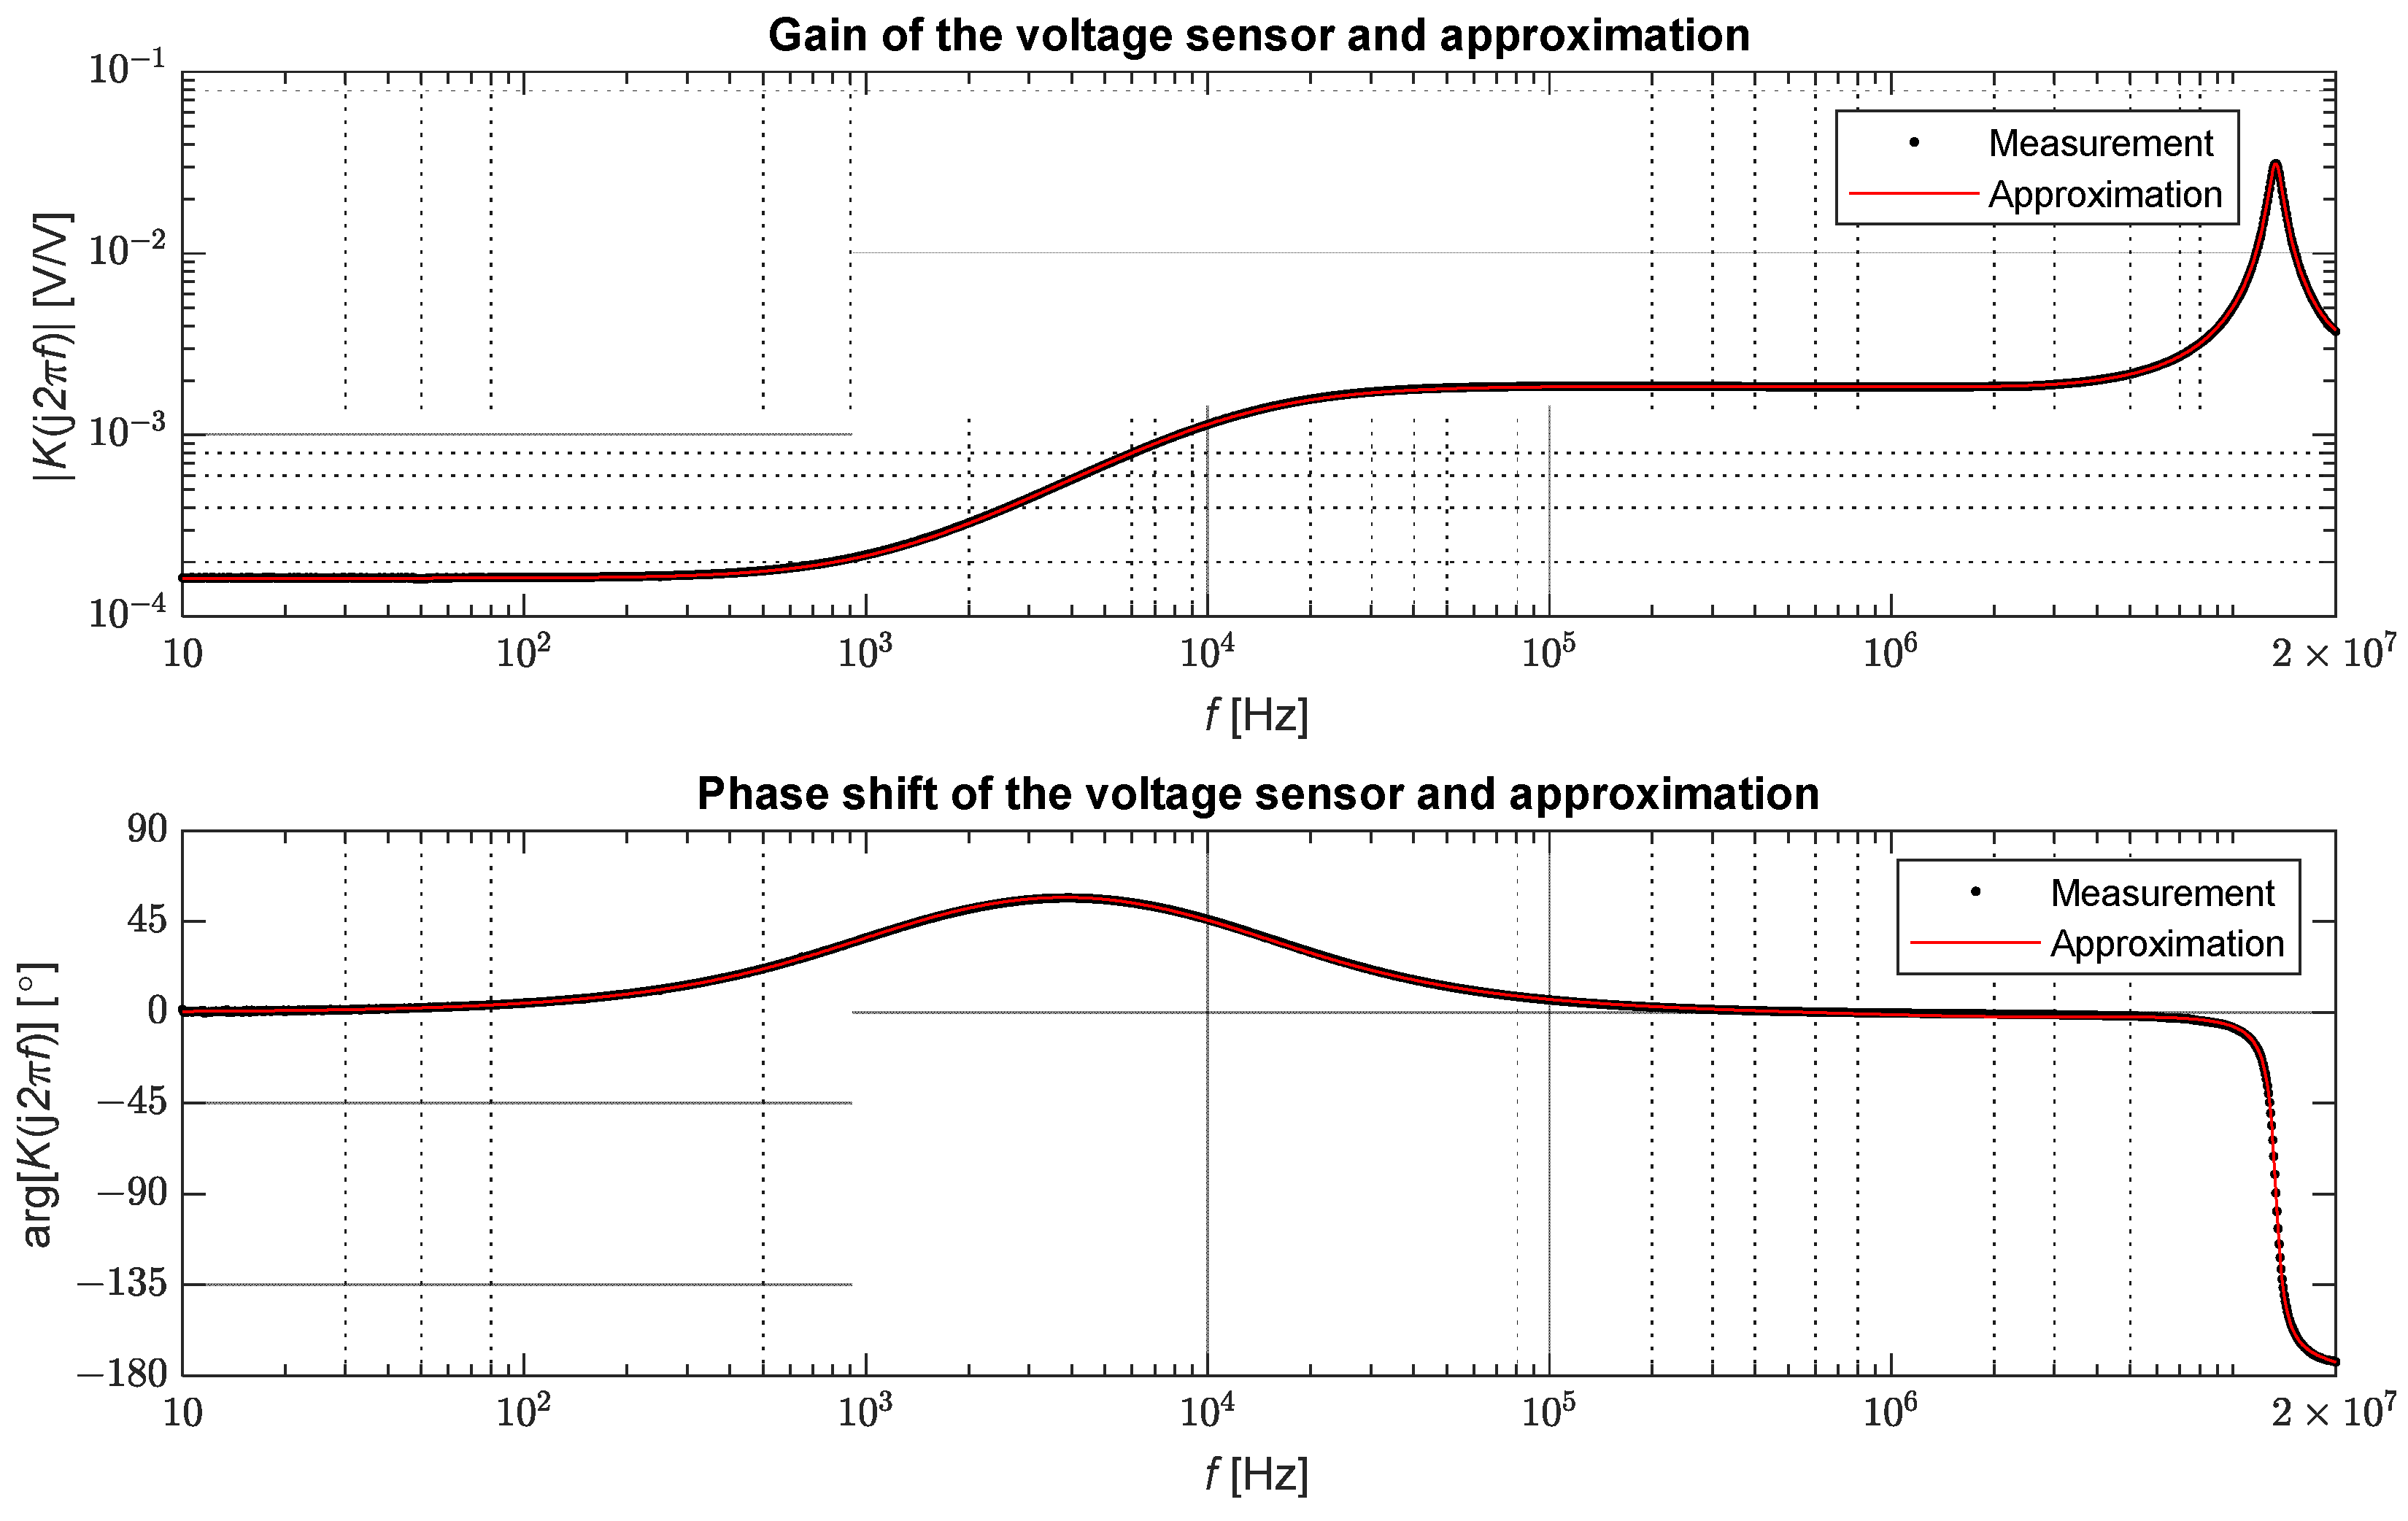
3.1. Measurements of the Transmission Characteristics of the Medium Voltage Sensor
- —voltage on the primary side of the sensor,
- —voltage on the secondary side of the sensor,
- —the order of numerator,
- —the order of denominator and
- —coefficients of polynomials of the denominator and numerator of the transmittance, successively.
- = 2048—number of measurement frequencies
- —measured gain of the sensor at pulsation and
- —measured phase shift of the sensor at pulsation .

| k, l | ||
|---|---|---|
| 0 | 3.50762 × 1044 | 5.71764 × 1040 |
| 1 | 4.35318 × 1039 | 8.04342 × 1036 |
| 2 | 3.17994 × 1032 | 5.44075 × 1029 |
| 3 | 1.16707 × 1024 | 3.33434 × 10²⁰ |
| 4 | 5.18422 × 10¹⁶ | −2.64792 × 10¹³ |
| 5 | 3.83618 × 10⁷ | - |
| 6 | 1 | - |
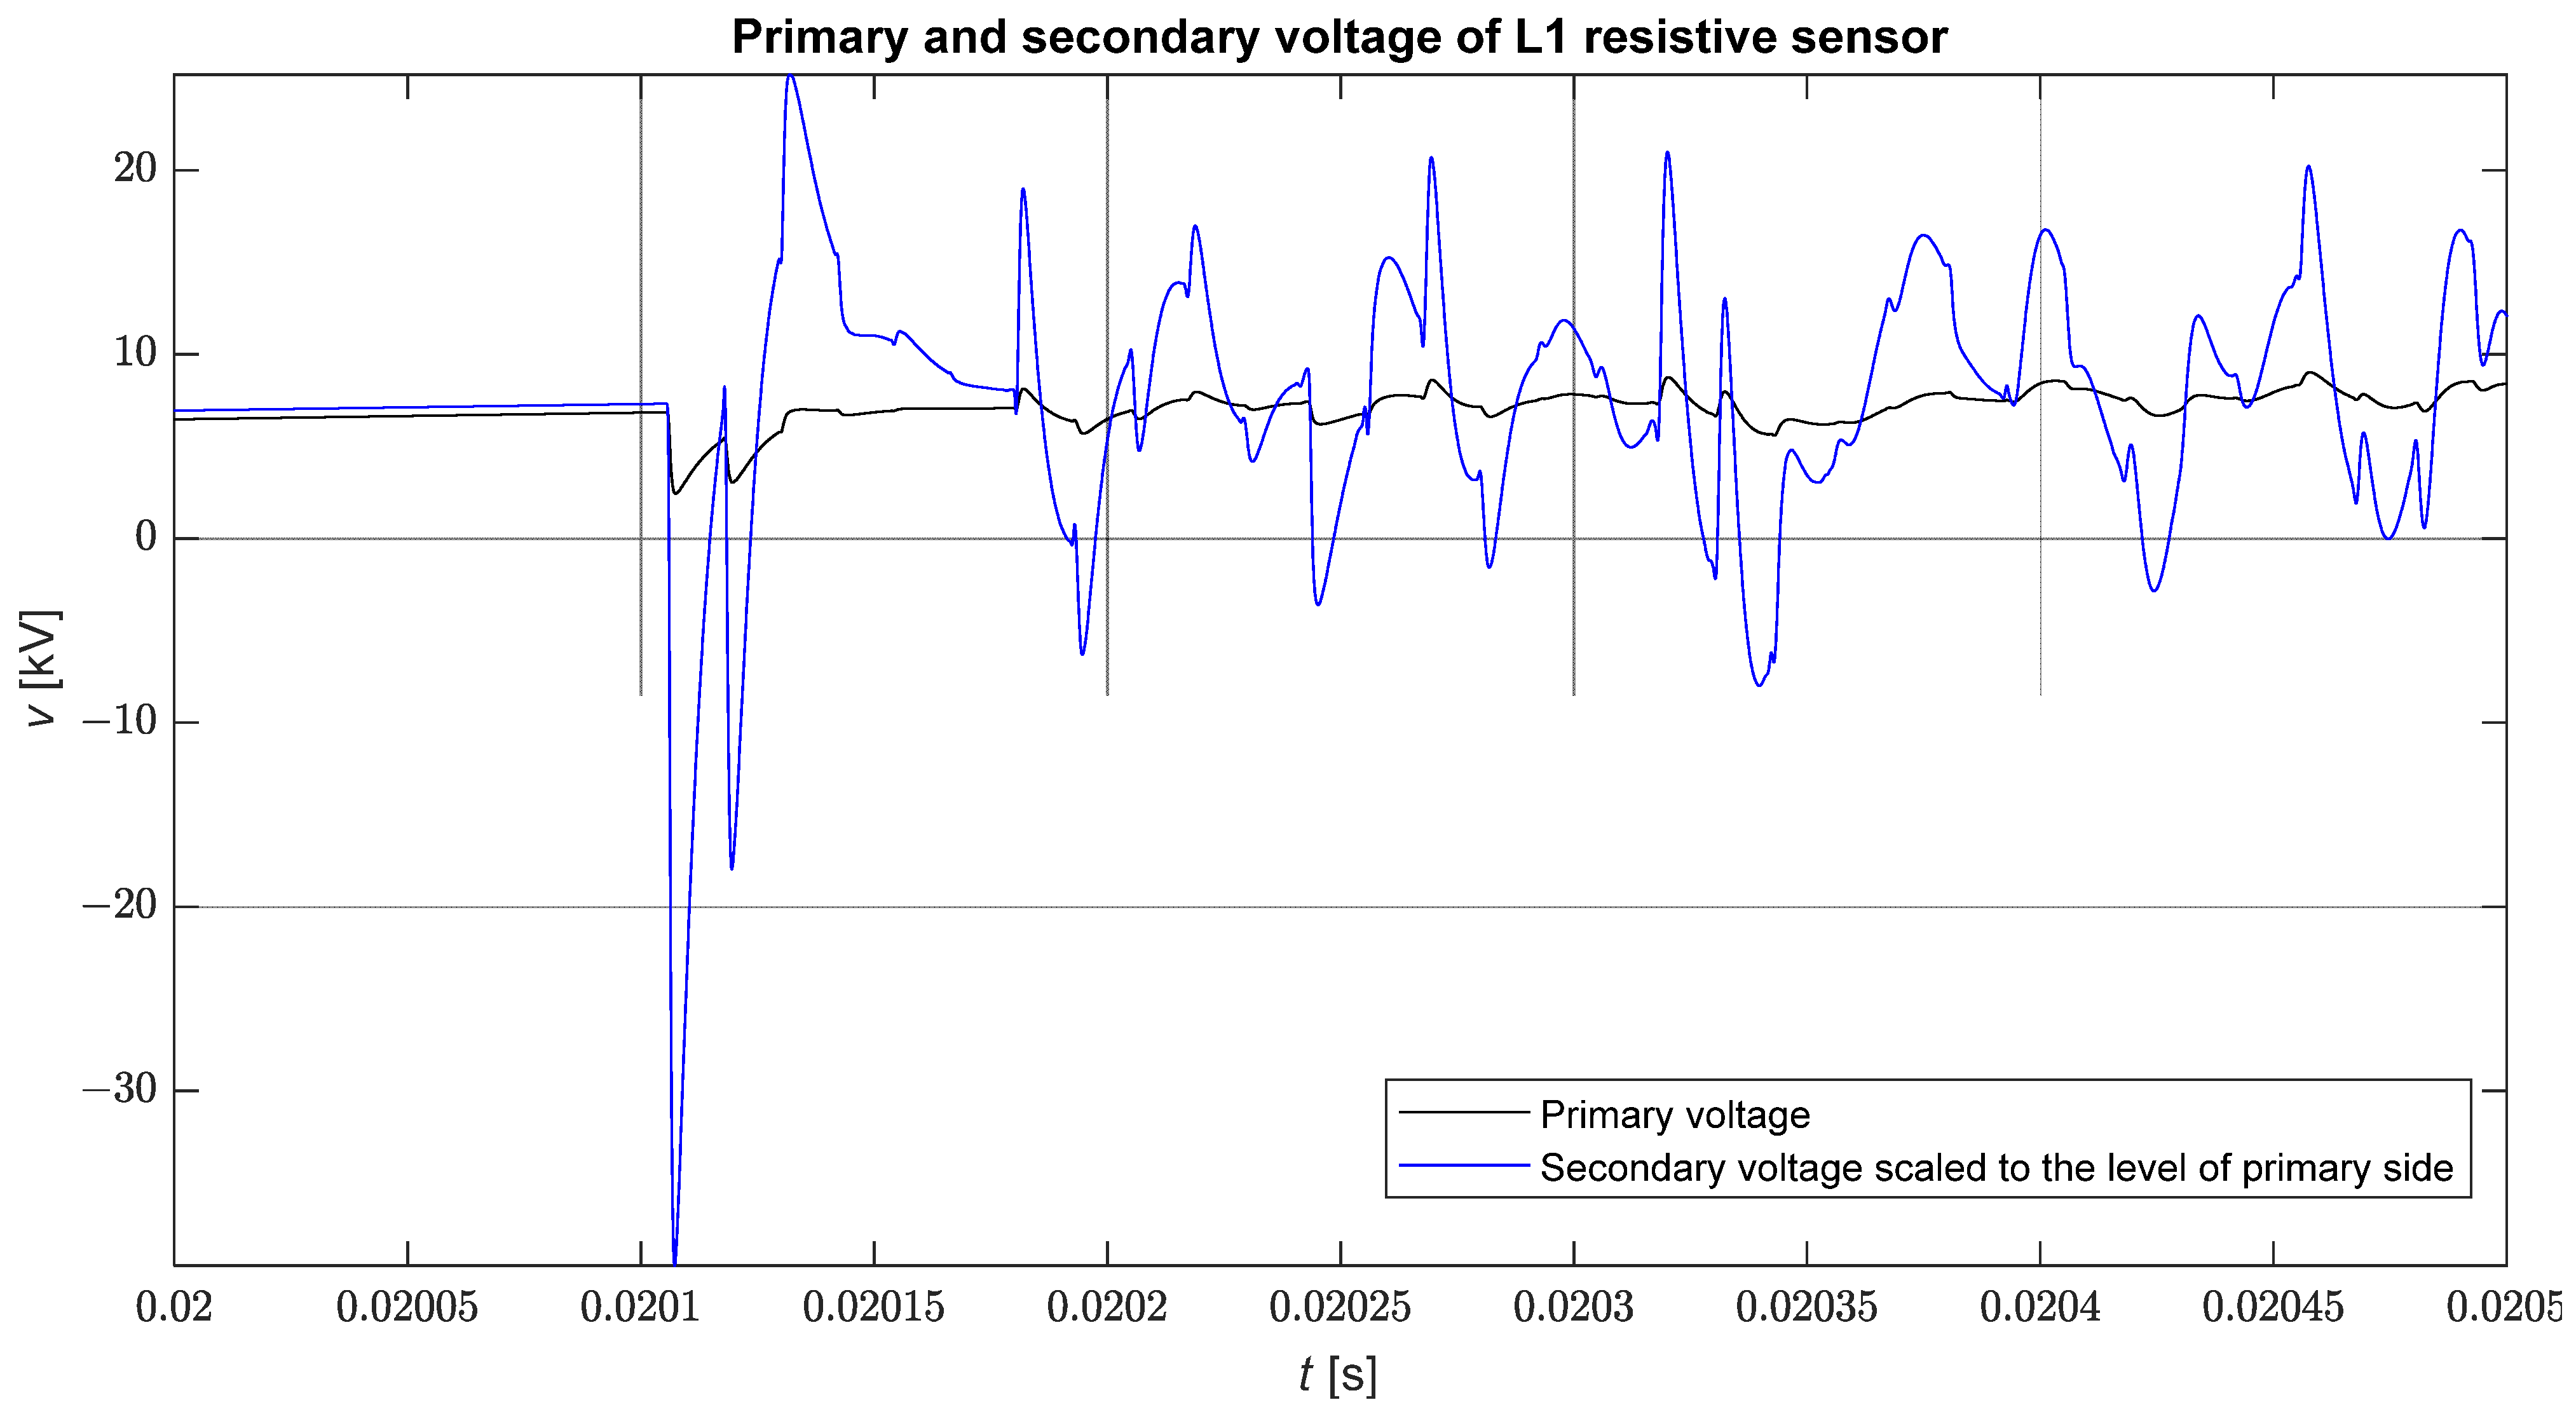
3.2. The Identification of Short-Circuit Impulses Using STMPM
- —arrival moment according to STMPM,
- —fault moment,
- —distance of the short-circuit location from the substation and
- = 299,552,300 m/s—propagation speed of fault waves measured for a short circuit at the furthest node (838).
- = 5—number of samples per time window;
- = 2—pencil parameter;
- = 6—the number of accurate significant decimal digits of measurement;
- —pulse detection threshold;
- —maximum pulse width;
- —window width;
- —sampling period;
- —amplitude threshold.
| K3E | K3 | K2E | K2 | K1E | |||||||||||
|---|---|---|---|---|---|---|---|---|---|---|---|---|---|---|---|
| Source Phase | L1 | L2 | L3 | L1 | L2 | L3 | L1 | L2 | L3 | L1 | L2 | L3 | L1 | L2 | L3 |
| 0° | 0.41 | 0.34 | 0.33 | 0.41 | 0.34 | 0.32 | 0.90 | 0.17 | 0.17 | 0.49 | 0.38 | 0.31 | 0.26 | 0.33 | 0.24 |
| 15° | 0.46 | 0.32 | 0.20 | 0.46 | 0.32 | 0.22 | 0.67 | 0.15 | 0.30 | 0.50 | 0.32 | 0.45 | 0.33 | 0.27 | 0.19 |
| 30° | 0.45 | 0.30 | 0.38 | 0.46 | 0.29 | 0.35 | 0.64 | 0.06 | 0.60 | 0.57 | 0.31 | 0.23 | 0.42 | 0.30 | 0.72 |
| 45° | 0.48 | 0.33 | 0.52 | 0.48 | 0.32 | 0.53 | 0.52 | 0.05 | 0.76 | 0.70 | 0.31 | 0.19 | 0.40 | 0.28 | 0.49 |
| 60° | 0.38 | 0.32 | 0.52 | 0.38 | 0.32 | 0.52 | 0.52 | 0.01 | 2.84 | 1.47 | 0.29 | 0.29 | 0.38 | 0.11 | 0.44 |
| 75° | 0.38 | 0.27 | 0.51 | 0.38 | 0.28 | 0.51 | 0.46 | 0.69 | 0.44 | 1.20 | 0.19 | 0.46 | 0.37 | 0.16 | 0.44 |
| 90° | 0.36 | 0.40 | 0.50 | 0.36 | 0.43 | 0.50 | 0.34 | 0.39 | 0.20 | 0.49 | 0.33 | 0.45 | 0.35 | 0.27 | 0.40 |
| 105° | 0.39 | 0.39 | 0.48 | 0.39 | 0.39 | 0.47 | 0.12 | 0.28 | 0.21 | 0.53 | 0.25 | 0.53 | 0.37 | 0.22 | 0.41 |
| 120° | 0.37 | 0.43 | 0.37 | 0.36 | 0.43 | 0.37 | 0.17 | 0.78 | 0.15 | 0.44 | 0.27 | 0.54 | 0.34 | 0.23 | 0.36 |
| 135° | 0.40 | 0.44 | 0.34 | 0.40 | 0.44 | 0.34 | 0.28 | 0.24 | 0.27 | 0.24 | 0.41 | 0.58 | 0.31 | 0.32 | 0.33 |
| 150° | 0.72 | 0.44 | 0.32 | 0.76 | 0.44 | 0.32 | 0.63 | 0.25 | 0.32 | 0.46 | 0.41 | 0.39 | 0.57 | 0.38 | 0.32 |
| 165° | 0.32 | 0.42 | 0.30 | 0.32 | 0.43 | 0.31 | 0.58 | 0.24 | 0.24 | 0.52 | 0.43 | 0.44 | 0.26 | 0.39 | 0.30 |
4. Discussion
Author Contributions
Funding
Data Availability Statement
Acknowledgments
Conflicts of Interest
References
- Anderson, P.M.; Henville, C.; Rifaat, R.; Johnson, B.; Meliopoulos, S. Pilot Protection Systems. In Power System Protection, 2nd ed.; John Wiley & Sons: Hoboken, NJ, USA, 2022; pp. 509–572. ISBN 978-1-119-51314-8. [Google Scholar]
- Thomas, D.W.P.; Carvalho, R.J.O.; Pereira, E.T. Fault location in distribution systems based on traveling waves. In Proceedings of the 2003 IEEE Bologna Power Tech Conference Proceedings, Bologna, Italy, 23–26 June 2003; pp. 242–266. [Google Scholar] [CrossRef]
- Liu, J.G.; Dong, X.; Chen, X.; Tong, X.; Zhang, X.; Xu, S. Single Phase to Ground Fault Processing. In Fault Location and Service Restoration for Electrical Distribution Systems, 1st ed.; John Wiley & Sons: Singapore, 2016; pp. 163–203. ISBN 978-1-118-95025-8. [Google Scholar]
- Liang, R.; Fu, G.; Zhu, X.; Xue, X. Fault location based on single terminal travelling wave analysis in radial distribution network. Int. J. Electr. Power Energy Syst. 2015, 66, 160–165. [Google Scholar] [CrossRef]
- Borghetti, A.; Bosetti, M.; Di Silvestro, M.; Nucci, C.A.; Paolone, M. Continuous-Wavelet Transform for Fault Location in Distribution Power Networks: Definition of Mother Wavelets Inferred From Fault Originated Transients. IEEE Trans. Power Syst. 2008, 23, 380–388. [Google Scholar] [CrossRef]
- Hizman, H.; Crossley, P.A.; Gale, P.F.; Bryson, G. Fault section identification and location on a distribution feeder using travelling waves. In Proceedings of the IEEE Power Engineering Society Summer Meeting, Chicago, IL, USA, 21–25 July 2002; pp. 1107–1112. [Google Scholar] [CrossRef]
- Dwivedi, A.; Yu, X. Fault location in radial distribution lines using travelling waves and network theory. In Proceedings of the 2011 IEEE International Symposium on Industrial Electronics, Gdansk, Poland, 27–30 June 2011; pp. 1051–1056. [Google Scholar] [CrossRef]
- Aftab, M.A.; Hussain, S.M.S.; Ali, I.; Ustun, T.S. Dynamic protection of power systems with high penetration of renewables: A review of the traveling wave based fault location techniques. Int. J. Electr. Power Energy Syst. 2020, 114, 105410. [Google Scholar] [CrossRef]
- Jalilzadeh Hamidi, R.; Livani, H.; Rezaiesarlak, R. Traveling-Wave Detection Technique using Short-Time Matrix Pencil Method. IEEE Trans. Power Del. 2017, 32, 2565–2574. [Google Scholar] [CrossRef]
- Sarkar, T.K.; Pereira, O. Using the matrix pencil method to estimate the parameters of a sum of complex exponentials. IEEE Trans. Antennas Propag. Mag. 1995, 37, 48–55. [Google Scholar] [CrossRef]
- Crow, M.L.; Singh, A. The Matrix Pencil for Power System Modal Extraction. IEEE Trans. Power Syst. 2005, 20, 501–502. [Google Scholar] [CrossRef]
- Sheshyekani, K.; Fallahi, G.; Hamzeh, M.; Kheradmandi, M. A General Noise-Resilient Technique Based on the Matrix Pencil Method for the Assessment of Harmonics and Interharmonics in Power Systems. IEEE Trans. Power Deliv. 2017, 32, 2179–2188. [Google Scholar] [CrossRef]
- Chen, J.; Li, X.; Mohamed, M.A.; Jin, T. An Adaptive Matrix Pencil Algorithm Based-Wavelet Soft-Threshold Denoising for Analysis of Low Frequency Oscillation in Power Systems. IEEE Access 2020, 8, 7244–7255. [Google Scholar] [CrossRef]
- Minkner, R.; Schweitzer, E.O. Low Power Voltage and Current Transducers for Protecting and Measuring Medium and High Voltage Systems. In Proceedings of the 26th Annual Western Protective Relay Conference, Spokane, WA, USA, 26–28 October 1999. [Google Scholar]
- Schmid, J.; Kunde, K. Application of non conventional voltage and currents sensors in high voltage transmission and distribution systems. In Proceedings of the 2011 IEEE International Conference on Smart Measurements of Future Grids (SMFG), Bologna, Italy, 14–16 November 2011; pp. 64–68. [Google Scholar] [CrossRef]
- Rahmatian, F. High-voltage current and voltage sensors for a smarter transmission grid and their use in live-line testing and calibration. In Proceedings of the 2011 IEEE Power and Energy Society General Meeting, Detroit, MI, USA, 24–28 July 2011; pp. 1–3. [Google Scholar] [CrossRef]
- Yablokov, A.; Filatova, G.; Timofeev, A. Using of non-traditional current and voltage sensors for the fault location. In Proceedings of the Smart Grids 2017, Tomsk, Russia, 9–13 October 2017. [Google Scholar] [CrossRef]
- Mingotti, A.; Costa, F.; Pasini, G.; Peretto, L.; Tinarelli, R. Modeling Capacitive Low-Power Voltage Transformer Behavior over Temperature and Frequency. Sensors 2021, 21, 1719. [Google Scholar] [CrossRef] [PubMed]
- Crotti, G.; Gallo, D.; Giordano, D.; Landi, C.; Luiso, M. Medium Voltage Divider Coupled with an Analog Optical Transmission System. IEEE Trans. Instrum. Meas. 2014, 63, 2349–2357. [Google Scholar] [CrossRef]
- Elhaffar, A.; Lehtonen, M. High Frequency Current Transformer Modeling for Traveling Waves Detection. In Proceedings of the 2007 IEEE Power Engineering Society General Meeting, Tampa, FL, USA, 24–28 June 2007; pp. 1–6. [Google Scholar] [CrossRef]
- Sarkar, T.K.; Salazar-Palma, M.; Zhu, M.D.; Chen, H. Modern Characterization of Electromagnetic Systems and Its Associated Metrology, 1st ed.; John Wiley & Sons: Hoboken, NJ, USA, 2021; pp. 21–106. ISBN 978-1-119-07646-9. [Google Scholar]
- Rezaiesarlak, R.; Manteghi, M. Short-Time Matrix Pencil Method for Chipless RFID Detection Applications. IEEE Trans. Antennas Propag. 2013, 61, 2801–2806. [Google Scholar] [CrossRef]
- IEEE Power Engineering Society Power System Analysis, IEEE PES Test Feeder. Available online: https://cmte.ieee.org/pes-testfeeders/resources/ (accessed on 27 April 2022).


| K3E | K3 | K2E | K2 | K1E | |||||||||||
|---|---|---|---|---|---|---|---|---|---|---|---|---|---|---|---|
| Source Phase | L1 | L2 | L3 | L1 | L2 | L3 | L1 | L2 | L3 | L1 | L2 | L3 | L1 | L2 | L3 |
| 0° | 0.19 | 0.34 | 0.38 | 0.18 | 0.34 | 0.36 | 1.22 | 0.25 | 0.37 | 0.43 | 0.33 | 0.40 | 0.18 | 0.36 | 0.32 |
| 15° | 0.18 | 0.39 | 0.46 | 0.18 | 0.38 | 0.44 | 1.44 | 0.29 | 0.43 | 0.51 | 0.34 | 0.52 | 0.27 | 0.32 | 0.38 |
| 30° | 0.18 | 0.35 | 0.52 | 0.18 | 0.34 | 0.49 | 1.29 | 0.36 | 0.53 | 0.54 | 0.37 | 0.49 | 0.31 | 0.50 | 0.39 |
| 45° | 0.19 | 0.38 | 0.20 | 0.19 | 0.37 | 0.20 | 1.31 | 0.37 | 0.43 | 0.74 | 0.38 | 0.50 | 0.18 | 0.43 | 0.45 |
| 60° | 0.33 | 0.38 | 0.19 | 0.33 | 0.37 | 0.19 | 1.23 | 0.37 | 3.63 | 2.16 | 0.35 | 0.48 | 0.31 | 0.33 | 0.24 |
| 75° | 0.37 | 0.41 | 0.21 | 0.36 | 0.41 | 0.21 | 1.06 | 0.74 | 0.94 | 1.75 | 0.46 | 0.33 | 0.38 | 0.46 | 0.23 |
| 90° | 0.38 | 0.60 | 0.22 | 0.36 | 0.62 | 0.22 | 1.01 | 0.42 | 0.48 | 0.59 | 0.41 | 0.34 | 0.39 | 0.39 | 0.25 |
| 105° | 0.39 | 0.18 | 0.21 | 0.37 | 0.17 | 0.20 | 0.67 | 0.45 | 0.47 | 0.78 | 0.32 | 0.35 | 0.41 | 0.31 | 0.25 |
| 120° | 0.41 | 0.18 | 0.32 | 0.40 | 0.18 | 0.33 | 0.50 | 2.33 | 0.47 | 0.72 | 0.35 | 0.42 | 0.39 | 0.30 | 0.34 |
| 135° | 0.41 | 0.18 | 0.34 | 0.39 | 0.18 | 0.33 | 0.44 | 0.16 | 0.73 | 0.48 | 0.23 | 0.76 | 0.38 | 0.38 | 0.33 |
| 150° | 0.60 | 0.18 | 0.36 | 0.60 | 0.18 | 0.35 | 0.61 | 0.14 | 0.85 | 0.58 | 0.19 | 0.41 | 0.62 | 0.35 | 0.29 |
| 165° | 0.16 | 0.17 | 0.37 | 0.16 | 0.17 | 0.36 | 0.90 | 0.14 | 0.93 | 0.53 | 0.19 | 0.42 | 0.47 | 0.25 | 0.36 |
Publisher’s Note: MDPI stays neutral with regard to jurisdictional claims in published maps and institutional affiliations. |
© 2022 by the authors. Licensee MDPI, Basel, Switzerland. This article is an open access article distributed under the terms and conditions of the Creative Commons Attribution (CC BY) license (https://creativecommons.org/licenses/by/4.0/).
Share and Cite
Łukaszewski, P.; Nogal, Ł.; Łukaszewski, A. The Identification of Travelling Waves in a Voltage Sensor Signal in a Medium Voltage Grid Using the Short-Time Matrix Pencil Method. Energies 2022, 15, 4307. https://doi.org/10.3390/en15124307
Łukaszewski P, Nogal Ł, Łukaszewski A. The Identification of Travelling Waves in a Voltage Sensor Signal in a Medium Voltage Grid Using the Short-Time Matrix Pencil Method. Energies. 2022; 15(12):4307. https://doi.org/10.3390/en15124307
Chicago/Turabian StyleŁukaszewski, Piotr, Łukasz Nogal, and Artur Łukaszewski. 2022. "The Identification of Travelling Waves in a Voltage Sensor Signal in a Medium Voltage Grid Using the Short-Time Matrix Pencil Method" Energies 15, no. 12: 4307. https://doi.org/10.3390/en15124307
APA StyleŁukaszewski, P., Nogal, Ł., & Łukaszewski, A. (2022). The Identification of Travelling Waves in a Voltage Sensor Signal in a Medium Voltage Grid Using the Short-Time Matrix Pencil Method. Energies, 15(12), 4307. https://doi.org/10.3390/en15124307