
Research on Energy Saving and Environmental Protection Management Evaluation of Listed Companies in Energy Industry Based on Portfolio Weight Cloud Model


Abstract
:1. Introduction
2. Methods
2.1. Construction of Evaluation Index System
2.2. Combination Weight-Cloud Evaluation Comprehensive Evaluation Model
2.2.1. Combination Weight Model
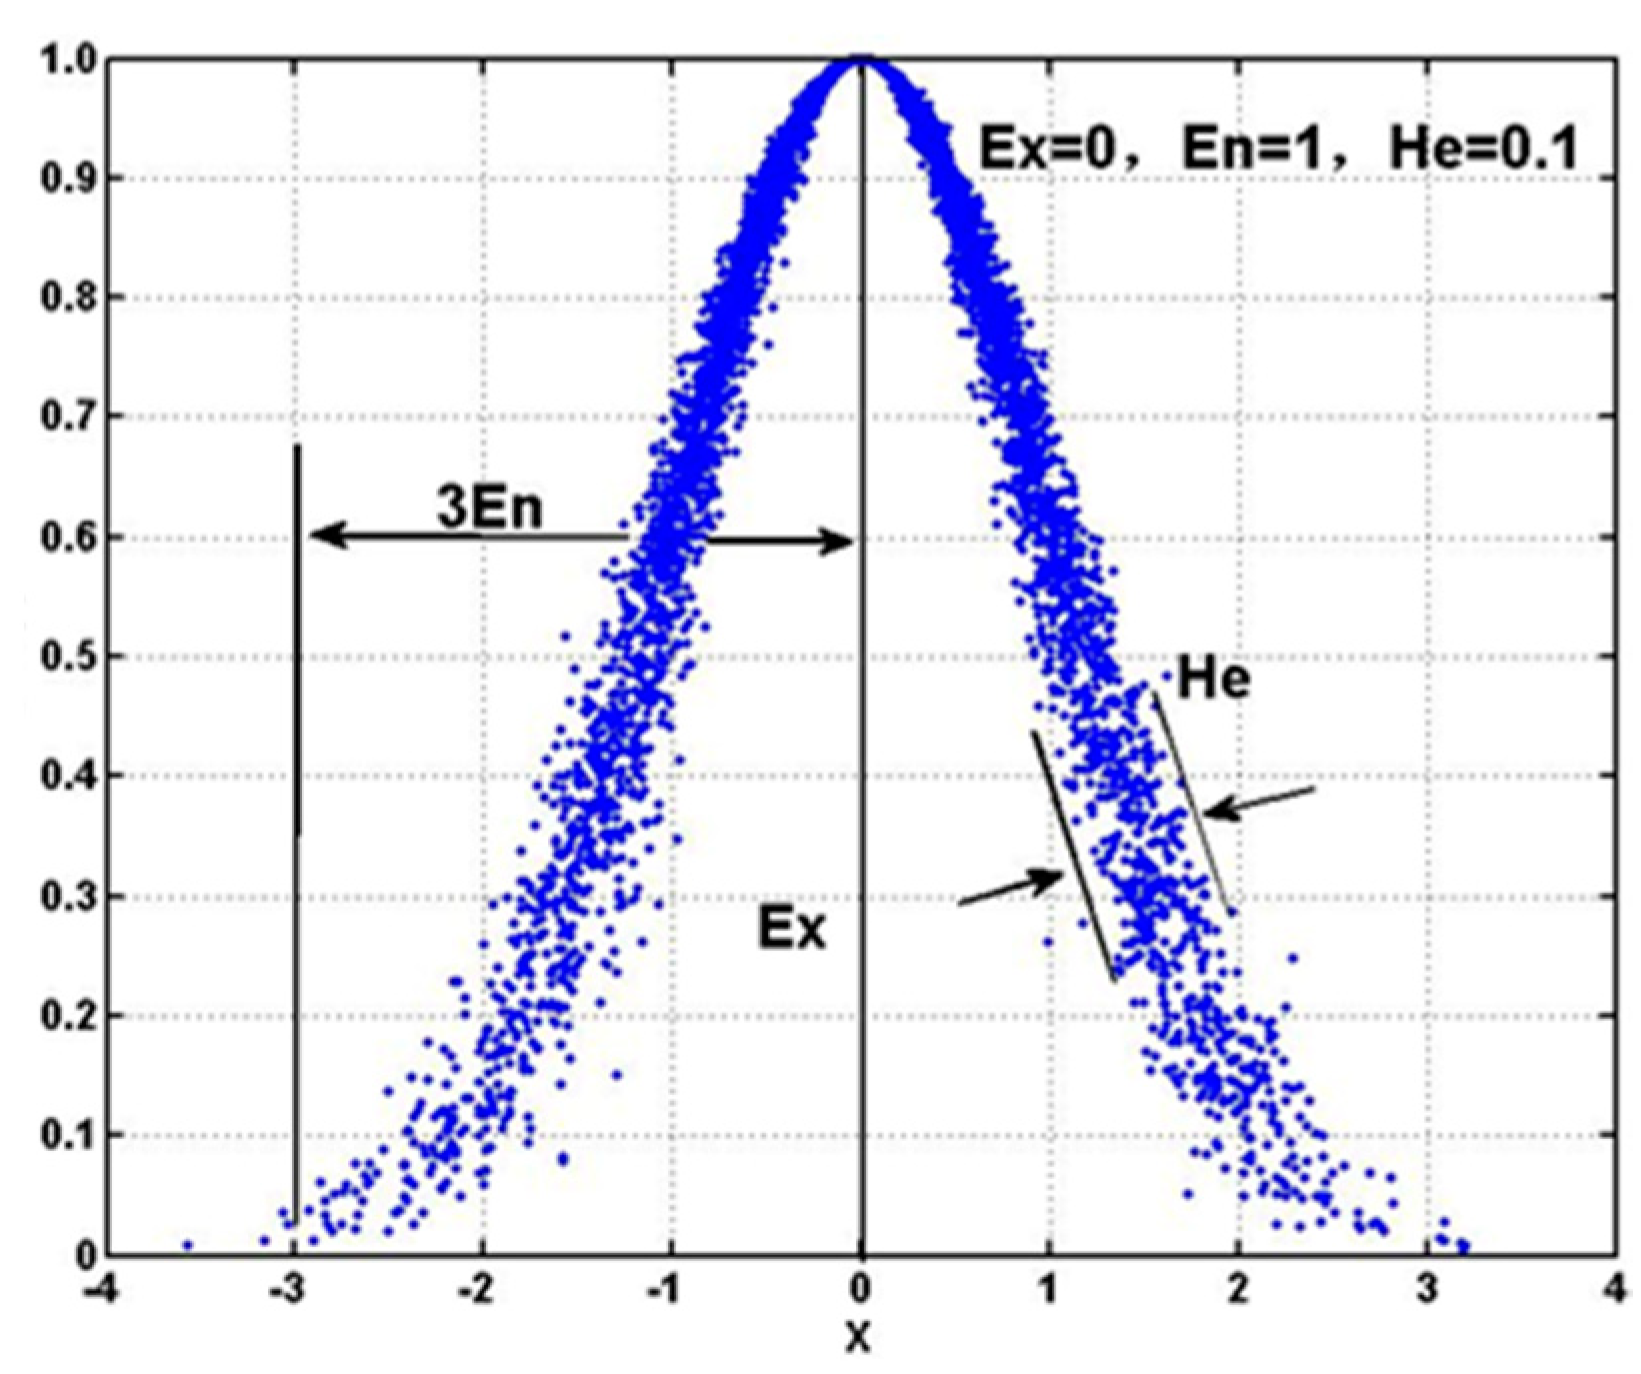
2.2.2. Cloud Evaluation Model
2.2.3. Comprehensive Evaluation Model
2.3. Data Collection and Samples
3. Results and Discussion
3.1. Analysis of Current Situation of Energy Saving and Environmental Protection Information
3.1.1. Quantitative Distribution of ESEP Information
3.1.2. Industry Distribution of ESEP Information
3.1.3. Content Distribution of ESEP Information
3.2. Evaluation Analysis of Cloud Model of Each Company
3.3. Evaluation and Analysis of Each Indicator Cloud Model
3.4. Limitations
4. Conclusions and Suggestions
4.1. Conclusions
4.2. Suggestions
Author Contributions
Funding
Institutional Review Board Statement
Informed Consent Statement
Data Availability Statement
Conflicts of Interest
References
- Fawcett, J. Thoughts about environment. Nurs. Sci. Q. 2022, 35, 267–269. [Google Scholar] [CrossRef] [PubMed]
- Pal, R.; Banerjee, P.; Thakkar, P.; Hussain, A.M.T. Green firm, brown environment. Manch. Sch. 2022, 90, 107–121. [Google Scholar] [CrossRef]
- Abbass, K.; Qasim, M.Z.; Song, H.M.; Murshed, M.; Mahmood, H.; Younis, I. A review of the global climate change impacts, adaptation, and sustainable mitigation measures. Environ. Sci. Pollut. Res. 2022. early access. [Google Scholar] [CrossRef] [PubMed]
- Li, Y. Level assessment of ecological environment of china and sustainable development strategies. Nat. Environ. Pollut. Technol. 2021, 20, 685–693. [Google Scholar] [CrossRef]
- Lin, B.Q.; Du, Z.L. Promoting energy conservation in China’s metallurgy industry. Energy Policy 2017, 104, 285–294. [Google Scholar] [CrossRef]
- Shi, J. Research on enterprise performance management under the background of energy conservation and emission reduction. Fresenius Environ. Bull. 2022, 31, 4622–4629. [Google Scholar]
- Yang, H.; Li, X.; Ma, L. Using system dynamics to analyse key factors influencing China’s energy-related CO2 emissions and emission reduction scenarios. J. Clean. Prod. 2021, 320, 128811. [Google Scholar] [CrossRef]
- Px, A.; Fan, Y.; Zm, C. Influencing factors of the decoupling relationship between CO2 emission and economic development in China’s power industry. Energy 2020, 209, 118341. [Google Scholar] [CrossRef]
- Lei, M.; Guo, J.; Chai, J. China’s regional CO2 emissions: Characteristics, inter-regional transfer and emission reduction policies. Energy Policy 2011, 39, 6136–6144. [Google Scholar] [CrossRef]
- Yang, S.; Wei, J.; Cheng, P. Spillover of different regulatory policies for waste sorting: Potential influence on energy-saving policy acceptability. Waste Manag. 2021, 125, 112–121. [Google Scholar] [CrossRef]
- Wu, J.; Lv, L.; Sun, J. A comprehensive analysis of China’s regional energy saving and emission reduction efficiency: From production and treatment perspectives. Energy Policy 2015, 84, 166–176. [Google Scholar] [CrossRef]
- Daioglou, V.; Mikropoulos, E.; Gernaat, D.; van Vuuren, D.P. Efficiency improvement and technology choice for energy and emission reductions of the residential sector. Energy 2022, 243, 0360544. [Google Scholar] [CrossRef]
- Halkos, G.; Argyropoulou, G. Using environmental indicators in performance evaluation of sustainable development health goals. Ecol. Econ. 2022, 192, 107263. [Google Scholar] [CrossRef]
- Kruger, M.; Muslubas, S.; Cam, E.; Lehmann, D.; Polenz, S.; Dreissigacker, V.; Klasing, F.; Knodler, P. Technical development and economic evaluation of the integration of thermal energy storage in steam power plants. Energies 2022, 15, 3388. [Google Scholar] [CrossRef]
- Wu, L.H.; Chen, Y. Evaluation upon Enterprises’ Environmental Management Performance from the Whole-course Perspective. China Popul. Resour. Environ. 2014, 24, 46–50. [Google Scholar]
- Xue, R.; Wang, S.; Gao, G. Evaluation of symbiotic technology-based energy conservation and emission reduction benefits in iron and steel industry: Case study of Henan, China. J. Clean. Prod. 2022, 338, 130616. [Google Scholar] [CrossRef]
- Wei, W.; Shang, Y.N.; Jiang, Y.J.; Wang, Q.; Wang, J.C.; Wen, B. Research on environmental performance evaluation in Chengdu. China Popul. Resour. Environ. 2018, 28, 80–85. [Google Scholar]
- Li, W.A.; Zhang, Y.W.; Zheng, M.N.; Li, X.L.; Cui, G.Y.; Li, H. Research on Green Governance of Chinese Listed Companies and Its Evaluation. Manag. World 2019, 5, 126–133. [Google Scholar]
- Borowski, P.F. Management of energy enterprises in zero-emission conditions: Bamboo as an innovative biomass for the production of green energy by power plants. Energies 2022, 15, 1928. [Google Scholar] [CrossRef]
- He, K.; Zhu, N. Strategic emerging industry layout based on analytic hierarchy process and fuzzy comprehensive evaluation: A case study of Sichuan province. PLoS ONE 2022, 17, e0264578. [Google Scholar] [CrossRef]
- Li, D.Y.; Meng, H.J.; Shi, X.M. Membership Clouds and Membership cloud Generators. J. Comput. Res. Dev. 1995, 16, 15–22. [Google Scholar]
- Zhou, J.; Zhu, Y.Q.; Chai, X.D.; Tang, W.Q. Approach for analyzing consensus based on cloud model and evidence theory. Syst. Eng.—Theory Pract. 2012, 32, 2756–2763. [Google Scholar] [CrossRef]
- He, J.P.; Gao, Q.; Shi, Y.Q. A multi-hierarchical comprehensive evaluation method of dam safety based on cloud model. Syst. Eng.—Theory Pract. 2016, 36, 2977–2983. [Google Scholar] [CrossRef]
- Tian, H.; Pan, C.L. The Study of the Impact of Proactive Environmental Strategy on Corporate Green Image. Chin. J. Manag. 2015, 12, 1064–1071. [Google Scholar]
- Liao, L.; Luo, L.; Tang, Q. Gender diversity, board independence, environmental committee and greenhouse gas disclosure. Br. Account. Rev. 2015, 47, 409–424. [Google Scholar] [CrossRef]
- Baboukardos, D. The valuation relevance of environmental performance revisited: The moderating role of environmental provisions. Br. Account. Rev. 2018, 50, 32–47. [Google Scholar] [CrossRef] [Green Version]
- Du, W.C. Whole Process Treatment for Industrial COD. China Soft Sci. 2013, 7, 77–85. [Google Scholar] [CrossRef]
- Qin, Y.; Wu, C.Y.; Zhai, L.N. The Theoretical Study of the Relationship between the Environmental and Economic Performance of Firm and Model Construct. Syst. Eng.-Theory Pract. 2004, 8, 111–117. [Google Scholar] [CrossRef]
- Hao, Z.Z.; Li, J.; Han, H.B. Measurement of and Empirical Study on Environmental Performance of China’s Industry Sectors. Syst. Eng. 2014, 32, 1–11. [Google Scholar]
- Wang, F.Z.; Jiang, T.; Guo, X.C. Government quality, environmental regulation and green technological innovation of enterprises. Sci. Res. Manag. 2018, 39, 26–33. [Google Scholar] [CrossRef]
- Chen, X.J. Application of Analytical Hierarchical Process to Optimize the MSW Classification schemes in Pudong, China. China Popul. Resour. Environ. 2015, 25, 368–371. [Google Scholar]
- Freeman, J.; Tao, C. Green supplier selection using an AHP-Entropy-TOPSIS framework. Supply Chain. Manag. 2015, 20, 327–340. [Google Scholar] [CrossRef] [Green Version]
- Wang, Q.; Yuan, X.; Zhang, J.; Gao, Y.; Hong, J.; Zuo, J.; Liu, W. Assessment of the Sustainable Development Capacity with the Entropy Weight Coefficient Method. Sustainability 2015, 7, 13542–13563. [Google Scholar] [CrossRef] [Green Version]
- Zhang, T.; Li, M.R.; Xu, Y.M. The Construction and Empirical Study of Rural Revitalization Evaluation Index System. Manag. World 2018, 34, 99–105. [Google Scholar] [CrossRef]
- Wang, Y.; Chen, H.; Long, R.; Jiang, S.; Liu, B. Has the sustainable development planning policy promoted the green transformation in China’s Resource-based cities? Resour. Conserv. Recycl. 2022, 180, 106181. [Google Scholar] [CrossRef]
- Wang, Y.; Chen, H.; Long, R.; Liu, B.; Jiang, S.; Yang, X.; Yang, M. Evaluating green development level of mineral resource-listed companies: Based on a “dark green” assessment framework. Resour. Policy 2021, 71, 102012. [Google Scholar] [CrossRef]
- Zeng, S.; Xu, X.; Dong, Z.; Tam, V.W. Towards corporate environmental information disclosure: An empirical study in China. J. Clean. Prod. 2010, 18, 1142–1148. [Google Scholar] [CrossRef]
- He, L.M.; Hou, T. Determinants of Environmental Performance Information Disclosure in Chinese Listed Companies: Empirical Evidence Based on Social Responsibility Reports. China Popul. Resour. Environ. 2010, 20, 99–104. [Google Scholar] [CrossRef]
- Usman, M.; Javed, M.; Yin, J. Board internationalization and green innovation. Econ. Lett. 2020, 197, 109625. [Google Scholar] [CrossRef]
- Ullah, S.; Khan, F.U.; Cismaș, L.M.; Usman, M.; Miculescu, A. Does tournament incentives matter for CEOs to be environmentally responsible? Evidence from Chinese listed companies. Int. J. Environ. Res. Public Health 2022, 19, 470. [Google Scholar] [CrossRef]


| Target Layer | Criterion Layer B | Index Layer C | Index Introduction |
|---|---|---|---|
| Comprehensive evaluation on energy saving and environmental protection | B1-governance framework | C1~ESEP institutional system | Degree of completeness of relevant management system, department and committee (1–5) |
| C2~ESEP management system | Degree of completeness and systematicness of relevant management system certification and implementation (1–5) | ||
| C3~ESEP management culture | Degree of emphasis on ESEP and richness of education activities | ||
| C4~ESEP clauses and policies | Degree of completeness of environmental provisions for customers or suppliers (1–5) | ||
| B2-implementation process | C5~clean production management | Degree of completeness of green raw material procurement and cleaner production audit (1–5) | |
| C6~pollution reduction management | Diversity of management measures for emission reduction of three wastes and perfection of implementation (1–5) | ||
| C7~recycling management | Diversity and perfection of resource recycling management measures (1–5) | ||
| C8~energy efficiency improvement management | Diversity and implementation of energy efficiency management measures (1–5) | ||
| C9~tackling climate change management | Diversity and implementation of GHG emission management measures (1–5) | ||
| C10~environmental protection management | Diversity and perfection of environmental protection management measures (1–5) | ||
| C11~green office management | Diversity and perfection of green office management measures (1–5) | ||
| B3-governance effectiveness | C12~environmental pollution events | The number of pollution incidents | |
| C13~discharge of three wastes | Discharge of COD, SO2, NOX and solid waste per ten thousand yuan of output value | ||
| C14~energy consumption situation, | Comprehensive energy consumption per ten thousand yuan of output value (ton of standard coal/Ten thousand yuan) | ||
| C15~resource recycling | Water resource/ waste resource recycling utilization rate | ||
| C16~other greenhouse emissions | CO2, CH4, N2O and other greenhouse gas emissions per ten thousand yuan output value | ||
| C17~ecological environment construction | Added green area or animal and plant protection per ten thousand yuan of output value | ||
| C18~ESEP influence | Relevant awards/honors/patents/paper grades (1–5) | ||
| C19~ESEP special investment index. | Energy saving per ten thousand yuan output value/environmental protection special fund input | ||
| B4-public welfare and others | C20~ESEP public welfare activities | Degree of participation in environmental public welfare activities (1–5) |
| Score | Specific Standard |
|---|---|
| 5 | The relevant institutions of ESEP are well established, such as systematic ESEP management system, specialized ESEP management department, ESEP management committee, and detailed text charts, data and information explanation |
| 4 | The relevant institutions of ESEP are relatively complete, such as ESEP management system, ESEP management department and ESEP management Committee. |
| 3 | The relevant institutions of ESEP are generally complete, with ESEP management system and departments, but no management committee. |
| 2 | The relevant institutions system of ESEP are not perfect, with only ESEP management system, no management department and management committee. |
| 1 | The relevant institutions system of ESEP is extremely imperfect, and there is no explanation on the construction of the institutional system of ESEP. |
| The Name of the Industry | Release Quantity | Release Proportion | ||||
|---|---|---|---|---|---|---|
| 2015 | 2016 | 2017 | 2015 | 2016 | 2017 | |
| Coal mining and washing industry | 13 | 14 | 13 | 48.15% | 51.85% | 48.15% |
| Oil and gas extraction | 4 | 4 | 4 | 80.00% | 80.00% | 80.00% |
| Power and heat production and supply | 23 | 22 | 23 | 32.86% | 32.86% | 32.86% |
| Gas production and supply | 4 | 5 | 7 | 16.67% | 20.83% | 39.17% |
| Water production and supply industries | 5 | 5 | 6 | 33.33% | 33.33% | 40.00% |
| Comments | I Level | II Level | III Level | IV Level | V Level | Conclusion |
|---|---|---|---|---|---|---|
| C1~ESEP institutional system | 0.0000 | 0.0001 | 0.2984 | 0.3233 | 0.3781 | III level |
| C2~ESEP management system | 0.0000 | 0.0000 | 0.0021 | 0.0012 | 0.9967 | V level |
| C3~ESEP management culture | 0.0000 | 0.0000 | 0.0002 | 0.0002 | 0.9997 | V level |
| C4~ESEP clauses and policies | 0.0000 | 0.0000 | 0.0501 | 0.0373 | 0.9126 | V level |
| C5~clean production management | 0.0000 | 0.0011 | 0.5001 | 0.4988 | 0.0000 | III level |
| C6~pollution reduction management | 0.0000 | 0.0003 | 0.2686 | 0.3138 | 0.4173 | V level |
| C7~recycling management | 0.0000 | 0.0011 | 0.4983 | 0.5006 | 0.0000 | IV level |
| C8~energy efficiency improvement management | 0.0000 | 0.0001 | 0.3175 | 0.3439 | 0.3384 | III level |
| C9~tackling climate change management | 0.0000 | 0.0000 | 0.2646 | 0.2760 | 0.4594 | V level |
| C10~environmental protection management | 0.0000 | 0.0002 | 0.2770 | 0.2875 | 0.4353 | V level |
| C11~green office management | 0.0000 | 0.0002 | 0.3903 | 0.2849 | 0.3247 | V level |
| C12~environmental pollution events | 0.0000 | 0.0000 | 0.0000 | 0.0000 | 1.0000 | V level |
| C13~discharge of three wastes | 0.0000 | 0.0011 | 0.4991 | 0.4998 | 0.0000 | IV level |
| C14~energy consumption situation, | 0.0000 | 0.0000 | 0.0409 | 0.0371 | 0.9219 | V level |
| C15~resource recycling | 0.0025 | 0.9940 | 0.0015 | 0.0020 | 0.0000 | V level |
| C16~other greenhouse emissions | 0.0000 | 0.0000 | 0.0000 | 0.0000 | 1.0000 | V level |
| C17~ecological environment construction | 0.9977 | 0.0023 | 0.0000 | 0.0000 | 0.0000 | I level |
| C18~ESEP influence | 0.1714 | 0.8268 | 0.0008 | 0.0010 | 0.0000 | II level |
| C19~ESEP special investment index. | 0.0000 | 0.0000 | 0.0000 | 0.0000 | 1.0000 | V level |
| C20~ESEP public welfare activities | 0.0000 | 0.0000 | 0.0000 | 0.0000 | 1.0000 | V level |
| Criterion Layer B | Index Layer C | Index Layer Cloud Model Parameter | Criterion Layer Cloud Model Parameter | ||
|---|---|---|---|---|---|
| B1-governance framework | C1~ESEP institutional system | 3.2078 | 0.0024 | 0.1440 | 3.4451, 0.0018, 0.1543 |
| C2~ESEP management system | 3.6852 | 0.0009 | 0.1643 | ||
| C3~ESEP management culture | 3.5466 | 0.0018 | 0.1594 | ||
| C4~ESEP clauses and policies | 3.3735 | 0.0019 | 0.1509 | ||
| B2-implementation process | C5~clean production management | 2.5137 | 0.0004 | 0.1022 | 2.9480, 0.0030, 0.1330 |
| C6~pollution reduction management | 3.0846 | 0.0069 | 0.1504 | ||
| C7~recycling management | 2.9709 | 0.0032 | 0.1346 | ||
| C8~energy efficiency improvement management | 3.1635 | 0.0005 | 0.1363 | ||
| C9~tackling climate change management | 3.1196 | 0.0017 | 0.1376 | ||
| B3-governance effectiveness | C10~environmental protection management | 2.9772 | 0.0001 | 0.1247 | 2.0852, 0.0019, 0.0776 |
| C11~green office management | 2.9815 | 0.0066 | 0.1448 | ||
| C12~environmental pollution events | 2.5344 | 0.0082 | 0.0620 | ||
| C13~discharge of three wastes | 2.3127 | 0.0010 | 0.0854 | ||
| C14~energy consumption situation, | 1.9618 | 0.0032 | 0.0870 | ||
| C15~resource recycling | 1.6587 | 0.0022 | 0.0682 | ||
| C16~other greenhouse emissions | 1.9140 | 0.0030 | 0.0841 | ||
| C17~ecological environment construction | 1.4868 | 0.0016 | 0.0567 | ||
| C18~ESEP influence | 1.0831 | 0.0003 | 0.0214 | ||
| C19~ESEP special investment index. | 2.4651 | 0.0049 | 0.1161 | ||
| B4-others | C20~ESEP public welfare activities | 2.0556 | 0.0035 | 0.0926 | 2.0556, 0.0035, 0.0926 |
| Cloud Level | Representative Enterprise | Major Features etc. |
|---|---|---|
| V level | China Shenhua (2017) | (1) Perfect ESEP management system; Systematic energy conservation and environmental protection department; Environmental Protection Council; Attach great importance to environmental protection; Abundant energy conservation and environmental protection education activities; Implement ISO14001 environmental management; Systematic ESEP management system; Normative ESEP provisions; (2) Green procurement of raw materials; Environmentally friendly production; Clean production audit specification; Effective implementation of waste water, waste gas and solid waste reduction management, effective recycling of water resources, effective comprehensive utilization of solid waste; Diversification of energy efficiency measures, perfect implementation, diversification of climate change measures, effective management of greenhouse gas emissions, diversification of measures to reduce ecological environment damage, very effective restoration and governance of ecological environment, diversification of measures related to green office; (3) A large number of ESEP-related awards/honors/patents/papers with great influence; Ten thousand yuan output value environmental protection/high energy saving investment; (4) Participation in ESEP public welfare projects is general; |
| IV level | China Yangtze Power (2017) | (1) The institutional system, management culture, management system, terms and policies are relatively perfect; (2) Procurement of raw materials, product production, clean production, emission reduction of waste, water resources and solid waste recycling are all environmentally friendly, while energy efficiency improvement, tackling climate change and ecological environment recovery need to be further improved; (3) ESEP influence and ESEP investment are relatively weak; (4) Participation in ESEP public welfare projects needs to be improved; |
| III level | Datang International Power Generation (2017) | (1) The institutional system, management culture, management system, terms and policies are relatively perfect; (2) Procurement of raw materials, product production, clean production, emission reduction of waste, water resources and solid waste recycling are all environmentally friendly, while energy efficiency improvement, tackling climate change and ecological environment recovery need to be further improved; (3) ESEP influence and ESEP special investment are relatively weak; (4) Participation in ESEP public welfare projects needs to be improved; |
| II level | Guozhong Water (2017) | (1) Poor institutional system, management culture, management system and other aspects, and generally perfect terms and policies; (2) The procurement of raw materials, product production, clean production, emission reduction of three wastes, recycling of water resources and solid wastes are poor, and the implementation of energy efficiency improvement, tackling climate change and ecological environment restoration measures is mediocre; (3) There is no explanation of ESEP’s influence and ESSP’s input; (4) Poor participation in ESEP public welfare projects. |
| I level | Fuling Electric Power (2017) | C1-C20 are less disclosed, only indicating strict compliance with laws and regulations, implementation of some energy conservation and emission reduction measures, etc. |
Publisher’s Note: MDPI stays neutral with regard to jurisdictional claims in published maps and institutional affiliations. |
© 2022 by the authors. Licensee MDPI, Basel, Switzerland. This article is an open access article distributed under the terms and conditions of the Creative Commons Attribution (CC BY) license (https://creativecommons.org/licenses/by/4.0/).
Share and Cite
Li, S.; Wang, Y.; Zheng, Y.; Geng, J.; Zhu, J. Research on Energy Saving and Environmental Protection Management Evaluation of Listed Companies in Energy Industry Based on Portfolio Weight Cloud Model. Energies 2022, 15, 4311. https://doi.org/10.3390/en15124311
Li S, Wang Y, Zheng Y, Geng J, Zhu J. Research on Energy Saving and Environmental Protection Management Evaluation of Listed Companies in Energy Industry Based on Portfolio Weight Cloud Model. Energies. 2022; 15(12):4311. https://doi.org/10.3390/en15124311
Chicago/Turabian StyleLi, Shanshan, Yujie Wang, Yuannan Zheng, Jichao Geng, and Junqi Zhu. 2022. "Research on Energy Saving and Environmental Protection Management Evaluation of Listed Companies in Energy Industry Based on Portfolio Weight Cloud Model" Energies 15, no. 12: 4311. https://doi.org/10.3390/en15124311
APA StyleLi, S., Wang, Y., Zheng, Y., Geng, J., & Zhu, J. (2022). Research on Energy Saving and Environmental Protection Management Evaluation of Listed Companies in Energy Industry Based on Portfolio Weight Cloud Model. Energies, 15(12), 4311. https://doi.org/10.3390/en15124311