Article

Data-Based Engine Torque and NOx Raw Emission Prediction

1
Suzhou National Square Automotive Electronics, Suzhou 215000, China
2
School of Automotive Studies, Tongji University, Shanghai 201804, China
3
China Ship Scientific Research Center, Wuxi 214000, China
4
Kunming Yunnei Power Co., Ltd., Kunming 650000, China
*
Author to whom correspondence should be addressed.
Energies 2022, 15(12), 4346; https://doi.org/10.3390/en15124346
Submission received: 28 April 2022 / Revised: 27 May 2022 / Accepted: 13 June 2022 / Published: 14 June 2022
(This article belongs to the Special Issue Low-Carbon/Carbon-Free Fuels and Advanced Combustion Strategies)

Abstract

:
Low accuracy is the main challenge that plagues the application of engine modeling technology at present. In this paper, correlation analysis technology is used to analyze the main influencing factors of engine torque and NOx (nitrogen oxides) raw emission performance from a statistical point of view, and on this basis, the regression algorithm is used to construct the engine torque and NOx emission prediction model. The prediction RMSE between engine torque prediction value and true value reaches 4.6186, and the torque prediction R2 reaches 1.00. Prediction RMSE between NOx emission prediction value and true value reaches 67.599, and NOx emission prediction R2 reaches 0.99. When using the new WHTC data for model prediction verification, the RMSE between the engine torque predicted value and true value reaches 4.9208, and the prediction accuracy reaches 99.60%, the RMSE between NOx emission prediction value and true value reaches 72.38, and the prediction accuracy reaches 99.2%, indicating that the model is relatively accurate. The evaluation result of the ambient temperature impact on torque shows that ambient temperature is positively correlated with engine torque.

1. Introduction

As the iconic technological achievement of the Second Industrial Revolution, the internal combustion engine still plays an important role in our lives. Thorough and reliable testing and verification of engine products before they are put on the market are important means to ensure product safety and reliability. However, the test development work for specific use scenarios and specific environments, such as winter tests, high-temperature tests, and high-altitude tests, often has disadvantages such as high cost, long test cycles, and difficulty in reproducing test results.
Since the 21st century, with the continuous in-depth research in the field of computer and artificial intelligence technology, especially the development and promotion of large-scale integrated circuits, supercomputers, cloud computing and other technologies, simulation technology has experienced the development process from the first generation of analog simulation computing to the second generation of analog-digital hybrid simulation, and then to the third generation of digital real-time simulation, and simulation technology has made great progress. Using modern computing technology to simulate complex objects is not only more economical and efficient but also can expand human cognition to many exploration fields that cannot be reached by direct experiment. The powerful effect of simulation technology was fully verified in many fields such as aviation, aerospace, automobile, machinery, electronics and so on, and will continuously be developed and improved. The product development process using simulation technology has the advantages of fast operation speed, a high degree of automation, good repeatability, and low cost. As an important link in the development of engine control systems and calibration applications, engine hardware-in-the-loop simulation technology can shorten product development duration and improve the reliability of control system development [1].
There are various engine modeling methods, and the commonly used modeling methods are divided into mechanism modeling and regression modeling. Mechanism modeling is to model by analyzing the working principle of the plant object, and widely adopts ideal equations, look-up tables and other methods [2,3]. Regression modeling is a mathematical modeling method that uses statistical methods to quantitatively describe the working process of the plant object [4,5]. Experts and scholars have achieved much in detailed theoretical research and experimental validation of engine and vehicle modeling and simulation technology, they have achieved many research results. Li et al. [6]. established a special vehicle plant object model based on the principles of vehicle dynamics and stability principles, and also demonstrated the accuracy of the model based on the prototype vehicle test. Termous et al. [7]. carried out research about vehicle modeling technology; Wang et al. [8] used ASAMS/Car software to conduct vehicle modeling research. Mutha et al. [9]. introduced the simulation of XUV 500 models using CarSim-Simulink. The influence of parameters on response performance was investigated, in addition, torque vectoring was used in both tests to control powertrain output and evaluate its effect on vehicle response performance; Hu et al. [10]. established a backpropagation (BP) neural network for a diesel engine emission prediction purpose, and results show that the Nox and PM prediction accuracy could reach 95%; Li et al. [11]. established a prediction model with Gaussian process regression framework for Lithium-ion (Li-ion) batteries SOC estimation application. Combined with signal measurement, a new modeling approach is introduced by Yangyang et al. [12]. for engine torque and fuel consumption prediction, and results show that relative errors could be limited to 5% at both steady-state and transient-state conditions; Tsitsilonis et al. [13]. developed a Lyapunov Exponent (LE) model for the prediction of peak in-cylinder pressure, the error could be controlled within 0.3%; a torque reconstruction algorithm was proposed by Xie et al. [14]. based on a fuel injection engine speed ratio piecewise linear model, reference torque was calculated by the vehicle dynamics model, and piecewise linear model parameters were identified by the weighted least squares (WLS) method, the error between reconstructed torque and MAP torque is 7.60%, which proves the accuracy of the proposed algorithm. Varma et al. [15] built an ANN model for emission prediction of a single-cylinder diesel engine, steady-state experiments were carried out, and the overall validation accuracy reached 0.99951. Mishra et al. [16] built a neural network for vehicle braking and emission performance prediction under steady-state running conditions, the prediction accuracy for different variables to be predicted reaches 0.999722–0.999939. The good performance from Varma’s paper and Mishra’s paper is expected, performance prediction under steady-state conditions is not challenging compared to transient operating conditions. Paramasivam et al. [17] built a fuzzy prediction model for engine performance prediction with different additives added to the fuel, and the results showed that the coefficient of determination reached 0.91. This accuracy has reference significance for engine performance evaluation but it is far from enough for the accurate prediction of engine performance.
The above research works have carried out in-depth analysis and research on engine and vehicle modeling technology from the field of mechanism modeling and regression modeling and have achieved many valuable research results. However, the research on high-precision engine modeling technology that meets the needs of calibration development is less involved. This study takes a 3.0 L diesel engine as the research object and uses the correlation research and regression technology to carry out systematic research on the engine torque and NOx (nitrogen oxides) raw emission prediction technology from theoretical analysis to simulation calculation.

2. Materials and Methods
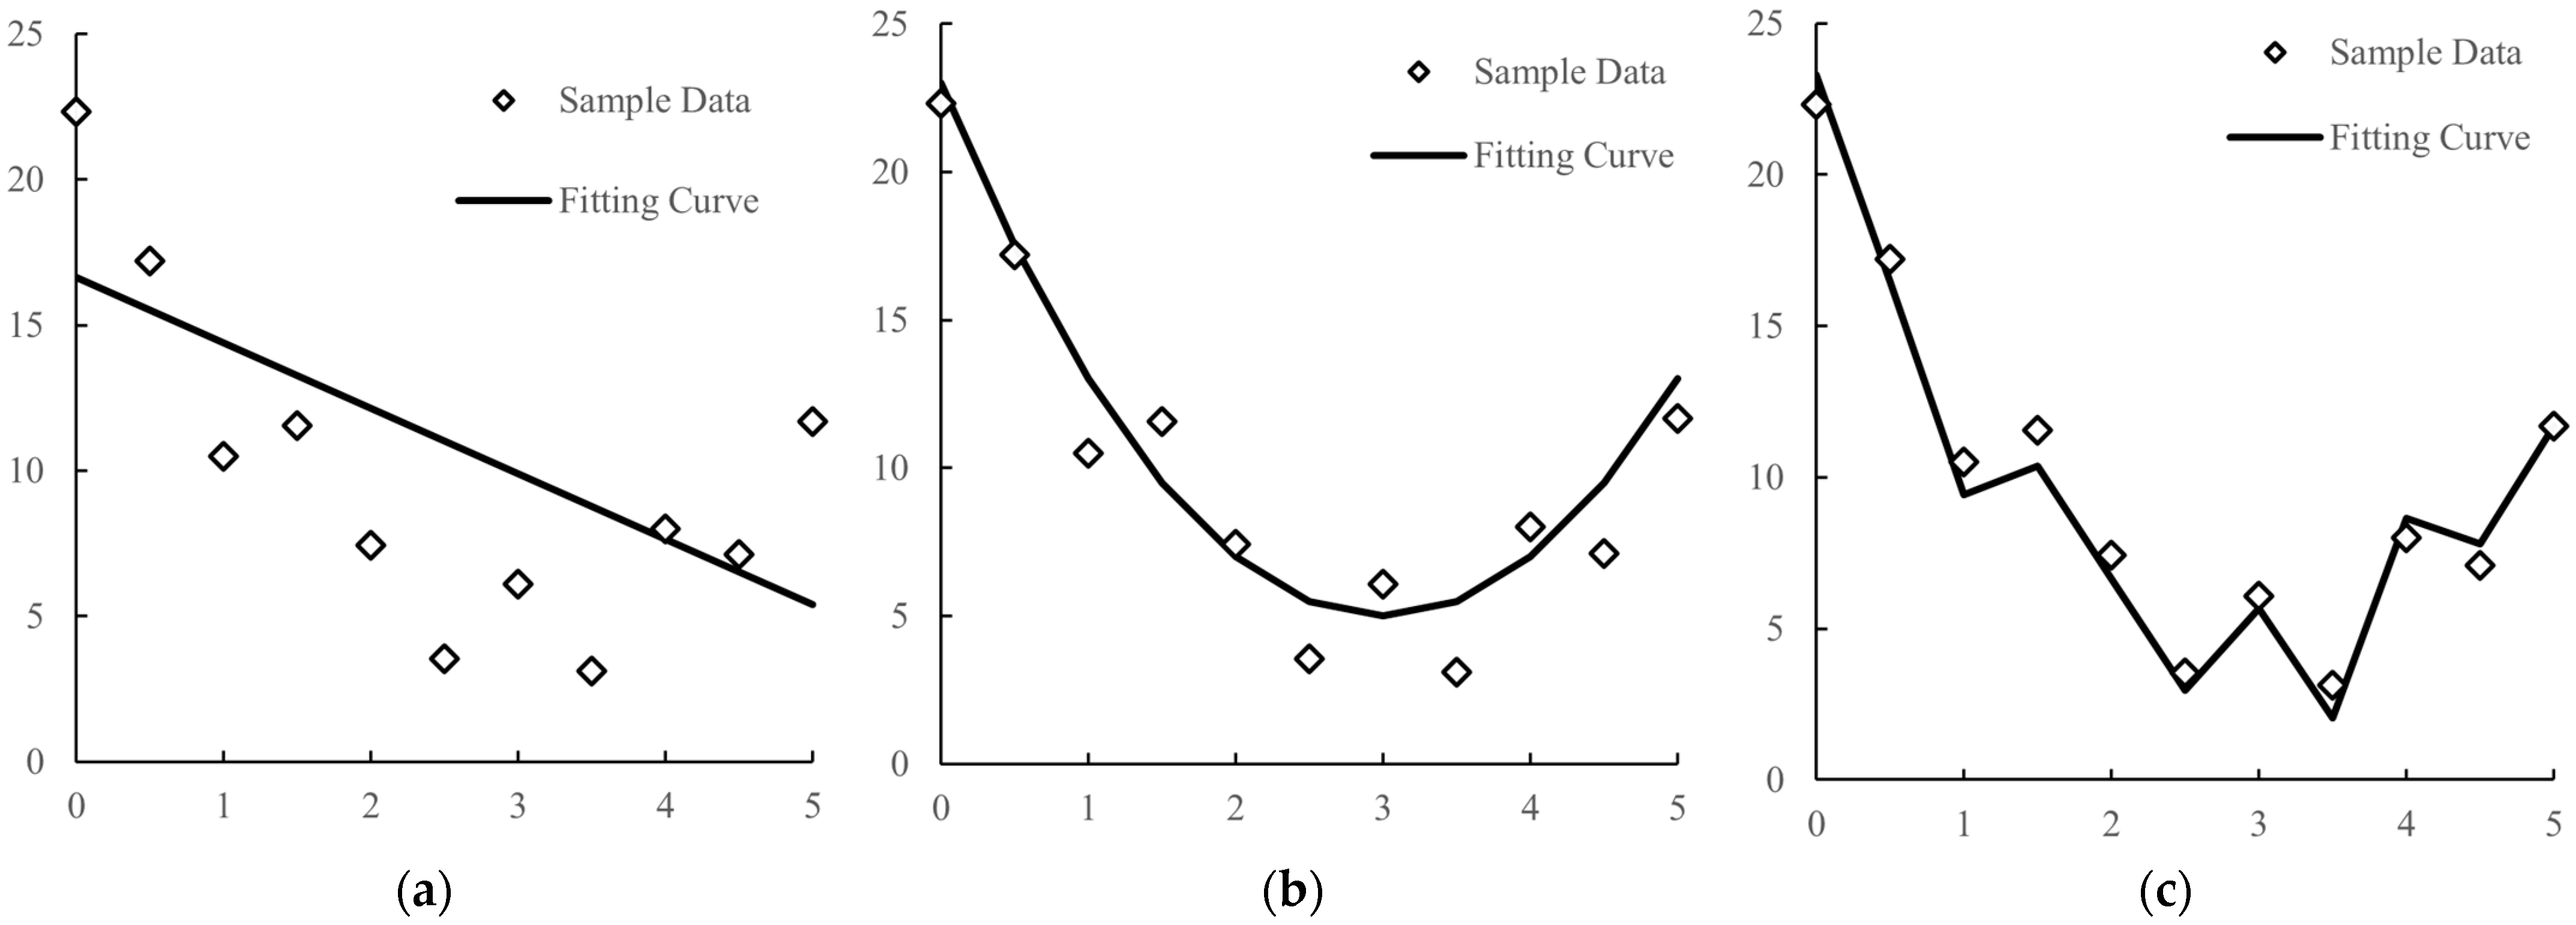
The most common difficulties encountered in the process of plant subject modeling are underfitting and overfitting. As shown in Figure 1, underfitting means that when the data fitting method is too simple, or the data sample is small, the model fitting performance and generalization ability would not be good enough. Overfitting is when the model performs too well on the training samples but poorly on the test dataset.
The main reasons for underfitting and overfitting include:
  • Bad fitting method;
  • The number of features is not well set;
  • The data sample is too small, or the data sample is not diverse enough.
In response to the above problems, this paper conducts research in the following aspects:
  • The Gaussian process regression method would be used in this paper to improve the fitting accuracy;
  • Correlation analysis is carried out on the main influencing factors of engine torque and NOx raw emission calculation, and the characteristic factors of torque and NOx raw emission calculation are established on this basis;
  • By increasing the data sample size, the fitting accuracy could be improved.

2.1. Principle Analysis of Gaussian Process Regression Technology

Gaussian Process Regression has the characteristics of strong calculation ability, strong adaptability, and strong fault tolerance, which can fully approximate any complex nonlinear relationship, and is suitable for application scenarios with multi-information fusion and high requirements for information comprehensive processing. At present, neural network technology is widely used to solve various challenges in modeling and controlling multivariate systems, such as classification, clustering, dimensionality reduction, regression, etc.
Gaussian Process Regression [11,18,19,20,21] (GPR) is a nonparametric modeling method that uses the Gaussian Process (GP) prior to data fitting and tuning. By learning from the sample dataset, the relationship f(x) between input and output could be obtained so that a new prediction can be made using a new prediction sample x* to obtain new output y*. According to the principle of Bayesian linear regression, GPR maps to high-dimensional space as follows:
{ f ( x ) = X w w ~ N ( 0 , p ) f ( x ) = Φ ( X ) w , w ~ N ( 0 , p )
Therefore, the mean value of f(x) would be:
E [ f ( x ) ] = E [ Φ ( X ) w ] = Φ ( X ) E ( w ) = 0
Covariance would be:
C o v ( f ( x ) , f ( z ) ) = E [ [ f ( x ) E ( f ( x ) ) ] [ f ( z ) E ( f ( z ) ) ] ] = E [ Φ ( X ) w Φ ( Z ) w ] = Φ ( X ) Σ p Φ ( Z ) T = κ ( x , z )
From the above analysis, it can be seen that:
  • The covariance between random variables f(x) can be calculated by the kernel function of the sample points;
  • The combination of samples {f(x)} obeys the Gaussian process GP shown in Equation (4).
f ( x ) ~ G P ( m ( x ) , κ ( x , x ) )
It can be seen from the above analysis that for the given dataset shown in Equation (5), its Gaussian process regression can be expressed as Equation (6).
X = ( x 11 x 1 n x m 1 x m n ) = ( x 1 x m ) Y = ( y 1 y m )
{ f ( x ) = [ f ( x 1 ) , f ( x 2 ) , f ( x m ) ] ~ G P ( μ ( x ) , Σ ( x ) ) Y = f ( X ) + ε ~ N ( μ ( x ) , Σ ( x ) + σ 2 I ) μ ( x ) = [ μ ( x 1 ) , μ ( x 2 ) , , μ ( x m ) ] T K = Σ ( x ) = [ κ ( x 1 , x 1 ) κ ( x 1 , x m ) κ ( x m , x 1 ) κ ( x m , x m ) ]

2.2. Analysis of Engine Torque and NOx Raw Emission Main Influencing Factors

When engine power is fixed, engine torque is inversely proportional to speed, that is, the higher the speed, the smaller engine torque would be. As shown in Equation (7), engine torque (shown as T in the equation, unit: Nm) can be calculated based on engine power (shown as P in the equation, unit: kW) and engine speed (shown as n in the equation, unit: r·min−1). Engine torque reflects the loading capacity of the engine within a certain range.
T = 9550 × P n
The engine operating conditions change rapidly, and engine torque and engine power are affected by many factors such as ambient temperature, ambient pressure, cooling water temperature, fuel injection quantity, rail pressure, EGR (Exhaust Gas Recirculation) rate, etc. NOx emission is one of the harmful by-products of engine combustion, it is also affected by many factors, such as sulfur content in the fuel, air–fuel ratio, ignition timing, engine speed and torque, etc. It brings great difficulty to the fitting of engine torque and NOx emission. In this paper, a 3.0 L diesel engine is taken as the research object, and the steady-state data are taken as sample data to analyze the main influencing factors of engine torque and NOx emission performance. The basic information about the engine used in this research is shown in Table 1. The sample size of dataset used in this research is 145,479, including a total of 471 variables.
To further analyze the main influencing factors of engine torque and NOx emission calculation, a data analysis script file is written with python to calculate the Pearson correlation coefficient (Pearson correlation coefficient, also known as Pearson product–moment correlation coefficient, PCC) between all variables in the dataset and engine torque and NOx raw emission [22,23,24].
The PCC is a statistical method to quantify the degree of correlation between variables. When the PCC is negative, it means that the X and Y are negatively correlated. On the contrary, it means the variables under evaluation are positively correlated, and the larger the absolute value of the PCC, the stronger the correlation would be. As shown in Equation (8), the PCC between variables X and Y is defined as the quotient of covariance and standard deviation between variables X and Y.
ρ X ,     Y = cov ( X , Y ) σ X σ Y = E [ ( X μ X ) ( Y μ Y ) ] σ X σ Y
The data analysis script used in this study is as follows:
  • import pandas as pd1
  • df1 = pd1.read_excel(‘F:\Dataset_D30.xlsx’)
  • result = df1.corr()
  • result.to_excel(‘Corr_Result.xlsx’)
As shown in Table 2, the calculation results show that engine torque and NOx raw emission are mainly affected by various factors such as actuator factors, i.e., accelerator pedal percentage, fuel injection timing and quantity, temperature, engine operating environmental factors such as ambient temperature and battery voltage and exhaust pollutant factors.

2.3. Construction of Engine Torque and NOx Raw Emission Regression Model

As shown in Figure 2, based on the correlation analysis results, if the engine is regarded as a black box system, after removing signals that should be used as output information such as exhaust temperature and emission information, the input information for engine torque and NOx emission calculation can be divided into the following three categories:
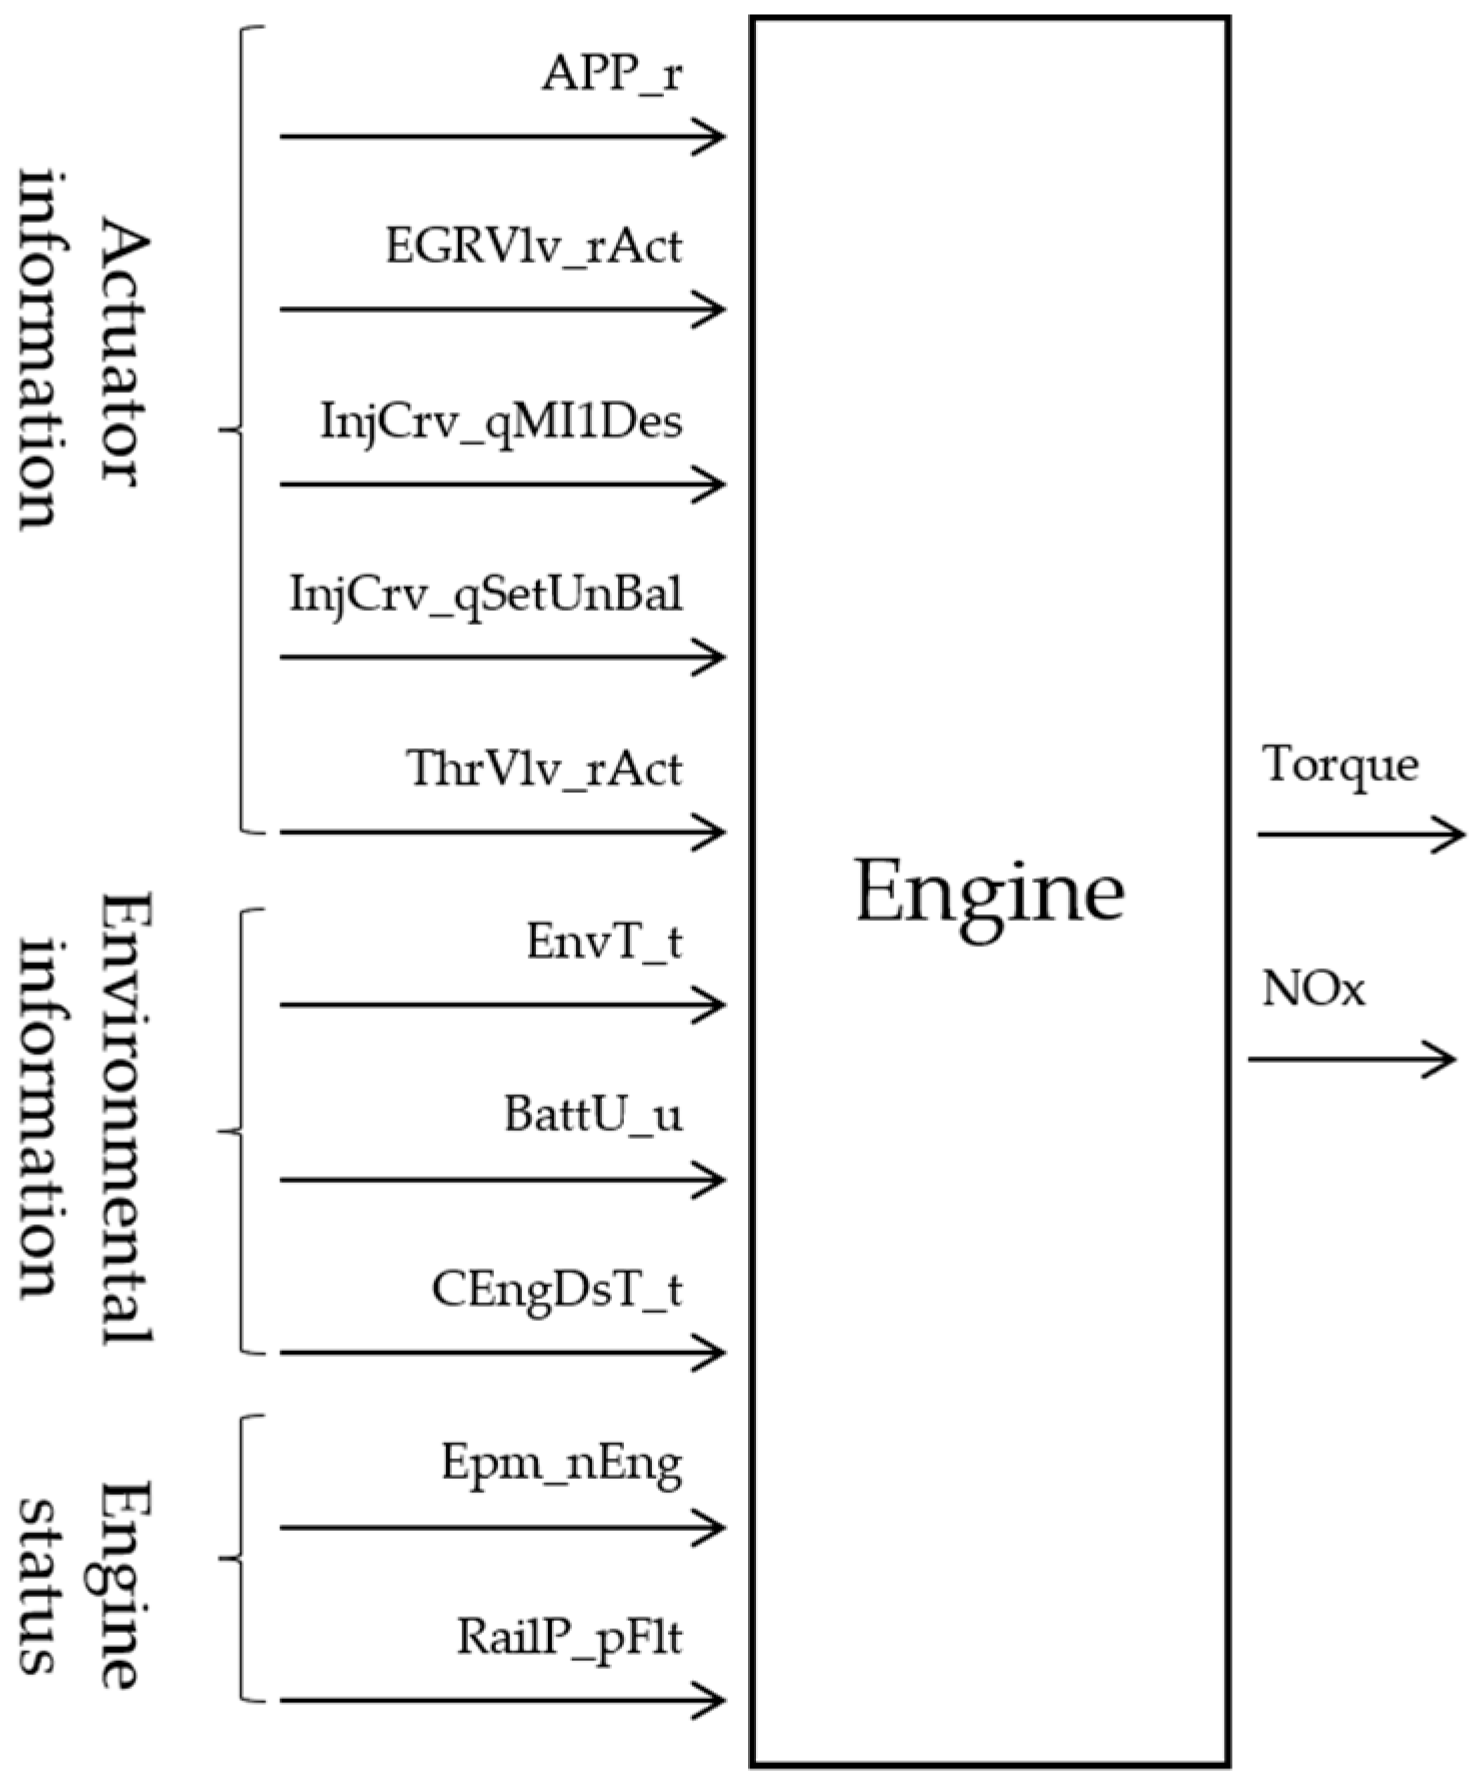
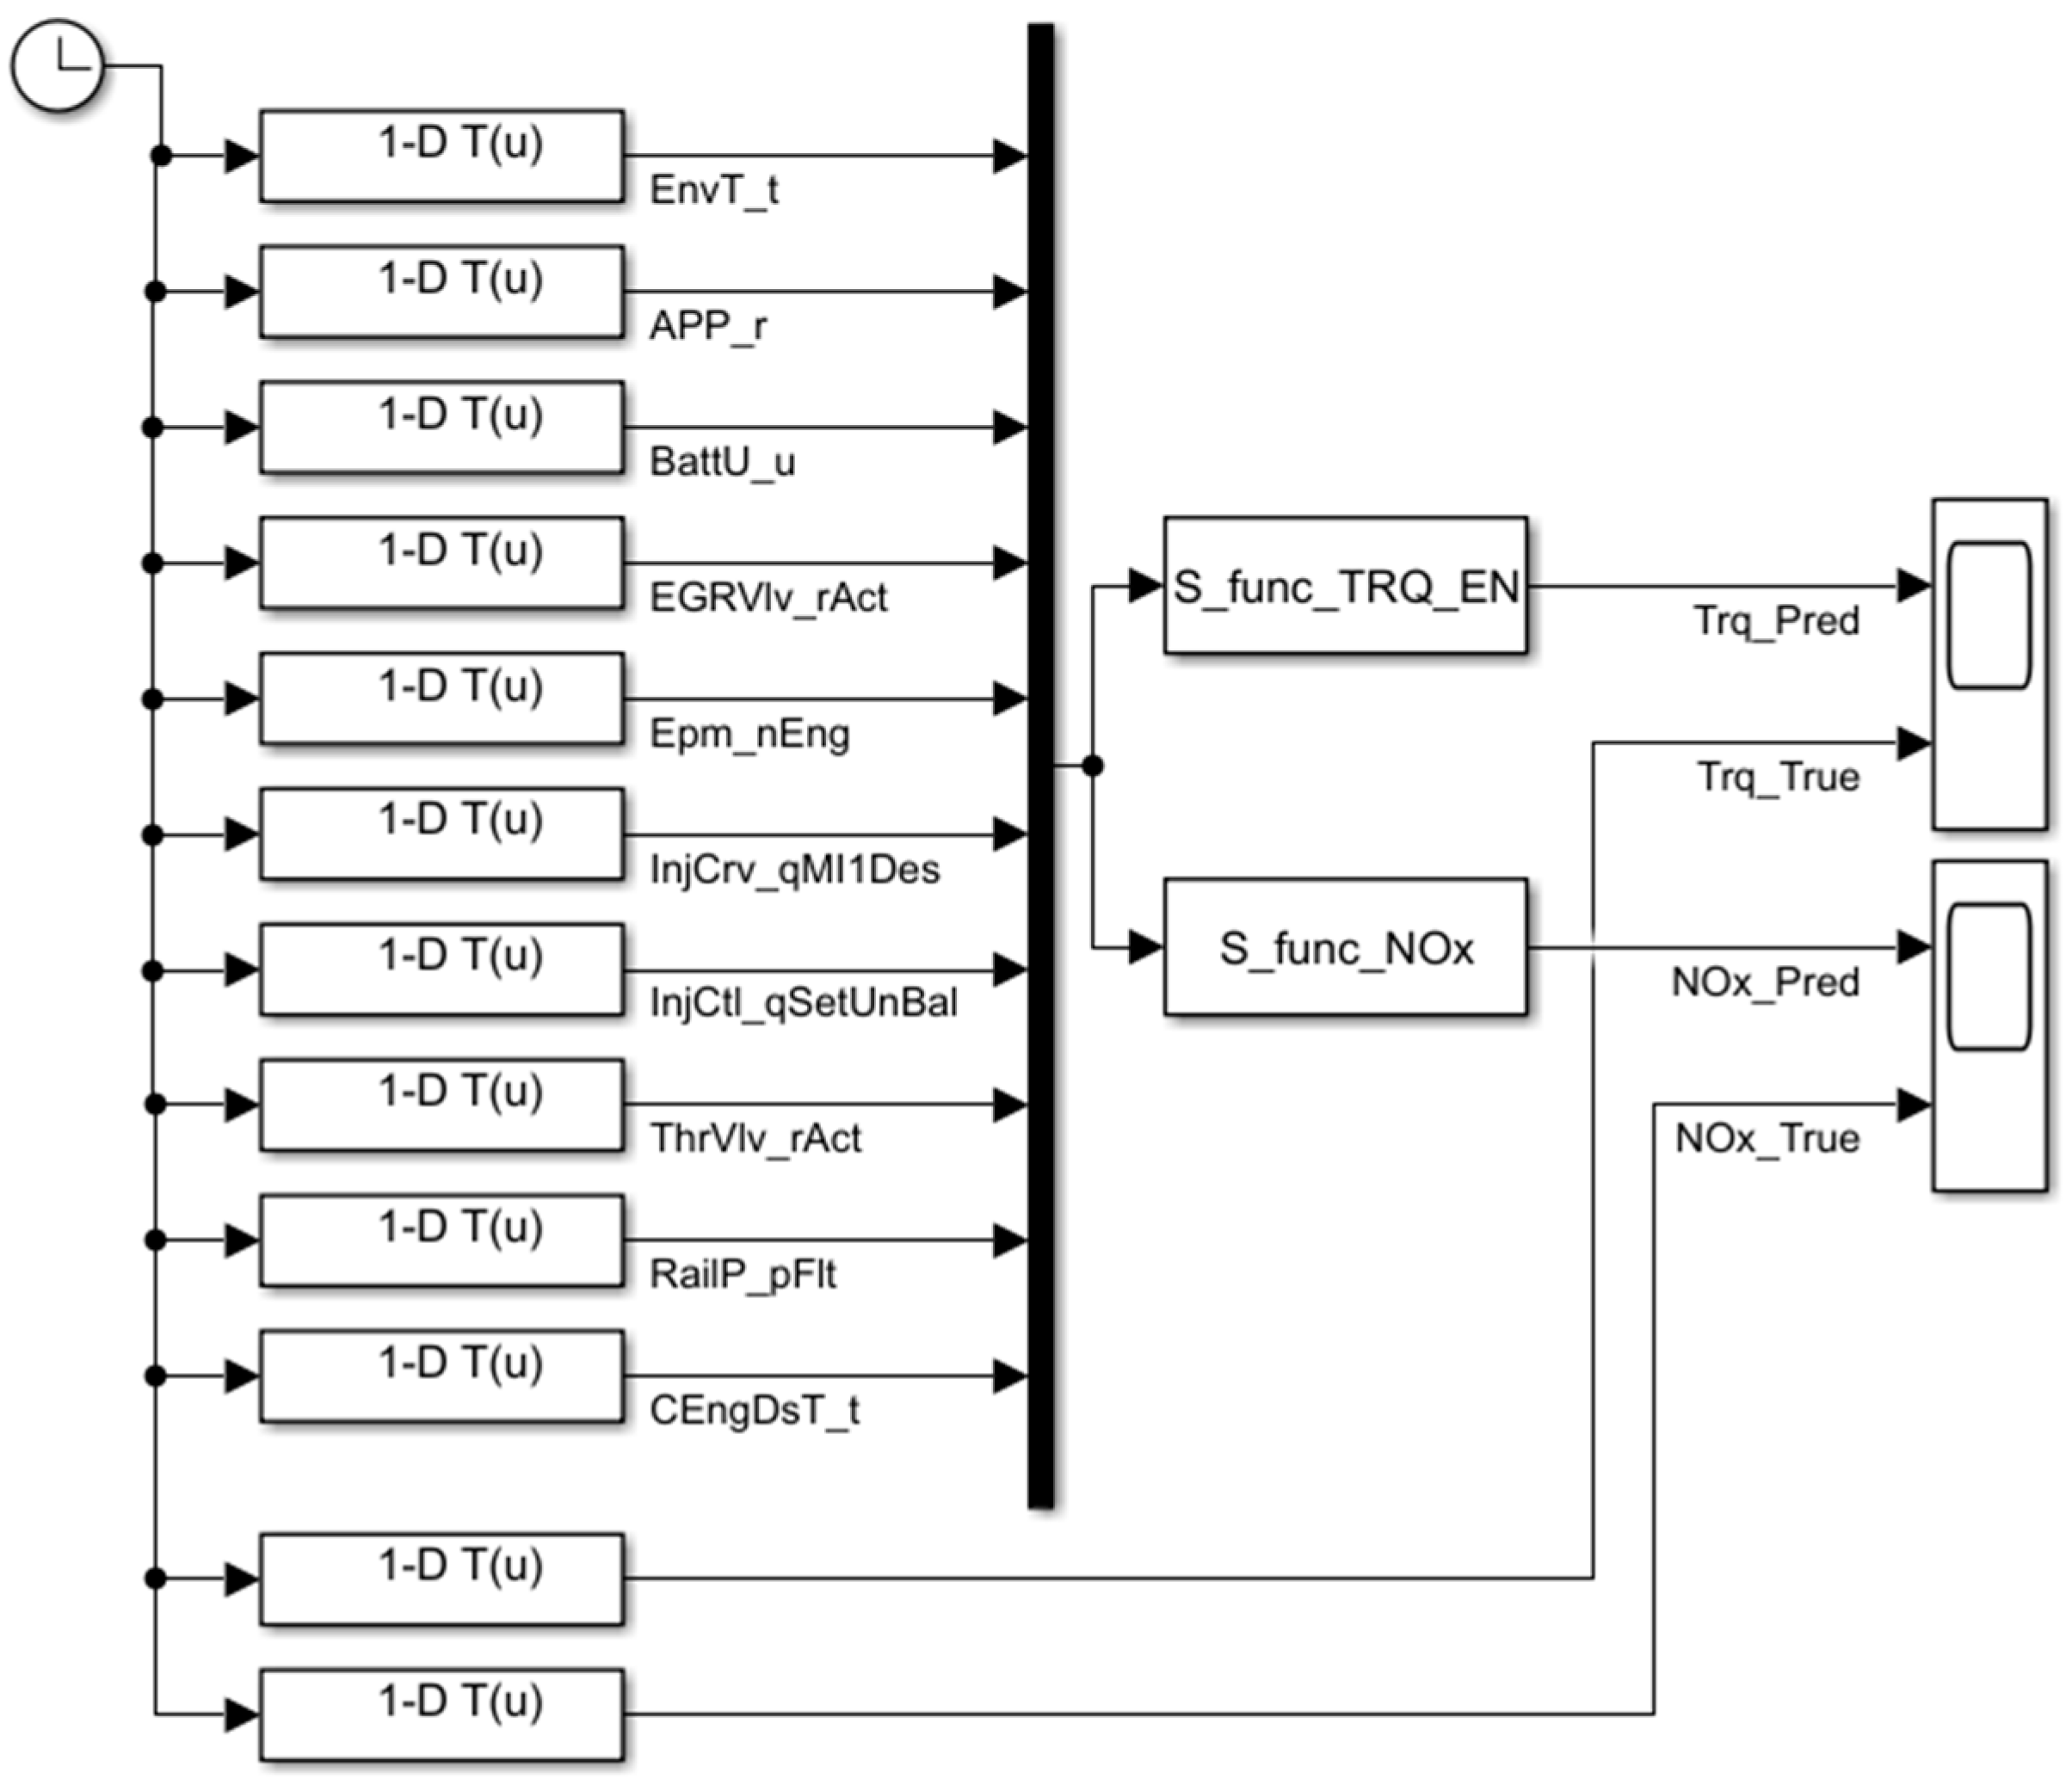
  • Actuator information: accelerator pedal percentage (APP_r), EGR valve percentage (EGRVlv_rAct), main injection quantity (InjCrv_qMI1Des), total fuel injection quantity (InjCrv_qSetUnBal), throttle valve percentage (ThrVlv_rAct);
  • Environmental status information: ambient temperature (EnvT_t), battery voltage (BattU_u), coolant temperature (CEngDsT_t);
  • Engine running status information: engine speed (Epm_nEng), rail pressure (RailP_pFlt).
To further fit the relationship between inputs and outputs in engine torque and NOx emission calculation, the Regression Learner tool in Matlab and the Gaussian regression algorithm are used in this research to fit engine torque and NOx emission signals [25]. The major version information of the tools used in this paper is shown in Table 3.
As shown in Table 4, after the calculation, the engine torque and NOx emission true value fit well with the predicted value. The RMSE (Root Mean Square Error) of engine torque calculation reaches 4.6186, and the R2 (fitting goodness) reaches 1.00. The RMSE of NOx emission reaches 67.599, and R2 reaches 0.99. The accuracy is high enough for the engine performance simulation.
As shown in Figure 3, after compiling the trained model into two S-functions (named S_func_TRQ_EN for the engine torque prediction model, and S_func_NOx for the NOx raw emission prediction model), a new validation model is built in Simulink to analyze the fitting results of the regression model built in this paper.

3. Results

3.1. Model Accuracy Validation

To further validate the accuracy of the prediction model, the torque (Torque_True) and NOx raw emission of the same type of engine under the WHTC cycle (World Harmonized Transient Cycle) condition is used to compare with the model prediction result (Torque_Predicted and NOx_Predicted). The training data are not included in the model training dataset, we use new data that the model has never seen before.
As shown in Figure 4 and Figure 5, the model fitting results are good with totally new data, and the model prediction results under the WHTC cycle condition fit well with the test results. For engine torque prediction, the RMSE value is 4.9208, and the prediction accuracy is 99.60%. For NOx raw emission prediction, the RMSE value is 72.38, and the prediction accuracy is 99.20%.
The test results show that the engine torque and NOx raw emission prediction model fitted by the Gaussian process regression method has extremely high accuracy, it also has good generalization ability, which provides a better technical solution for engine modeling.
To sum up, the engine torque and NOx emission prediction method using a regression algorithm has high accuracy and can provide a more efficient solution for the construction of the engine plant object model.

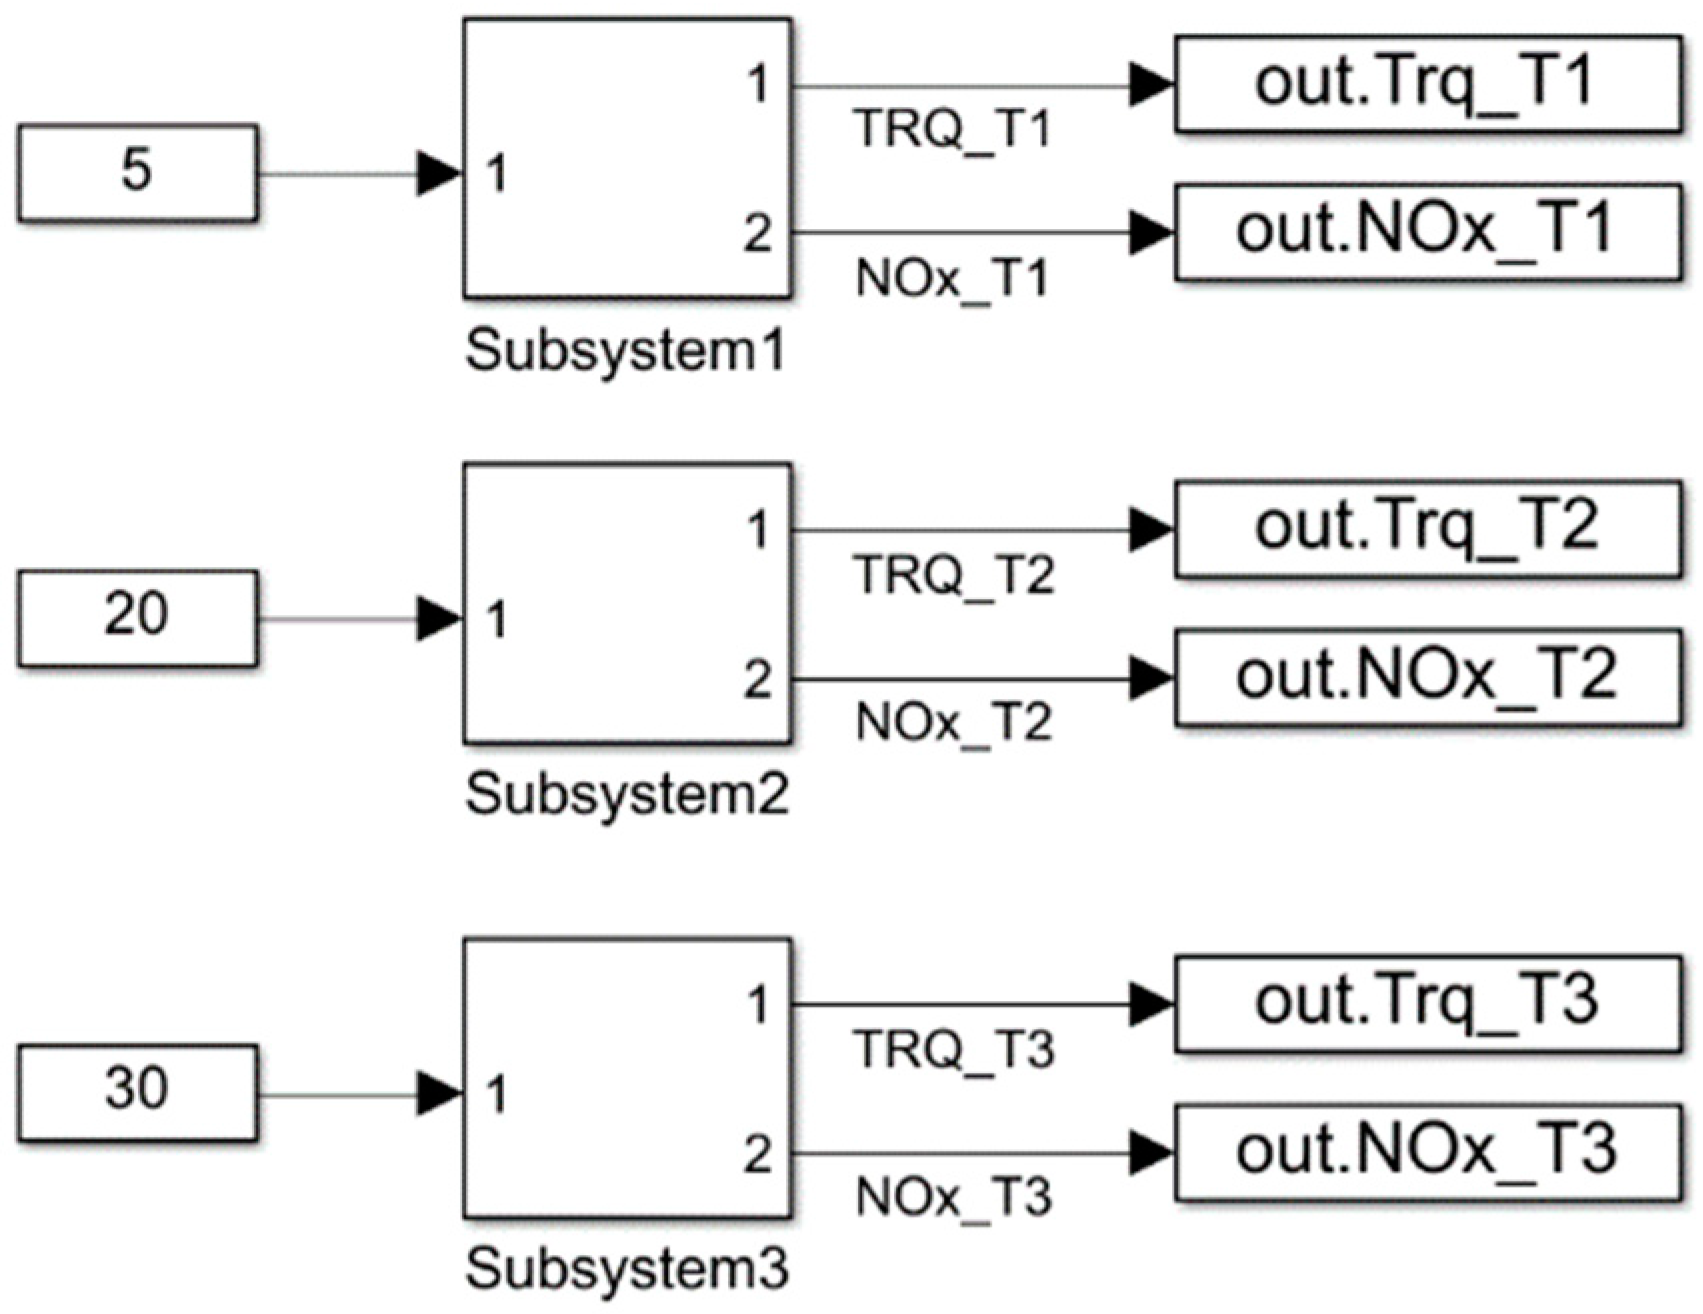
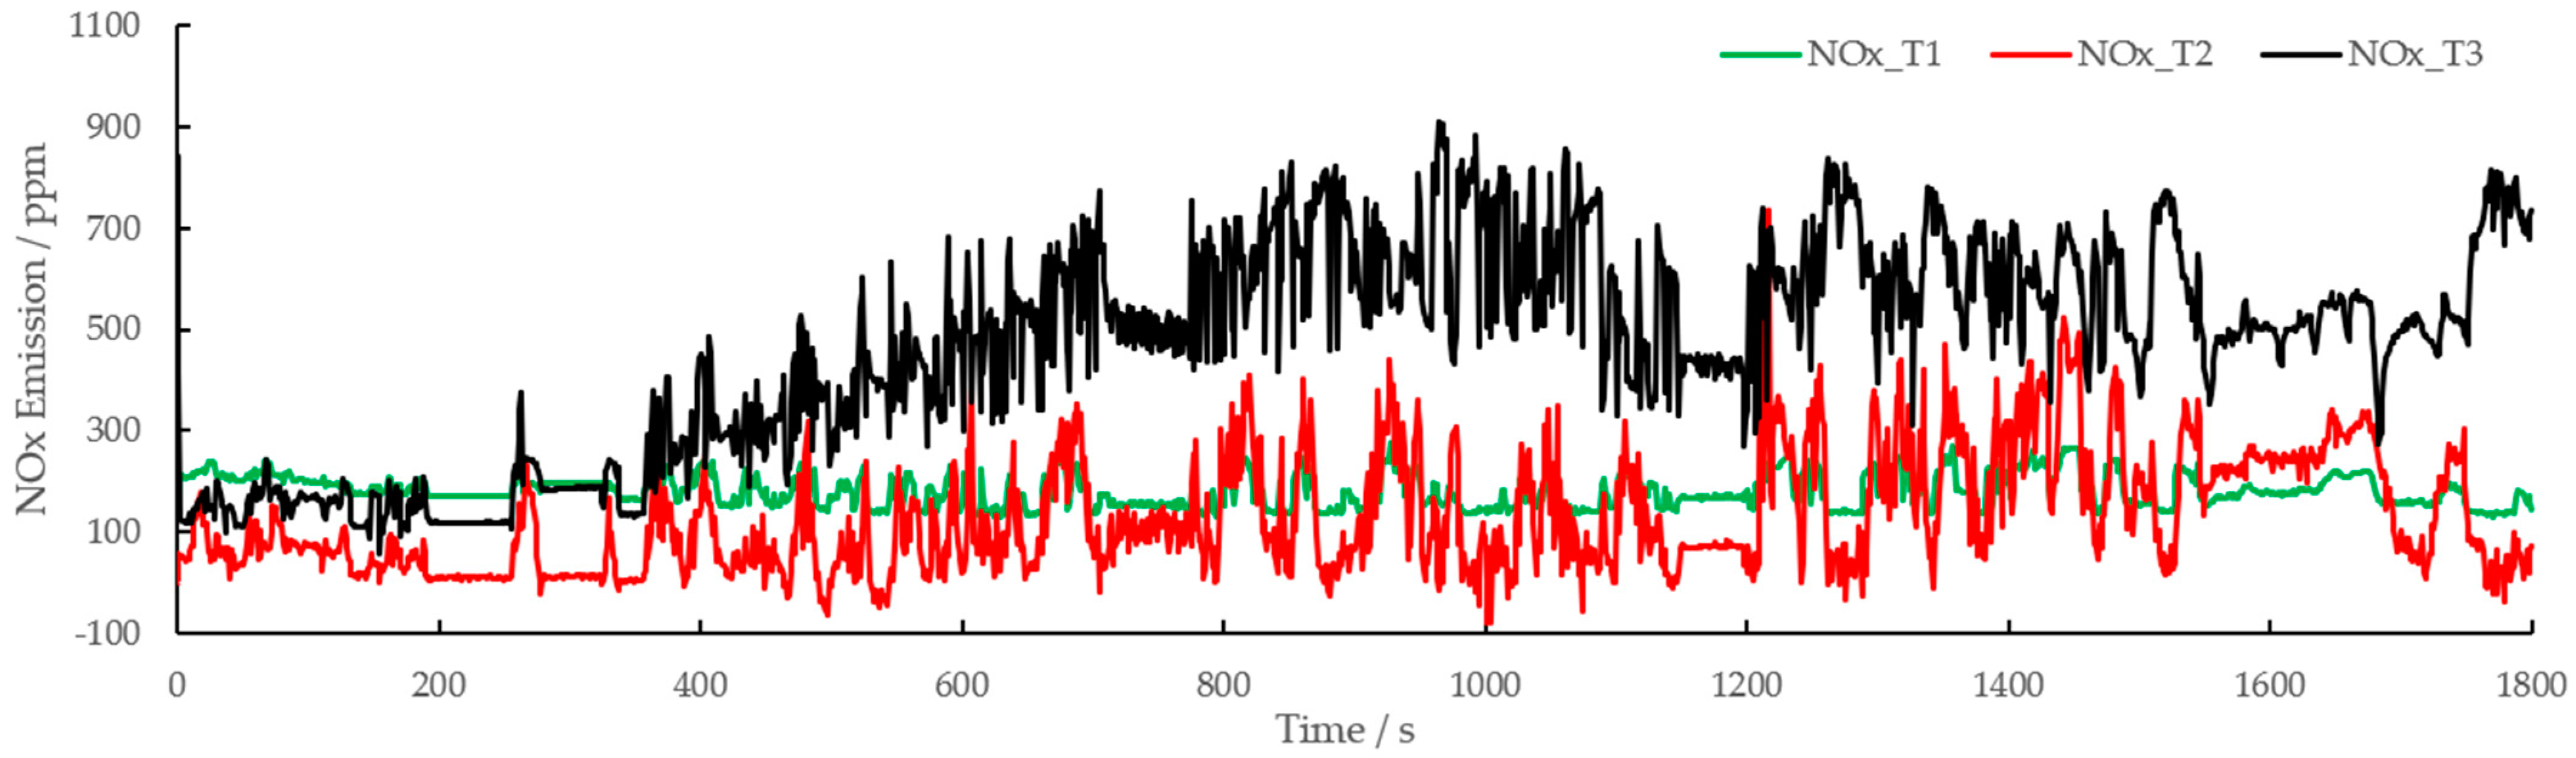
3.2. Influence of Ambient Temperature on Engine Torque and NOx Emission Performance

The ambient temperature affects the engine lubrication system, air intake system, etc. As shown in Figure 6, to study the influence of ambient temperature on engine torque performance, an analysis model is constructed in this paper, and the three operating conditions of ambient temperature are T1 = 5 °C, T2 = 20 °C, and T3 = 30 °C. Among them, as shown in Figure 7, the internal logic of Subsystem1~Subsystem3 is the same, that is, the ambient temperature value is changed while keeping other input conditions unchanged. The calculation results are shown in Figure 8 and Figure 9, and Table 5 and Table 6.
The calculation results show that when the ambient temperature is T1 = 5 °C, the engine torque calculation standard deviation is 72.756, the average engine torque is 110.789 Nm, engine NOx emission standard deviation is 31.620, average NOx emission is 180.892; when T2 = 20 °C, the engine torque standard deviation is 158.368, the average torque is 101.840Nm, NOx emission standard deviation is 114.834, average NOx emission is 128.584; and when T3 = 30 °C, the engine torque standard deviation is 185.325, and the average torque value is 72.581 Nm, NOx emission standard deviation is 203.009, average NOx emission is 467.662, that is, as the ambient temperature increases, the standard deviation becomes larger, the average torque value becomes smaller, and the engine torque value and NOx emission value are more discrete. From a principal point of view, when the ambient temperature increases, the viscosity of the oil decreases and the friction work of the engine decreases, which leads to the improvement of the torque dynamic response performance of the engine, therefore, the standard deviation becomes larger. At the same time, as the ambient temperature increases, the engine intake air temperature also increases, resulting in a decrease in air density, a decrease in the engine intake air mass flow rate, a decrease in the engine charging efficiency, and a decrease in the engine torque.

4. Conclusions

In this paper, an engine torque regression model is established based on the Gaussian process regression principle, and the following conclusions can be drawn:
  • The Pearson correlation analysis results show that engine torque and NOx raw emission are mainly affected by various factors such as actuator factors, i.e., accelerator pedal percentage and fuel injection timing and quantity, factors such as temperature and exhaust pollutants, and engine operating environmental factors such as ambient temperature and battery voltage. Based on the correlation analysis results, this paper selects a total of 10 input signals from three types of information: actuator information, environmental status information and engine operating status information, to establish an engine torque regression prediction model;
  • After training, the RMSE value of the regression model built in this paper reaches 4.6186, and the accuracy is 99.68%;
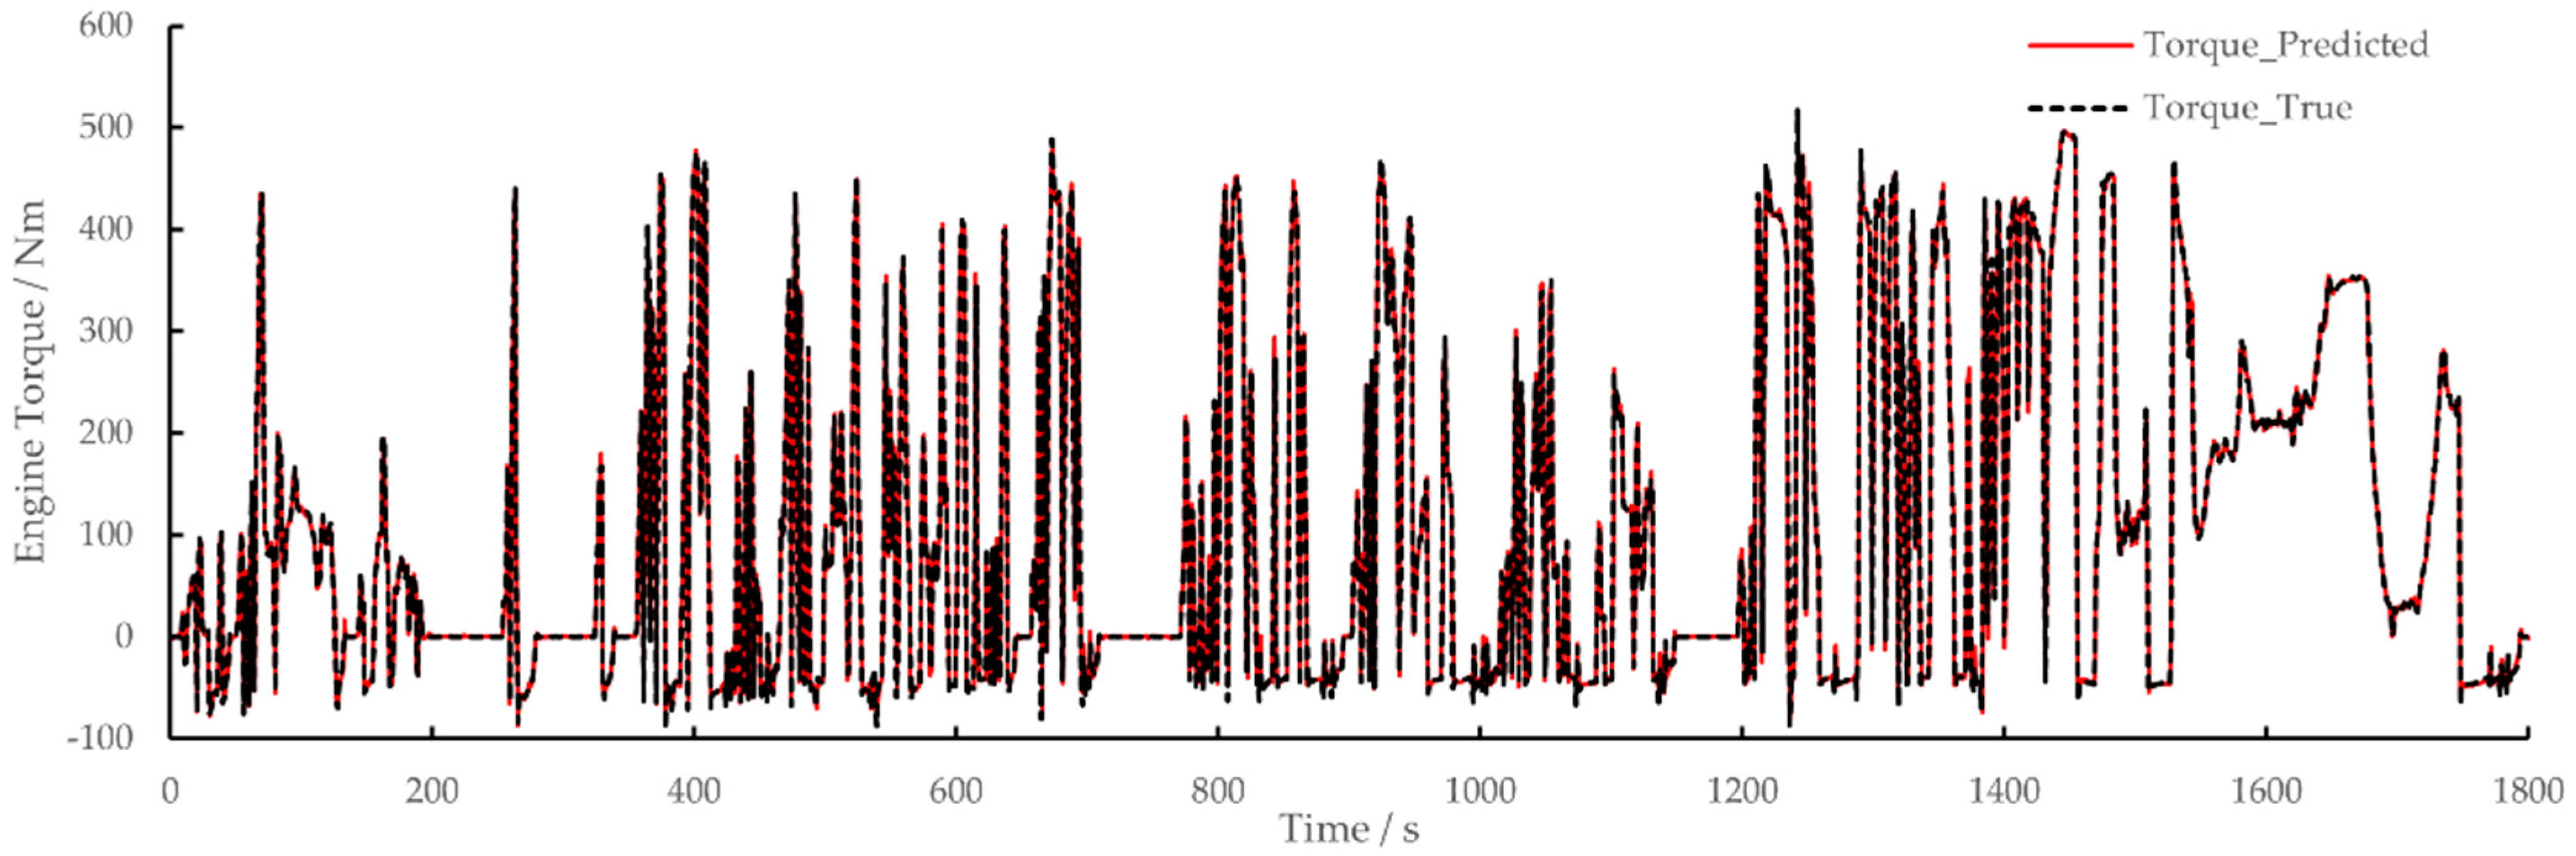
  • The prediction results of the model under a new WHTC cycle condition show that the RMSE value for engine torque prediction is 4.9208, accuracy is 99.6%, RMSE value for NOx raw emission prediction is 72.38, and accuracy is 99.2%. The model prediction is accurate;
  • The analysis results of ambient temperature impact on engine torque and NOx emission calculation show that with the increase in ambient temperature, the standard deviation becomes larger, and the value of engine torque and NOx emission becomes more discrete.
Different from the research methods of other scholars, this paper achieves higher accuracy by using the feature factor design based on correlation analysis and the Gaussian process regression method. Engine plant modeling technology has broad application prospects in HiL testing, virtual calibration and other fields. Future research courses could focus more on engine plant modeling, adaptive optimization and other fields to carry out more in-depth research.
In the follow-up research, experts and scholars can pay more attention to other performance areas of the engine, such as fuel consumption, emission of exhaust pollutants such as particulate matter, etc. Different from engine torque prediction, the prediction of engine exhaust pollutants has its own unique characteristics:
(1)
Time delay. There is often a time delay between changes in actuator operating conditions and changes in emissions performance, and this time delay is closely related to engine operating conditions;
(2)
The performance sometimes has a jumping step characteristic. Taking the prediction of particulate matter emission as an example, when the exhaust gas temperature reaches the light-off temperature of the oxidation catalyst, the particulate matter burns violently, and the particulate matter emission decreases rapidly.
Based on the above analysis, experts and scholars can try to use better prediction methods to predict the performance of engine emissions with high precision.

Author Contributions

Conceptualization, Z.Y. and D.J.; methodology, X.S.; software, Y.L.; validation, H.F., Y.L. and J.M.; formal analysis, Y.L.; investigation, D.J.; resources, X.S.; data curation, H.F.; writing—original draft preparation, Z.Y.; writing—review and editing, Y.L.; visualization, D.J.; supervision, X.S.; project administration, J.M. All authors have read and agreed to the published version of the manuscript.

Funding

This research received no external funding.

Institutional Review Board Statement

Not applicable.

Informed Consent Statement

Not applicable.

Data Availability Statement

The data presented in this study are available in the main text of the article.

Conflicts of Interest

The authors declare no conflict of interest.

References

  1. Bouscayrol, A. Different types of Hardware-In-the-Loop simulation for electric drives. In Proceedings of the IEEE International Symposium on Industrial Electronics, Cambridge, UK, 30 June–2 July 2008; pp. 2146–2151. [Google Scholar]
  2. Jafari, N.S. Real-time multi-rate HIL simulation platform for evaluation of a jet engine fuel controller. Simul. Model. Pract. Theory 2011, 19, 996–1006. [Google Scholar]
  3. Gaber, K.; El_Mashade, M.B.; Aziz, G.A.A. Hardware-in-the-loop real-time validation of micro-satellite attitude control—ScienceDirect. Comput. Electr. Eng. 2020, 85, 106679. [Google Scholar] [CrossRef]
  4. Yu, M.; Tang, X.; Lin, Y.; Wang, X. Diesel engine modeling based on recurrent neural networks for a hardware-in-the-loop simulation system of diesel generator sets. Neurocomputing 2018, 283, 9–19. [Google Scholar] [CrossRef]
  5. Pogorelov, G.; Kulikov, G.; Abdulnagimov, A.; Badamshin, B. Application of Neural Network Technology and Highperformance Computing for Identification and Real-time Hardware-in-the-loop Simulation of Gas Turbine Engines. Procedia Eng. 2017, 176, 402–408. [Google Scholar] [CrossRef]
  6. Jun, L.; Shi-hua, Y.; Dong-mei, J.; Rui-ying, L. Research on Test Methods for Special Vehicle Handling and Stability Based on Dynamics Simulation. Acta Armamentarii 2014, 35, 262. [Google Scholar]
  7. Termous, H.; Shraïm, H.; Talj, R.; Francis, C.; Charara, A. Coordinated control strategies for active steering, differential braking and active suspension for vehicle stability, handling and safety improvement. Veh. Syst. Dyn. 2019, 57, 1494–1529. [Google Scholar] [CrossRef]
  8. Wang, C.; He, X.; Shen, X.; Zhu, J.; Yin, Q.; Xu, L. Analysis of Handling Stability of Hydraulic Hybrid Vehicle based on ADAMS/Car Simulation. In IOP Conference Series: Earth and Environmental Science; IOP Publishing: Bristol, UK, 2018; Volume 186, p. 186. [Google Scholar]
  9. Mutha, M.; Karanjkar, C.; Kadekar, P.; Nikumb, M.; Palanivelu, S. Influence of vehicle parameters on handling characteristics and its control using torque vectoring. In IOP Conference Series: Materials Science and Engineering; IOP Publishing: Bristol, UK, 2019; Volume 624, p. 012015. [Google Scholar]
  10. Hu, J.; Chen, Z.; Yao, Y.; Shi, L.; Deng, K. Study on control-oriented emission predictions of PPCI diesel engine with two-stage fuel injection. Fuel 2022, 320, 123984. [Google Scholar] [CrossRef]
  11. Xiao, F.; Li, C.; Fan, Y.; Yang, G.; Tang, X. State of charge estimation method for lithium battery based on Gaussian process regression. J. Nav. Univ. Eng. 2021, 33, 55–59. [Google Scholar]
  12. Li, Y.; Duan, X.; Fu, J.; Liu, J.; Wang, S.; Dong, H.; Xie, Y. Development of a method for on-board measurement of instant engine torque and fuel consumption rate based on direct signal measurement and RGF modelling under vehicle transient operating conditions. Energy 2019, 189, 116218. [Google Scholar] [CrossRef]
  13. Tsitsilonis, K.M.; Theotokatos, G. A novel method for in-cylinder pressure prediction using the engine instantaneous crankshaft torque. Proc. Inst. Mech. Eng. Part M J. Eng. Marit. Environ. 2022, 236, 131–149. [Google Scholar] [CrossRef]
  14. Hui, X.; Li, X. Engine Torque Reconstruction Algorithm Based on OBD Data. J. Tianjin Univ. (Sci. Technol.) 2017, 50, 1124–1130. [Google Scholar]
  15. Varma, P.S.; Bhowmik, S.; Paul, A.; Madane, P.A.; Panua, R. AI-Based ANN Modeling of Performance—Emission Profiles of CRDI Engine under Diesel-Karanja Strategies. In Recent Advances in Mechanical Engineering; Springer: Singapore, 2021. [Google Scholar]
  16. Mishra, V.K.; Bhowmik, S.; Paul, A.; Yadav, A.; Panua, R. ANFIS Prediction of Performance and Exhaust Emission Characteristics of CRDI Engine Fueled with Diesel–Butanol Strategies. In Recent Advances in Mechanical Engineering; Springer: Singapore, 2021. [Google Scholar]
  17. Paramasivam, B.; Kumanan, S.; Kavimani, V.; Varatharajulu, M. Fuzzy-based prediction of compression ignition engine distinctiveness powered by novel graphene oxide nanosheet additive diesel–Aegle marmelos pyrolysis oil ternary opus. Int. J. Energy Environ. Eng. 2022, 13, 683–701. [Google Scholar] [CrossRef]
  18. Deng, T.; Ye, D.; Ma, R.; Fujita, H.; Xiong, L. Low-rank local tangent space embedding for subspace clustering. Inf. Sci. 2020, 508, 1–21. [Google Scholar] [CrossRef]
  19. Yang, X.; Jiang, X.; Tian, C.; Wang, P.; Zhou, F.; Fujita, H. Inverse projection group sparse representation for tumor classification: A low rank variation dictionary approach. Knowl. Based Syst. 2020, 196, 105768. [Google Scholar] [CrossRef]
  20. Si, S.; Hsieh, C.-J.; Dhillon, I. Memory efficient kernel approximation. J. Mach. Learn Res. 2017, 18, 682–713. [Google Scholar]
  21. Rose, S.; Pannek, K.; Bell, C.; Baumann, F.; Hutchinson, N.; Coulthard, A.; McCombe, P.; Henderson, R. Direct evidence of intra- and interhemispheric corticomotor network degeneration in amyotrophic lateral sclerosis: An automated MRI structural connectivity study. Neuroimage 2012, 59, 2661–2669. [Google Scholar] [CrossRef] [PubMed]
  22. Bastos, A.M.; Schoffelen, J.-M. A Tutorial Review of Functional Connectivity Analysis Methods and Their Interpretational Pitfalls. Front. Syst. Neurosci. 2016, 9, 175. [Google Scholar] [CrossRef] [PubMed] [Green Version]
  23. Vinck, M.; Oostenveld, R.; Van Wingerden, M.; Battaglia, F.; Pennartz, C.M. An improved index of phase-synchronization for electrophysiological data in the presence of volume-conduction, noise and sample-size bias—ScienceDirect. NeuroImage 2011, 55, 1548–1565. [Google Scholar] [CrossRef] [PubMed]
  24. Chen, X.; Liu, J.; Guo, Z.; Wu, T.; Hou, J.; Cheng, J. Protein model accuracy estimation empowered by deep learning and inter-residue distance prediction in CASP14. Sci. Rep. 2011, 11, 10943. [Google Scholar] [CrossRef] [PubMed]
  25. Gao, M.; Zhou, H.; Skolnick, J. DESTINI: A deep-learning approach to contact-driven protein structure prediction. Sci. Rep. 2019, 9, 3514. [Google Scholar] [CrossRef] [PubMed] [Green Version]
Figure 1. Data Fitting Performance: (a) Underfitting; (b) Just fitting; (c) Overfitting.
Energies 15 04346 g001
Figure 2. Schematic diagram of engine torque calculation.
Energies 15 04346 g002
Figure 3. Engine Torque and NOx Emission Validation Model.
Energies 15 04346 g003
Figure 4. Engine torque prediction validation result under WHTC cycle condition.
Energies 15 04346 g004
Figure 5. NOx raw emission validation result under WHTC cycle condition.
Energies 15 04346 g005
Figure 6. Analysis Model of Influence of Ambient Temperature on Engine Torque Performance.
Energies 15 04346 g006
Figure 7. Internal Calculation Logic of Subsystem1~Subsystem3.
Energies 15 04346 g007
Figure 8. Effect of Ambient Temperature on Engine Torque Performance.
Energies 15 04346 g008
Figure 9. Effect of Ambient Temperature on NOx Emission Performance.
Energies 15 04346 g009
Table 1. Basic engine information.
ParameterValue
Displacement/L2.977
Air intakeTurbo-charged
Cylinder arrangementIn-line
Rated power/speed (kW/r·min−1)125/2800
Compression ratio16.0:1
Fuel systemCommon rail
Fuel injection pressure/MPa200
Table 2. Engine torque and NOx raw emission main influencing factors.
ParameterUnitFactor_Trq 1Factor_NOx 2MinimumMaximumAverage
Total fuel injection quantity (InjCrv_qSetUnBal)mg·hub−10.99220.64473.6292.7242.47
Main injection quantity (InjCrv_qMI1Des)mg·hub−10.98740.65571.6292.7239.42
Main injection activation timing (InjVlv_tiMI1ET)μs0.95430.7336310.82127.2776.74
Accelerator (APP_r)%0.93940.6504010043.60
Accelerator raw voltage (APP_uRaw1)mV0.93550.6347752.442572127.2
Engine power (PWR_E_EN)kW0.896304702−2.24125.4244.68
Exhaust temperature before turbo (T_EGH_BTUR)°C0.89600.4872104.5759.2453.75
Exhaust temperature after turbo (T_EGH_BTUR)°C0.87340.478863613.9336.89
IMEP 3bar0.85840.7163−1.4323.325.78
Oxygen content at exhaust manifold (Y_O2_EGD)ppm−0.8549−0.32560832.8170.15
Rail pressure (RailP_pFlt)hPa0.72850.3017426,6002,020,8001,248,791.99
Air intake pressurekPa0.76980.352988.39265.46188.89
Lambda/−0.7691−0.45091.099.552.54
CO 4 content at exhaust manifold (Y_COL_EGD)ppm−0.6685−0.348104842.06417.97
Air intake temperature°C0.57820.230822.854.435.11
Exhaust pressure before turbokPa0.52290.199999.92455.04246.46
Main injection timing (InjCrv_phiMI1Des)°0.49430.2986−6.89920.7865.49
Throttle valve percentage (ThrVlv_rAct)%−0.3362−0.4300010038.44
Engine coolant temperature (CEngDsT_t)°C0.29690.166566.7692.4688.02
Ambient temperature (EnvT_t)°C0.21580.0905123226
EGR valve percentage (EGRVlv_rAct)%0.0698−0.2885010019
Engine speed (Epm_nEng)r·min−10.0240−0.218078330071875.9
1 Coefficient factor for engine torque. 2 Coefficient factor for NOx raw emission. 3 Indicated mean effective pressure. 4 Carbon moNOxide.
Table 3. Tool information.
ToolsVersion Information
MatlabVersion 9.10 (R2021a)
SimulinkVersion 10.3
Deep Learning ToolboxVersion 14.2
Table 4. Engine torque and NOx raw emission fitting result.
TorqueNOx
RMSE4.618667.599
R21.000.99
MSE26.8024569.6
MAE1.367124.522
Table 5. Influence of Ambient Temperature on Engine Torque.
T1 = 5 °CT2 = 20 °CT3 = 30 °C
Standard Deviation72.756158.368185.325
Average Value/Nm110.789101.84072.581
Maximum Value/Nm285.947533.995440.316
Minimum Value/Nm7.979−110.268−356.967
Table 6. Influence of Ambient Temperature on Engine NOx Raw Emission.
T1 = 5 °CT2 = 20 °CT3 = 30 °C
Standard Deviation31.620114.834203.009
Average Value/Nm180.892128.584467.662
Maximum Value/Nm278.44736.418908.678
Minimum Value/Nm128.252−81.20655.030
Publisher’s Note: MDPI stays neutral with regard to jurisdictional claims in published maps and institutional affiliations.

