Article

Laser Doppler Vibrometry for Evaluating the Quality of Welds in Lithium-Ion Supercells

1
Warwick Manufacturing Group (WMG), University of Warwick, Coventry CV4 7AL, UK
2
Polytec Ltd., Unit 8, The Cobalt Centre, Siskin Parkway East, Coventry CV3 4PE, UK
3
Department of Mechanical Engineering, Indian Institute of Technology, Hauz Khas, New Delhi, Delhi 110016, India
*
Authors to whom correspondence should be addressed.
Energies 2022, 15(12), 4379; https://doi.org/10.3390/en15124379
Submission received: 26 April 2022 / Revised: 2 June 2022 / Accepted: 10 June 2022 / Published: 16 June 2022

Abstract

:
The inspection of the quality of welds in battery packs plays an important role in ensuring safety during the manufacturing and operation of energy-storage devices in automotive vehicles during service. This research investigated the novel application of laser Doppler vibrometry, a widely used non-destructive optical technique for modal analysis, to the post-weld evaluation of micro-TIG-welded interconnections in lithium-ion supercells. The experimental modal analysis showed features in the modal models of the supercells that were unique to their welding conditions. The comparisons between the supercells showed an absence of linear correlations between the modal parameters and the welding current, as well as differences in the welding parameters obtained from the negative and positive terminals of the cylindrical cells. These findings suggested that the modal parameters of the supercells were more strongly influenced by the rigidity of the structural materials than by the localized compliance of the welded interconnections. While this investigation demonstrated a method for using laser Doppler vibrometry to distinguish between different welding conditions in lithium-ion supercells at a structural level, further development is needed to identify the weld quality of individual interconnections.

1. Introduction

In this study, we present a demonstration of laser Doppler vibrometry (LDV) for the purpose of the post-weld evaluation of battery welds. Herein, it is demonstrated that this non-destructive testing (NDT) technology can serve as a means for comparing battery modules with welds of varying quality, thereby providing valuable information for quality control in efficient production.

1.1. Current Trends in Industrial Joining

Industrial joining is progressing towards a paradigm of Intelligent Welding Systems. These systems have been characterized by Wang et al. as automated systems that can intelligently adjust processes in customized production while maintaining high standards of quality [1]. These systems have been enabled in part by harnessing recent developments in smart industrial control, connectivity, and artificial intelligence that are more widely transforming production throughout the manufacturing sector. These developments include inspection technologies that are applied before, during, and after the welding process that are utilized for the preparation of joining processes, the optimization of weld stability, and quality control [2]. Optical sensors are most commonly used for process optimization; photodiodes and cameras observe vapor plumes at UV-visible frequencies, while thermal radiation and its distribution are observed in the IR-range by spectrometers and pyrometers [3,4,5,6,7]. Other automated techniques include acoustic emission [8,9], ultrasound [10,11], and X-ray radiography [12]. Because these individual technologies have specific competencies and limitations in identifying particular types of defect, state-of-the-art defect-detection utilizes multiple-sensor fusion in order to complement the capabilities of specific sensors [13,14]. Examples include the combination of multiple photodiodes and optical and spectroscopic sensors [15,16]. Common to the development of automated control and default detection is a reliance on machine learning in order to recognize and interpret features [17,18]. Machine vision is a prominent example of a non-contact detection technique that has been applied to the intelligent detection of welds. It has been particularly favored for its comparatively low cost, high speed of operation, and reportedly high precision [19,20,21].

1.2. State-of-the-Art in Micro-Welding Evaluation Technologies and Their Relation to Battery Joining

The use of microtechnology has increased over the last few years towards a state where micro-welding has achieved significant importance for producing components from thin sheets. Microtechnology has thus been demonstrated as a valuable enabler for various industrial applications, including battery-interconnection welding, micro-turbine fabrication, and micro-electronics [22,23,24,25]. A requirement for micro-welding is an efficient joining method that can address the joining challenges associated with thin sheet welding, such as overheating, deformation, twisting, and good part fit-up [26,27]. Therefore, attention to the precise control of the power input is crucial during the micro-welding process. An instructive application for micro-welding is its use for joining batteries for electric vehicles. Joining in automotive traction batteries takes place after the production of the lithium-ion cells, which itself is a lengthy process that includes electrode preparation, cell assembly, and battery electrochemistry activation [28]. Battery packs are typically assembled from numerous modules that are packaged together with auxiliary components, such as electrical cables. Each module may contain several individual cells, or the modules may be further subdivided into groups that are termed sub-modules, super-cells, or strings, which themselves contain as many as tens of cells, depending on the format and size of the cells [29,30,31]. Joining processes that are utilized during the manufacturing of battery packs includes structural and thermal joining that is related to the battery enclosure, such as the use of potting compounds and phase-change materials for heat management [32] or the riveting of sheet metal [33]. In addition to the joining of structural materials, an indispensable joining operation inside modules is the creation of the electrical interconnections between individual cells and busbars, which serves to connect them as functional energy-storage systems [34]. The various joining techniques that have been adopted for automotive battery system manufacturing include ultrasonic welding, resistance spot/projection welding, micro-TIG, ultrasonic wedge bonding, micro-clinching, soldering, laser welding, magnetic pulse welding, and mechanical assembly [35]. One such widely used micro-processes is micro-tungsten inert-gas (micro-TIG) welding, which is a well-known joining technique for many industrial applications. This includes thin-tab– cell-terminal joining, which has the advantages of relatively low equipment cost, good quality of control and process monitoring, and low variation in process parameters [36,37].

2. Laser Doppler Vibrometry as a Technology for Post-Welding Evaluation

LDV operates on the principle of measuring the Doppler frequency shift of light that has been scattered from a moving surface. This frequency shift is proportional to the velocity of the moving surface, which permits the measurement of the velocity of a vibrating surface by observation of the scattered light. This is commonly achieved with laser systems by interferometrically combining the scattered light with a reference beam [38]. Since acceleration and displacement can be derived from velocity, this technique is a ubiquitous resource for experimental modal analysis and structural health monitoring. The high precision afforded by contemporary LDV systems has seen their use in a wide range of applications in which non-contact measurement is beneficial, from microscopic organic tissue to large civil structures [39,40,41]. A noteworthy application of LDV is in the modal analysis of ultra-light structures, for which the mass of even relatively lightweight contact-measurement sensors, such as miniature accelerometers, is enough to bias results [38,42,43]. Furthermore, non-contact techniques such as LDV offer an advantage for observing surfaces that might not be accessible to physical sensors. Vibrometry spectra yield copious data relating to the amplitude, frequency, and phase of the dynamic response of a target surface. For experimental modal analyses, spectra are obtained at numerous points to broadly characterize the target surface, such as through the use of an automated scanning system [44]. The results are collated in order to determine the modal response of the underlying structure. By contrast, for the purpose of structural health monitoring, long-term changes in resonance spectra can be correlated with specific changes in the structure at a discrete number of locations [45,46]. Structural health monitoring and experimental modal analysis are examples of activities in which LDV fulfils a role in the inspection of products for quality control. In addition, LDV makes a notable contribution to quality management as an enabling technology for evaluating processes as part of quality assurance [47]. An example of this is its use for the process optimization of wire bonds for semiconductor chip manufacturing, in which the high sensitivity and accuracy of LDV are valued for enabling fine control of manufacturing processes [48,49,50].
By comparison with optical methods, vibrometry is under-investigated as a means of evaluating the quality of welds. This is partly because of the inconvenience posed by mechanical noise in the production environment, which influences the efficacy of vibration and acoustic detection methods [3,4]. Nonetheless, LDV has been applied in defect detection for ultrasonic welding processes, where it is a valuable technology for making precise measurements of the amplitude and frequency of devices, such as sonotrodes and wire bonders [51]. Reporting on several studies that used either LDV, high-speed cameras, or digital image correlation to observe changes in the geometry of ultrasonic welds, Balz et al. surmised that the outcome of such a complex and highly dynamic process can be appropriately evaluated by post-weld characterization [52]. The quality of ultrasonic welds can thus be inferred by observation of the dynamics of the welding apparatus and the surfaces of the welded substrates. This is necessary in cases in which the welded region is located between substrates, and is therefore inaccessible to direct observation. For example, Balle et al. monitored the amplitude and frequency of vibration of a sonotrode during the ultrasonic welding of aluminum- and carbon-fiber-reinforced plastic sheets [53]. Lu et al. took a similar approach by using LDV to observe the relative movements of the anvil, sonotrode, and aluminum substrates of an ultrasonic welding process. The samples were produced at different welding energies and tested to destruction by lap-shear strength. A strong correlation was reported between the lap-shear strength and the characteristics in the velocity of the sonotrode and substrates. Microstructural characterization confirmed that this correlation was associated with favorable bonding at the interface [54]. Lu’s post-weld characterization method showed that the quality of the welds from a particular repeatable joining process could be adequately inferred from the velocity measured with LDV, provided that the welding process was stable, controlled, and corroborated by prior destructive testing.
LDV is also prevalent in the optimization of electronic interconnections in semiconductor device fabrication. In addition to its use for industrial-process optimization, LDV has been employed to observe the displacement of wire bonds in response to mechanical excitation for the purpose of determining their fatigue endurance [55,56,57,58]. This approach to determining fatigue life by observing long-term changes to the displacement of an interconnection is similar to the practice of using LDV for structural health monitoring. A poorly adhered or detached wire bond is expected to move with greater freedom with respect to its substrate, which results in greater amplitudes of displacement and vibration damping than a well adhered wire bond. This behavior influences the properties of resonance and damping that are observed in a comparison of the vibration spectra of well bonded and poorly bonded interconnections. Examples of this approach include Gaul et al.’s report on the correlations between the vibration amplitude of a tool tip with the occurrence of particular stages of operation of an ultrasonic wire bonder [59] and Qin et al.’s description of the correlations between specific vibration harmonics in the signal of the tool-tip amplitude of an ultrasonic wire bonder and the quality of bonds [60]. These methods are similar to Lu’s indirect inference of weld quality by LDV, insofar as the relevant features in a spectrum can be correlated with the changes in the stiffness of the interconnection area.

2.1. Applicability to Weld Evaluation in Lithium-Ion Cells

Welded interconnections are present in energy-storage systems using a wide variety of chemistries, such as lead–acid, nickel–cadmium, and sodium–sulfur batteries. They are present in air, rail, and road transportation vehicles, as well as in stationary energy-storage for utility-scale renewable energy generation [61,62,63]. An illustrative example of how the quality of interconnections can affect user safety and manufacturing productivity is the weld quality of wire bonds or tabs between individual lithium-ion cells for automotive traction [35]. Poorly controlled weld penetration can puncture cells, which may lead to explosions or the emission of harmful gases. Alternatively, a loss of voltage caused by the failure to form adequate welds on a particular cell or module can lead to the scrappage of an entire battery [64]. Kang and Cai demonstrated that the vibration dynamics of battery tabs can be modeled by representing these thin metallic strips as beams that deform primarily in flexion in response to the vibration applied by an anvil during ultrasonic welding [65,66]. Additionally, process optimization that seeks to improve weld quality has been shown to coincide with minimal losses of energy through vibration [67]. These findings of greater vibrational damping in poorly welded tabs and the previously discussed methods for the inference of weld quality described by Balz and Lu suggest the applicability of LDV as a technique for the post-weld assessment of tabs in batteries.

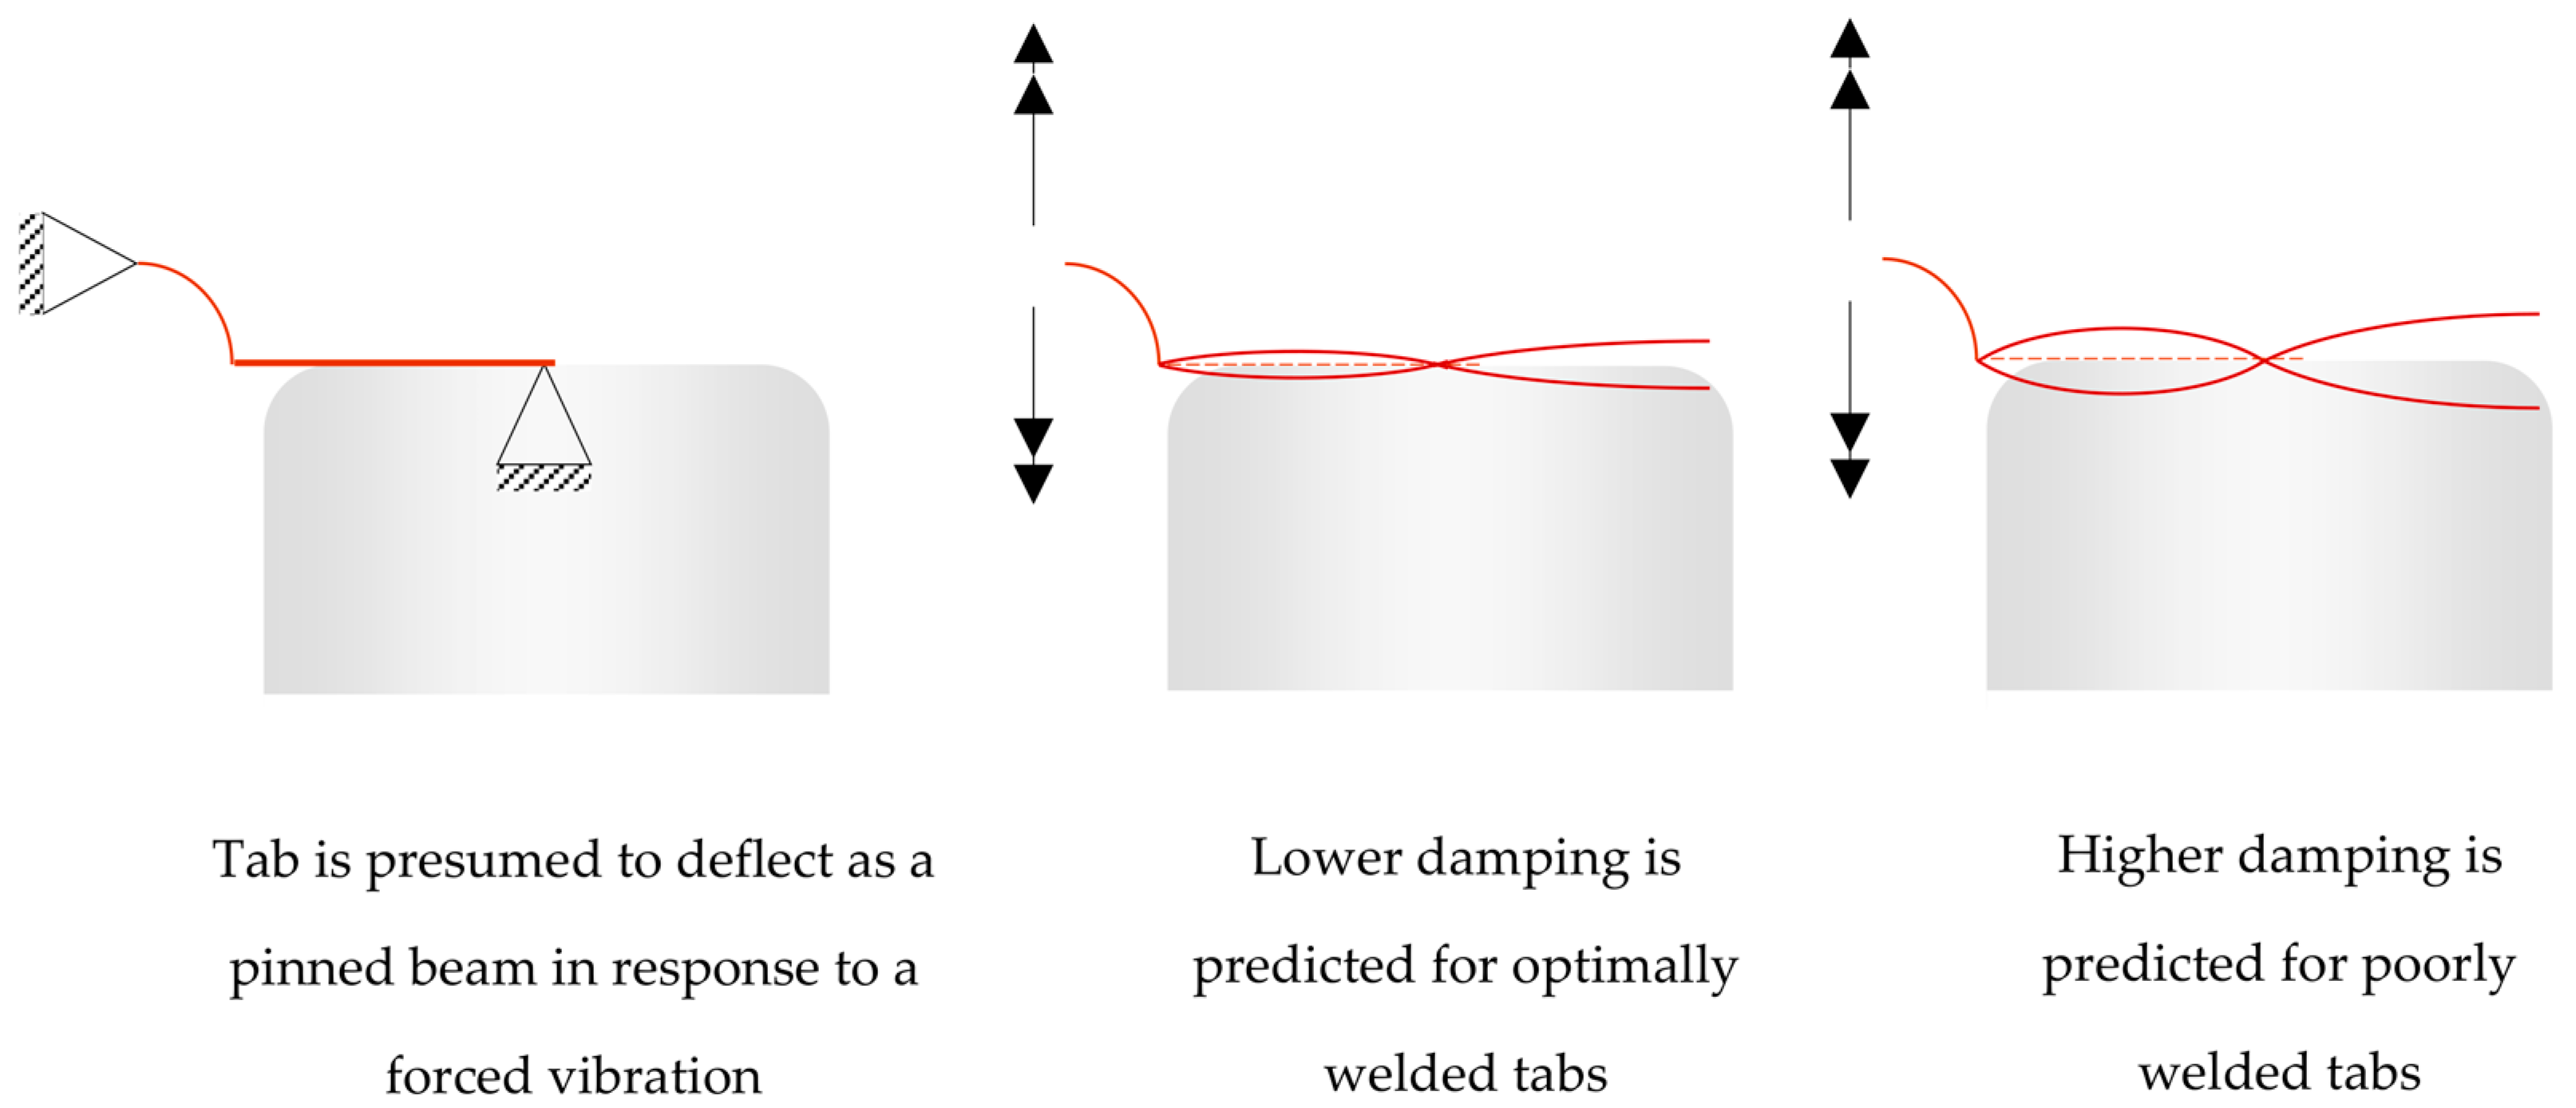
2.2. Hypothesized Vibration in Battery Tabs and Coupons

Following the aforementioned work of Kang and Cai [65,66,67], it is assumed that the interconnections in batteries, such as that shown in Figure 1, deform by flexion in response to forced vibration. The tabs are presumed to vibrate in the manner of beams that are pinned to the busbar lattice of the battery module and to the weld at the center of the terminal of the cell, as shown in Figure 2. Furthermore, it is assumed that the dynamic response of the interconnection is dependent on the stiffness and vibration-damping properties of its welded connection to the lithium-ion cell. Consequently, it is predicted that the forced vibration of tabs will be associated with a larger displacement in poorly welded tabs that are less rigidly bonded to the substrates of the terminals of cells. Therefore, this greater displacement is predicted to coincide with lower resonance frequencies and higher damping ratios. This is presumed to be observable from the shape of peaks in the vibration spectra obtained from poorly welded tabs.

3. Methods

As it is presumed that weaker welds are characterized by greater compliance, the central hypothesis for this investigation is that there should be an observable correlation between welding quality and the resonance or damping properties of bonded substrates. Therefore, the primary aims of this investigation were to test this hypothesis and to evaluate vibrometry as a means of detecting differences in welding quality.

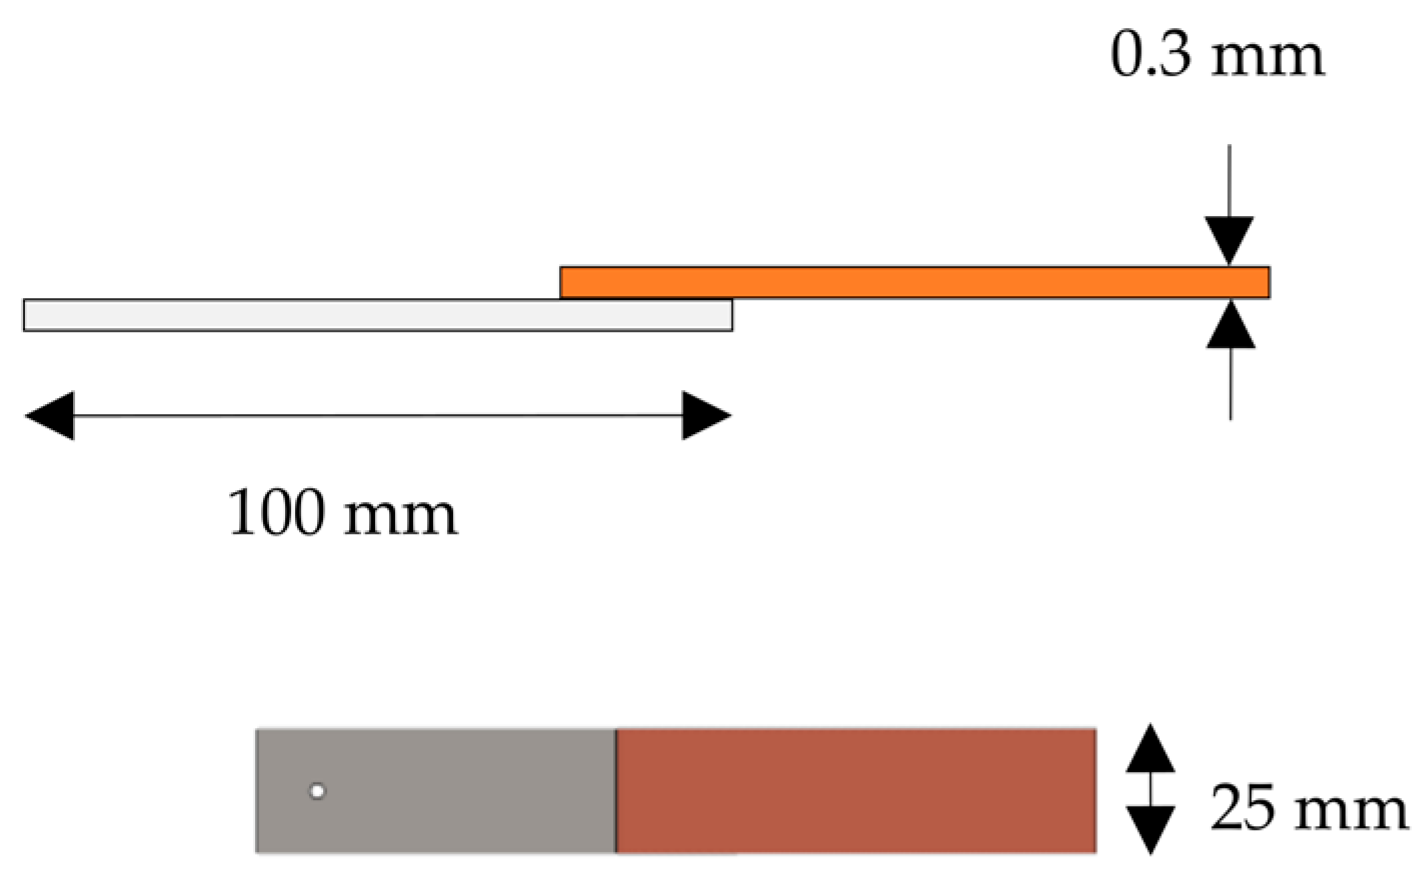
3.1. Lap-Shear Coupons

Experimental design followed the approaches reported by Lu et al. and Das et al. [36,54], in which welding parameters were correlated with metrics for weld quality. The testing method for single lap shear, materials of the coupons, and welding processes were thus chosen to be representative of conditions typical for welds in lithium-ion cells.

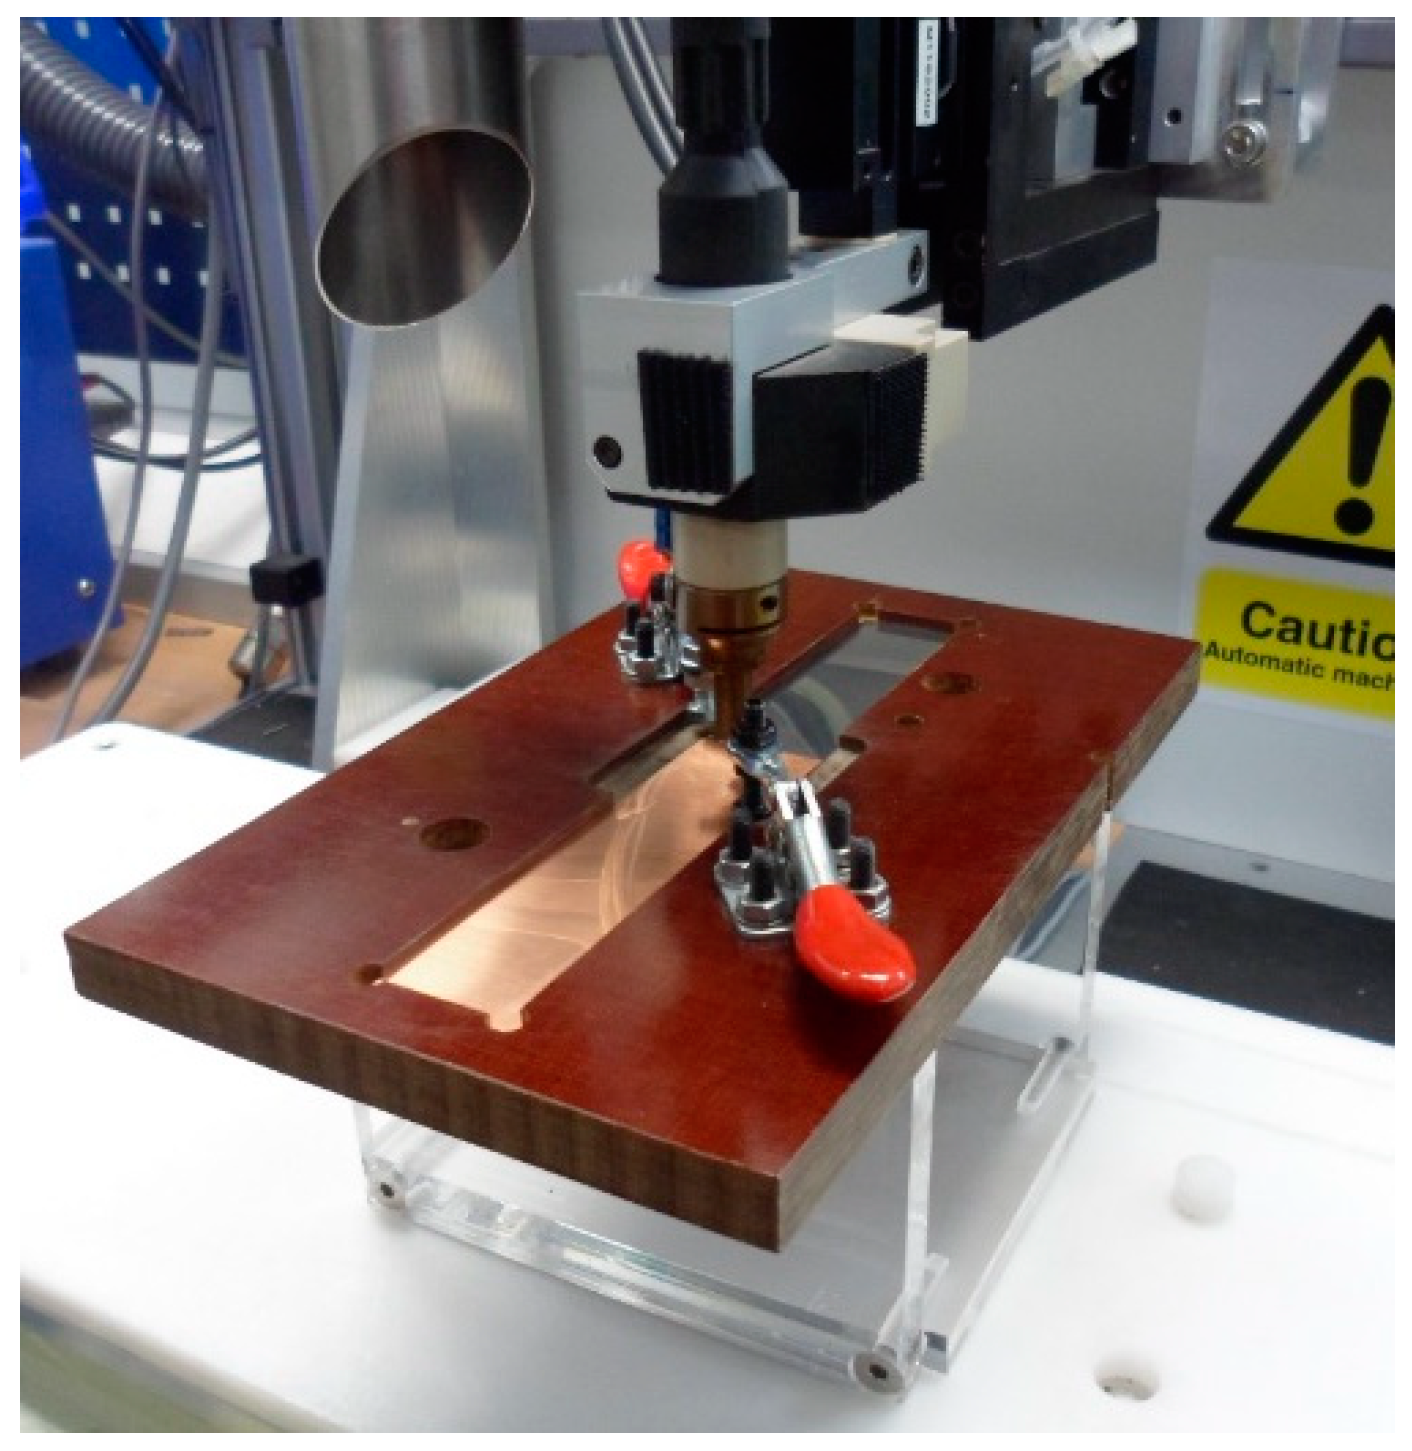
3.1.1. Manufacturing and Joining of the Lap-Shear Coupons

Copper–steel laps were made from C101 copper sheet and Hilum nickel-coated steel sheets, both with a thickness of 0.3 mm, which were cut to lengths and widths of 100 mm and 25 mm, respectively, as shown in Figure 3. Each pair of copper and steel laps was joined with a single-spot weld at the center of an overlapped length of 12.5 mm.
Sets of coupons were joined at three different conditions of weld quality, ranging from well optimized welding parameters to poorly adhered welds. All welds were made using a bespoke micro-TIG welding station at the Energy Innovation Centre (EIC) at Warwick Manufacturing Group (WMG), University of Warwick. Differences in weld quality were achieved by varying the current while keeping other welding parameters constant. Current was chosen as a variable because it could be controlled most reliably to give a predictable difference in weld quality. Constant variables included a flow rate of argon of 3 L/min and rising, peak, and falling durations of welding of 1 ms, 40 ms, and 30 ms, respectively. The amplitude of voltage applied by the electrode was limited to a minimum of 16 V and a maximum 31 V during each welding operation. A fixture held the laps in place during welding, so that each coupon would be joined repeatably in the same position, as shown in Figure 4. Four sets of ten coupons were joined, with variable parameters shown in Table 1. Plansee WL20 16-mm-diameter TIG electrodes (Plansee, Slough, UK) were used in all operations and a new electrode was used for each set of coupons.

3.1.2. Single-Lap-Shear Strength
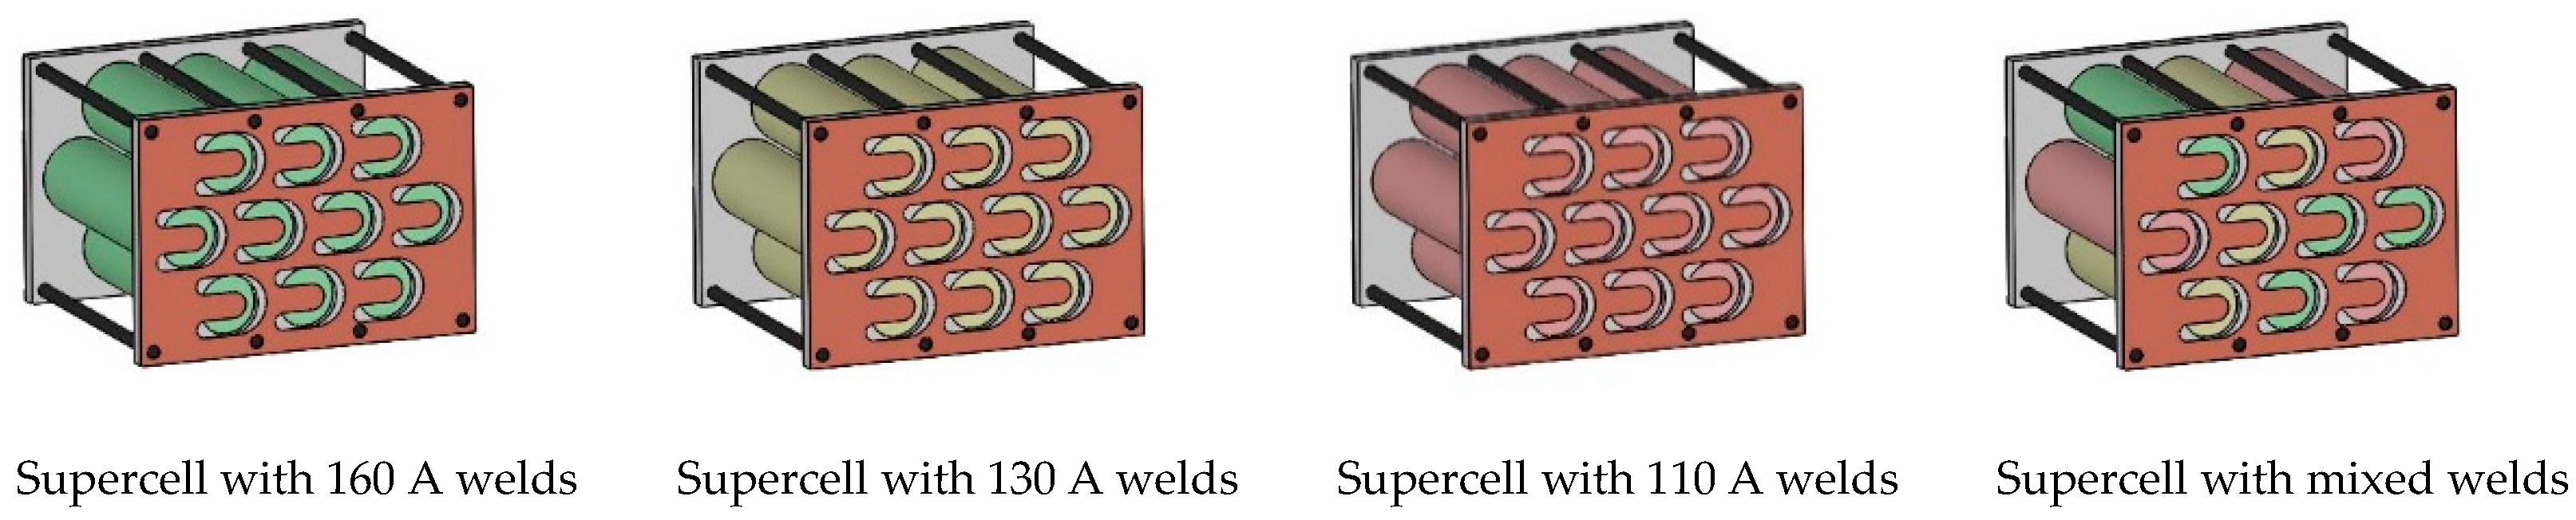
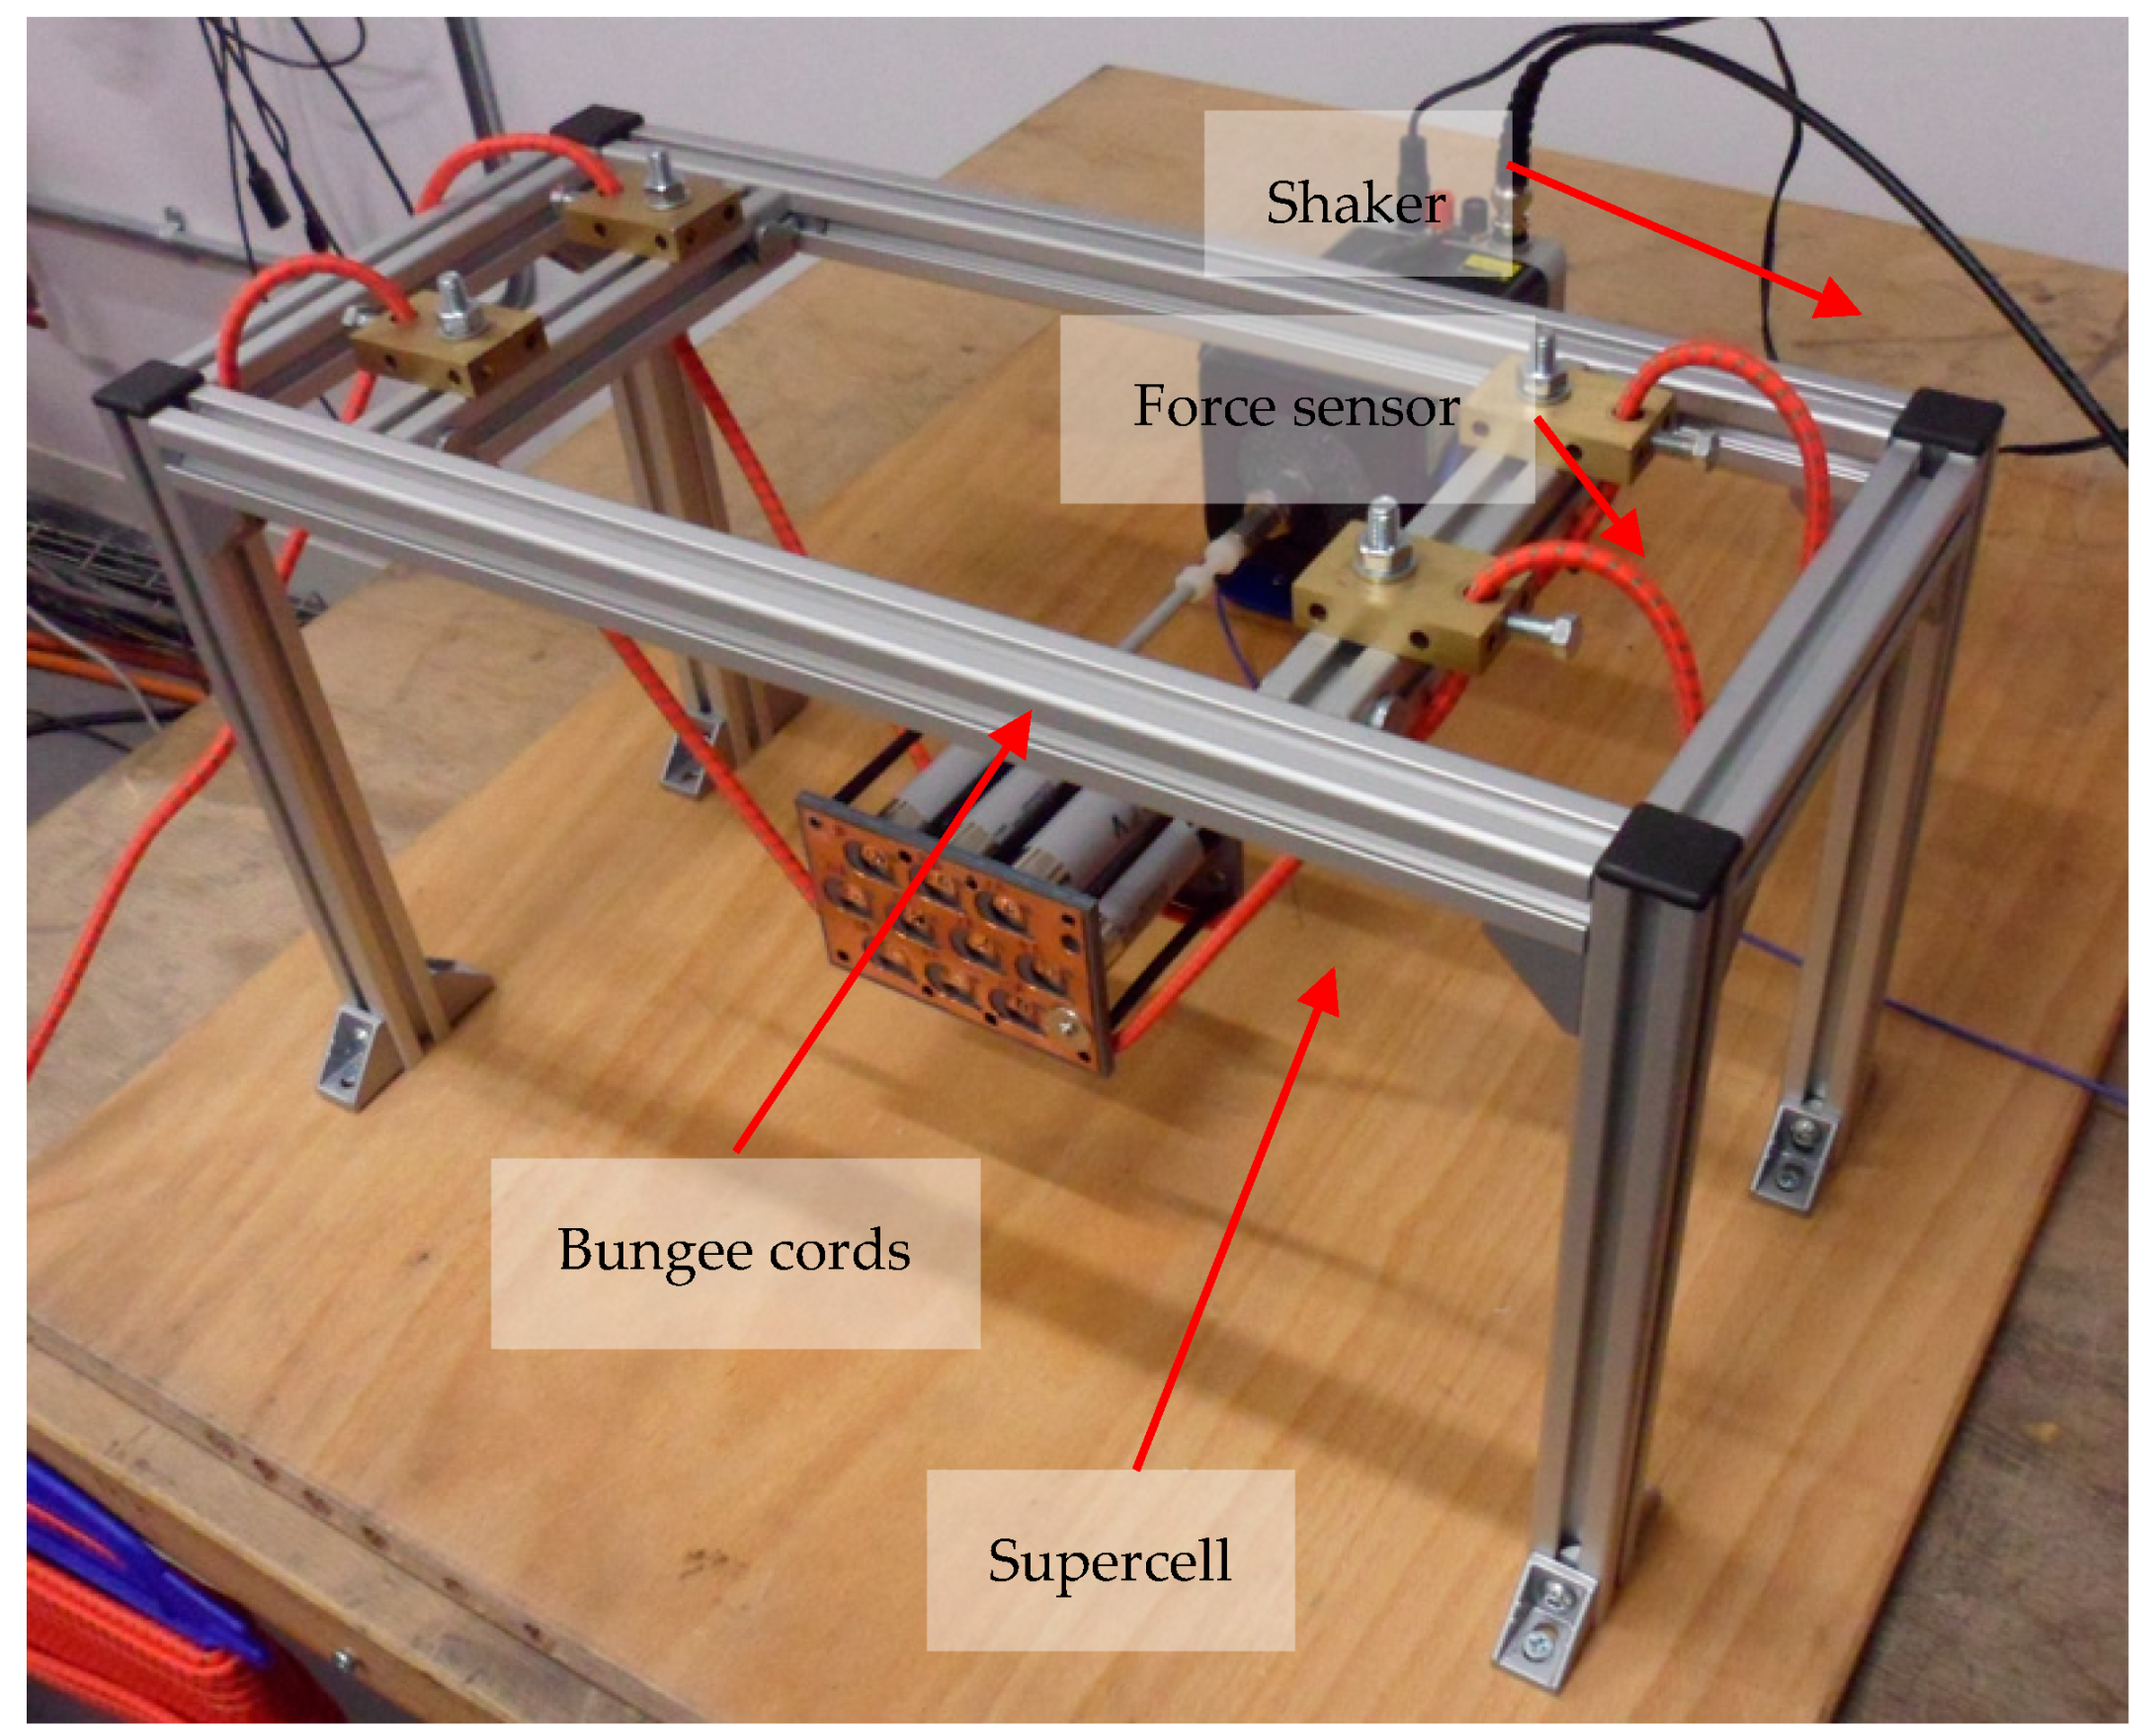
Coupons were destructively tested to determine single-lap-shear strength. This was undertaken on the coupons by tensile testing on an Instron 30 kN universal test frame (Instron, High Wycombe, UK), with guidance from testing standard ISO 4587:2003 [68]. These tests yielded a dataset on the peak force of the coupons, which was taken as a metric of shear strength.

3.2. Supercells

Supercells intended to represent the collective behavior of cells in a demonstration application were designed to be lightweight and simple, without features, such as unsupported surfaces or unnecessarily large masses of highly damping materials, that might be expected to bias modal properties. Supercells were manufactured in-house at Warwick Manufacturing Group, University of Warwick, and each contained 10 Panasonic NCR18650BD 3000 mAh cylindrical lithium-ion cells (Panasonic Industry Europe GmbH, Bracknell, UK), as shown in Figure 5. The cells were cycled with a Maccor Model 4300 Desktop Automated Test System battery cycler (Maccor, Tulsa, OK, USA) in order to condition the cells with a voltage of approximately 3.0 V prior to assembly. They were packaged using 4-mm-thick PVC plastic face sheets and held together with thin polyethylene tubes. Opposing sides of the supercells featured busbar lattices that were machined from 0.25-mm-thick copper sheets. These busbar lattices featured flat tabs that were welded to the terminals of the cylindrical cells. Surfaces were bonded together using a cyanoacrylate adhesive, which is favored as a relatively low-damping adhesive in vibration testing [69,70].
A total of four supercells were manufactured and joined with a different configuration of weld quality, with the intention of observing the relationship between welding current and modal properties. The same welding process was used for joining the supercells as was used for the lap-shear coupons, as described in Section 3.1.1. A new electrode was used for welding the tabs onto each busbar. The first supercell was joined with a current of 160 A, the second with a current of 130 A, and a third with a current of 110 A. The fourth ‘mixed’ supercell was joined with a mixture of 160 A, 130 A, and 110 A welds, as shown in Figure 6.

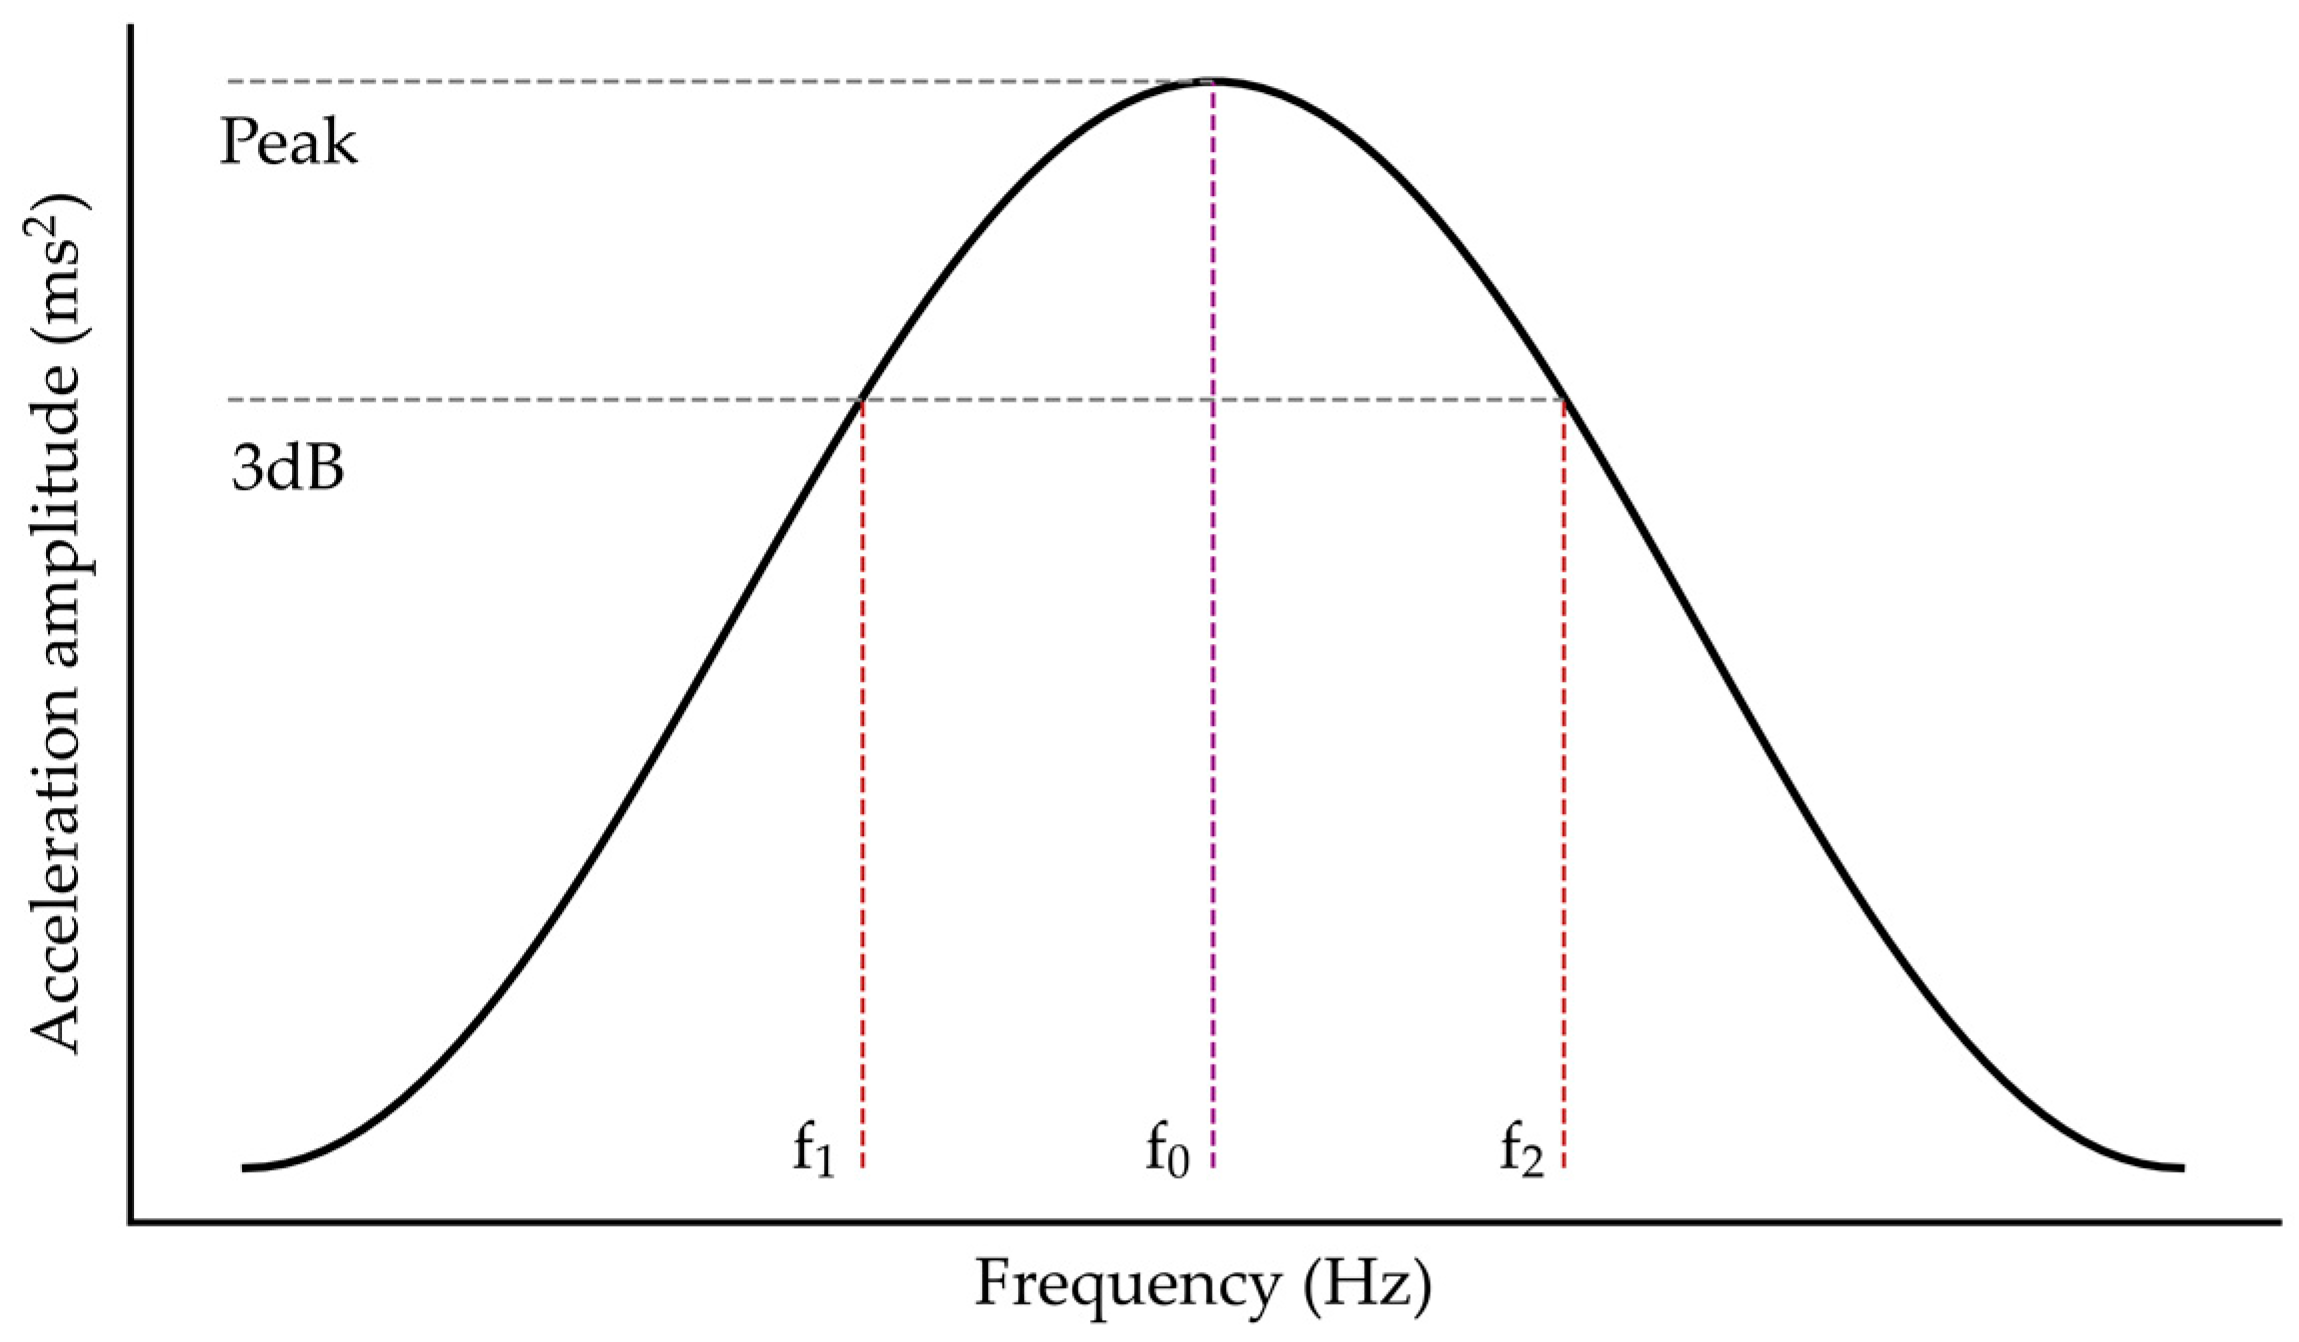
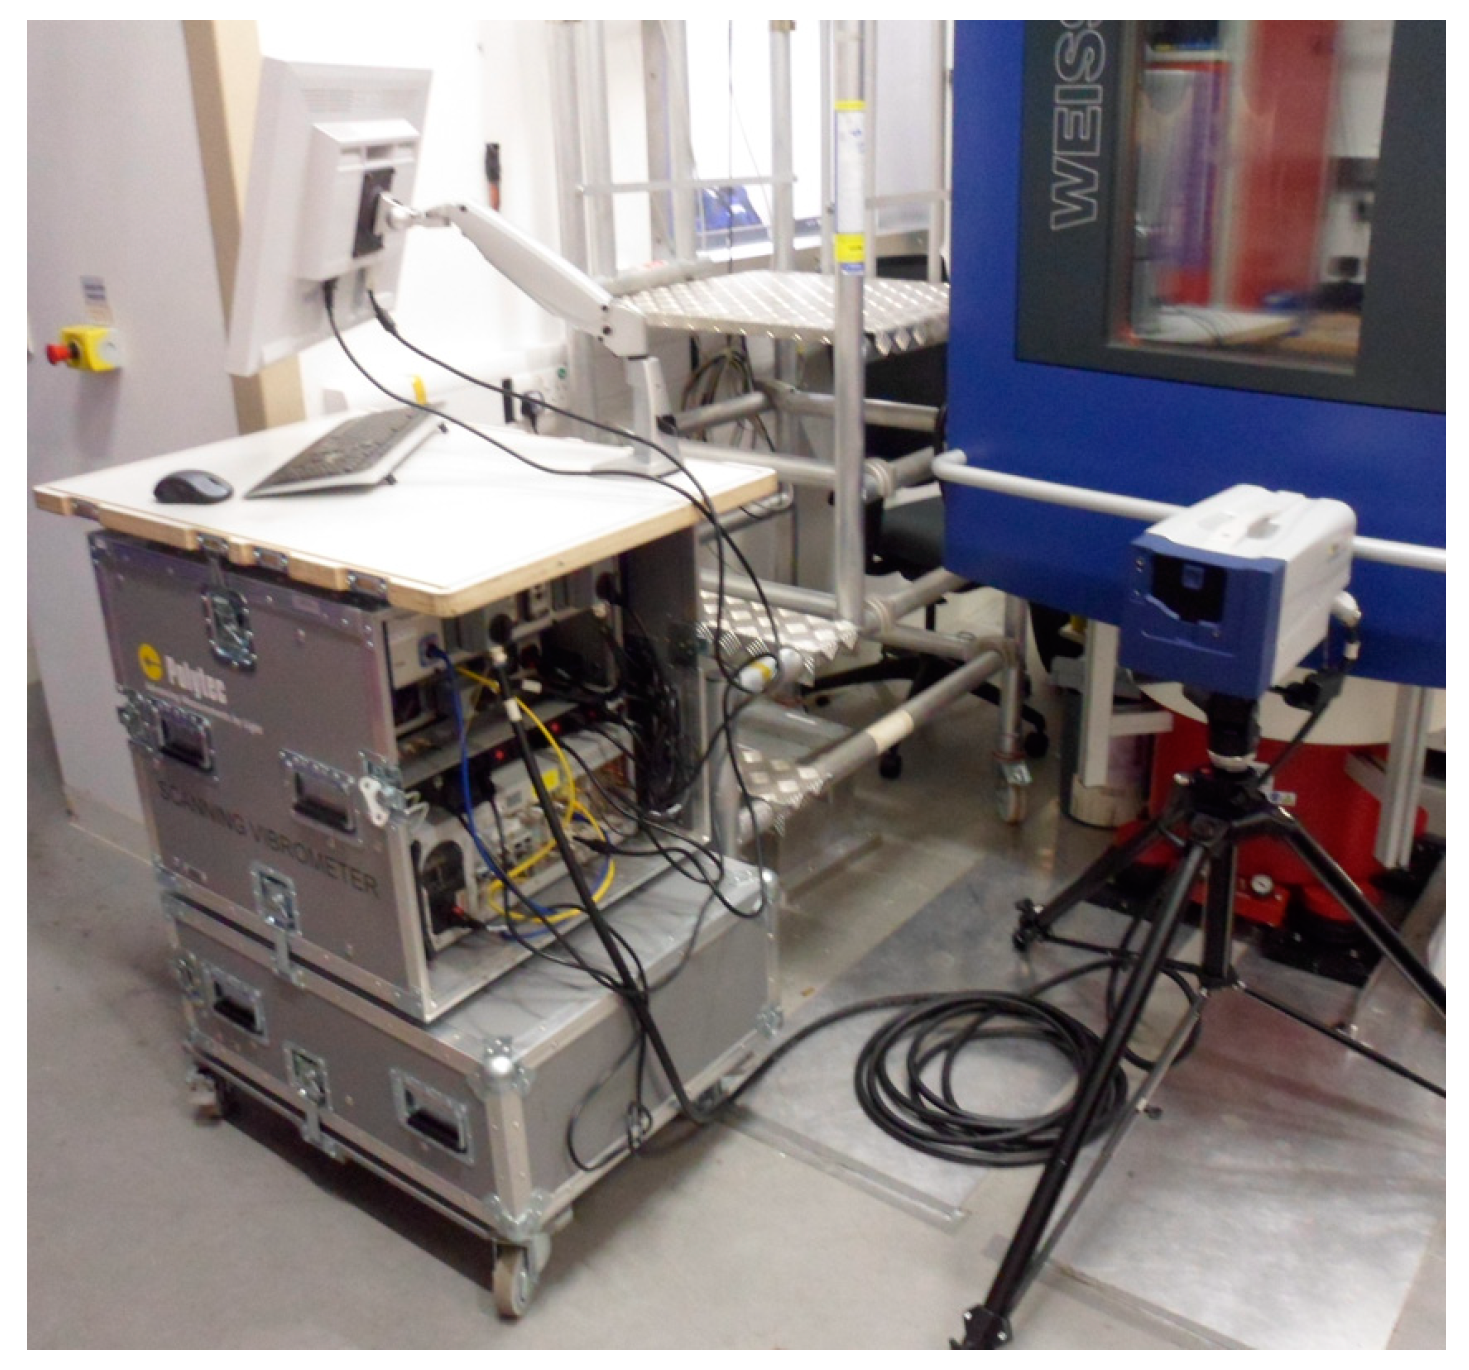
3.3. Experimental Modal Analysis

Modal analysis is the characterization of a system with respect to its dynamic mechanical properties. Modal analysis seeks to accurately specify the modal model of a system, which includes its natural frequencies, damping ratios of resonance, and the mode shapes associated with its resonance. Experimental modal analysis (EMA) can be used to determine characteristics of a modal model by comparing the measured response of a system to an inputted vibration or impact [71]. This is expressed by a frequency response function (FRF), which is the quotient of the response and excitation signals for the whole bandwidth of examined frequencies. FRFs are usually obtained as the spectra of measured acceleration or velocity signals in response to an excitation acceleration or force that have been collected in the time domain and converted by fast Fourier transform to the frequency domain. Mode shapes can be accurately determined if FRFs are obtained at a sufficient number of locations on the structure in order to adequately represent geometric patterns of resonance of the system. Once FRFs ae obtained, modal parameters can be estimated by curve-fitting techniques of the FRFs with multiple-degrees-of-freedom (MDOF) or single-degree-of-freedom (SDOF) models, the latter being more relevant when modes are well separated and lightly damped [72].
For this investigation, EMA was carried out using a single-point Polytec PSV-500 XTRA scanning vibrometer, shown in Figure 7. The laser-scanning head of the PSV-500 contains mirrors that permit the laser beam to be directed in different locations across a surface without the need to manually adjust the position of the tripod between individual measurements. An infrared laser was used for its suitability for use on reflective metallic surfaces, such as the copper battery tabs observed in this investigation. EMA was undertaken on the data collected from LDV using the complex mode indicator function AI (CMIF-AI) algorithm in PolyWave 21.1 software (Polytec Ltd., Coventry, UK). CMIF-AI finds peaks in the magnitude and phase components of multiple FRFs using a singular value decomposition method that computes CMIF functions for each FRF and plots them as a function of frequency. Peaks and mode shapes are identified in the plots of these functions, after which the algorithm estimates damping values from its computed eigenvalues.
The algorithm also applies an additional SDOF peak picking code to improve its estimation of natural frequencies and damping ratios for each mode shape. The code utilizes the ‘half-power bandwidth’ method for estimating damping ratios [73]. The damping ratio for a given SDOF peak is equal to the inverse of twice the quality factor, which is a measure of the ‘sharpness’ of a peak. This is calculated by dividing two times the frequency associated with the peak value of acceleration at its maximum by its bandwidth in units of the frequency domain. The bandwidth is measured at two points, respectively, on the rising and falling slopes of the peak corresponding in acceleration to a fraction of 3 dB lower than the peak maximum [74]. In this investigation, all values of damping ratios are presented as a percentage.
The damping ratio (ζ) and quality factor (Q) for a given peak with resonance frequency (f0) and the rising (f2) and falling (f1) frequencies associated with the bandwidth of the peak are given by the following [74], as illustrated in Figure 8:
ζ = 1 2 · Q = f 2 f 1 2 · f 0

Experimental Modal Analysis of Supercells

LDV was undertaken on supercells that were suspended on bungee cords in a free–free condition, with forced vibration applied by a miniature shaker, as shown in Figure 9. Forced vibrations were applied to the busbars of the supercells through a polyamide stinger by a SmartShaker K2004E01 (The Modal Shop, Cincinnati, OH, USA) miniature electrodynamic shaker that was positioned in a horizontal orientation. The shaker and the aluminum frame from which supercells were suspended were fixed onto a base plate. The reaction force from the shaker onto the stinger arm was measured with a piezoelectric 208C02 force sensor (PCB Piezotronics, Depew, NY, USA). The magnitude of vibration observed by the vibrometer was thus quoted relative to the reaction force measured from this sensor, in units of force per velocity. Outputs from the vibrometer and the force sensor were acquired by the PSV-500 data acquisition system (Polytec Ltd., Coventry, UK) and interpreted by PSV 10.0.1 vibration analysis software (Polytec Ltd., Coventry, UK).
A low level of forced vibration was continuously applied by the shaker by generating a white-noise signal with an amplitude of 0.5 g over a range of frequencies from 5 Hz to 5000 Hz. For this range of frequencies, the noise-limited resolution of the PSV-500 scanning head is at least 0.3 µms−1 Hz−0.5 [75]. The vibrometer sequentially collected 20 individual spectra of magnitude and phase, with a sample time for each spectrum of 0.64 s. These were transformed to the frequency domain using a Hanning windowing algorithm and averaged to give a single FRF spectrum for each location of measurement. Spectra were discretized with 3200 lines within the measured bandwidth, giving a resolution of 1.5625 Hz for each increment in the frequency domain. The vibrometer range was set to 50 mms−1. As shown in Figure 10, FRFs were collected from 100 locations: 9 points in a rectangular grid on each tab and 10 points on the busbar. LDV was undertaken on either side of the supercell, so that FRFs were alternately collected from tabs connected with either the positive or negative terminals.

4. Results

4.1. Lap-Shear Strength

As shown in Figure 11, a strong linear correlation was found between the peak force and the welding current, with the highest strength being recorded for the coupons welded with a current of 160 A. All of the coupons were observed to fail due to the mechanical failure of the welds, rather than the yielding of the metallic laps.

4.2. Experimental Modal Analysis of Supercells

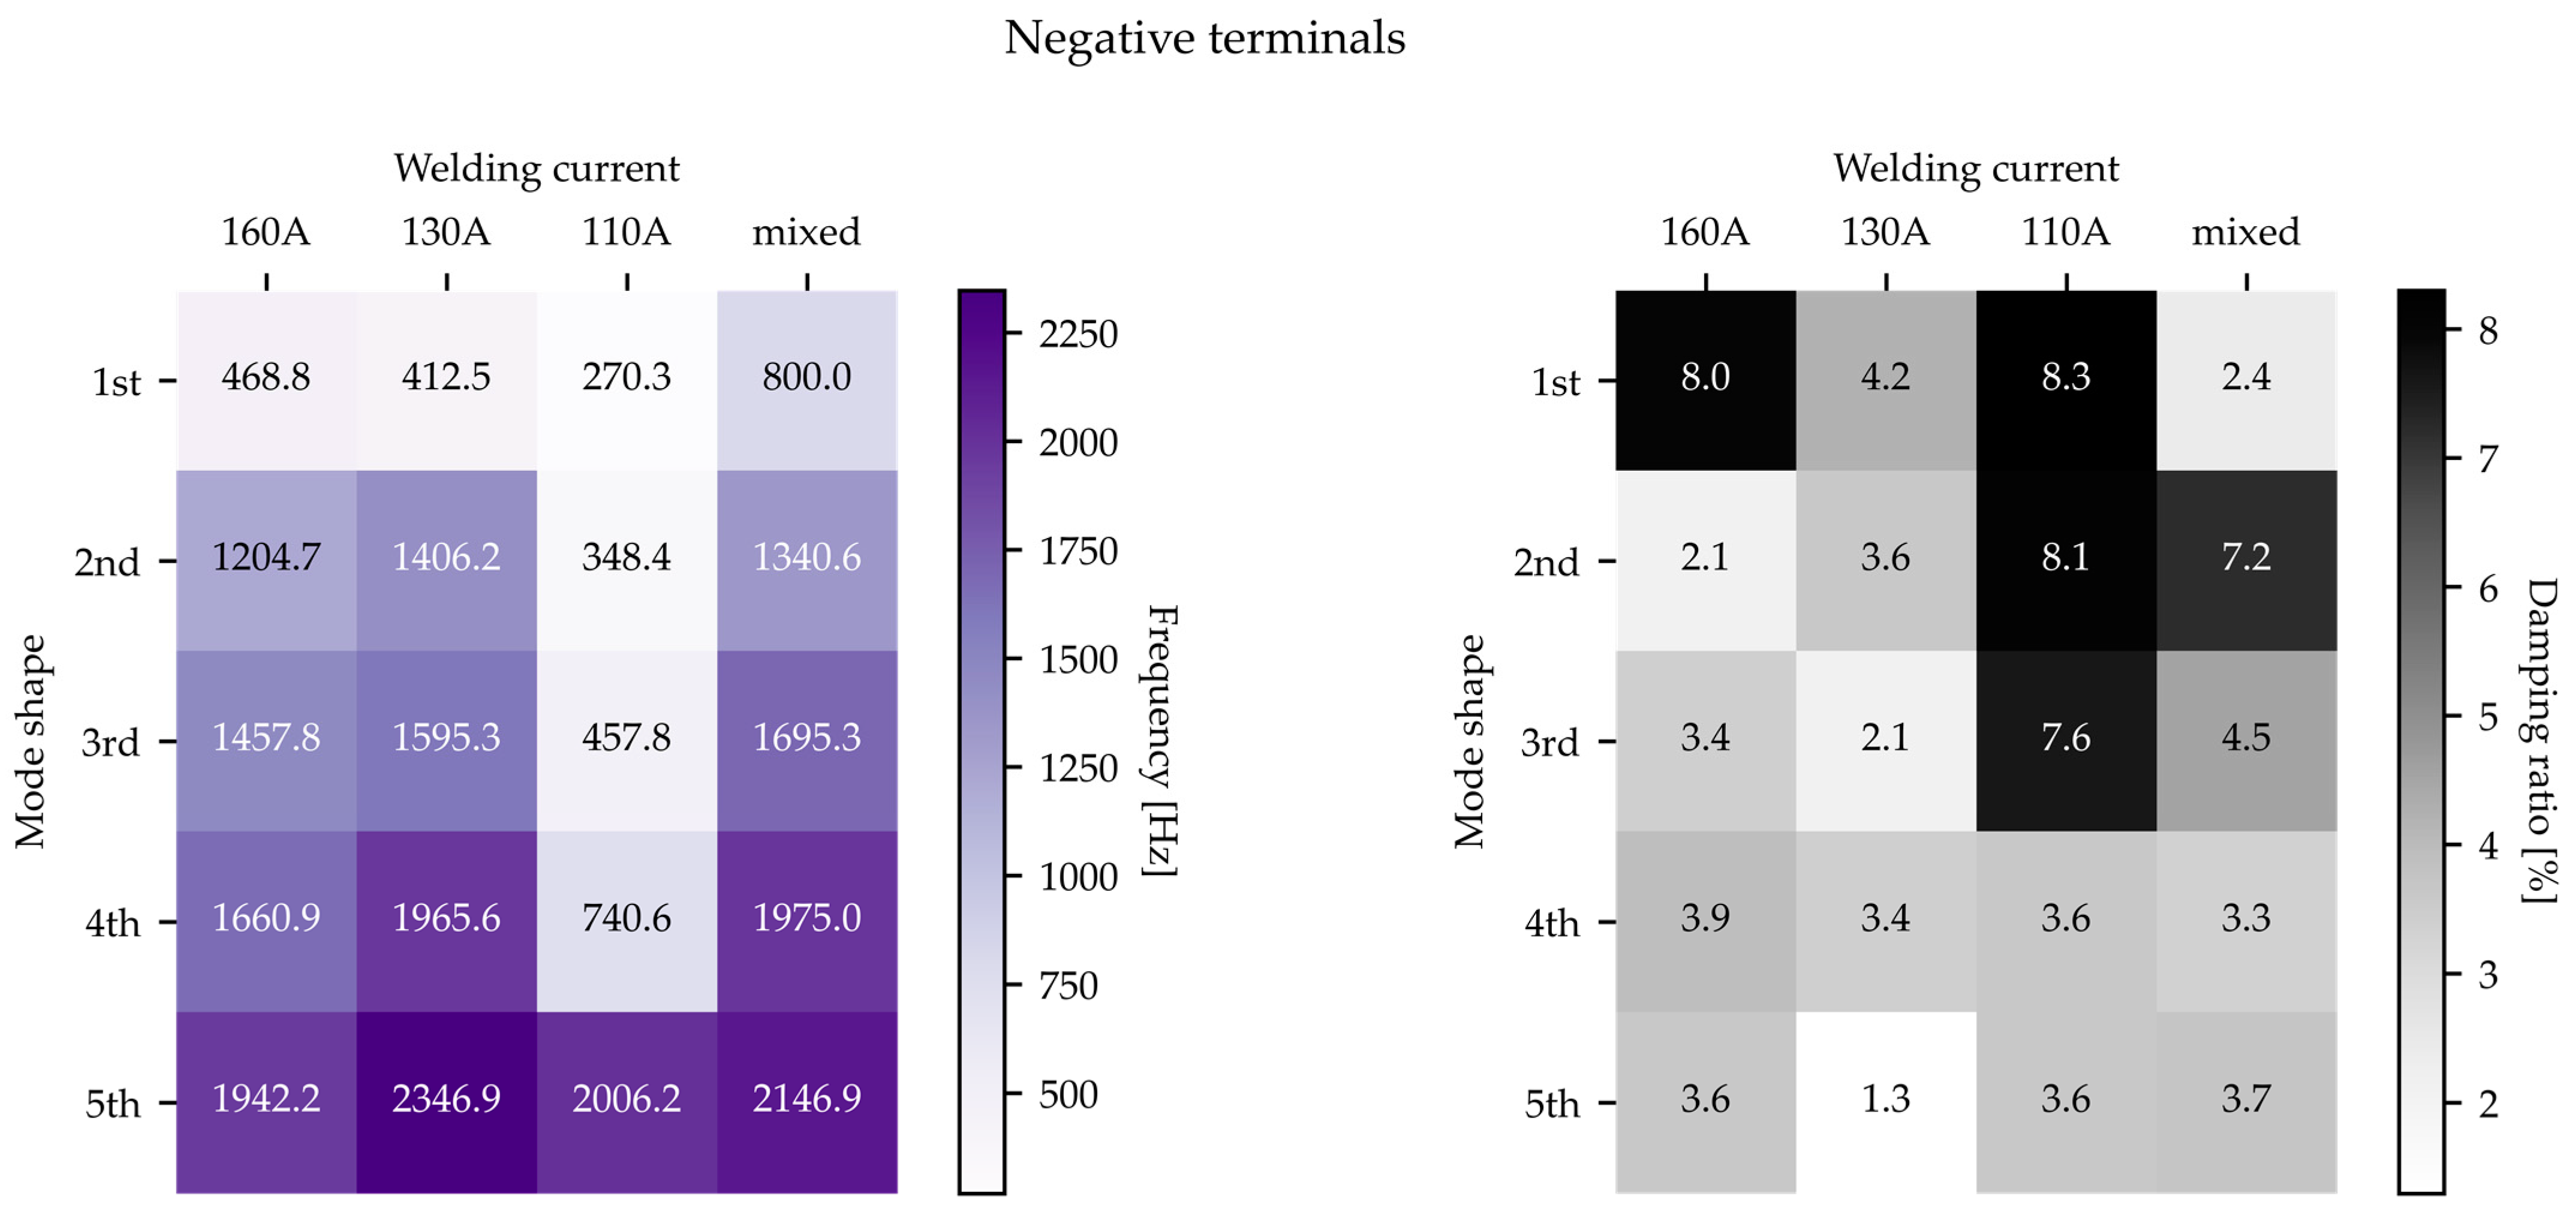
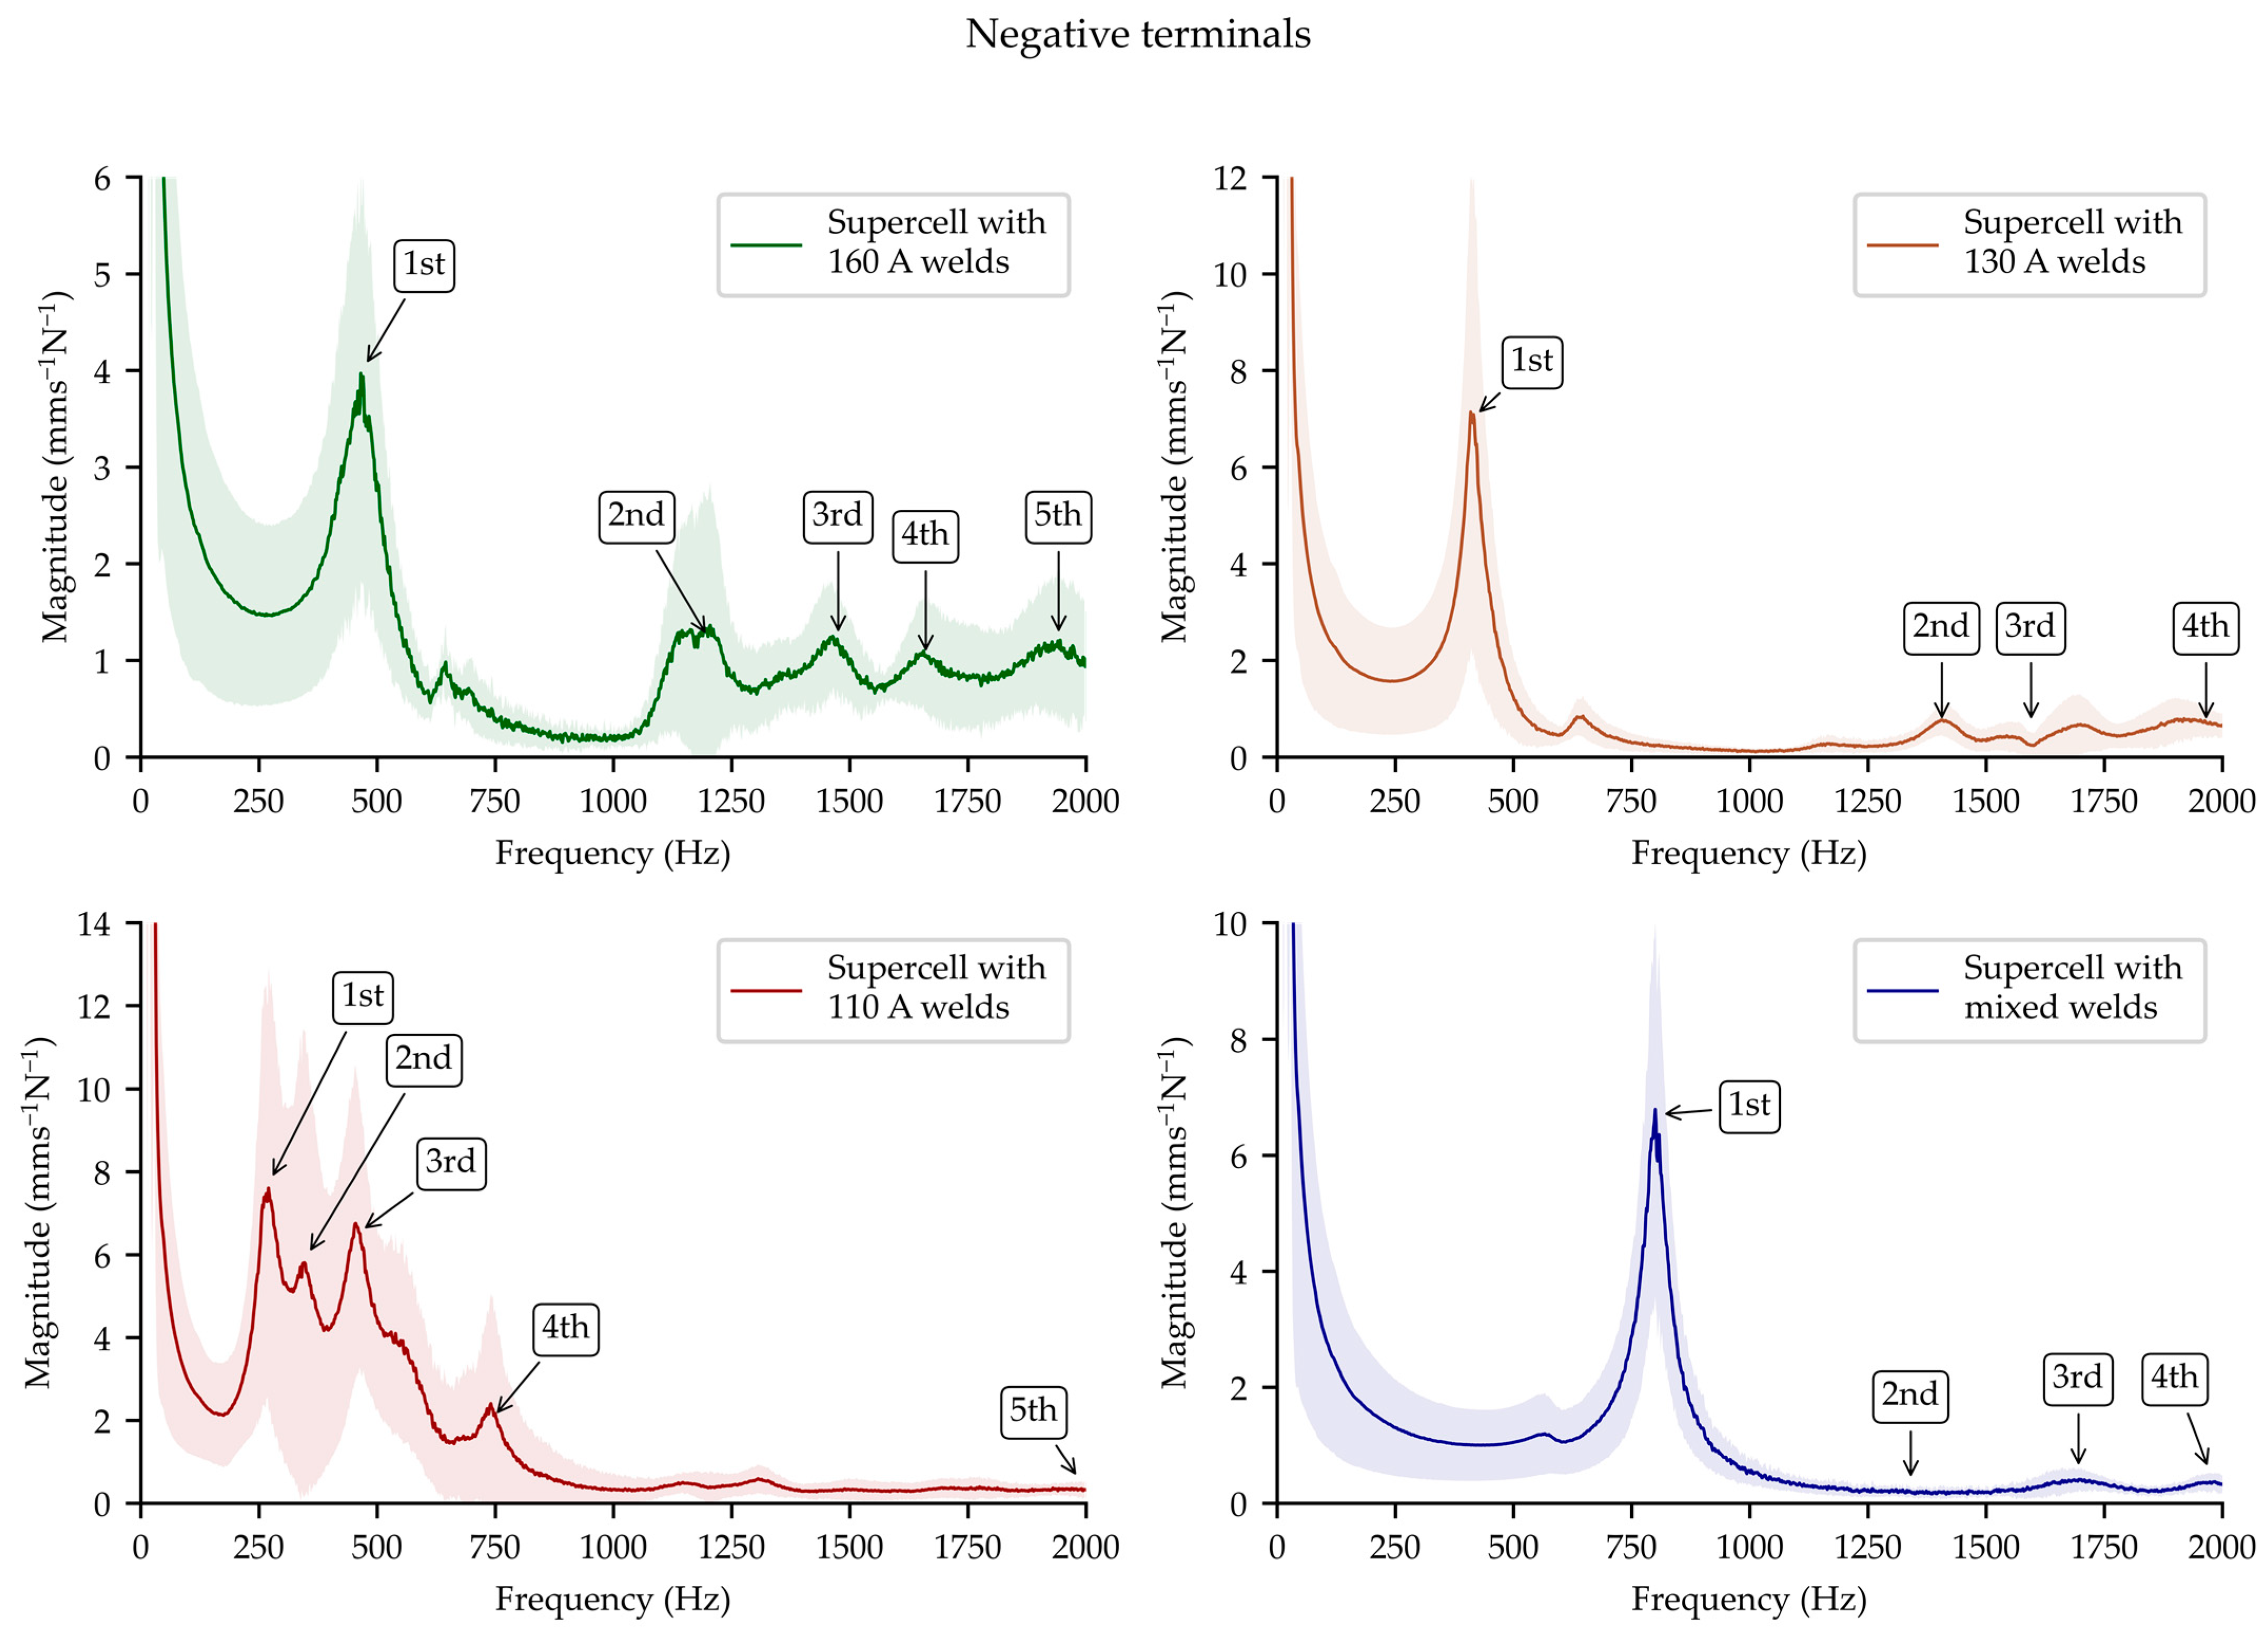
4.2.1. Negative Terminal

The heatmaps shown in Figure 12 show the frequency and damping ratios for the first five modes of resonance for each of the supercells, obtained from the results of the EMA undertaken on the negative terminals. It was hypothesized in Section 2.2 that the sub-optimal welds would be more mechanically compliant than the stronger welds and, therefore, would resonate at lower frequencies and with higher damping ratios. However, in contradiction of this hypothesis, the resonance frequencies of the first four modes were significantly lower, and the damping ratios were generally higher, for the 110 A supercell than those of the 160 A or 130 A supercells. In addition, the highest damping ratio, of 8.0%, for the first mode of resonance was measured for the 160 A supercell, while the lowest damping ratios were measured for the 130 A supercell.
The scatter plots in Figure 13 show the mean resonance frequency and the mean damping ratio of the first five modes for the supercells, as observed from the negative terminals. The weakness of the correlation between either the resonance frequency or the damping ratio and the welding current can be seen from the respective Pearson correlation coefficients of 0.34 and 0.27. This means that, unlike the strong and linear correlation between the force and the welding current observed for the lap-shear coupons in Figure 11, neither the resonance frequency nor the damping ratio were reliable predictors of the welding current.
Notably, the mixed supercell showed both similarities to and differences from the other supercells that appeared to be contradictory, since a mixture of weld currents was expected to give rise to modal parameters that were intermediate between those observed for the best and for the least optimized welds. For example, the last four modes for the mixed supercell were characterized by frequencies that were intermediate between the 160 A and 130 A supercells. By contrast, the damping ratios for the same modes most closely resembled the 110 A supercell. Furthermore, the first mode was characterized by a frequency of 800.0 Hz and a damping ratio of 2.4%, which were the highest and lowest, respectively, of all the supercells, and which were expected for the best-optimized welds. The modal model of the mixed supercell was therefore characterized by parameters that bore some similarity to the other supercells, while also possessing features that were not otherwise present in any of them. Taken as a whole, these differences show that each supercell was characterized by a unique modal model with parameters that were not directly governed by a linear relationship with the welding current.
The modal models were also unique at the level of the cell tabs. Figure 14 shows the analysis of the averaged spectra from the nodes at the centers of the tabs of the cylindrical cells on the negative terminals. The prominent resonance peaks in these spectra of the tabs coincided with the frequencies of the mode shapes obtained from the EMA of the supercells, with only moderate variance in their magnitudes. This suggests that the resonance of the tabs was more strongly influenced by the overall behavior of the supercell structures, that is, the dynamic contribution of the cylindrical cells and the structural materials, rather than by the local compliance and damping of the interconnections. Additionally, if the welding current were associated with a strong influence on the local resonance properties of the tabs, a high degree of variance would have been observed in the averaged spectrum for the supercell with mixed welds. Instead, the averaged spectrum was characterized by relatively low variance, as shown by the shaded region in Figure 14.

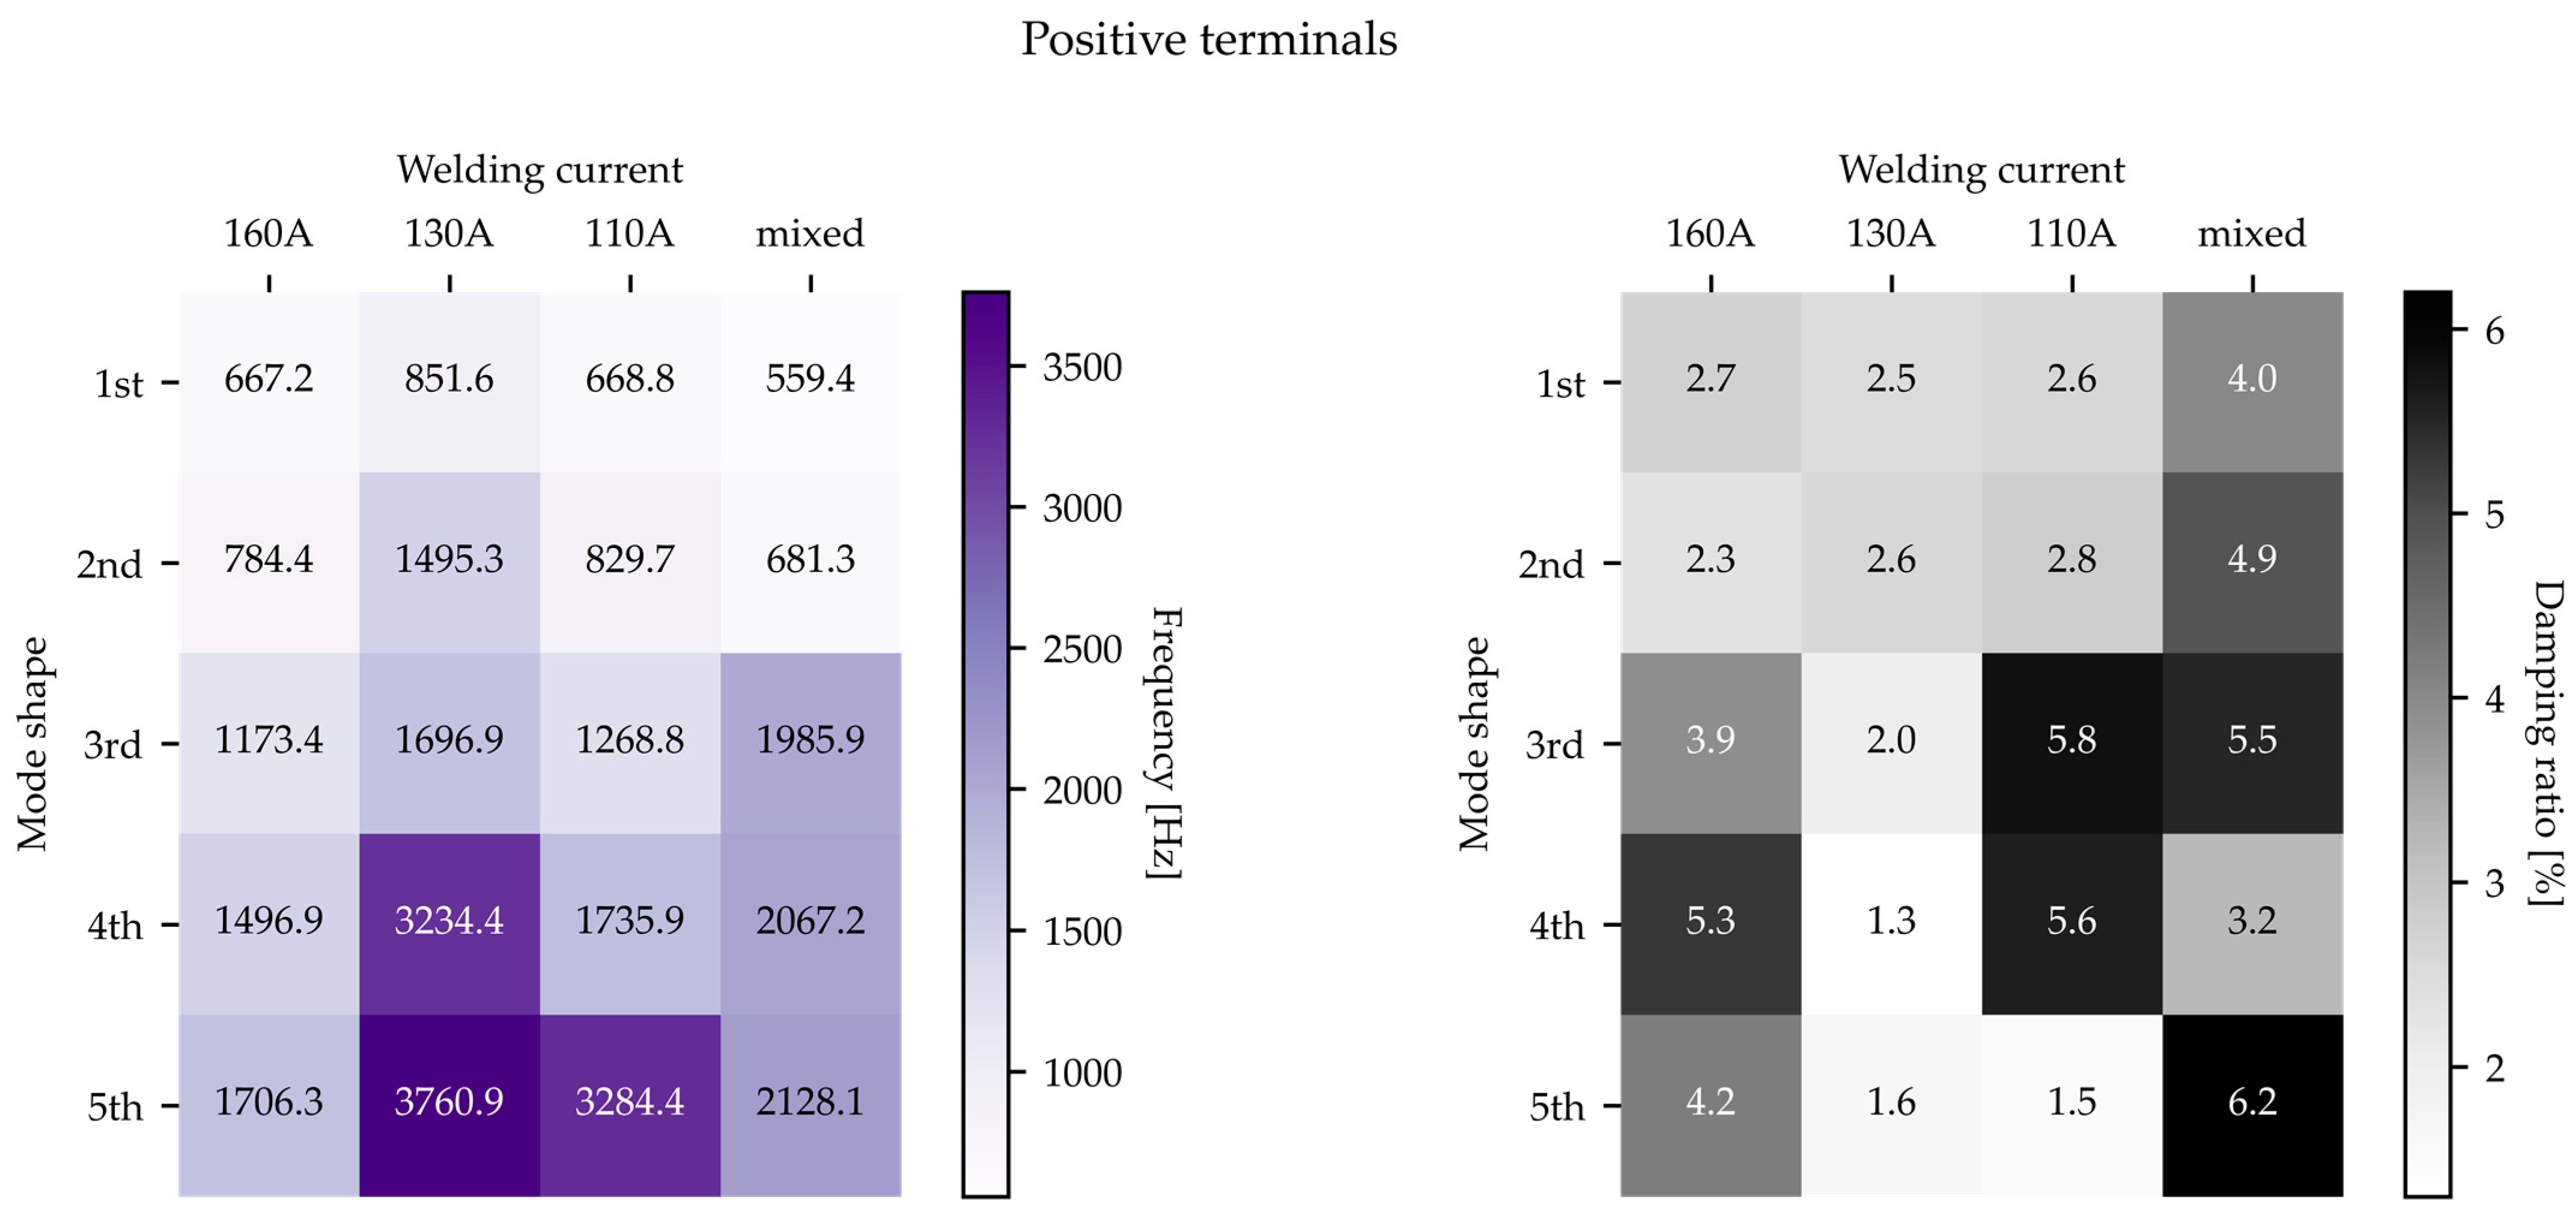
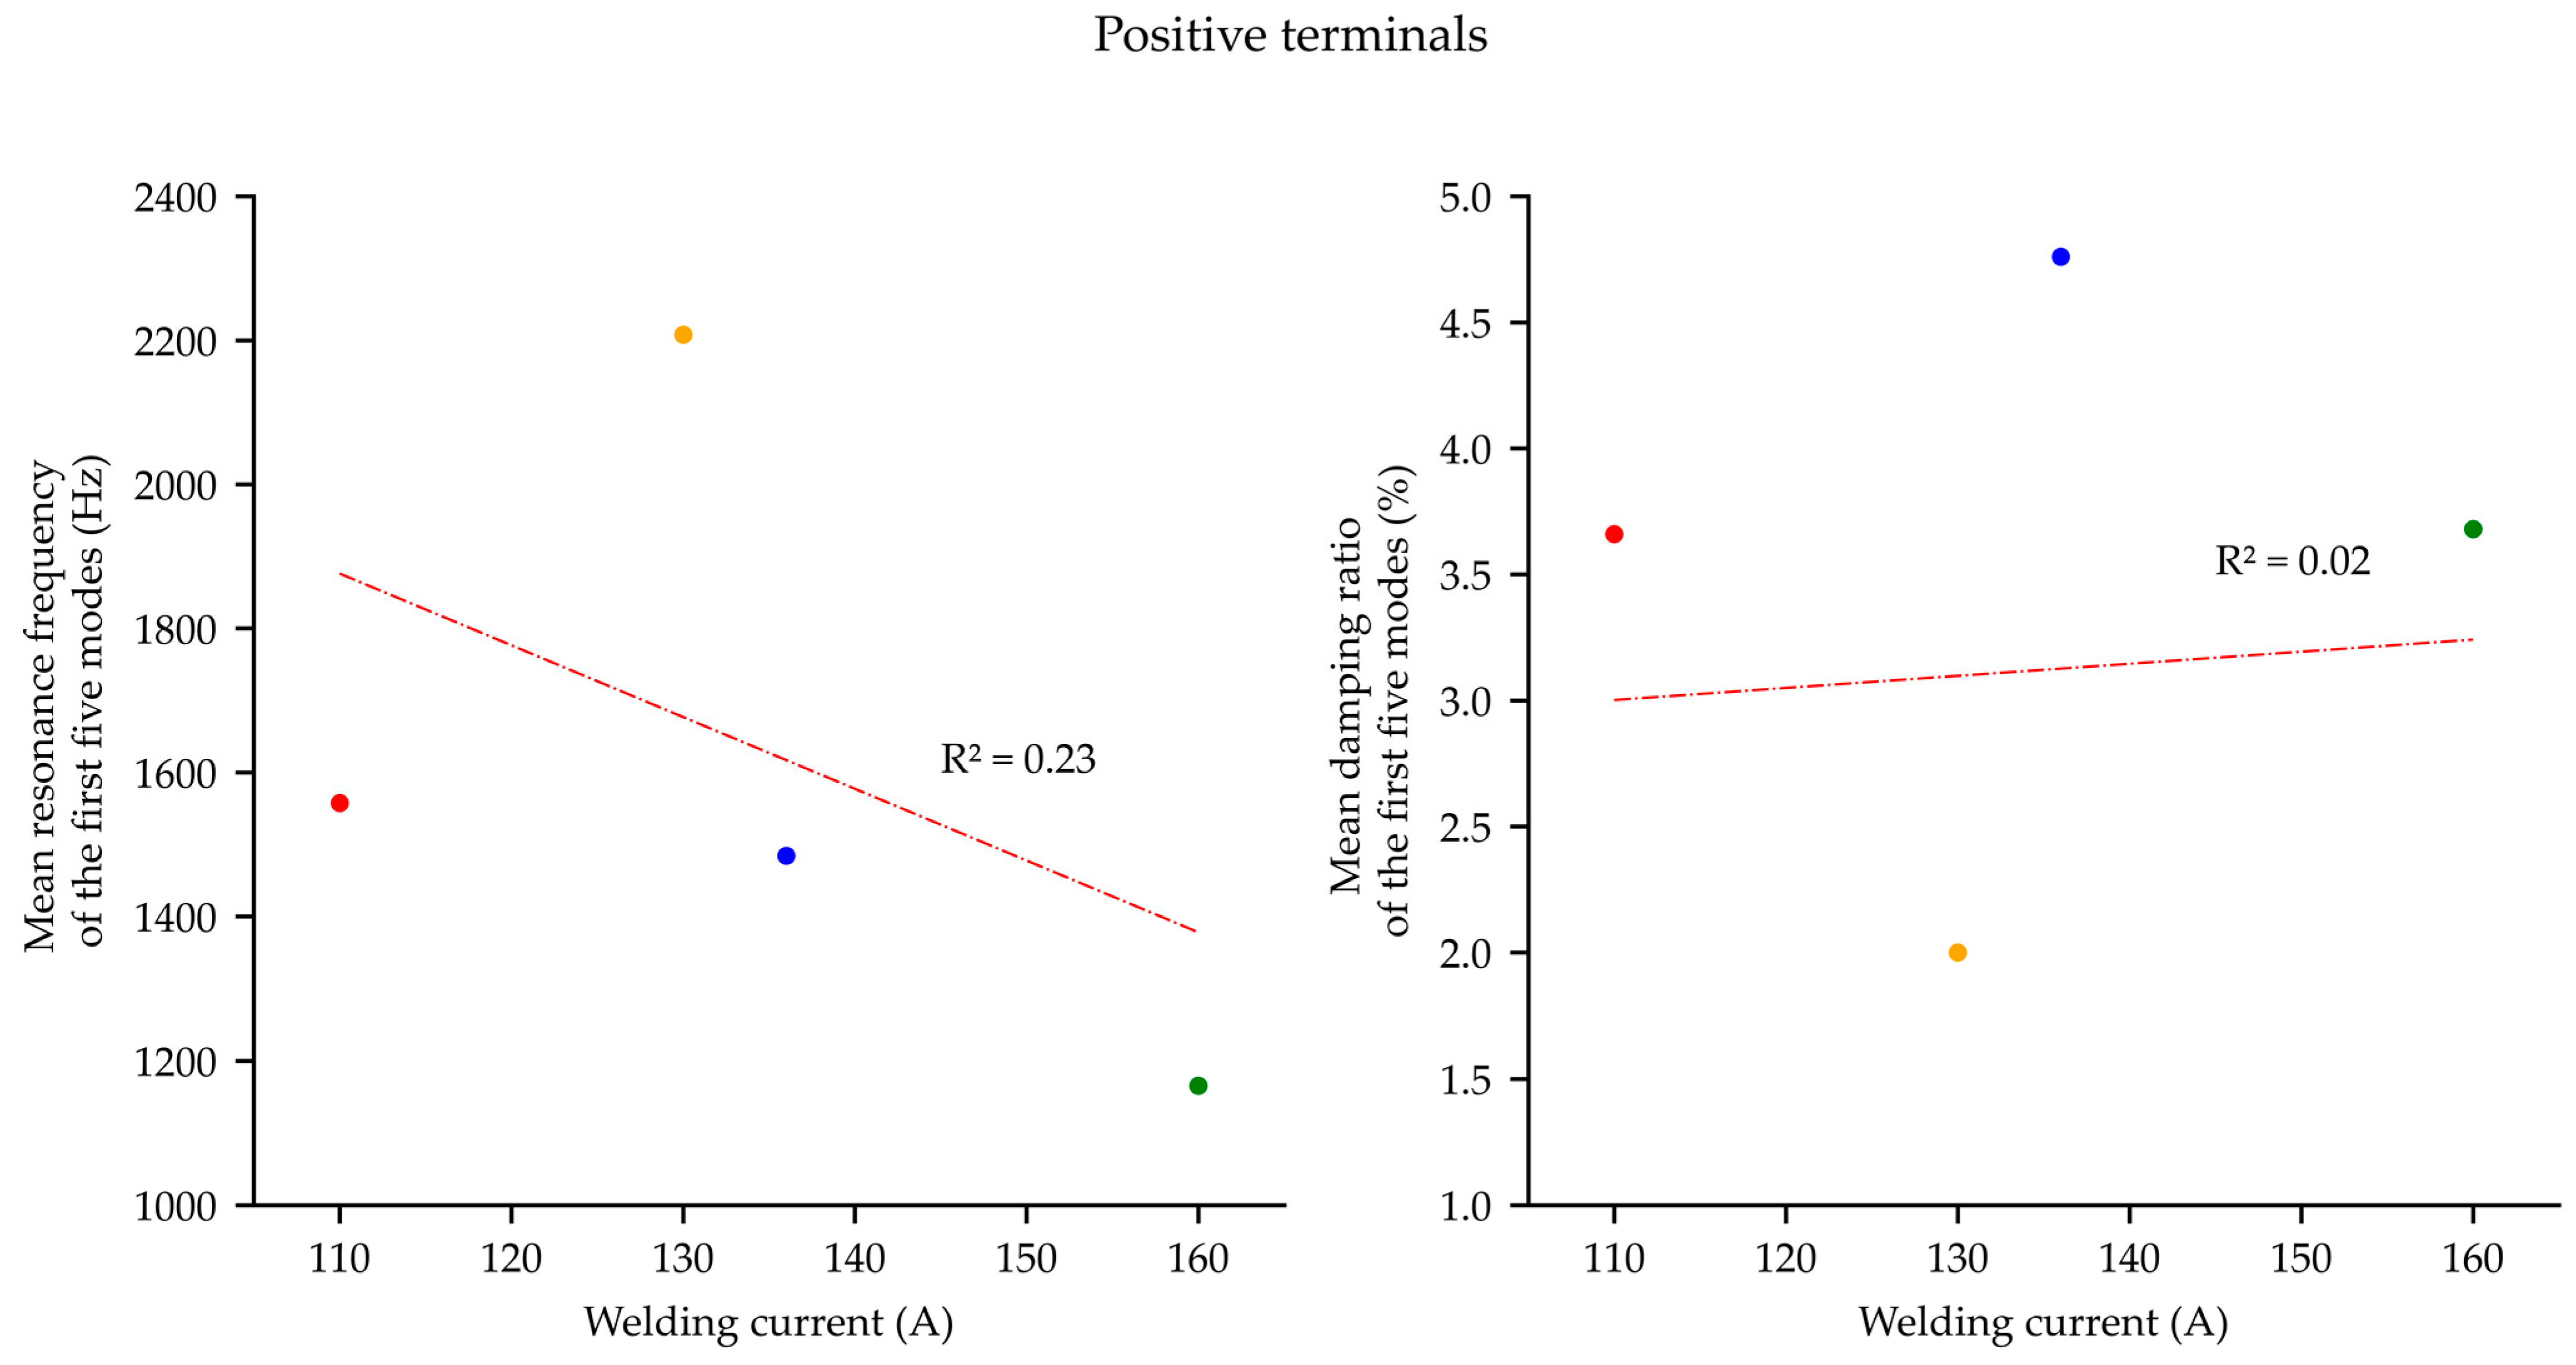
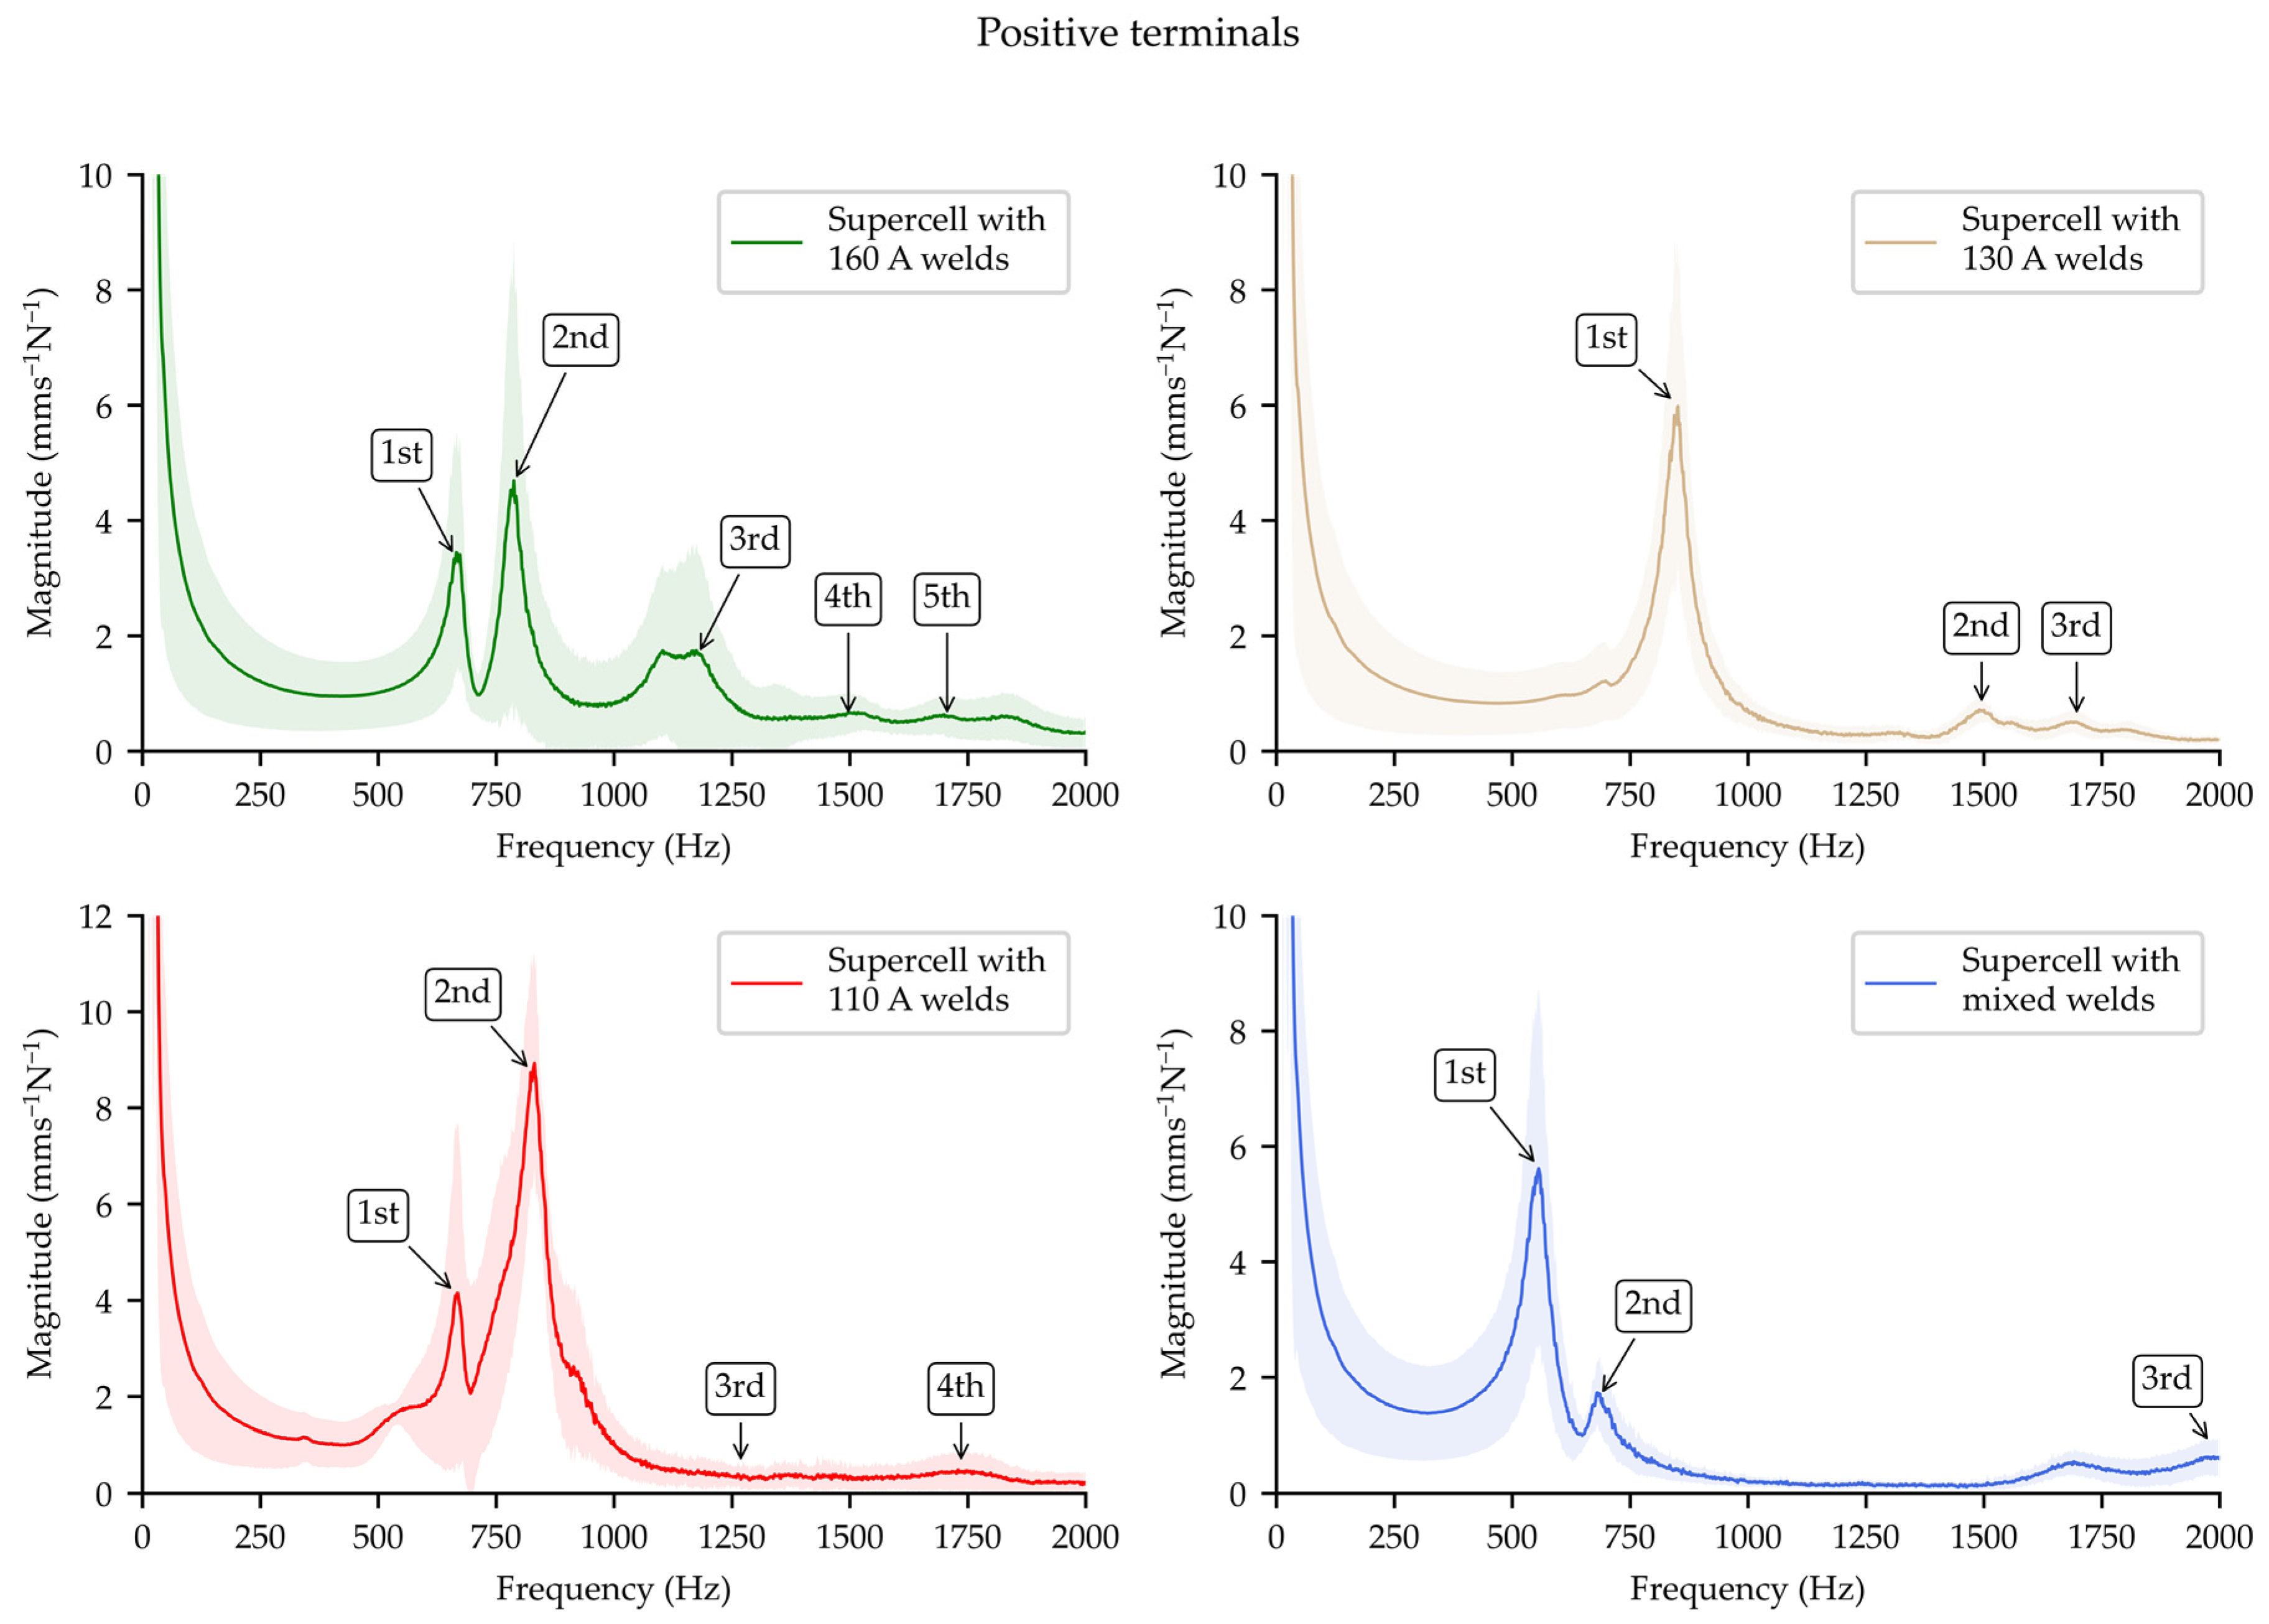
4.2.2. Positive Terminals

The heatmaps in Figure 15 show the frequency and damping ratios for the first five modes of resonance, as obtained from the EMA undertaken on the busbar with positive terminals. The heatmaps show that the modes of resonance for the 130 A supercell occurred at higher frequencies and with lower damping ratios than any other supercells. This is contrary to the prediction described in Section 2.2, from which the highest frequencies and lowest damping ratios were expected for the best-optimized welds, which should be associated with the 160 A supercell rather than the 130 A supercell. Furthermore, also contrary to this prediction, the resonance frequencies were consistently lower for the 160 A supercell than for the 110 A supercell. The scatter plots in Figure 16 show the mean resonance frequency and damping ratio for the first five modes for the supercells from the positive terminals. The respective Pearson correlation coefficients of 0.23 and 0.02 show a weak negative correlation for the mean resonance frequency and a negligible correlation for the mean damping ratio with the welding current. None of the above findings support a significant correlation between the modal parameters and the welding current for the positive terminals. This is the same conclusion as that formulated for the negative terminals in Section 4.2.1, although there were numerical differences in the resonance frequencies and damping ratios between the negative and positive terminals. For example, the frequency of the first mode of resonance was at least 200 Hz higher for the 110 A, 130 A, and 160 A supercells at the positive terminals. This suggests that the EMA was influenced by the internal structure of the cylindrical cells.
The modal model of the positive terminals of the supercell with mixed welds displayed similarities, differences, and unique properties compared with the other supercells, which was similar to the finding for the EMA of the negative terminals. For example, the frequencies of the third, fourth, and fifth modes and the damping ratios of the third and the fourth modes of resonance occurred intermediately between the highest and lowest values for the other supercells, while the frequencies of the first and second modes ere the lowest, and the damping ratios of the first, second, and fifth modes were the highest, for any of the supercells.
The modes of resonance from the EMA of the positive terminals coincided with the resonance peaks observed from the welded tabs on the positive terminals, as shown in Figure 17. These spectra are characterized by low variance in the mean of the magnitude, as shown by the shaded regions in the plots. This is particularly notable for the spectra of the supercell with mixed welding currents, which shows low variance despite containing tabs with a range of welding currents. This suggests that the dynamic properties were more strongly influenced by structural rather than local features within the supercells, which is the same conclusion as that determined for the negative terminals in Section 4.2.1.

4.2.3. Summarizing Discussion for Experimental Modal Analysis of Supercells

  • The heatmaps and Pearson correlation coefficients showed either weak or negligible linear correlations between the resonance frequency or the damping ratio and the welding current. This is contrary to the hypothesis that the sub-optimally welded tabs would be more compliant and therefore resonate at lower frequencies and with higher damping ratios than the well optimized welds.
  • The individual supercells were characterized by modal models with distinct features, but lacked clear trends between the modal parameters and the welding current. This was particularly notable for the supercells with mixed welds, which had both similarities with and differences from the other supercells, as well as unique properties that were not intermediate between their optimally and sub-optimally welded counterparts.
  • The averaged spectra from the tabs of the cells showed resonance peaks that were consistent with the frequencies of the mode shapes obtained from the EMA of the supercells. These spectra were characterized by low variance from the mean magnitude. This suggests that the modal models were influenced to a greater degree by structural materials than by the local compliance and damping of the welds.
  • While the above findings are applicable to the EMA undertaken at both the negative and positive terminals, numerical differences were found in the resonance frequencies and damping ratios observed at either terminal. This suggests that the local internal structure of the cylindrical cells played a role in influencing the modal parameters, even if it did not strongly influence the overall trends.

5. Conclusions

LDV was investigated as a means of identifying the post-weld quality of the tabs of lithium-ion cells. The main hypothesis of this investigation was that the poorly welded tabs would be more compliant than the optimally welded tabs. The sub-optimally welded tabs would therefore vibrate with lower resonance frequencies and higher damping ratios, which should be observable from the FRFs. The trends in the modal parameters obtained by the EMA would therefore serve as accurate predictors of the weld quality.
The single-lap-shear testing of the coupons found a strong linear correlation between the peak force and the welding current, confirming a relationship between the mechanical properties and the weld quality. LDV was performed on four structurally identical supercells that each contained 10 cylindrical cells. The supercells were welded with either 160 A, 130 A, 110 A, or a mixture of welding currents. The individual supercells were characterized with unique modal models but, contrary to the hypothesis, and counter to the lap-shear results, no significant correlations were found between the resonance frequency or the damping ratio and the welding current. The relative independence in the modal parameters of the supercells with mixed welding current and low variance in the magnitude of FRFs obtained at their tabs suggested that the modal models were influenced to a greater extent by the stiffness of the cylindrical cells and structural materials than by the local compliance of the welds. The minor differences in a comparison between the modal parameters obtained from the negative and positive terminals of the supercells suggest some influence of the local structural properties in the cylindrical cells.
In conclusion, differences in the modal models between the supercells that were joined with different welding currents were clearly identifiable from the EMA obtained from LDV of the interconnections between the cylindrical cells and the busbars. Although the modal models for each supercell were unique, the absence of significant correlations between the locally observed modal parameters and the welding current means that modal parameters cannot be used as reliable predictors of weld quality.
From an industrial-applications perspective, this technique has practical applicability for distinguishing between supercells that feature differences in welding quality. If a modal model is obtained using LDV for an energy-storage system with nominally optimal welding quality, the modal models obtained from other structurally similar products can be compared with the designated ‘optimal’ archetype in order to check their welding quality. If the modal models were to differ in some respect, this would alert the manufacturer to the existence of a physical difference between two products that might otherwise look the same during a visual inspection. This is particularly relevant in the case of internal defects, which may not be visible from the surface of the product. Because this investigation did not establish significant correlations between the modal parameters and the welding current, a limitation of this technique is that it is unable to distinguish local features. Therefore, an operator would not know which of the welds were sub-optimal or to what extent they were different. Additionally, without better knowledge of structure–property correlations, it is not currently possible to clarify whether differences in modal parameters are associated with defects that are unrelated to the welding quality or with benign flaws that do not have a measurable influence on the function of the product. Welded interconnections are present in batteries featuring different chemistries, such as lead–acid and sodium–sulfur, and are utilized in applications ranging from transportation to renewable generation. LDV will therefore be applicable as an inspection technology for a wide variety of applications for energy-storage systems beyond the lithium-ion supercells investigated in this study.
This investigation showed that LDV is a viable method for distinguishing between lithium-ion energy-storage systems manufactured with different levels of welding quality. However, further development is needed in order to identify the welding quality of specific interconnections and for disambiguating features in FRFs that are associated with structural properties but that are unrelated to welding quality.

Author Contributions

Conceptualization, A.R., A.D., M.W. and N.K.; methodology, A.R., M.W., M.C., N.K., R.P. and P.H.; software, A.R. and M.C.; validation, A.R.; formal analysis, A.R. and M.C.; investigation, A.R., M.W., M.C., N.K., R.P. and P.H.; resources, A.R., M.W., M.C., N.K. and R.P.; data curation, A.R., M.C. and P.H.; writing—original draft preparation, A.R.; writing—review and editing, A.R., N.K., A.D., M.W. and I.M.; visualization, A.R.; supervision, A.D. and I.M.; project administration, A.R.; funding acquisition, A.R., A.D. and I.M. All authors have read and agreed to the published version of the manuscript.

Funding

This research is supported by the High Value Manufacturing Catapult.

Institutional Review Board Statement

Not applicable.

Informed Consent Statement

Not applicable.

Data Availability Statement

Not applicable.

Acknowledgments

The authors would like to thank Jonathan Sansom (University of Warwick) for encouraging prior research in this field before the start of this investigation.

Conflicts of Interest

The authors declare no conflict of interest. The funders had no role in the design of the study; in the collection, analyses, or interpretation of data; in the writing of the manuscript, or in the decision to publish the results.

References

  1. Wang, B.; Hu, S.J.; Sun, L.; Freiheit, T. Intelligent welding system technologies: State-of-the-art review and perspectives. J. Manuf. Syst. 2020, 56, 373–391. [Google Scholar] [CrossRef]
  2. Cai, W.; Wang, J.; Jiang, P.; Cao, L.; Mi, G.; Zhou, Q. Application of sensing techniques and artificial intelligence-based methods to laser welding real-time monitoring: A critical review of recent literature. J. Manuf. Syst. 2020, 57, 1–18. [Google Scholar] [CrossRef]
  3. Stavridis, J.; Papacharalampopoulos, A.; Stavropoulos, P. Quality assessment in laser welding: A critical review. Int. J. Adv. Manuf. Technol. 2018, 94, 1825–1847. [Google Scholar] [CrossRef]
  4. You, D.Y.; Gao, X.D.; Katayama, S. Review of laser welding monitoring. Sci. Technol. Weld. Join. 2014, 19, 181–201. [Google Scholar] [CrossRef]
  5. Chen, Y.; Chen, B.; Yao, Y.; Tan, C.; Feng, J. A spectroscopic method based on support vector machine and artificial neural network for fiber laser welding defects detection and classification. NDT E Int. 2019, 108, 102176. [Google Scholar] [CrossRef]
  6. Zhang, Z.; Ren, W.; Yang, Z.; Wen, G. Real-time seam defect identification for Al alloys in robotic arc welding using optical spectroscopy and integrating learning. Measurement 2020, 156, 107546. [Google Scholar] [CrossRef]
  7. Xiao, X.; Liu, X.; Cheng, M.; Song, L. Towards monitoring laser welding process via a coaxial pyrometer. J. Mater. Process. Technol. 2019, 277, 116409. [Google Scholar] [CrossRef]
  8. Schmidt, L.; Römer, F.; Böttger, D.; Leinenbach, F.; Straß, B.; Wolter, B.; Schricker, K.; Seibold, M.; Bergmann, J.P.; Del Galdo, G. Acoustic process monitoring in laser beam welding. Procedia CIRP 2020, 94, 763–768. [Google Scholar] [CrossRef]
  9. Sumesh, A.; Rameshkumar, K.; Mohandas, K.; Babu, R.S. Use of Machine Learning Algorithms for Weld Quality Monitoring using Acoustic Signature. Procedia Comput. Sci. 2015, 50, 316–322. [Google Scholar] [CrossRef] [Green Version]
  10. Silva, L.C.; Filho, E.F.S.; de Albuquerque, M.C.S.; Silva, I.C.; Farias, C.T. Segmented analysis of time-of-flight diffraction ultrasound for flaw detection in welded steel plates using extreme learning machines. Ultrasonics 2019, 102, 106057. [Google Scholar] [CrossRef]
  11. Amiri, N.; Farrahi, G.; Kashyzadeh, K.R.; Chizari, M. Applications of ultrasonic testing and machine learning methods to predict the static & fatigue behavior of spot-welded joints. J. Manuf. Process. 2020, 52, 26–34. [Google Scholar] [CrossRef]
  12. Malarvel, M.; Singh, H. An autonomous technique for weld defects detection and classification using multi-class support vector machine in X-radiography image. Optik 2021, 231, 166342. [Google Scholar] [CrossRef]
  13. You, D.; Gao, X.; Katayama, S. Multisensor Fusion System for Monitoring High-Power Disk Laser Welding Using Support Vector Machine. IEEE Trans. Ind. Inform. 2014, 10, 1285–1295. [Google Scholar] [CrossRef]
  14. Mishra, D.; Gupta, A.; Raj, P.; Kumar, A.; Anwer, S.; Pal, S.K.; Chakravarty, D.; Pal, S.; Chakravarty, T.; Pal, A.; et al. Real time monitoring and control of friction stir welding process using multiple sensors. CIRP J. Manuf. Sci. Technol. 2020, 30, 1–11. [Google Scholar] [CrossRef]
  15. Zhang, Y.; You, D.; Gao, X.; Zhang, N.; Gao, P.P. Welding defects detection based on deep learning with multiple optical sensors during disk laser welding of thick plates. J. Manuf. Syst. 2019, 51, 87–94. [Google Scholar] [CrossRef]
  16. Liu, G.; Gao, X.; You, D.; Zhang, N. Prediction of high power laser welding status based on PCA and SVM classification of multiple sensors. J. Intell. Manuf. 2019, 30, 821–832. [Google Scholar] [CrossRef]
  17. Xu, Y.; Wang, Z. Visual sensing technologies in robotic welding: Recent research developments and future interests. Sensors Actuators A Phys. 2021, 320, 112551. [Google Scholar] [CrossRef]
  18. Mishra, D.; Roy, R.B.; Dutta, S.; Pal, S.K.; Chakravarty, D. A review on sensor based monitoring and control of friction stir welding process and a roadmap to Industry 4.0. J. Manuf. Process. 2018, 36, 373–397. [Google Scholar] [CrossRef]
  19. Zhang, Z.; Wen, G.; Chen, S. Weld image deep learning-based on-line defects detection using convolutional neural networks for Al alloy in robotic arc welding. J. Manuf. Process. 2019, 45, 208–216. [Google Scholar] [CrossRef]
  20. Yang, L.; Fan, J.; Liu, Y.; Li, E.; Peng, J.; Liang, Z. Automatic Detection and Location of Weld Beads With Deep Convolutional Neural Networks. IEEE Trans. Instrum. Meas. 2021, 70, 5001912. [Google Scholar] [CrossRef]
  21. Fan, X.; Gao, X.; Liu, G.; Ma, N.; Zhang, Y. Research and prospect of welding monitoring technology based on machine vision. Int. J. Adv. Manuf. Technol. 2021, 115, 3365–3391. [Google Scholar] [CrossRef]
  22. Kumar, N.; Masters, I.; Das, A. In-depth evaluation of laser-welded similar and dissimilar material tab-to-busbar electrical interconnects for electric vehicle battery pack. J. Manuf. Process. 2021, 70, 78–96. [Google Scholar] [CrossRef]
  23. Shah, R.K. Advances in Science and Technology of Compact Heat Exchangers. Heat Transf. Eng. 2006, 27, 3–22. [Google Scholar] [CrossRef]
  24. Jozwik, P.; Polkowski, W.; Bojar, Z. Applications of Ni3Al Based Intermetallic Alloys—Current Stage and Potential Perceptivities. Materials 2015, 8, 2537–2568. [Google Scholar] [CrossRef]
  25. Chludzinski, M.; dos Santos, R.; Churiaque, C.; Ortega-Iguña, M.; Sánchez-Amaya, J. Pulsed Laser Welding Applied to Metallic Materials—A Material Approach. Metals 2021, 11, 640. [Google Scholar] [CrossRef]
  26. Hong, Y.; Chang, B.; Peng, G.; Yuan, Z.; Hou, X.; Xue, B.; Du, D. In-Process Monitoring of Lack of Fusion in Ultra-Thin Sheets Edge Welding Using Machine Vision. Sensors 2018, 18, 2411. [Google Scholar] [CrossRef] [Green Version]
  27. Shaikh, U.F.; Das, A.; Barai, A.; Masters, I. Electro-Thermo-Mechanical Behaviours of Laser Joints for Electric Vehicle Battery Interconnects. In Proceedings of the 2019 Electric Vehicles International Conference (EV), Bucharest, Romania, 3–4 October 2019; pp. 1–6. [Google Scholar] [CrossRef] [Green Version]
  28. Liu, Y.; Zhang, R.; Wang, J.; Wang, Y. Current and future lithium-ion battery manufacturing. iScience 2021, 24, 102332. [Google Scholar] [CrossRef]
  29. Saw, L.H.; Ye, Y.; Tay, A.A. Integration issues of lithium-ion battery into electric vehicles battery pack. J. Clean. Prod. 2016, 113, 1032–1045. [Google Scholar] [CrossRef]
  30. Wang, W.; Dai, S.; Zhao, W.; Wang, C.; Ma, T. Design optimization of a novel negative Poisson’s ratio non-module battery pack system considering crashworthiness and heat dissipation. Compos. Struct. 2021, 275, 114458. [Google Scholar] [CrossRef]
  31. Xiong, Y.; Pan, Y.; Wu, L.; Liu, B. Effective weight-reduction- and crashworthiness-analysis of a vehicle’s battery-pack system via orthogonal experimental design and response surface methodology. Eng. Fail. Anal. 2021, 128, 105635. [Google Scholar] [CrossRef]
  32. Zhi, M.; Fan, R.; Yang, X.; Zheng, L.; Yue, S.; Liu, Q.; He, Y. Recent research progress on phase change materials for thermal management of lithium-ion batteries. J. Energy Storage 2022, 45, 103694. [Google Scholar] [CrossRef]
  33. Schuh, G.; Bergweiler, G.; Fiedler, F.; Koltermann, M. Flexible Production Concept of a Low-Cost Battery Pack Housing for Electric Vehicles. Procedia CIRP 2020, 93, 137–142. [Google Scholar] [CrossRef]
  34. Zwicker, M.; Moghadam, M.; Zhang, W.; Nielsen, C. Automotive battery pack manufacturing—A review of battery to tab joining. J. Adv. Join. Process. 2020, 1, 100017. [Google Scholar] [CrossRef]
  35. Das, A.; Li, D.; Williams, D.; Greenwood, D. Joining Technologies for Automotive Battery Systems Manufacturing. World Electr. Veh. J. 2018, 9, 22. [Google Scholar] [CrossRef] [Green Version]
  36. Das, A.; Li, D.; Williams, D.; Greenwood, D. Weldability and shear strength feasibility study for automotive electric vehicle battery tab interconnects. J. Braz. Soc. Mech. Sci. Eng. 2019, 41, 54. [Google Scholar] [CrossRef] [Green Version]
  37. Rikka, V.R.; Sahu, S.R.; Roy, A.; Jana, S.N.; Sivaprahasam, D.; Prakash, R.; Gopalan, R.; Sundararajan, G. Tailoring micro resistance spot welding parameters for joining nickel tab to inner aluminium casing in a cylindrical lithium ion cell and its influence on the electrochemical performance. J. Manuf. Process. 2020, 49, 463–471. [Google Scholar] [CrossRef]
  38. Rothberg, S.J.; Allen, M.S.; Castellini, P.; Di Maio, D.; Dirckx, J.J.J.; Ewins, D.J.; Halkon, B.J.; Muyshondt, P.; Paone, N.; Ryan, T.; et al. An international review of laser Doppler vibrometry: Making light work of vibration measurement. Opt. Lasers Eng. 2017, 99, 11–22. [Google Scholar] [CrossRef] [Green Version]
  39. Yu, T.Y. 12-laser-based sensing for assessing and monitoring civil infrastructures. In Sensor Technologies for Civil Infrastructures; Wang, M.L., Lynch, J.P., Sohn, H., Eds.; Woodhead Publishing: Thorston, UK, 2014; Volume 55, pp. 327–356. [Google Scholar]
  40. Foth, H.-J.; Meyer, D.H.; Stoeckel, T. Side effects of laser-tissue interaction studied by laser Doppler vibrometry. In Proceedings of the Fourth International Conference on Vibration Measurements by Laser Techniques: Advances and Applications, Ancona, Italy, 20–23 June 2000; Volume 4072, pp. 392–401. [Google Scholar] [CrossRef]
  41. Castellini, P.; Martarelli, M.; Tomasini, E.P. Laser Doppler Vibrometry: Development of advanced solutions answering to technology’s needs. Mech. Syst. Signal Process. 2006, 20, 1265–1285. [Google Scholar] [CrossRef]
  42. Scislo, L. Non-invasive measurements of ultra-lightweight composite materials using laser doppler vibrometry system. In Proceedings of the 26th International Congress on Sound and Vibration: Montreal Bridges, Montreal, QC, Canada, 7–11 July 2019. [Google Scholar]
  43. Roose, S.; Stockman, Y.; Rochus, P.; Kuhn, T.; Lang, M.; Baier, H.; Langlois, S.; Casarosa, G. Optical methods for non-contact measurements of membranes. Acta Astronaut. 2009, 65, 1317–1329. [Google Scholar] [CrossRef]
  44. Di Maio, D.; Castellini, P.; Martarelli, M.; Rothberg, S.; Allen, M.; Zhu, W.; Ewins, D. Continuous Scanning Laser Vibrometry: A raison d’être and applications to vibration measurements. Mech. Syst. Signal Process. 2021, 156, 107573. [Google Scholar] [CrossRef]
  45. Xiang, J.-W.; Matsumoto, T.; Long, J.-Q.; Ma, G. Identification of damage locations based on operating deflection shape. Nondestruct. Test. Eval. 2013, 28, 166–180. [Google Scholar] [CrossRef]
  46. Khan, A.; Stanbridge, A.; Ewins, D. Detecting damage in vibrating structures with a scanning LDV. Opt. Lasers Eng. 1999, 32, 583–592. [Google Scholar] [CrossRef]
  47. Scislo, L. Quality Assurance and Control of Steel Blade Production Using Full Non-Contact Frequency Response Analysis and 3D Laser Doppler Scanning Vibrometry System. In Proceedings of the 2021 11th IEEE International Conference on Intelligent Data Acquisition and Advanced Computing Systems: Technology and Applications (IDAACS), Cracow, Poland, 22–25 September 2021; Volume 1, pp. 419–423. [Google Scholar] [CrossRef]
  48. Seppänen, H.; Kurppa, R.; Meriläinen, A.; Hæggström, E. Real time contact resistance measurement to determine when microwelds start to form during ultrasonic wire bonding. Microelectron. Eng. 2013, 104, 114–119. [Google Scholar] [CrossRef]
  49. Larizza, P. Chapter 29—Measurement, testing, and diagnosis for micro-manufacturing systems. In Micromanufacturing Engineering and Technology, 2nd ed.; Qin, Y., Ed.; William Andrew Publishing: Boston, MA, USA, 2015; pp. 675–704. [Google Scholar]
  50. Lawrence, E.M.; Speller, K.E.; Yu, D. MEMS characterization using Laser Doppler Vibrometry. In Reliability, Testing, and Characterization of MEMS/MOEMS II; International Society for Optics and Photonics: Bellingham, WA, USA, 2003; Volume 4980, pp. 51–63. [Google Scholar] [CrossRef]
  51. Johansmann, M.; Wirth, G. Laser Doppler vibrometry for measuring vibration in ultrasonic transducers. In Ultrasonic Transducers; Woodhead Publishing: Thorston, UK, 2012; pp. 277–313. [Google Scholar] [CrossRef]
  52. Balz, I.; Rosenthal, E.; Reimer, A.; Turiaux, M.; Schiebahn, A.; Reisgen, U. Analysis of the thermo-mechanical mechanism during ultrasonic welding of battery tabs using high-speed image capturing. Weld. World 2019, 63, 1573–1582. [Google Scholar] [CrossRef]
  53. Balle, F.; Wagner, G.; Eifler, D. Characterization of the ultrasonic welding process through high-resolution laser-doppler vibrometry. In InFocus—Optical Measurement Solutions Issue I; Polytec: Irvine, CA, USA, 2009. [Google Scholar]
  54. Lu, Y.; Song, H.; Taber, G.; Foster, D.; Daehn, G.; Zhang, W. In-situ measurement of relative motion during ultrasonic spot welding of aluminum alloy using Photonic Doppler Velocimetry. J. Mater. Process. Technol. 2016, 231, 431–440. [Google Scholar] [CrossRef]
  55. Czerny, B.; Khatibi, G. Interface reliability and lifetime prediction of heavy aluminum wire bonds. Microelectron. Reliab. 2016, 58, 65–72. [Google Scholar] [CrossRef]
  56. Pedersen, K.B.; Nielsen, D.A.; Czerny, B.; Khatibi, G.; Iannuzzo, F.; Popok, V.N.; Pedersen, K. Wire bond degradation under thermo- and pure mechanical loading. Microelectron. Reliab. 2017, 76, 373–377. [Google Scholar] [CrossRef]
  57. Czerny, B.; Khatibi, G. Accelerated mechanical fatigue interconnect testing method for electrical wire bonds. tm-Tech. Mess. 2018, 85, 213–220. [Google Scholar] [CrossRef]
  58. Popok, V.N.; Buhrkal-Donau, S.; Czerny, B.; Khatibi, G.; Luo, H.; Iannuzzo, F.; Pedersen, K.B. Comparative study of wire bond degradation under power and mechanical accelerated tests. J. Mater. Sci. Mater. Electron. 2019, 30, 17040–17045. [Google Scholar] [CrossRef]
  59. Gaul, H.; Shah, A.; Mayer, M.; Zhou, Y.; Schneider-Ramelow, M.; Reichl, H. The ultrasonic wedge/wedge bonding process investigated using in situ real-time amplitudes from laser vibrometer and integrated force sensor. Microelectron. Eng. 2010, 87, 537–542. [Google Scholar] [CrossRef]
  60. Qin, I.; Shah, A.; Huynh, C.; DeAngelis, D.; Meyer, M.; Mayer, M.; Zhou, Y. Thermosonic Au ball bonding process investigated using microsensor and laser vibrometer. In Proceedings of the 60th Electronic Components and Technology Conference (ECTC), Las Vegas, NV, USA, 1–4 June 2010; pp. 1776–1782. [Google Scholar] [CrossRef]
  61. Tan, K.M.; Babu, T.S.; Ramachandaramurthy, V.K.; Kasinathan, P.; Solanki, S.G.; Raveendran, S.K. Empowering smart grid: A comprehensive review of energy storage technology and application with renewable energy integration. J. Energy Storage 2021, 39, 102591. [Google Scholar] [CrossRef]
  62. Kebede, A.A.; Kalogiannis, T.; Van Mierlo, J.; Berecibar, M. A comprehensive review of stationary energy storage devices for large scale renewable energy sources grid integration. Renew. Sustain. Energy Rev. 2022, 159, 112213. [Google Scholar] [CrossRef]
  63. Wang, W.; Yuan, B.; Sun, Q.; Wennersten, R. Application of energy storage in integrated energy systems—A solution to fluctuation and uncertainty of renewable energy. J. Energy Storage 2022, 52, 104812. [Google Scholar] [CrossRef]
  64. Sokolov, M.; Franciosa, P.; Sun, T.; Ceglarek, D.; DiMatteo, V.; Ascari, A.; Fortunato, A.; Nagel, F. Applying optical coherence tomography for weld depth monitoring in remote laser welding of automotive battery tab connectors. J. Laser Appl. 2021, 33, 012028. [Google Scholar] [CrossRef]
  65. Kang, B.; Cai, W.; Tan, C.-A. Dynamic Response of Battery Tabs under Ultrasonic Welding. J. Manuf. Sci. Eng. 2013, 135, 051013. [Google Scholar] [CrossRef]
  66. Kang, B.; Cai, W.; Tan, C.-A. Dynamic Stress Analysis of Battery Tabs under Ultrasonic Welding. J. Manuf. Sci. Eng. 2014, 136, 041011. [Google Scholar] [CrossRef]
  67. Kang, B.; Cai, W.; Tan, C.-A. Vibrational energy loss analysis in battery tab ultrasonic welding. J. Manuf. Process. 2014, 16, 218–232. [Google Scholar] [CrossRef]
  68. Japanese Industrial Standards Committee. Determination of tensile lap-shear strength of rigid-to-rigid bonded assemblies. JIS K 2003, 6850, 1999. [Google Scholar]
  69. Wang, X. 3-vehicle vibration measurement and analysis. In Vehicle Noise and Vibration Refinement; Wang, X., Ed.; Woodhead Publishing: Thorston, UK, 2010; pp. 33–67. [Google Scholar] [CrossRef]
  70. Sinha, J.K. Introduction to vibration instruments. In Vibration Analysis, Instruments, and Signal Processing; CRC Press: Boca Raton, FL, USA, 2015; p. 110. [Google Scholar]
  71. Avitabile, P. Introduction to Experimental Modal Analysis: A Simple Non-mathematical Presentation. In Modal Testing: A Practitioner’s Guide; The Society for Experimental Mechanics and John Wiley & Sons Ltd.: Chichester, UK, 2018; pp. 1–35. [Google Scholar] [CrossRef]
  72. Avitabile, P. Modal Parameter Estimation Techniques. In Modal Testing: A Practitioner’s Guide; The Society for Experimental Mechanics and John Wiley & Sons Ltd.: Chichester, UK, 2017; pp. 189–219. [Google Scholar] [CrossRef]
  73. Schwarz, B.J.; Richardson, M.H. Experimental modal analysis. In Polywave User Manual; Polytec GmbH: Waldbronn, Germany, 2021; pp. 57–63. [Google Scholar]
  74. Jazar, R.N. One degree of freedom systems, frequency response. In Advanced Vibrations: A Modern Approach; Springer: Berlin/Heidelberg, Germany, 2013; Volume 3, pp. 175–232. [Google Scholar]
  75. Psv-500 Scanning Vibrometer Datasheet. Available online: https://www.polytec.com/eu/vibrometry/products/full-field-vibrometers/psv-500-scanning-vibrometer (accessed on 20 May 2022).
Figure 1. Cylindrical cell with attached tabs.
Energies 15 04379 g001
Figure 2. Resonance modes of battery tabs are predicted to be dependent on weld quality.
Energies 15 04379 g002
Figure 3. Dimensions of copper–steel single-lap-shear coupons.
Energies 15 04379 g003
Figure 4. Fixture with coupon in preparation for welding.
Energies 15 04379 g004
Figure 5. Supercell with 10 cylindrical cells.
Energies 15 04379 g005
Figure 6. Supercells joined with 160 A, 130 A, 110 A, and a mixture of welding currents.
Energies 15 04379 g006
Figure 7. Polytec PSV-500 XTRA laser vibrometer scanning system.
Energies 15 04379 g007
Figure 8. Illustration of calculation of damping ratio of a SDOF peak using.
Energies 15 04379 g008
Figure 9. EMA of supercells in a free–free condition.
Energies 15 04379 g009
Figure 10. Observation locations on the 110 A supercell. (Left): from the side of the busbar with positive cell terminals. (Right): from the side of the busbar with negative cell terminals.
Energies 15 04379 g010
Figure 11. Lap-shear peak force with welding current. Points represent mean values of force and error bars represent one standard deviation from the mean.
Energies 15 04379 g011
Figure 12. Heatmaps of resonance frequencies and damping ratios of supercells observed from the negative terminals, with respect to welding current and mode number.
Energies 15 04379 g012
Figure 13. Scatter plots, with the Pearson correlation coefficient, of the mean resonance frequency (left) and the mean damping ratio (right) of the first five modes, as observed from the negative terminals of the 110 A, 130 A, 160 A, and mixed supercells.
Energies 15 04379 g013
Figure 14. Mean spectra obtained from the tabs at the negative terminals of the supercells. Each line in bold is the mean of 10 FRFs obtained from the centers of each of the welded tabs. Shaded regions represent one standard deviation from the mean of the magnitude. Annotations mark the resonance frequencies of mode shapes obtained by EMA (of the first, second, third, fourth, and fifth mode shapes).
Energies 15 04379 g014
Figure 15. Heatmaps of resonance frequencies and damping ratios of supercells observed from the positive terminals, with respect to welding current and mode number.
Energies 15 04379 g015
Figure 16. Scatter plots, with the Pearson correlation coefficient, of the mean resonance frequency (left) and the mean damping ratio (right) of the first five modes, as observed from the positive terminals of the 110 A, 130 A, 160 A, and mixed supercells.
Energies 15 04379 g016
Figure 17. Mean spectra obtained from the tabs at the positive terminals of the supercells. Each line in bold is the mean of 10 FRFs obtained from the centers of each of the welded tabs. Shaded regions represent one standard deviation from the mean of the magnitude. Annotations mark the resonance frequencies of mode shapes obtained by EMA (of the first, second, third, fourth, and fifth mode shapes).
Energies 15 04379 g017
Table 1. Weld quality of lap-shear coupons by current.
Weld QualityCurrent (A)
Well optimized160
Intermediate130
Poor110
Not viable100
Publisher’s Note: MDPI stays neutral with regard to jurisdictional claims in published maps and institutional affiliations.

