Article

Improved Body Force Model for Estimating Off-Design Axial Compressor Performance

1
School of Aeronautics and Astronautics, Central South University, Changsha 410083, China
2
Beijing Aeronautical Engineering Technical Research Center, Beijing 100076, China
3
Unit 93609 of the Chinese People’s Liberation Army, Hohhot 010100, China
*
Author to whom correspondence should be addressed.
Energies 2022, 15(12), 4389; https://doi.org/10.3390/en15124389
Submission received: 29 March 2022 / Revised: 2 June 2022 / Accepted: 3 June 2022 / Published: 16 June 2022
(This article belongs to the Special Issue Advanced Propulsion System and Thermal Management Technology)

Abstract

:
Based on the COMSOL software, body forces substituted into the Reynolds-averaged Navier–Stokes (RANS) equations as the source terms instead of the actual blade rows were improved to better predict the compressor performance. Improvements in parallel body force modeling were implemented, central to which were the local flow quantities. This ensured accurate and reliable off-design performance prediction. The parallel force magnitude mainly depended on the meridional entropy gradient extracted from three-dimensional (3D) steady single-passage RANS solutions. The COMSOL software could easily and accurately translate the pitchwise-averaged entropy into the grid points of the body force domain. A NASA Rotor 37 was used to quantify the improved body force model to represent the compressor. Compared with the previous model, the improved body force model was more efficient for the numerical calculations, and it agreed well with the experimental data and computational fluid dynamics (CFD) results. The results indicate that the improved body force model could quickly and efficiently capture the flow field through a turbomachinery blade row.

1. Introduction

Because axial compressors often operate under off-design conditions, aircraft engines must have good performance [1]. The performance of the compressor under off-design conditions must be accurately estimated during the engine design stage [2,3]. Computational fluid dynamics (CFDs) have been considerably developed in recent decades and can accurately and efficiently simulate the flow field and estimate the axial compressor performance [4,5,6]. However, 3D, unsteady, multi-row calculations through the compressor or a coupled inlet fan with the actual blade geometry demand significant computer resources, including CPU time and memory [7,8]. Moreover, lots of flow field simulations are required [9,10]. To save computer resources, a passage-averaged body force model substituted into the RANS equations as the source terms instead of the actual blade rows is proposed herein and used to simulate the pressure rise, flow turning, and loss effects caused by the rotor/stator blade rows with reasonable computer resources [11,12].
Kim developed a body force approach to simulate the flow fields of N3-X. It was assumed that entropy production was related to the mass flow rate (MFR) at a constant speed [13,14]. Li et al. developed a method to perform the coupled inlet-fan Navier–Stokes simulation using the COMSOL–CFD code [15]. The advantage of this method was that the COMSOL–CFD code is a completely open architecture, and the flux terms in the RANS equations can be altered without compromising the computational stability. Source terms and boundary conditions can be functions or logical expressions of arbitrary variables. The body force terms were inputted into the COMSOL–CFD code and could directly simulate the viscous flow close to the blade passage walls and the momentum exchange between fluids. However, the parallel force model had limitations when calculating the local parallel force magnitude, which was proportional to the square of the total relative velocity [13]. The adjusting function g(local) in the normal force formula, which depends on the local MFR, also makes the numerical simulation complicated and tedious [14,15]. Based on the work [15], an improved body force model was proposed using the COMSOL–CFD code. The COMSOL software can easily facilitate all steps in the modeling, part definition, meshing, simulation, and data post processing processes. In this study, the parallel force formula was modified using Marble’s results [16], which indicated that the parallel force magnitude was proportional to the meridional entropy gradient. The magnitude of the meridional entropy gradient was estimated from the 3D steady single-passage RANS solutions of the compressor. The COMSOL software could accurately translate the pitchwise-averaged entropy into the grid points of the body force domain. The normal force formula no longer contained the term g(local), which made the simulation processes efficient. A NASA Rotor 37 was used to quantify the improved body force model to represent the compressor.
The rest of this paper is organized as follows: Section 2 introduces the construction of the improved model; Section 3 explains the computational case and numerical techniques for flow simulations; Section 4 verifies this model, and in closing, Section 5 presents an overall conclusion drawn.

2. Improved Body Force Model

2.1. Governing Equation

In this paper, the governing equations [15] in Cartesian coordinates can be written in a non-conservative form, and the body force terms were added on the right-hand side as source terms, as follows.
b [ ρ t + ( ρ V ) ] b [ ρ D V x D t + p x τ x x x τ y x y τ z x z ] b [ ρ D V y D t + p y τ x y x τ y y y τ z y z ] = Φ   b [ ρ D V z D t + p z τ x z x τ y z y τ z z z ] b [ ρ D e D t ( x ( k T x ) + y ( k T y ) + z ( k T z ) ( u p ) x ( v p ) y ( w p ) z + ( u τ x x ) x + ( u τ y x ) y + ( u τ z x ) z + ( v τ x y ) x + ( v τ y y ) y + ( u τ z y ) z + ( w τ x z ) x + ( w τ y z ) y + ( w τ z z ) z ) ]
where τ x x = 2 3 μ ( 2 u x v y w z ) , τ x y = τ y x = μ ( v x + u y ) , τ y y = 2 3 μ ( u x + 2 v y w z ) , τ x z = τ z x = μ ( u z + w x ) , τ z z = 2 3 μ ( u x v y + 2 w z ) , τ y z = τ z y = μ ( w y + v z ) , the energy e is given by e = C v T + 0.5 ( V x 2 + V y 2 + V z 2 ) ; the pressure p is given by p = ( γ 1 ) ( e 0.5 ρ ( V x 2 + V y 2 + V z 2 ) ) ; the blockage b can be modeled as b = | θ s θ p | N / 2 π to account for the blade thickness, and the source term Φ is given by Φ = Φ′ + Φ″. Φ′ and Φ″ are body forces and extra terms, respectively, as follows.
Φ = b ( 0 , ρ f x , ρ f y , ρ f z , ρ ( V x f x + V y f y + V z f z ) ) T
Φ = { b ( ρ V θ θ r Ω ρ θ ) ρ V b b ( ( ρ V x V θ τ x θ ) θ r Ω ρ V x θ ) b V z ( ρ V θ θ r Ω ρ θ ) b ( ( ρ V θ V r τ r θ ) θ r Ω ρ V r θ V r ( ρ V θ θ r Ω ρ θ ) ) cos θ b ( ( ρ V θ 2 + p τ θ θ ) θ r Ω ρ V θ θ V θ ( ρ V θ θ r Ω ρ θ ) ) sin θ b ( ( ρ V θ V r τ r θ ) θ r Ω ρ V r θ V r ( ρ V θ θ r Ω ρ θ ) ) sin θ + b ( ( ρ V θ 2 + p τ θ θ ) θ r Ω ρ V θ θ V θ ( ρ V θ θ r Ω ρ θ ) ) cos θ b ( ( V θ ( e + p ) V x τ x θ V θ τ θ θ V r τ r θ + q ˙ θ ) θ r Ω e θ ) e [ b ( ρ V θ θ r Ω ρ θ ) ρ V b ] + ( V x ( e + p ) V x τ x x V y τ x y V z τ x z + q ˙ x ) b x + ( V y ( e + p ) V x τ y x V y τ y y V z τ y z + q ˙ y ) b y + ( V z ( e + p ) V x τ z x V y τ z y V z τ z z + q ˙ z ) b z }
In Equation (1), the energy equation of the fluid contains the internal energy and the mechanical energy. So, the differential form of the energy equation can be written as
ρ D D t ( E + 1 2 u i u i ) = x i ( u j σ i j ) q i x i + ρ u i f i
and the differential form of the momentum equation can be written as
ρ D u i D t = σ i j x j + ρ f i  
Then, by minusing u i × Equation (5), the energy equation becomes:
ρ DE D t = σ i j u j x i q i x i
From Equation (6), it can be seen that the body force can only change the size of the mechanical energy with nothing on the internal energy. So, Equation (1) can be written as
b [ ρ t + ( ρ V ) ] b [ ρ D V x D t + p x τ x x x τ y x y τ z x z ] b [ ρ D V y D t + p y τ x y x τ y y y τ z y z ] = Φ + Φ b [ ρ D V z D t + p z τ x z x τ y z y τ z z z ] b [ ρ D E D t + p V x ( k T x ) y ( k T y ) z ( k T z ) τ x x V x x τ x y V y x τ x z V z x τ y x V x y τ y y V y y τ y z V z y τ z x V x z τ z y V y z τ z z V z z ]
where
Φ = ( 0   0   0   0     ( V x ( Φ x + Φ x ) + V y ( Φ y + Φ y ) + V z ( Φ z + Φ z ) ) ) T

2.2. Construction of the Body Force

In this model, the blade force on a cascade section was separated into two parts that were parallel and normal to the local flow, as shown in Figure 1. The normal force Fn represents the effects of the pressure difference, and the parallel force Fp is related to the viscous shear.

2.2.1. Normal Body Force

The body force normal to the flow direction, Fn, is formulated as follows:
F n = K n h V n V p + 2 c sin ( Δ α 2 ) V n 2
where h , V n , V p , and Δ α are the blade-to-blade gap-staggered spacing, axial velocity, circumferential velocity, and the camber angle difference between the trailing edge and leading edge, respectively. Kn is the normal force coefficient [13] formulated in Equation (10). The second expression on the right-hand side of Equation (9) was different from Gong’s formulation:
K n = ( 4.2 3.3 α ) f ( r )
Here, the second expression f(r) was used to adjust the normal force coefficient Kn, which was a line segment connected by a few control points along the spanwise direction. The components of the normal force Fn in the x, y, and z directions are expressed as:
F n , x = F n V z cos θ V y sin θ V r e l   F n , y = F n V x V r e l sin θ ,   F n , z = F n V x V r e l cos θ
where V r e l is the relative blade velocity.

2.2.2. Parallel Body Force

The parallel body force is always tangential to the relative flow and represents the effects of the mixing of the tip leakage flow and main flow and flow blade surface boundary layers. The parallel body force Fp is formulated as follows [11]:
F p = K p h V r e l 2
where the parallel force coefficient Kp is equal to 0.04. In a fixed speed, the magnitude of Fp increases as the MFR increases. The entropy production across the blade domain decreases as the MFR increases. The parallel body force Fp can be expressed as:
F p = T V m V r e l s m
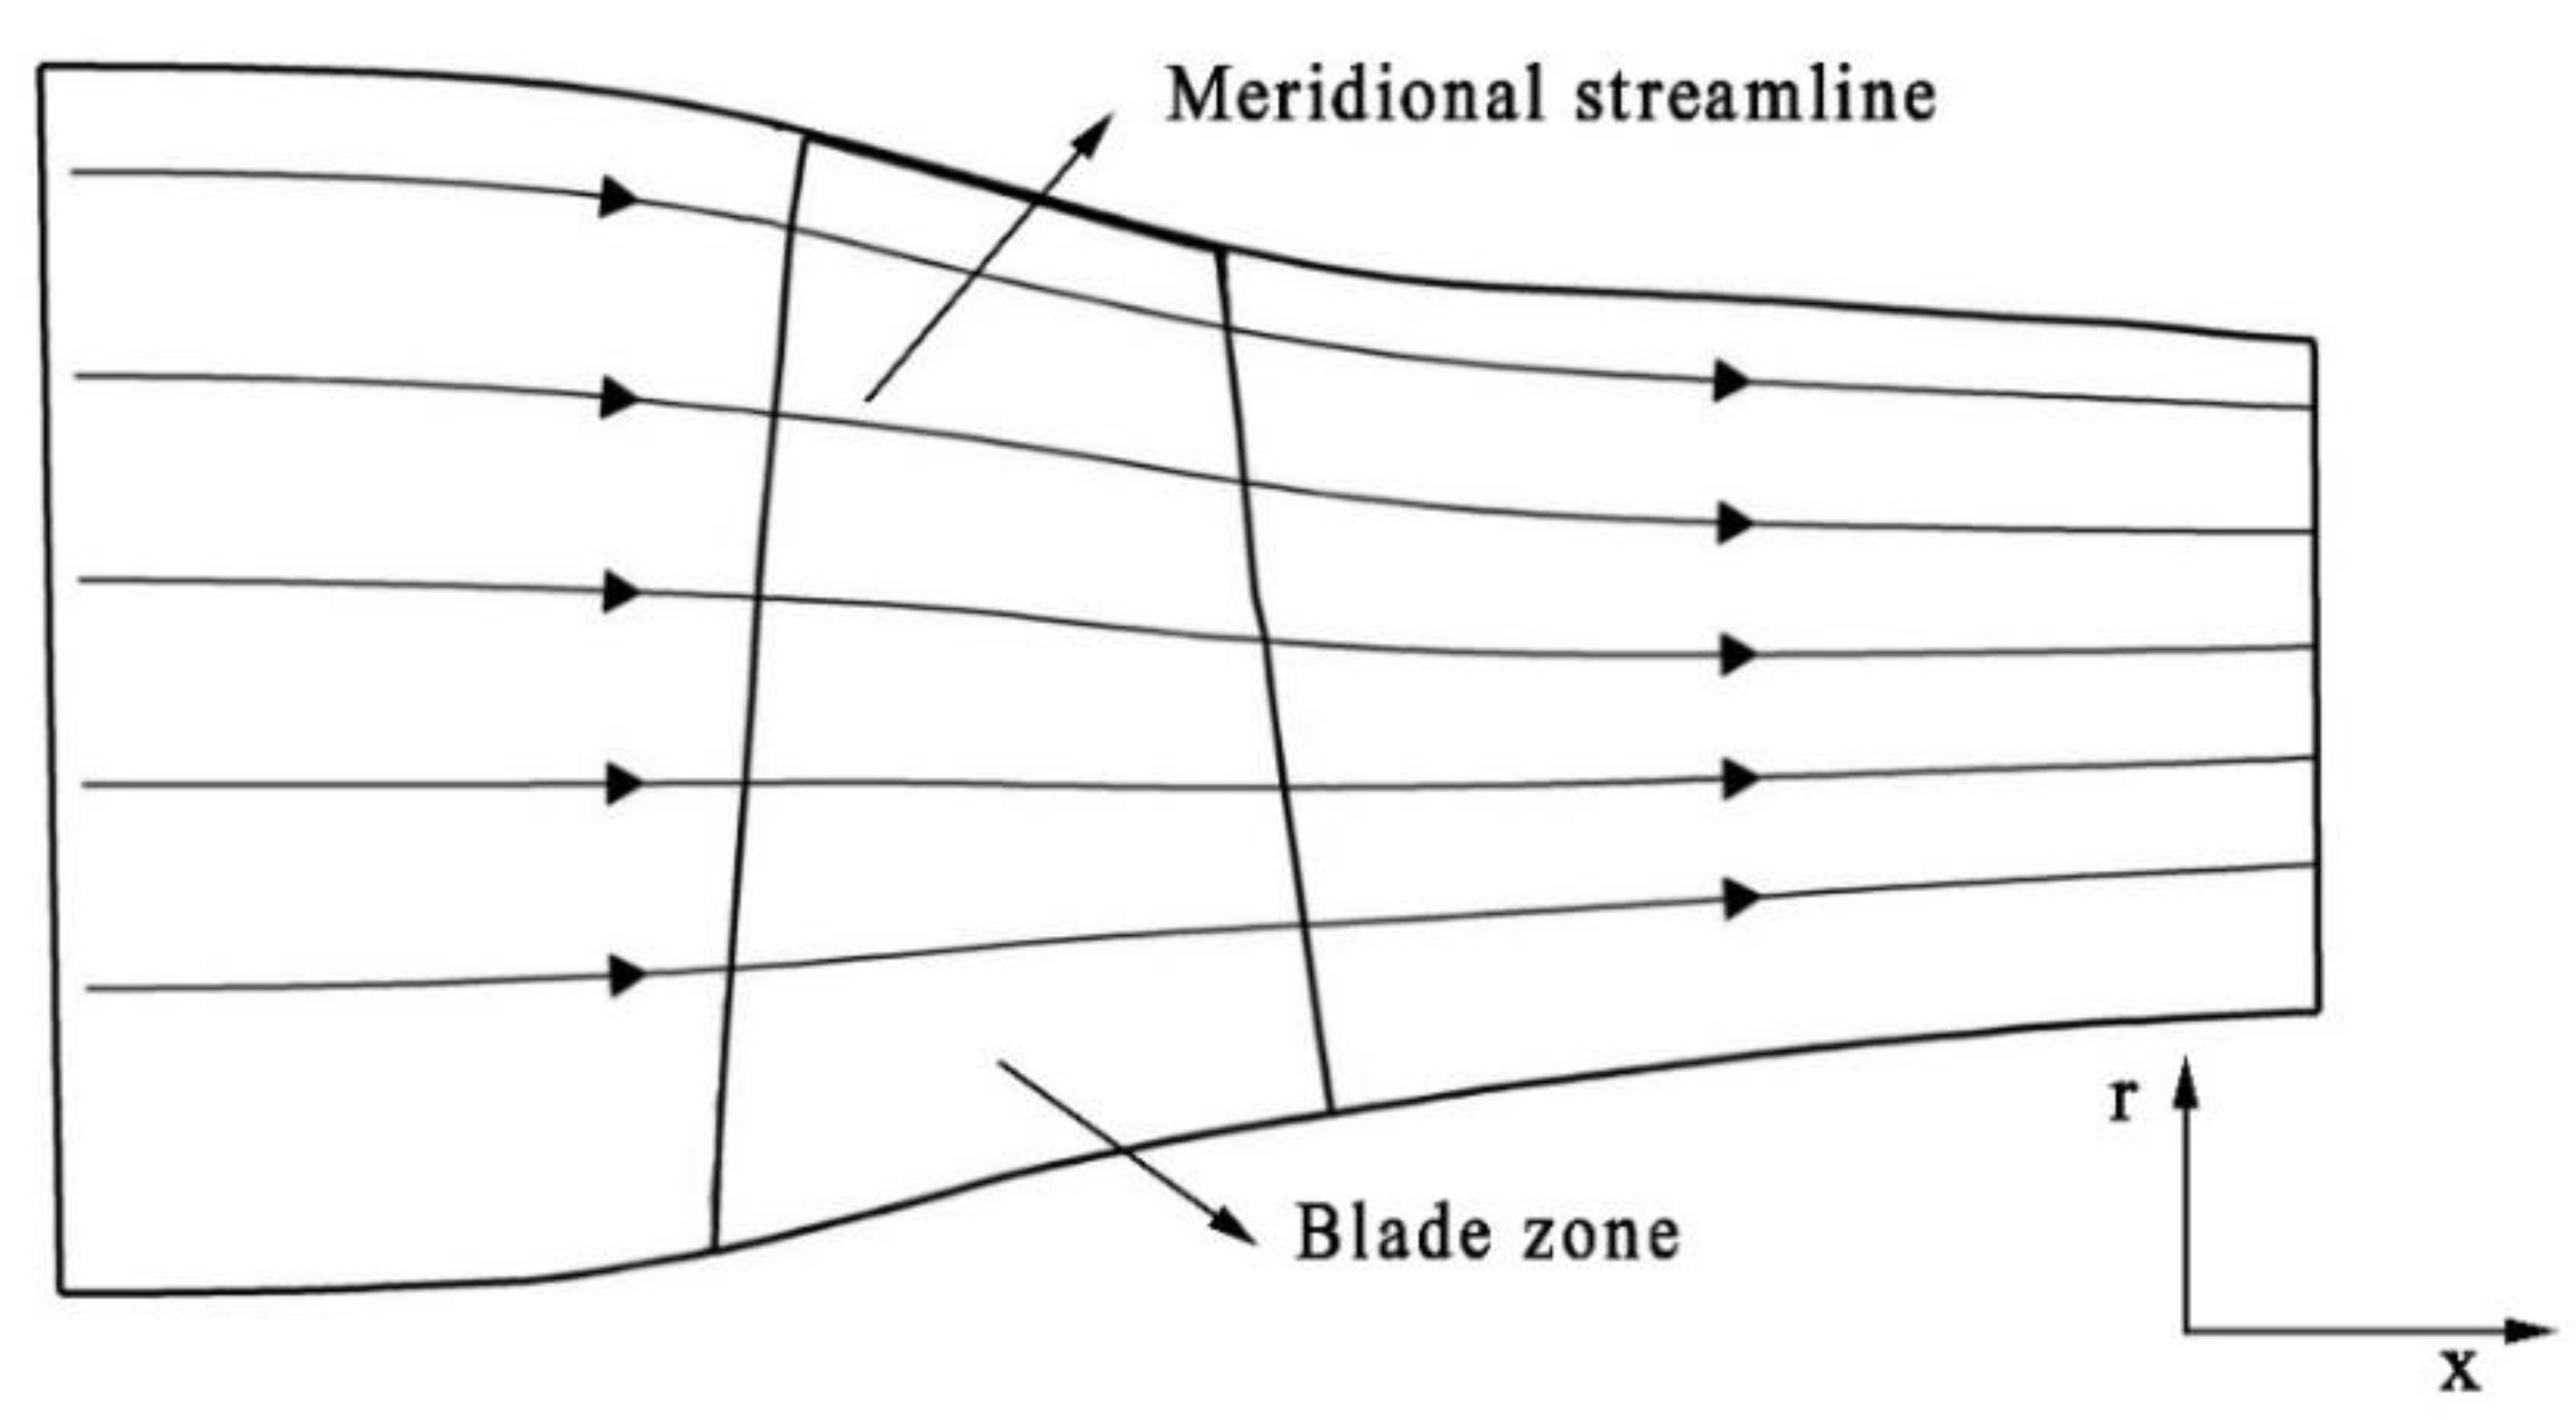
where s is the entropy; T is the temperature, and m is the coordinate along the meridional streamline (Figure 2). Instead of Gong’s model, Equation (13) was used herein to calculate the magnitude of the local parallel force because the direct relationship between the meridional entropy gradient and the parallel body force makes the modeling process of the body force easier and more physical.
The velocity Vm and the partial differential ∂m can be written using the following transformations:
d m 2 = d x 2 + d r 2 V m 2 = V x 2 + V r 2 V m m = V x x + V r r
Hence, Equation (13) becomes simply
F p = T V r e l ( V x s x + V r s r )
where s/x and s/r are the local entropy gradients along the axial and radial directions, respectively. The local gradients of the pitchwise-averaged entropy generated across the blade rows extracted from the 3D steady single-passage RANS solutions are used as the input terms to Equation (15). The components of the parallel force Fp in the x, y, and z directions are expressed as:
F p , x = F p V x V r e l ,   F p , y = F p V y V r e l ,   F p , z = F p V z V r e l

3. Computational Case and Numerical Techniques

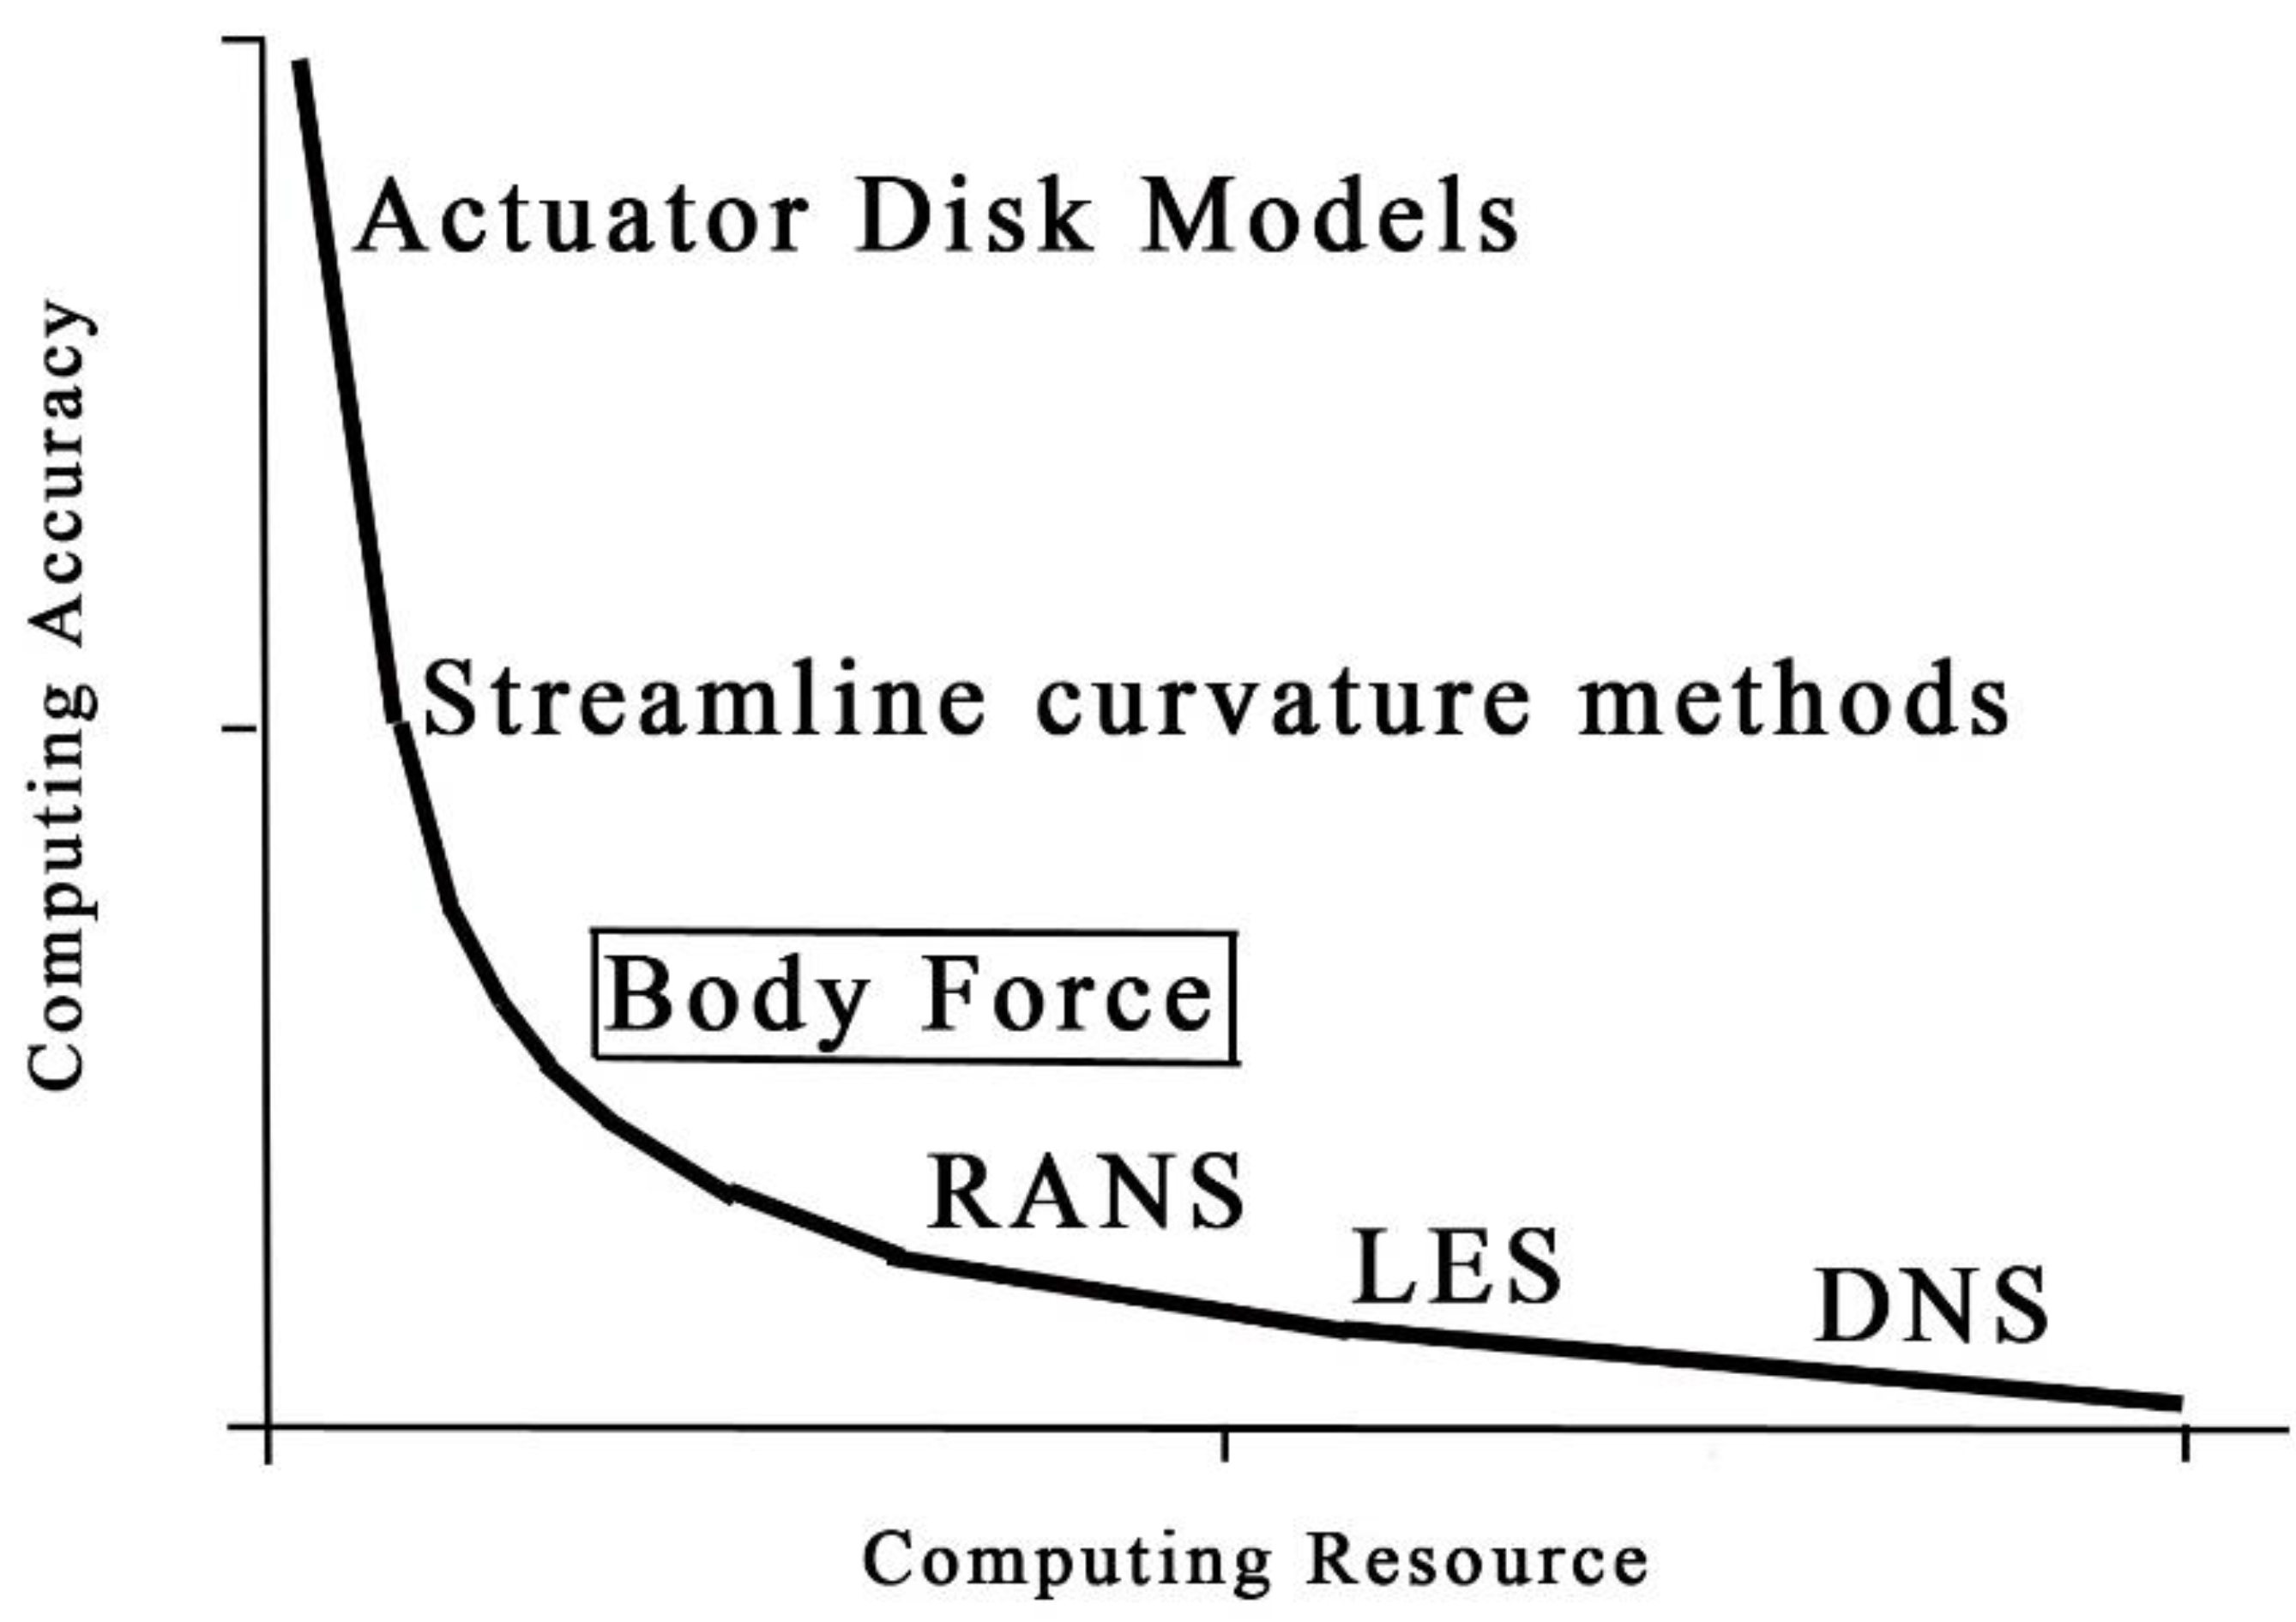
Figure 3 briefly shows the demand on the computational accuracy versus the computer resources for different levels of numerical techniques [17]. It is obvious that the improved body force model can be relatively independent of the empiricism and cost much less computer resources than the RANS model within a proper accuracy range [18]. Below, the RANS model and improved body force model were used to simulate the flow field performances of Rotor 37. Compared with the experimental data, the results were analyzed to further validate the accuracy of the improved body force model.

3.1. Compressor Used for Study

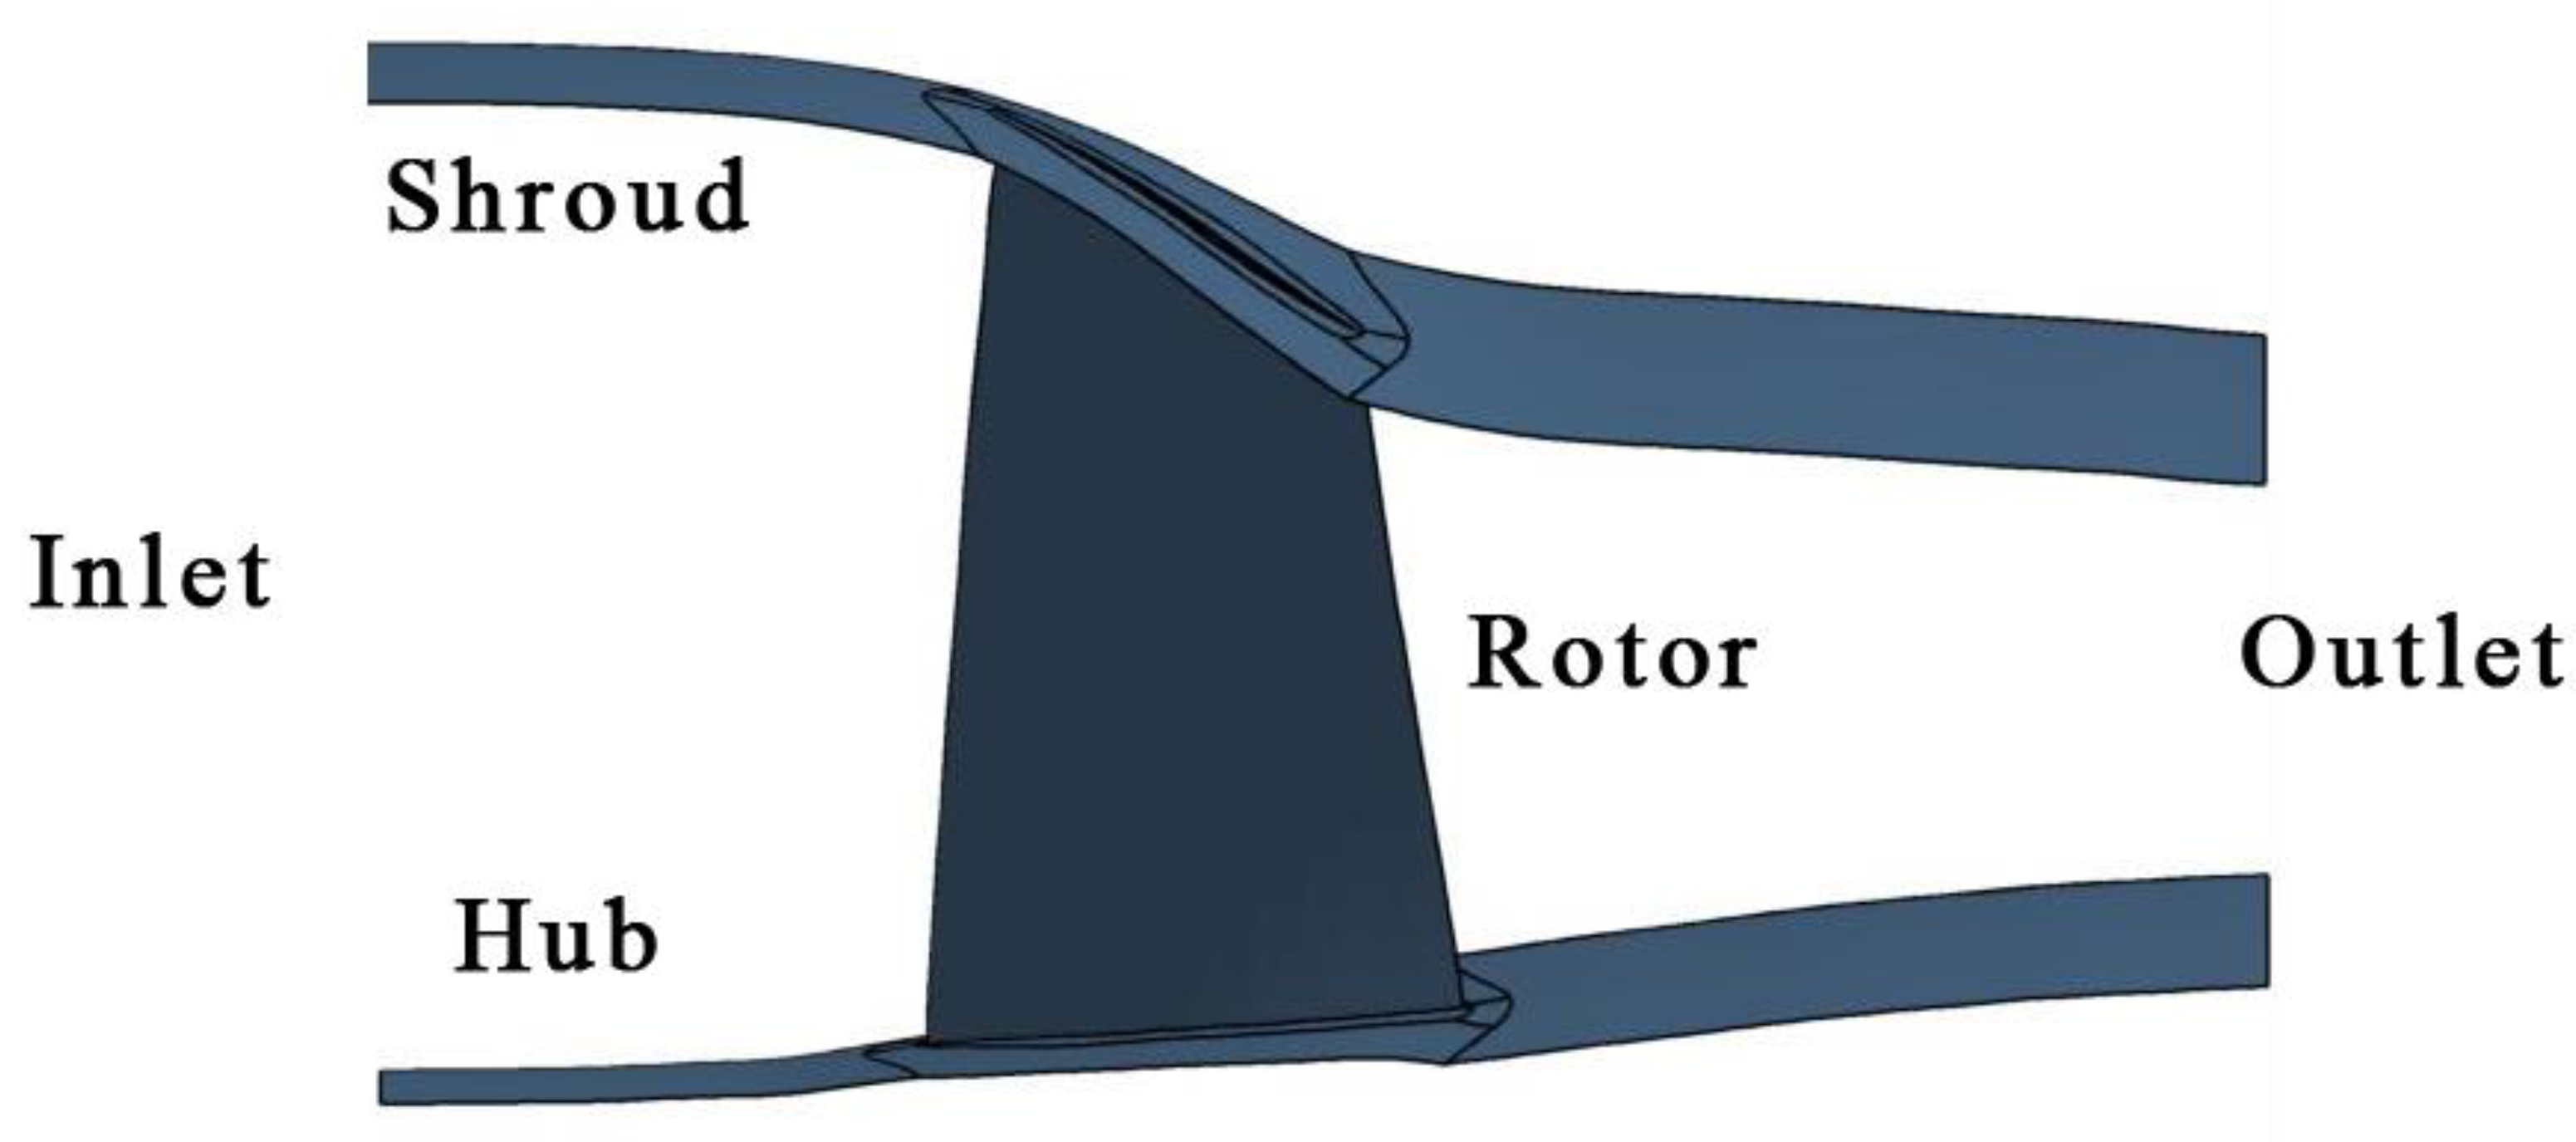
A transonic compressor, a NASA Rotor 37, as shown in Figure 4, was used to validate the improved body force model because it is a well-documented and typical test case. This section presents the CFD tool and methodologies. The main design parameters are summarized in Table 1.

3.2. CFD Methods

3.2.1. Turbomachinery Flow Simulation

In this study, the commercial solver NUMECA FINE was used as the CFD tool for 3D steady single-passage flow simulations of the compressor. And then later on, the meridional entropy gradient of the compressor was extracted from steady RANS solutions simulated by the NUMECA FINE to calculate the parallel force magnitude. Finally, the experimental data and NUMECA FINE results were used to compare with results obtained by the improved body force model. In detail, the temporal and spatial discretization schemes were selected as the explicit fourth-order Runge–Kutta scheme and second-order accurate central difference scheme, respectively. Based on previous studies [15,19,20], the one equation Spalart–Allmaras (S–A) turbulence model was used. Some acceleration techniques, such as implicit residual smoothing and local time stepping methods, were employed [21]. The single-blade passage simulation was performed with periodic boundary conditions in the circumferential direction. At the inlet, the total temperature and pressure were specified along with the flow angle. The outlet of the computational domain was located at approximately two chords downstream of the rotor. At the outlet, based on the radial equilibrium, the averaged static pressure was given. Adiabatic and no-slip conditions were given on solid surfaces.
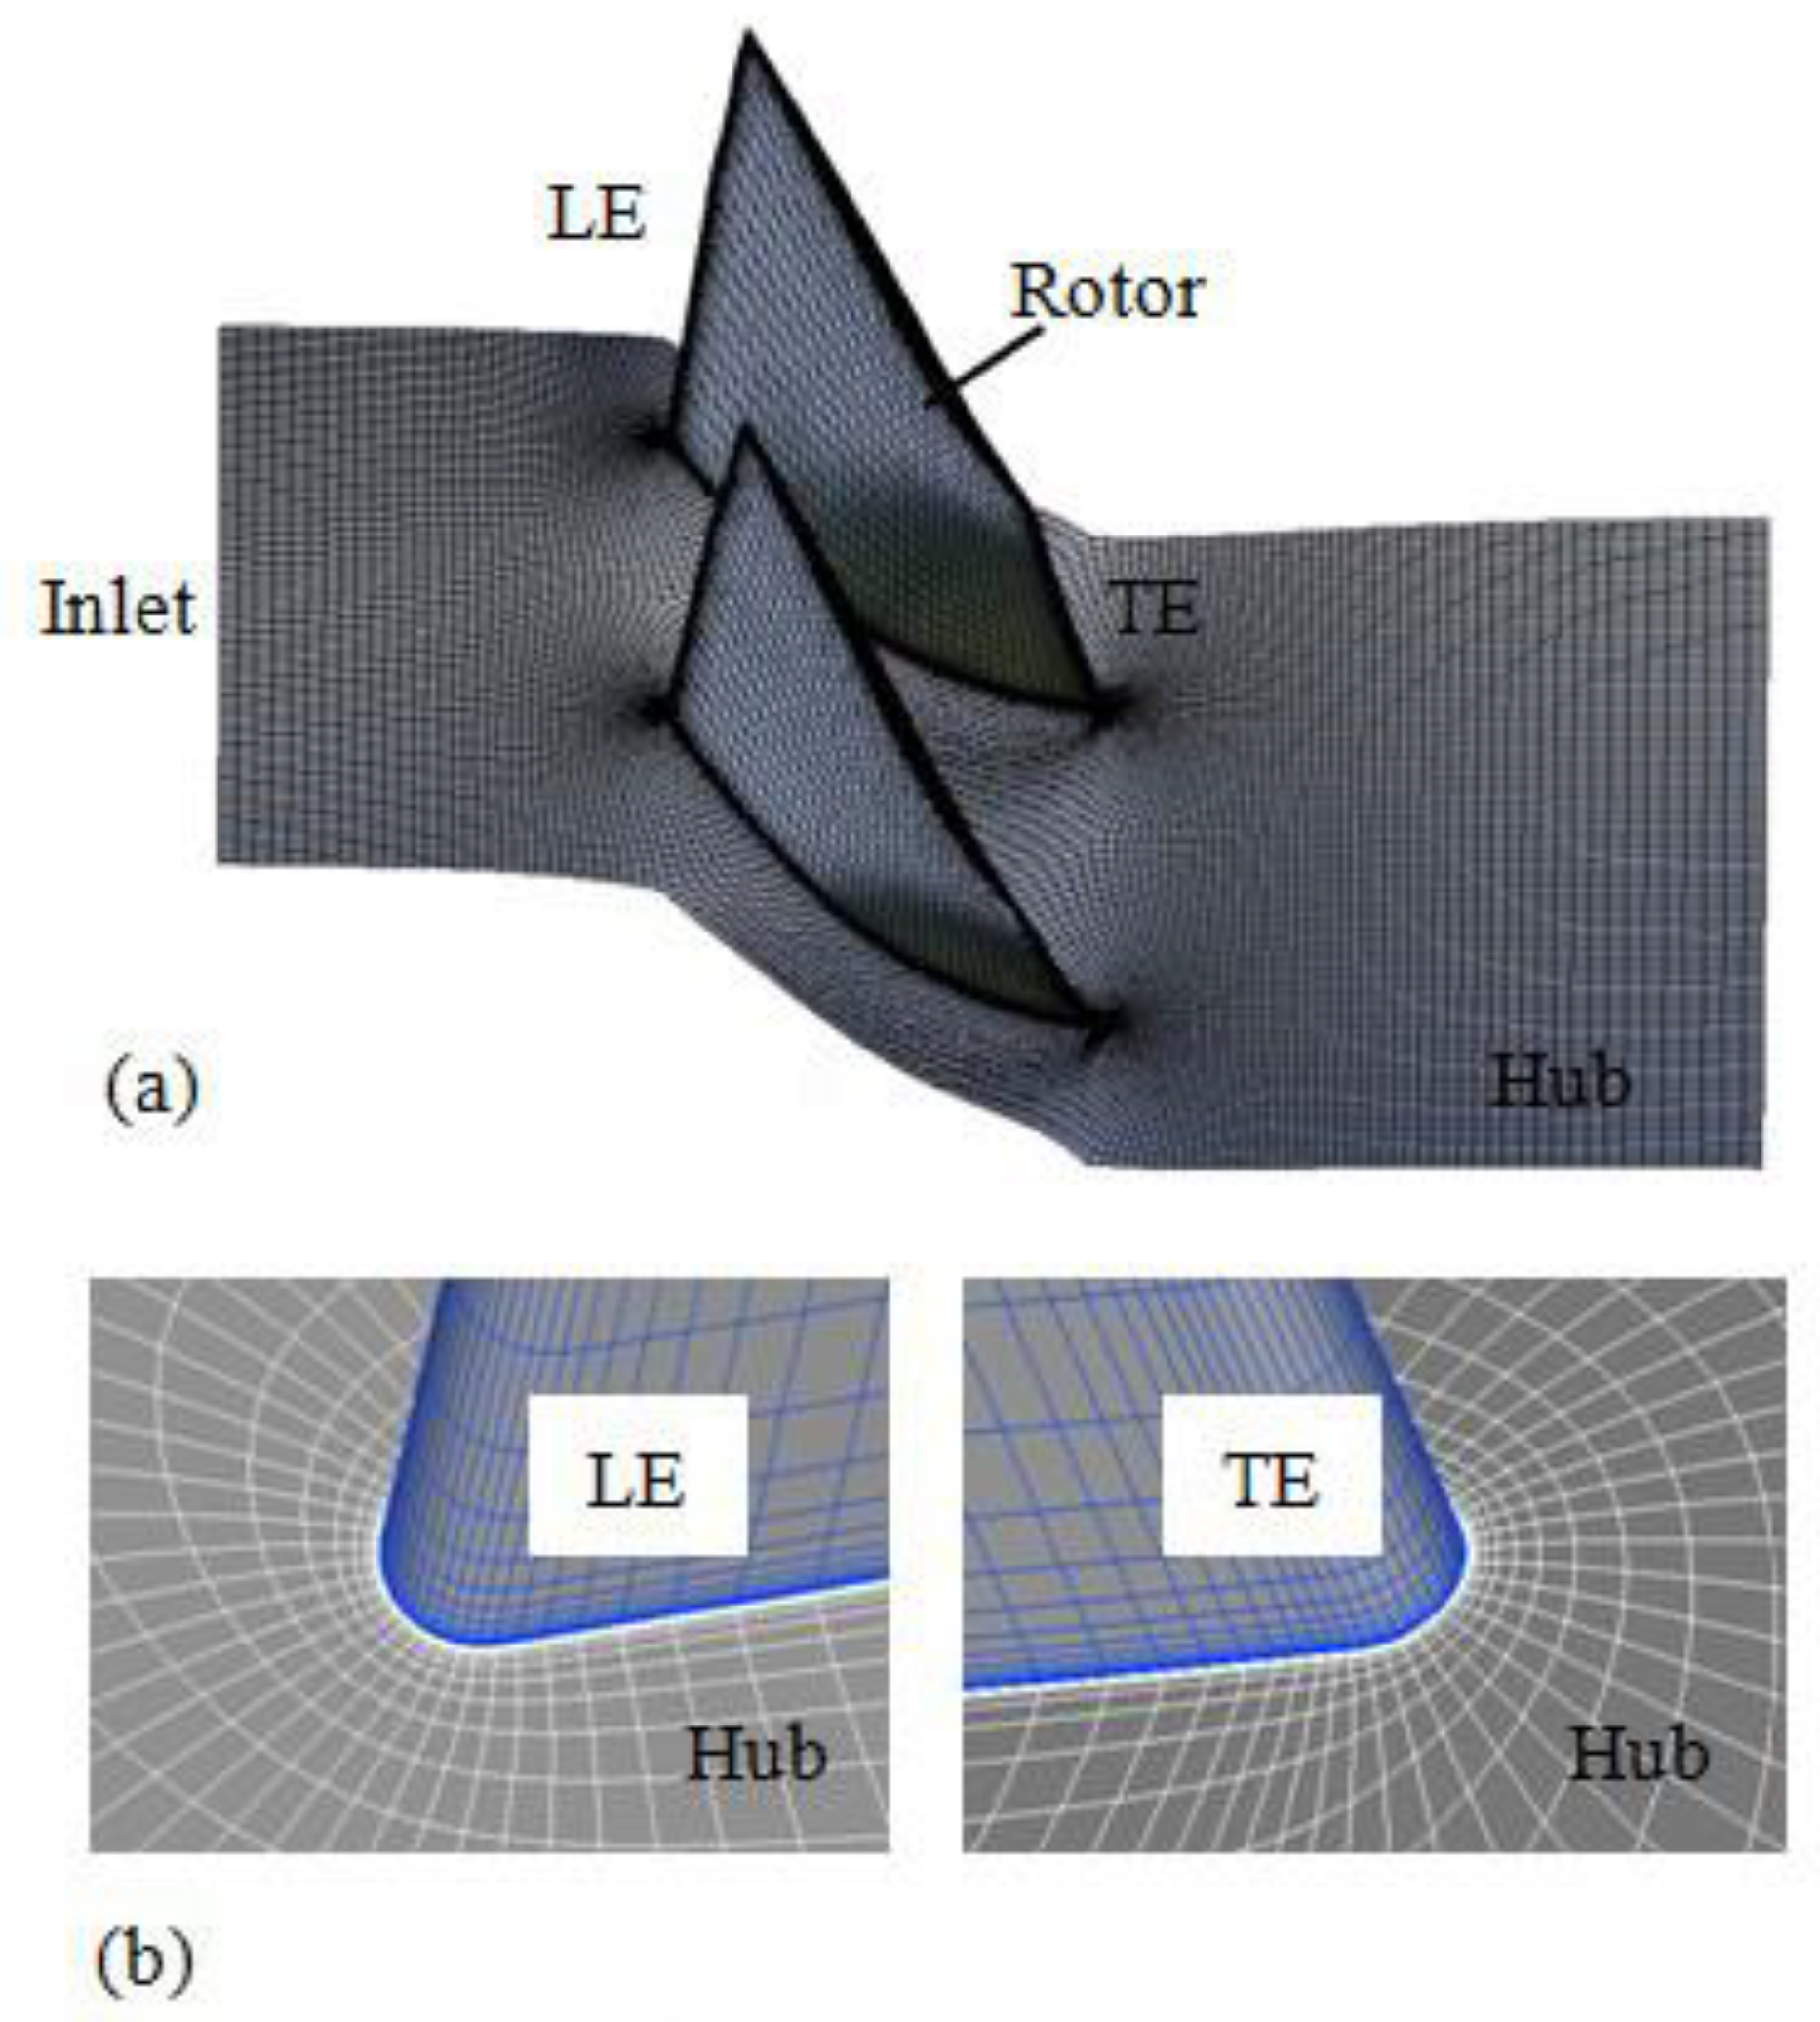
In this paper, all computations were performed using identical boundary conditions. Figure 5 shows the computational meshes for the Rotor 37. A periodic multi-block O4H-type structured grid was used in each blade channel. An O-type grid and an H-type grid were employed around the blade surface and the remaining regions, respectively. The minimum grid orthogonal angle was greater than 30°, and y+ near the wall was less than 5, as shown in Figure 6.
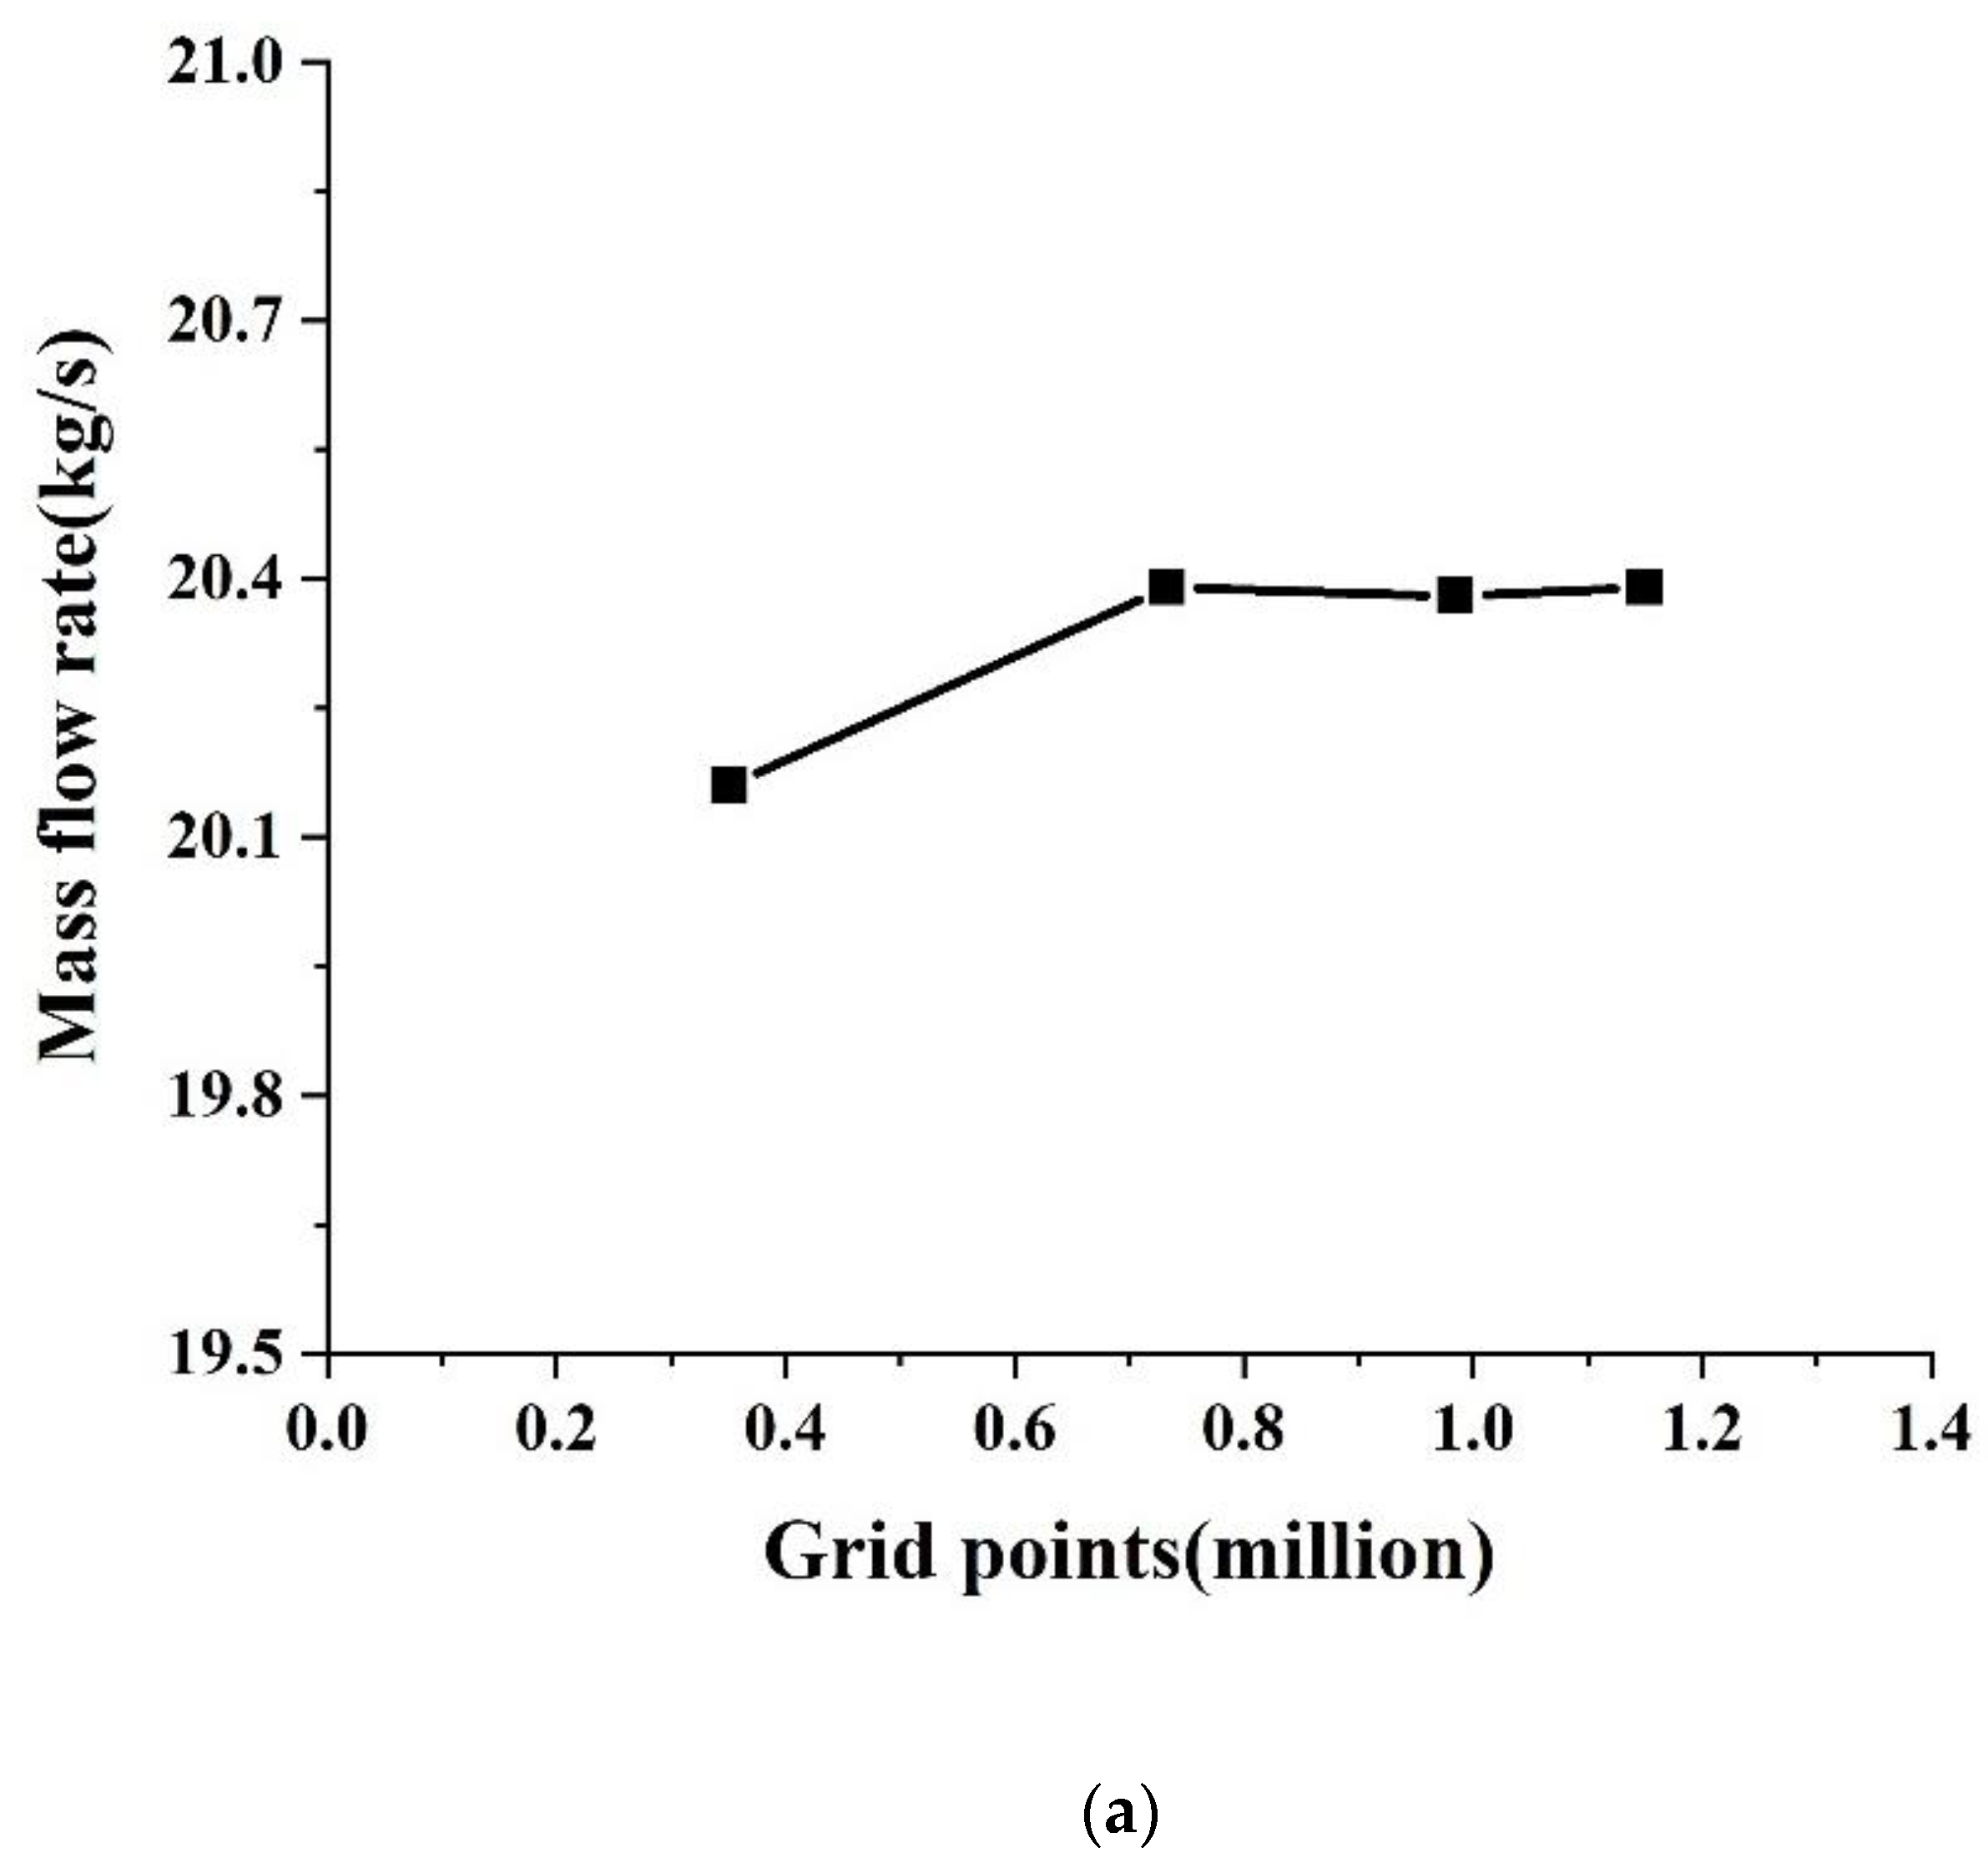
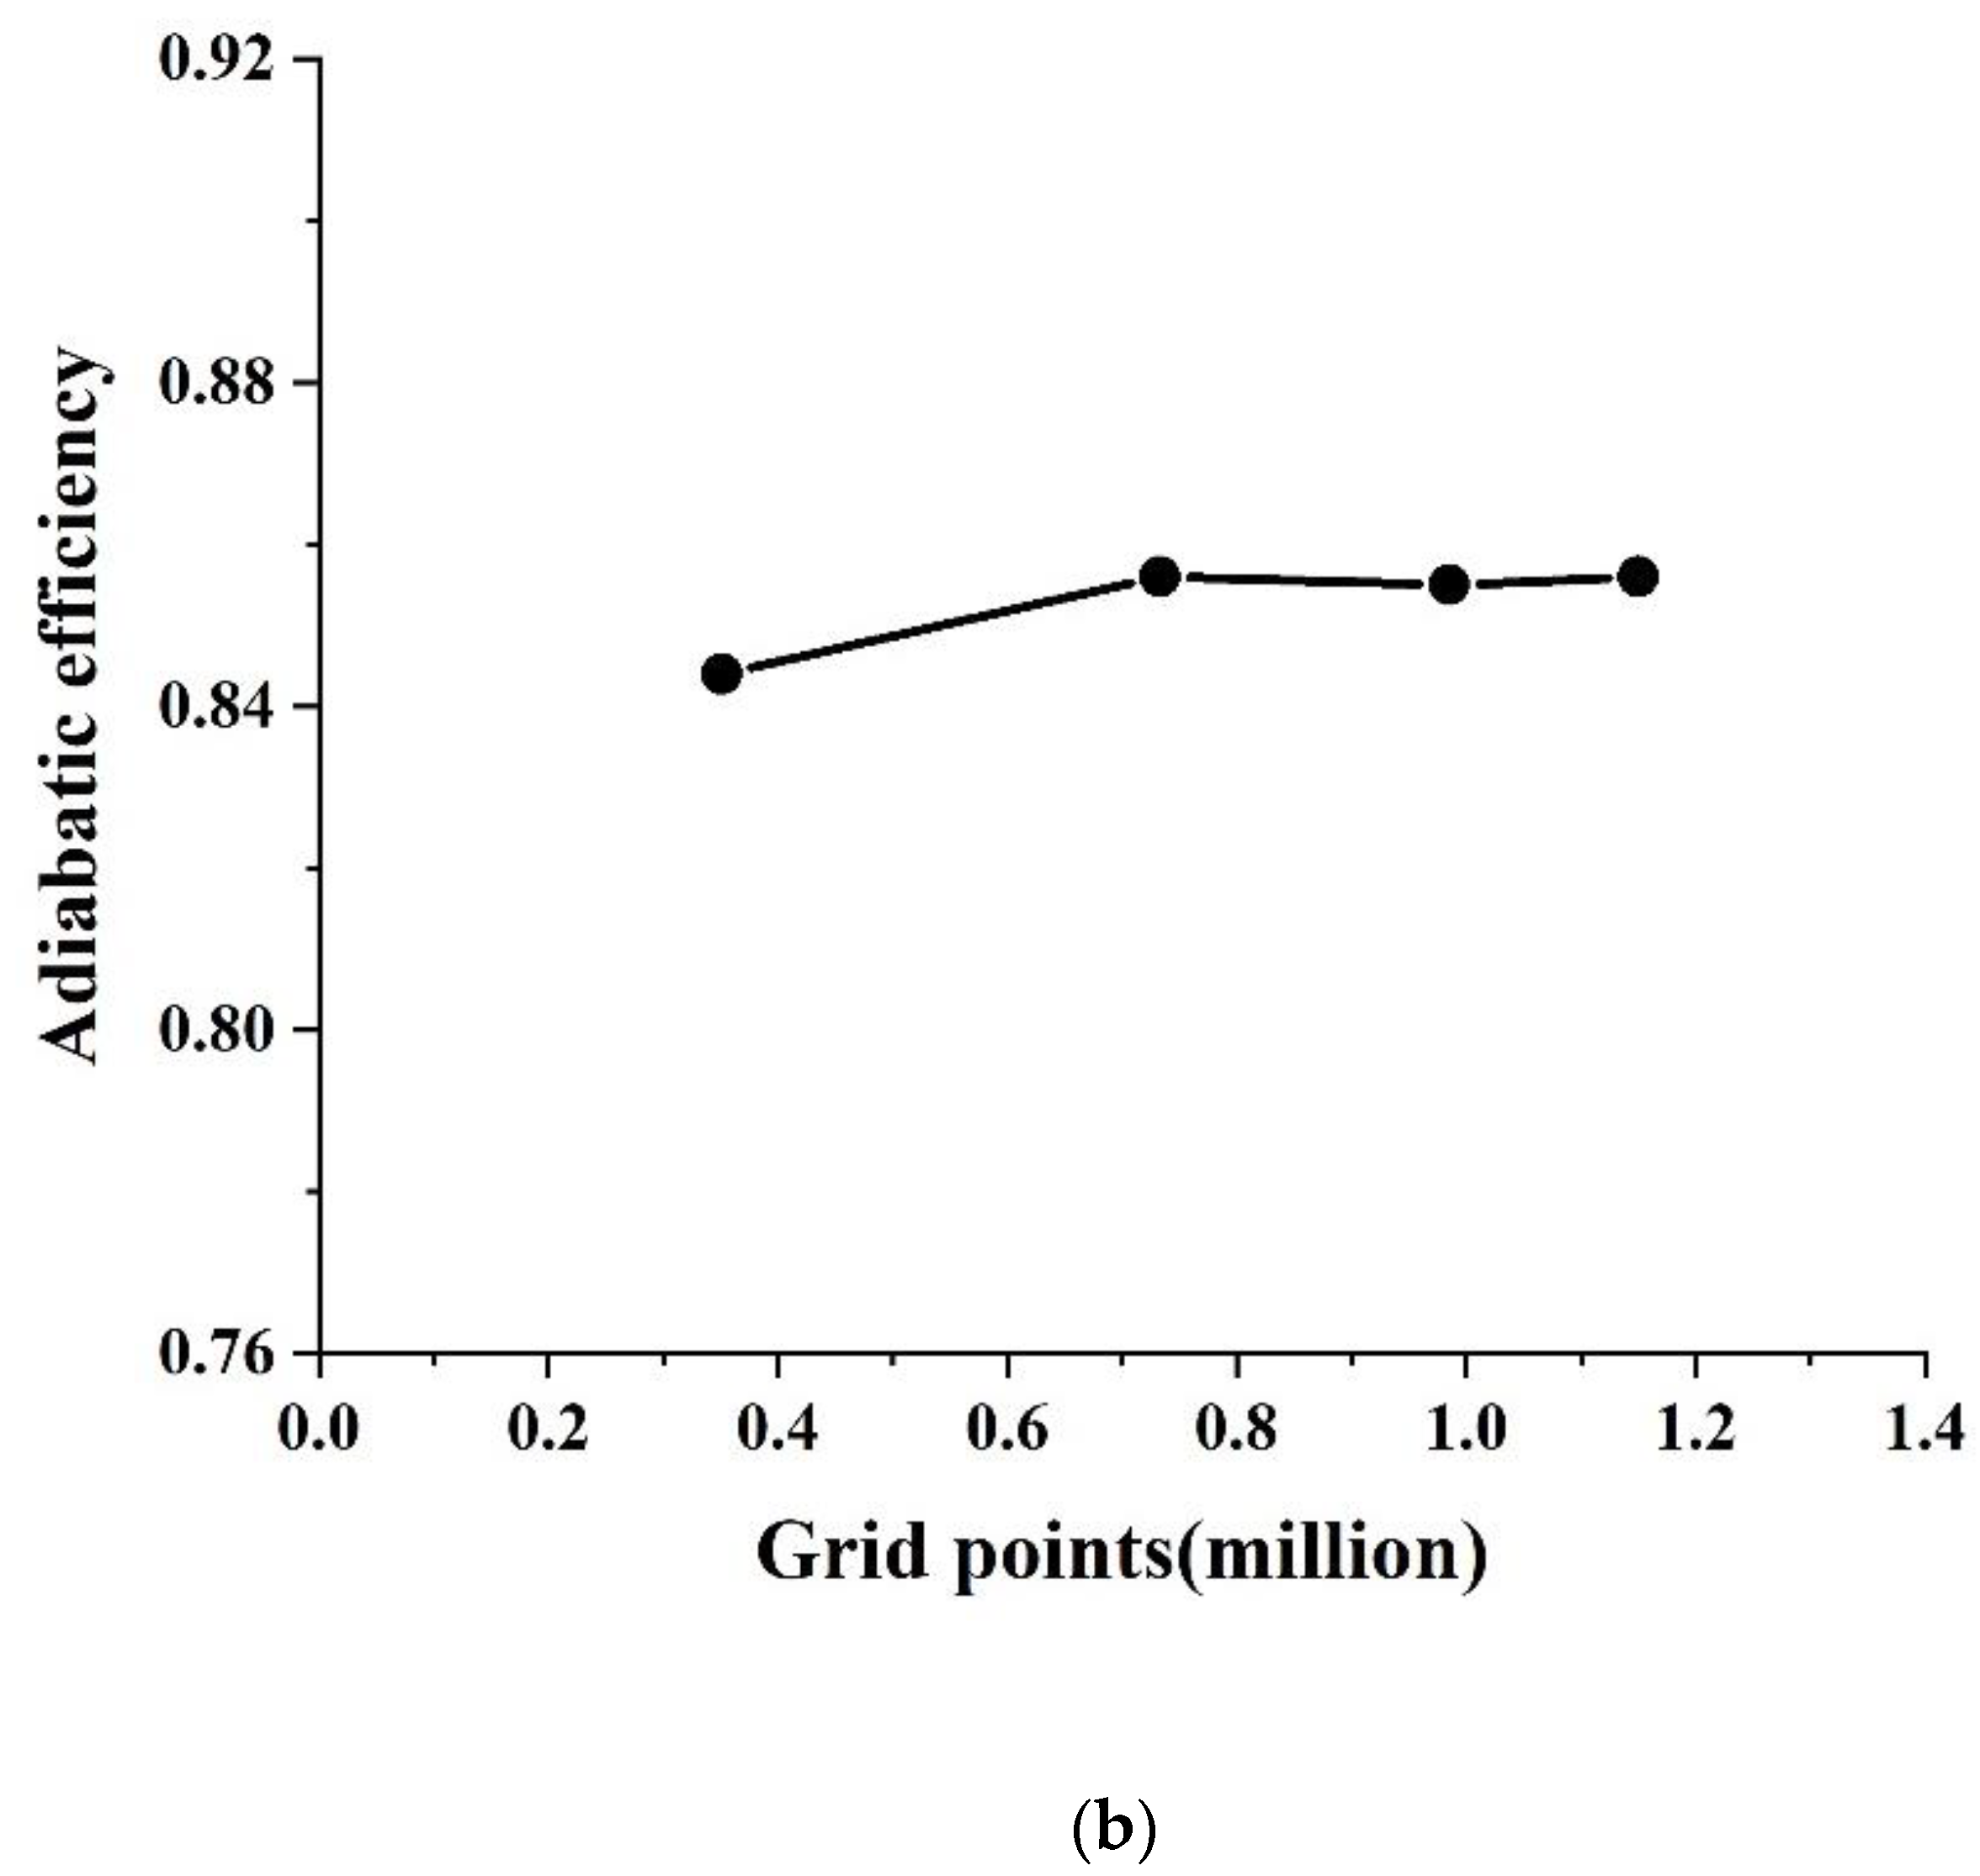
A series of computations were conducted with four different meshes to verify the solution errors related to the grid by imposing the same boundary conditions, and the MFR and adiabatic efficiency are shown in Figure 7. The figure illustrates that the adiabatic efficiency and MFR remained basically the same when the mesh number reached 734,761. So, the grid that consists of a total of 734,761 meshes was selected to achieve the mesh independence needed to provide the flow field analysis in detail.

3.2.2. HMNF Flow Simulation

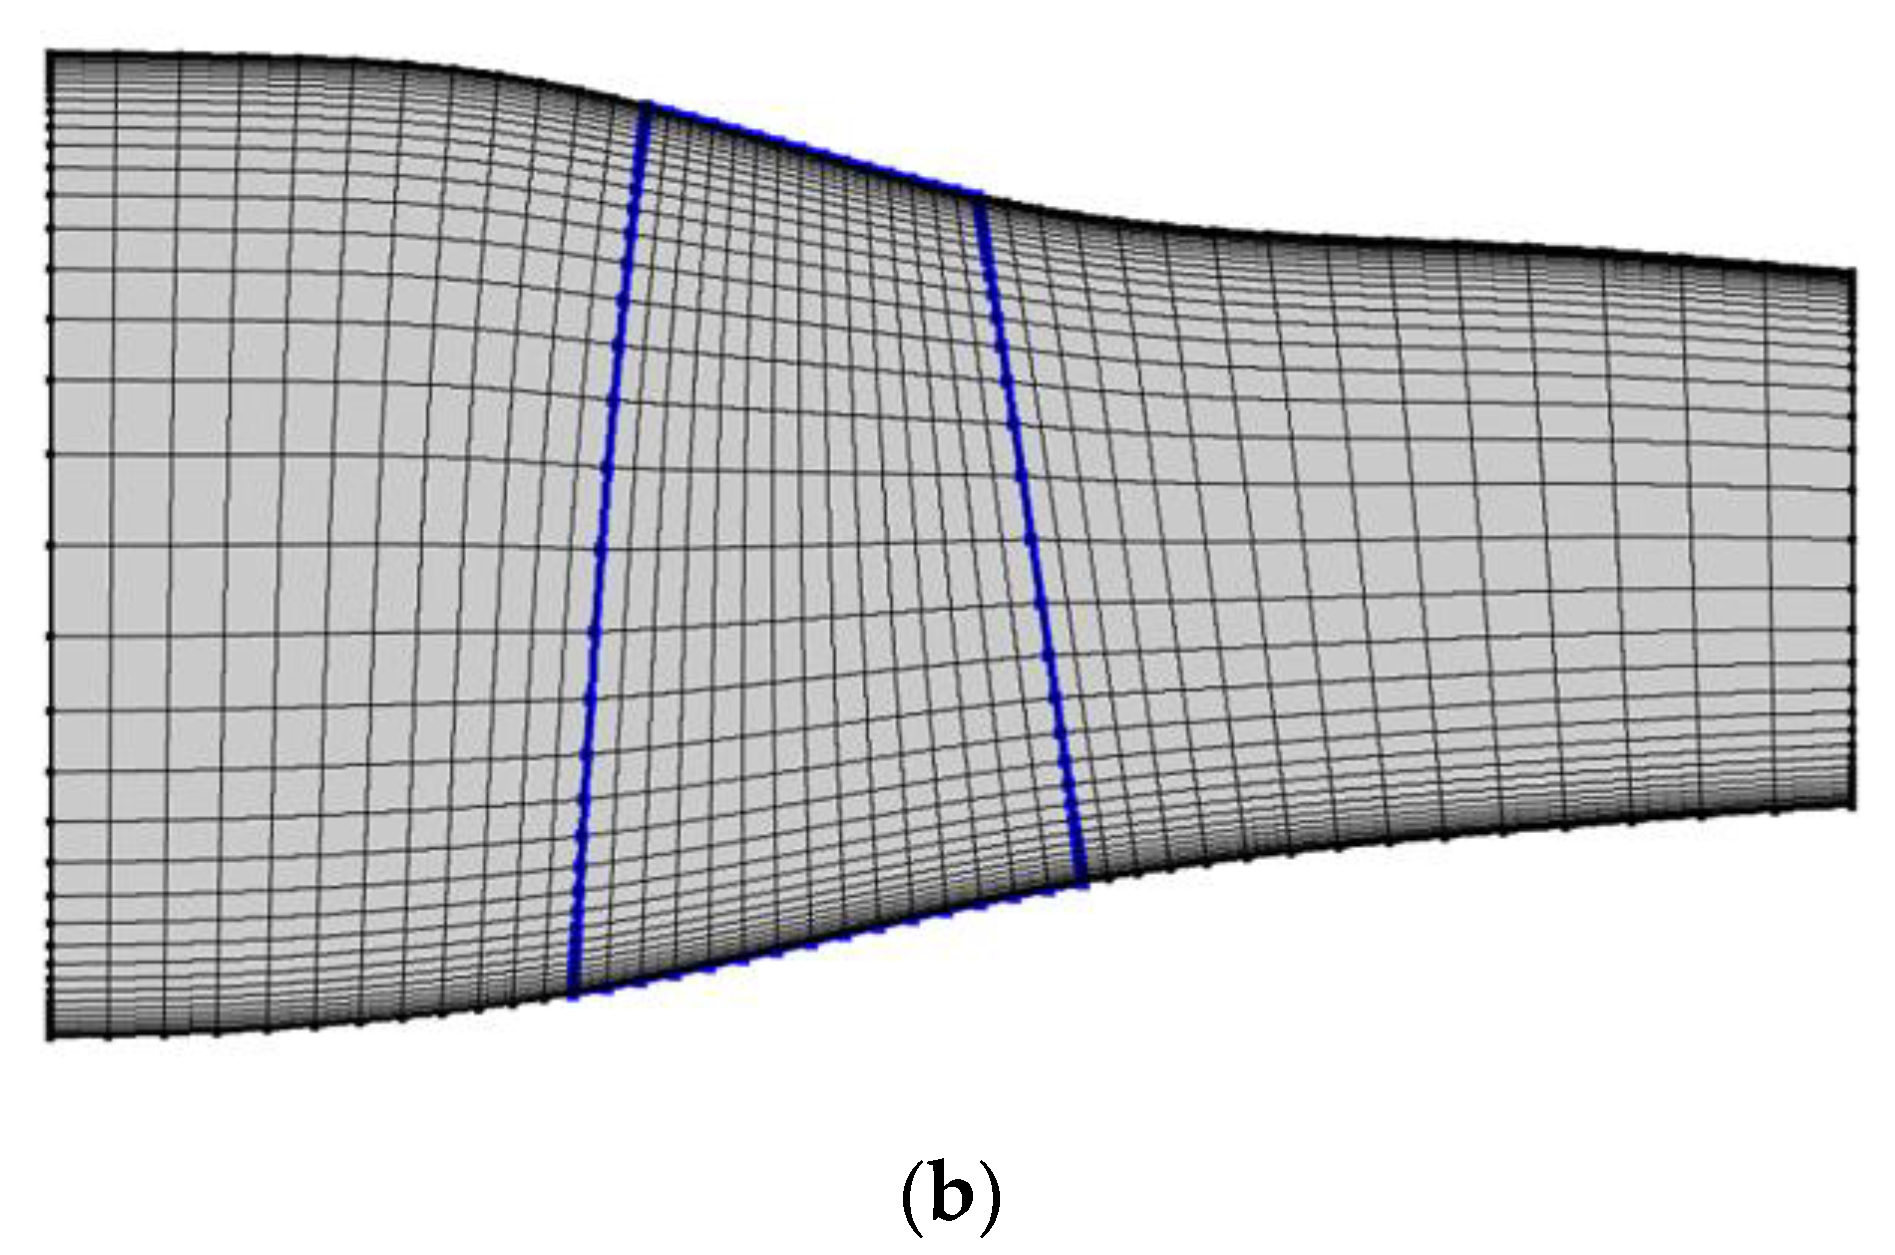
High Mach Number Flow (HMNF) as a COMSOL–CFD module was selected to add body forces into the governing equations for simulating the pressure rise, flow turning, and loss effects caused by the blade rows in this study. The finite element method was employed to discretize the RANS equations, and the one equation S–A turbulence model was used the same as the turbomachinery flow simulation. In the HMNF module, segregated solvers were used to compute the flux, in which Newton’s method was executed. For 3D numerical full-annulus simulations, the full-annulus grid of the compressor was chosen as a hexahedral structure grid, and local encryption near the wall was carried out. The boundary conditions were the same as in the NUMECA FINE simulations. The HMNF module computational mesh for the Rotor 37 is shown in Figure 8, and the rotor region is marked in blue. The grid consists of a total of 75,600 meshes and is appropriate in achieving the mesh independence needed to provide the flow field analysis in detail, as shown in Figure 9.
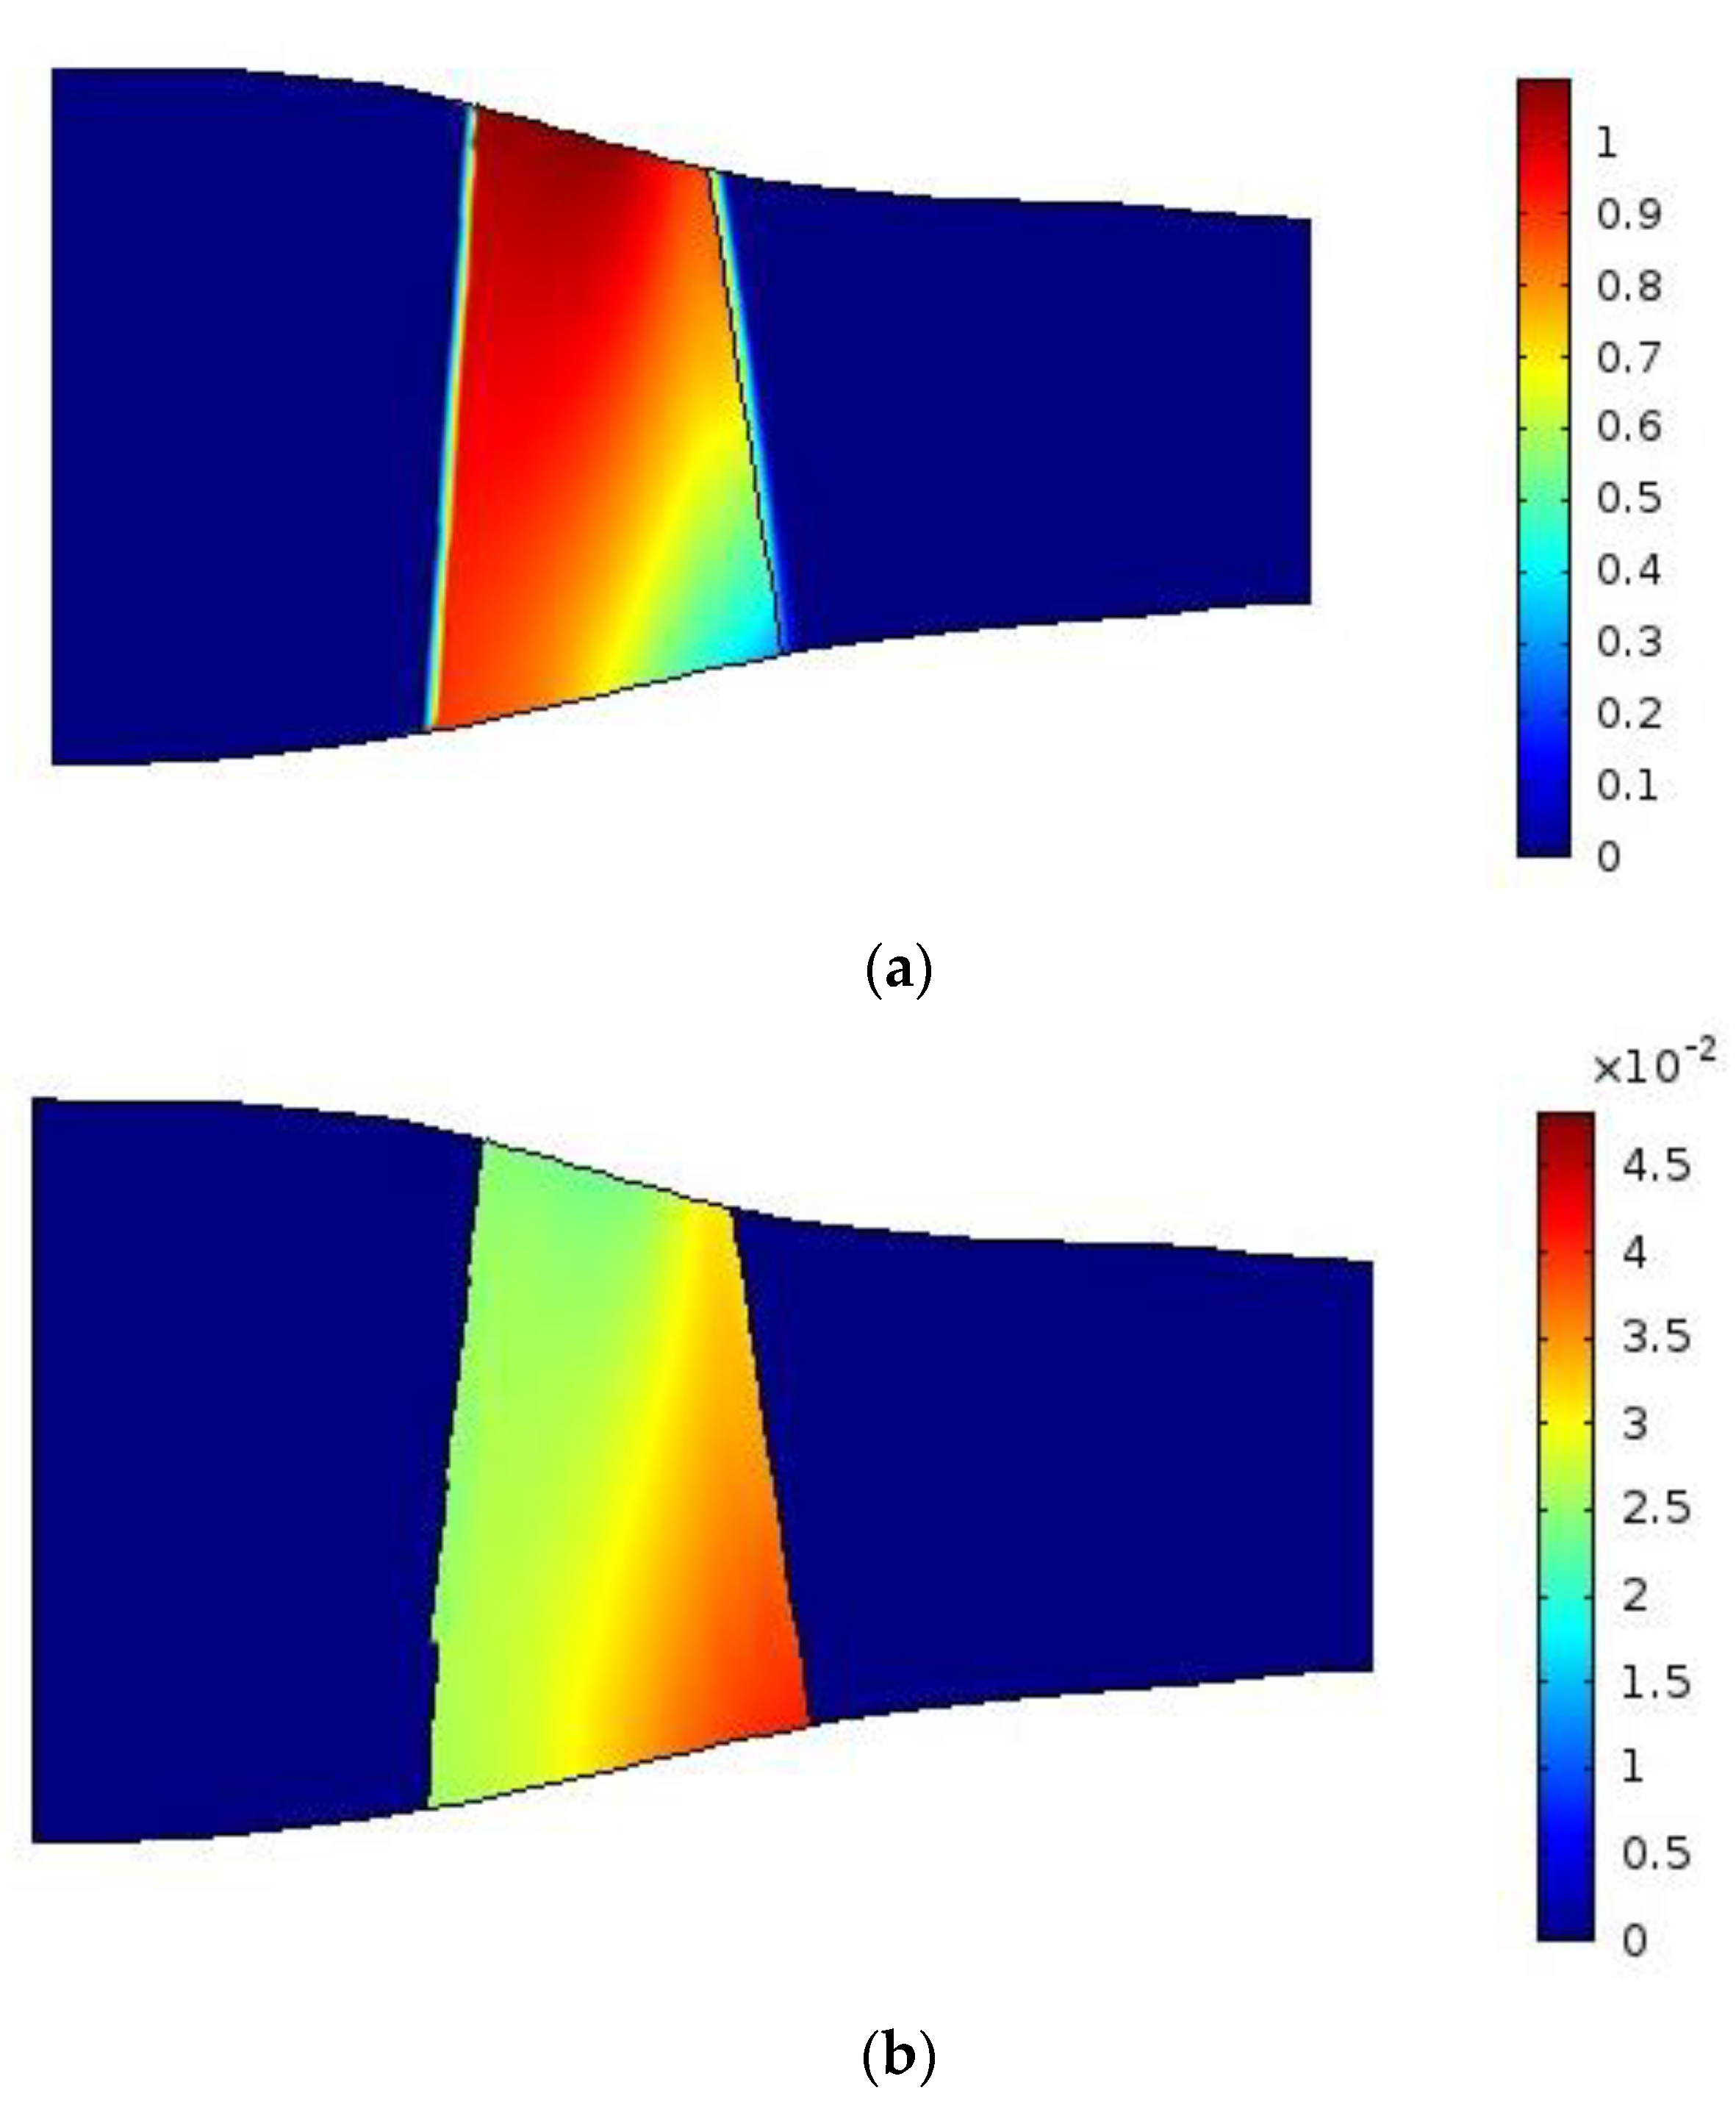
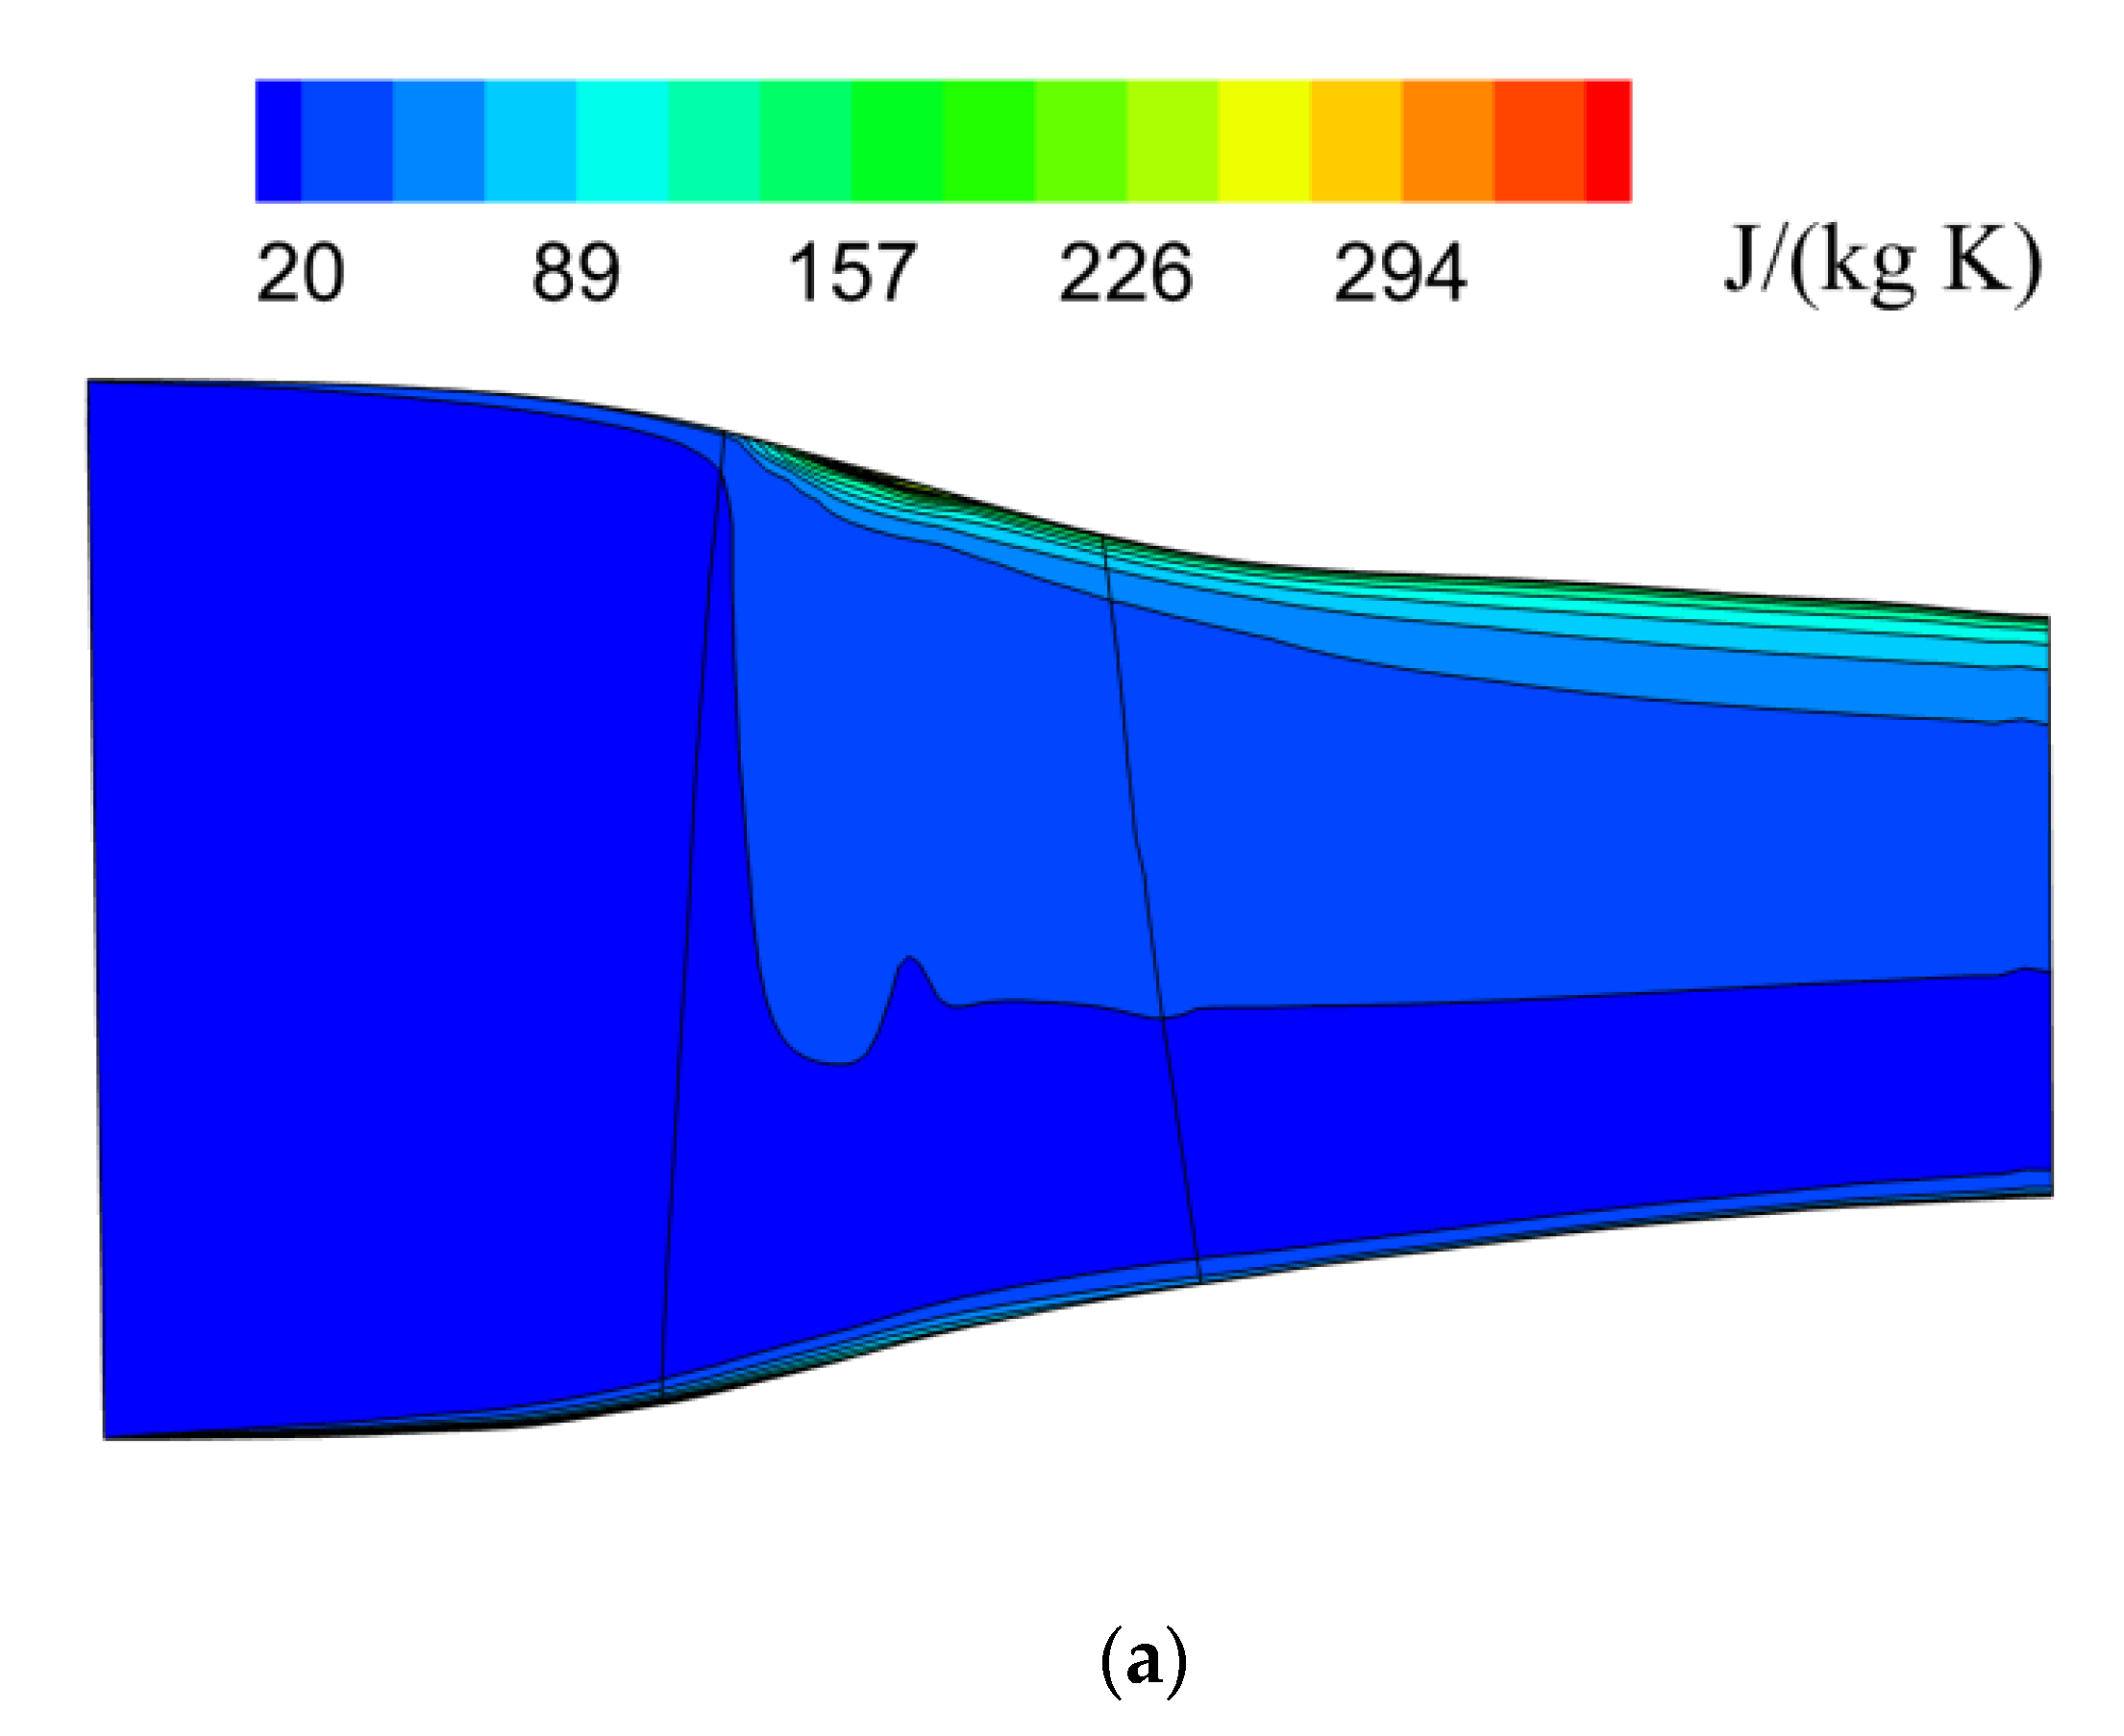
According to the above formulas, the magnitude of the body force is mainly determined by the local flow field and blade geometry parameters. Before the numerical calculations, it is necessary to discretize the blade geometry parameters into the body force domain grid points, and it mainly includes the camber angle α, the blade-to-blade gap-staggered spacing h, the blockage b, and the solidity σ as shown in Figure 10. The local gradient of the pitchwise-averaged entropy as an input term to the parallel force formula was obtained from steady RANS solutions simulated by the commercial solver NUMECA FINE in this study. Figure 11 shows the pitchwise-averaged entropy on the meridional plane for a 98% choked mass flow at 100% of the designed rotor speed. The number in Figure 11 represents the value of the isentropic curve. The values of the entropy around the hub and shroud were larger, and the loss, which degraded the compressor performance, was also larger. Because the body forces were added into the governing equations as source terms, the improved body force formula was defined at grid points of the body force domain. However, the body force model grid is different from the pitchwise-averaged NUMECA FINE grid. The COMSOL software could easily and accurately translate the body force formula inputs extracted from solutions solved by the NUMECA FINE to grid points of the body force domain. Then, the values of the entropy gradient along the axial and radial directions at those grid points could be determined.

4. Model Validation

The flow field performances of the Rotor 37 were simulated using the NUMECA FINE, and they improved the body force model. The simulated results were analyzed to further validate the accuracy of the improved body force model.
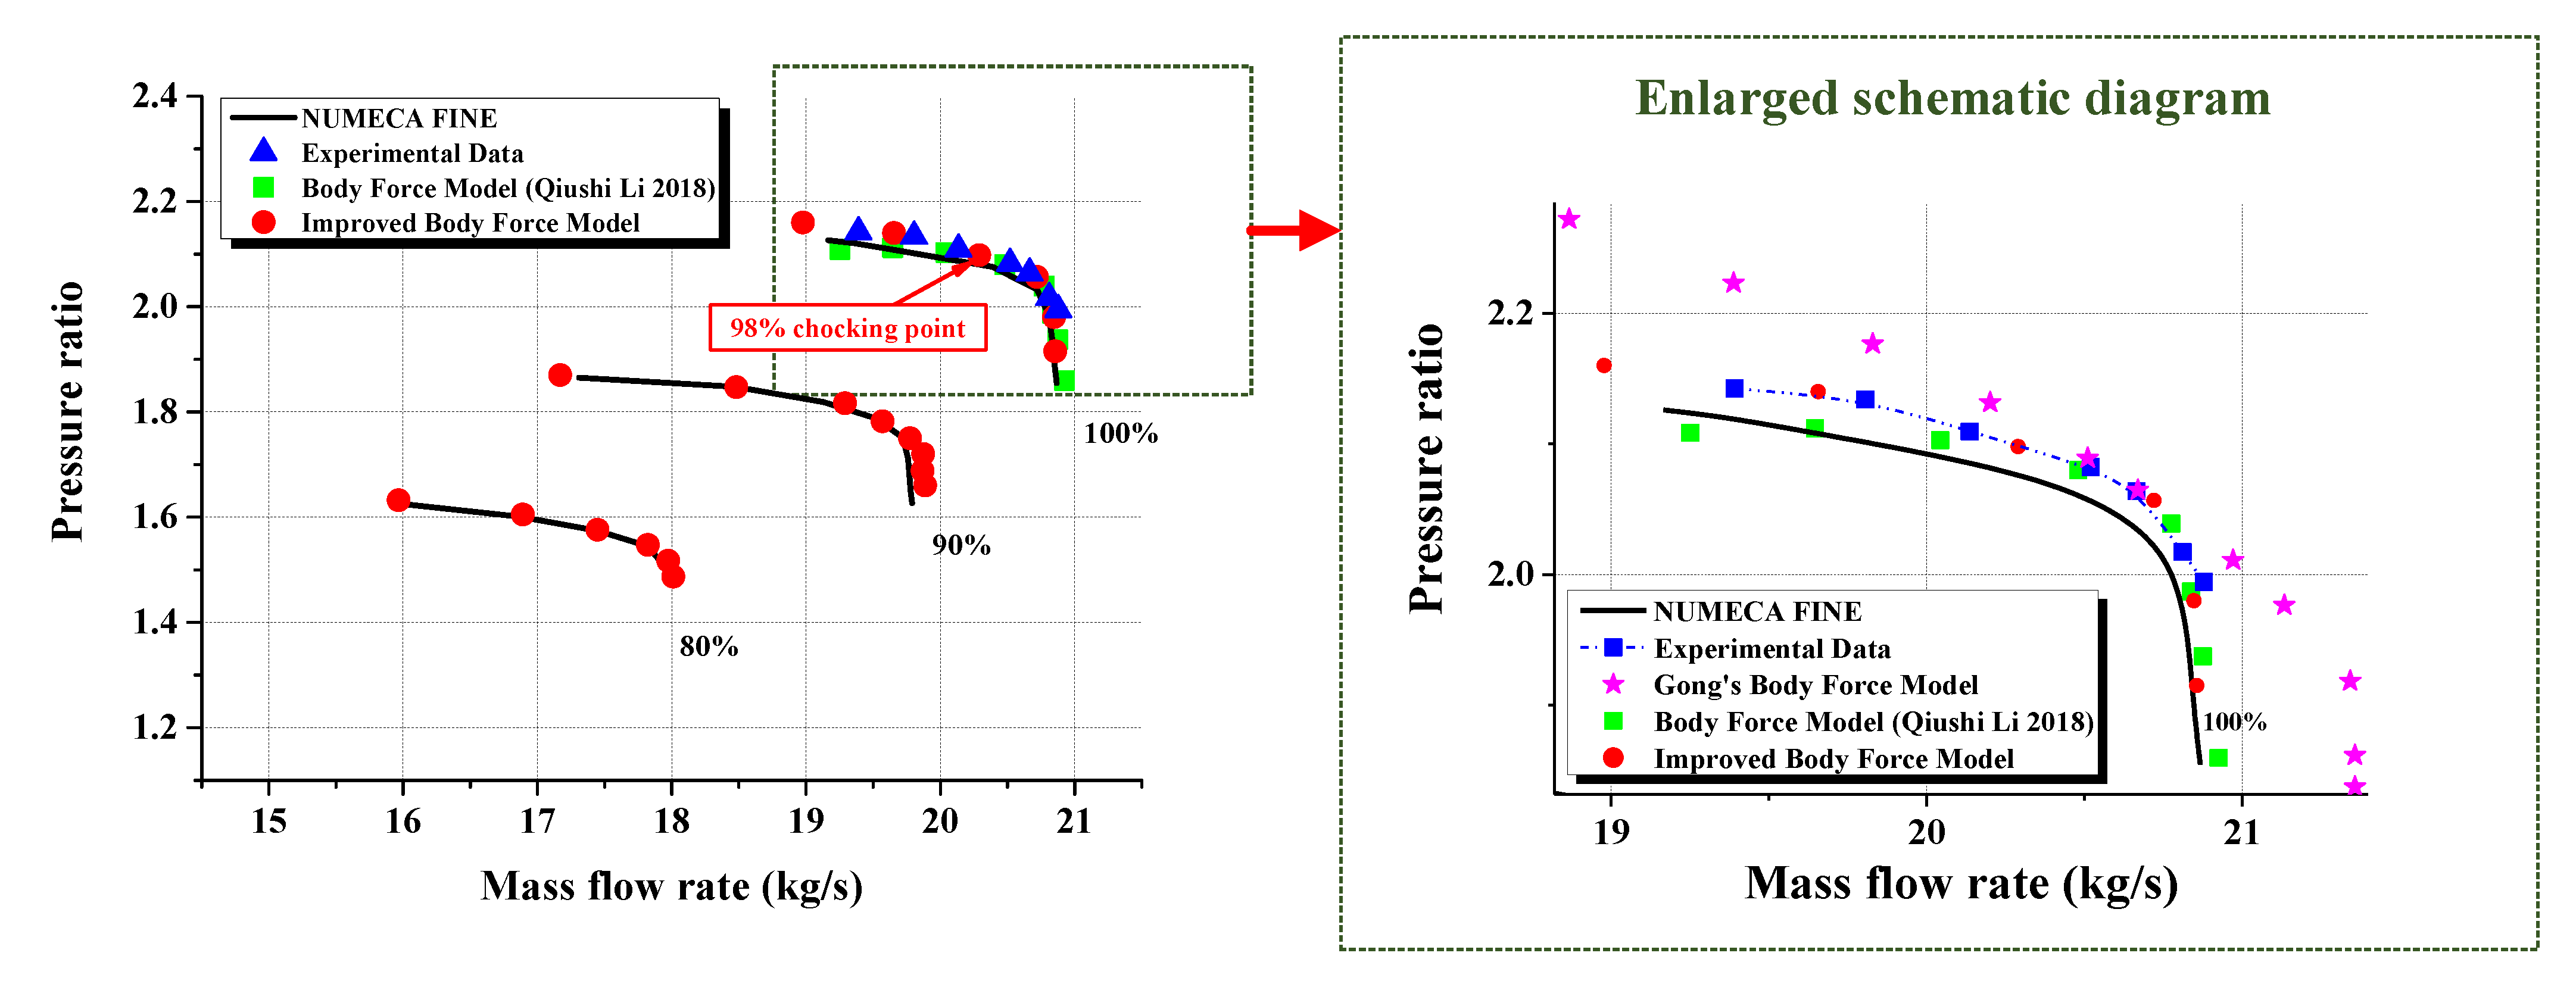
Figure 12 illustrates a comparison of the Rotor 37 pressure ratio versus the MFR at 80%, 90%, and 100% of the designed rotor speed. It was shown that NUMECA FINE and the improved body force model results agreed very well with the experimental data obtained from the AGARD Advisory Report 355 entitled CFD Validation for Propulsion System Components. The experimental values were slightly higher than the simulation results. The maximum error was 1.2%. At other speeds, the simulation that used the improved body force model generally agreed well with the NUMECA results. The maximum error was 1.9%, which was still within the acceptable error range. Compared with Li’s model [15], the results using the improved body force model were better at lower MFR points. Therefore, the improved body force model could capture the flow field through a turbomachinery blade row well within a proper accuracy range.
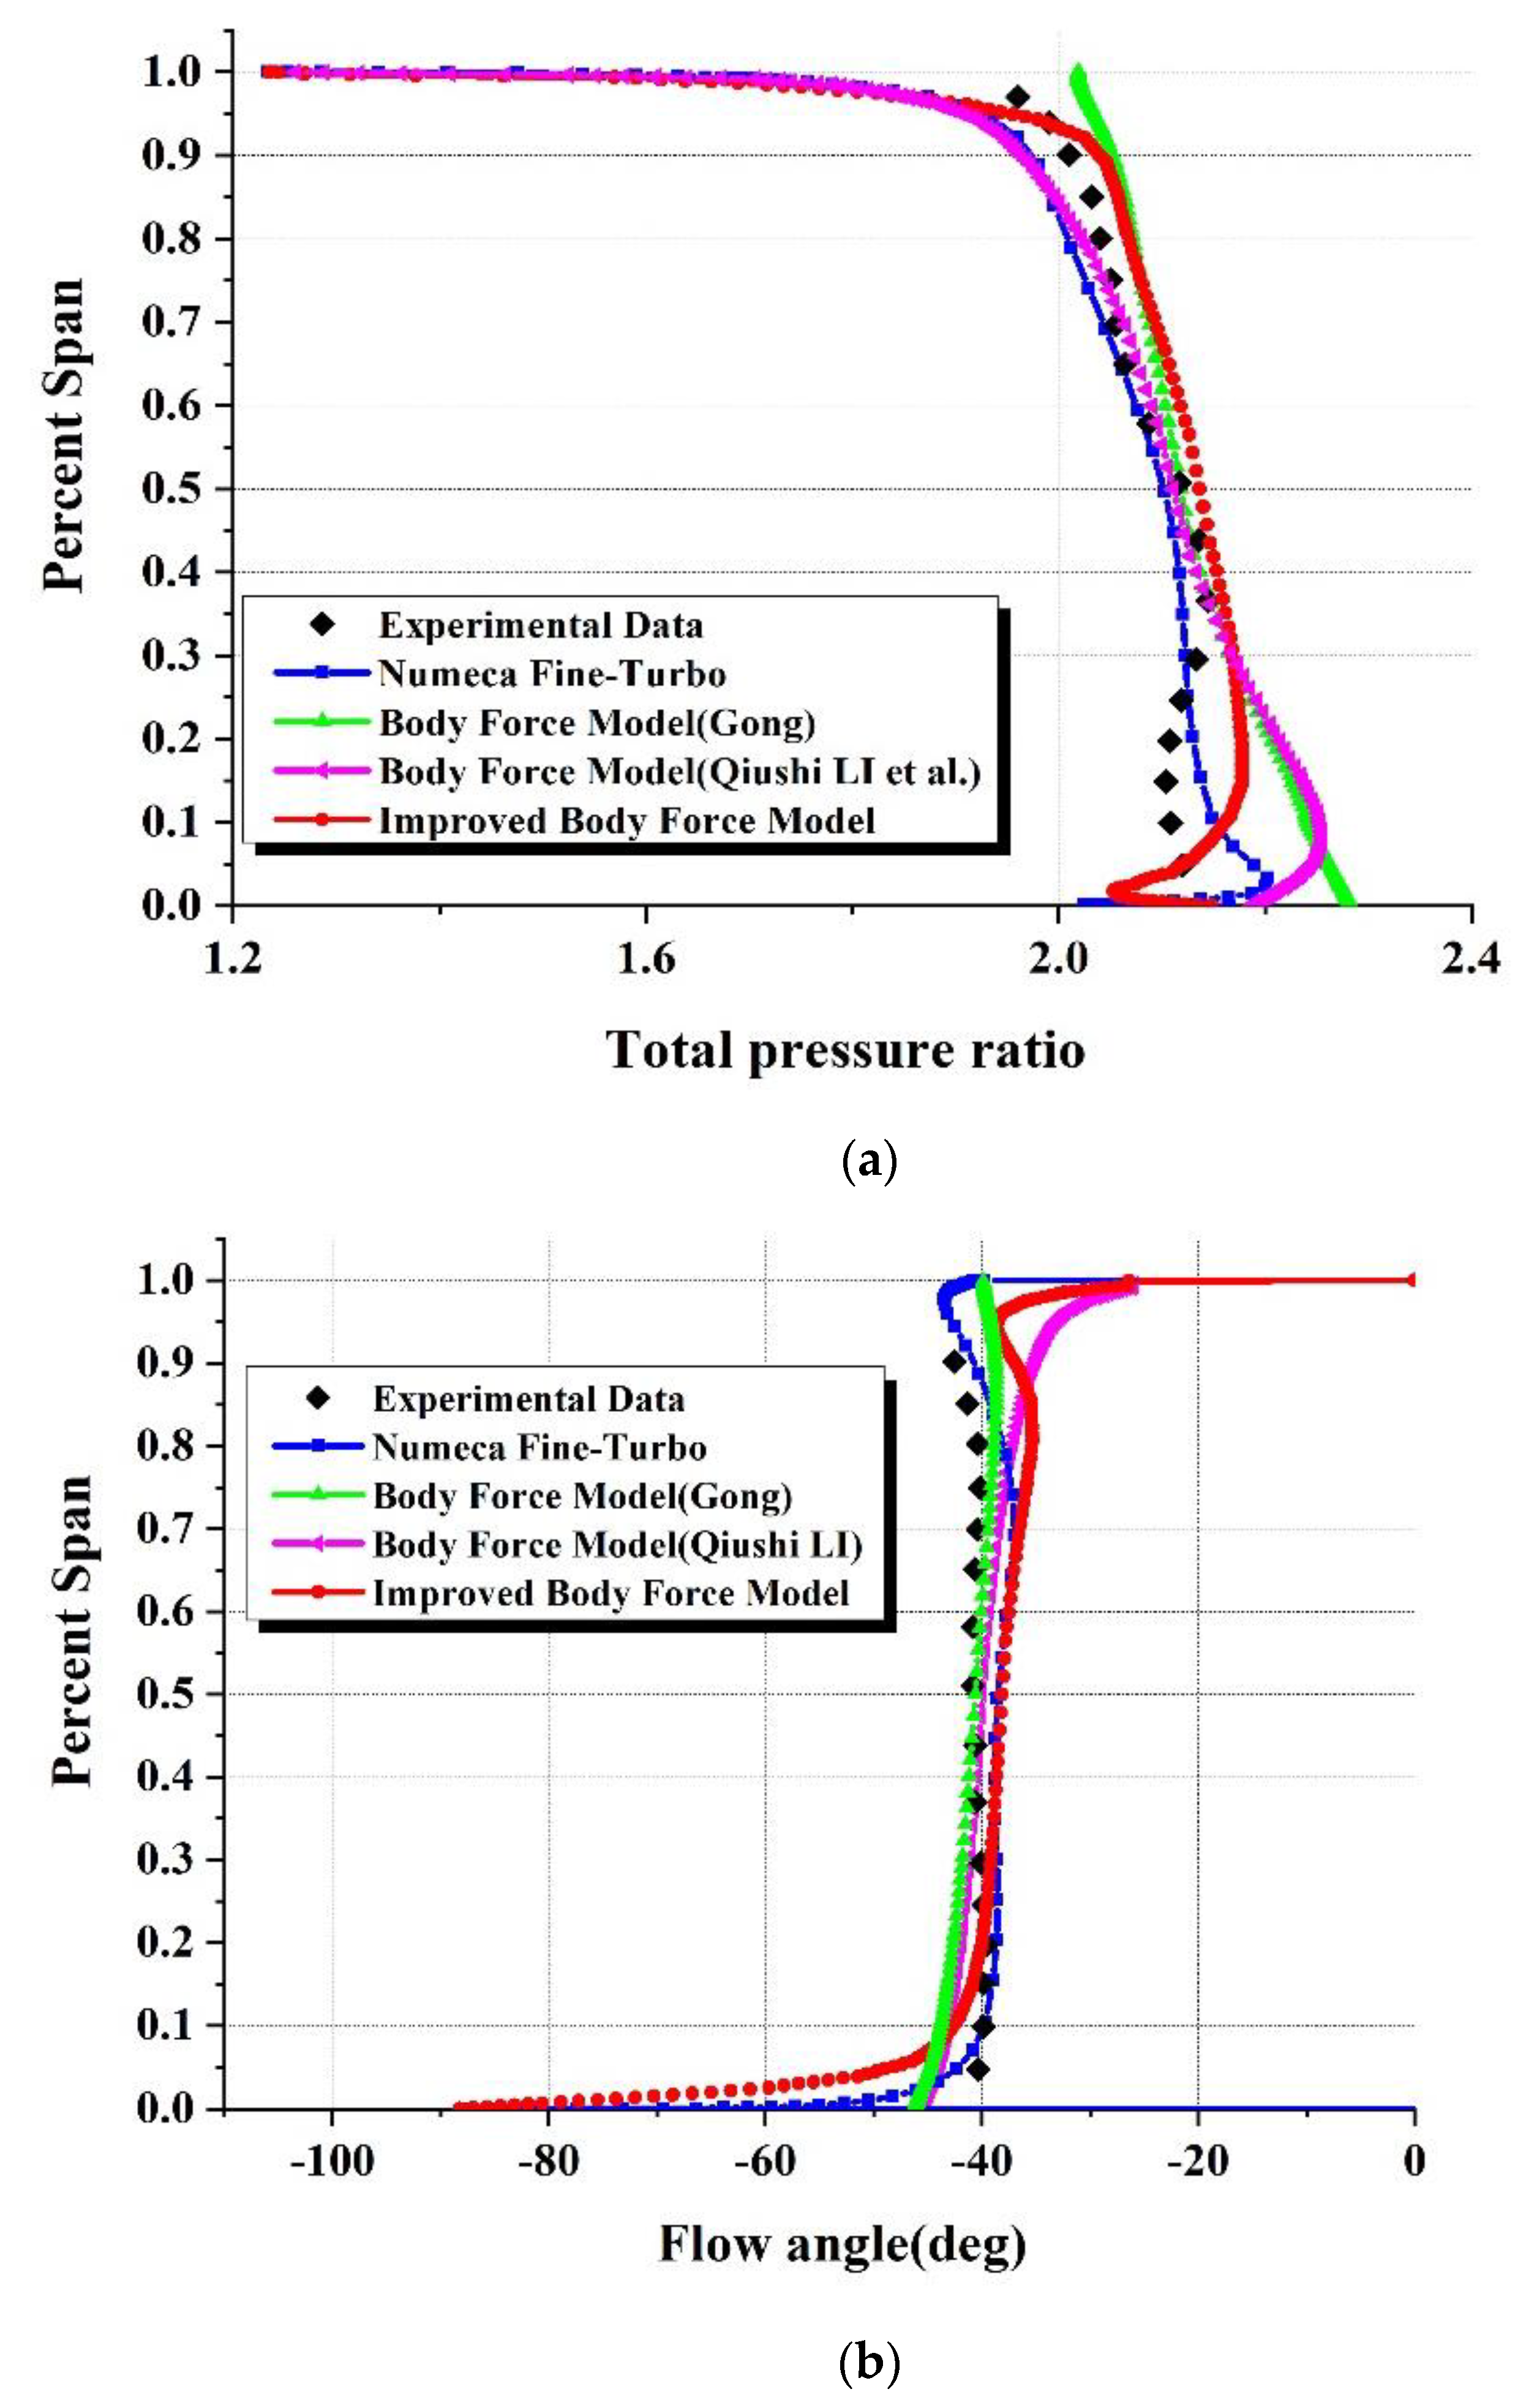
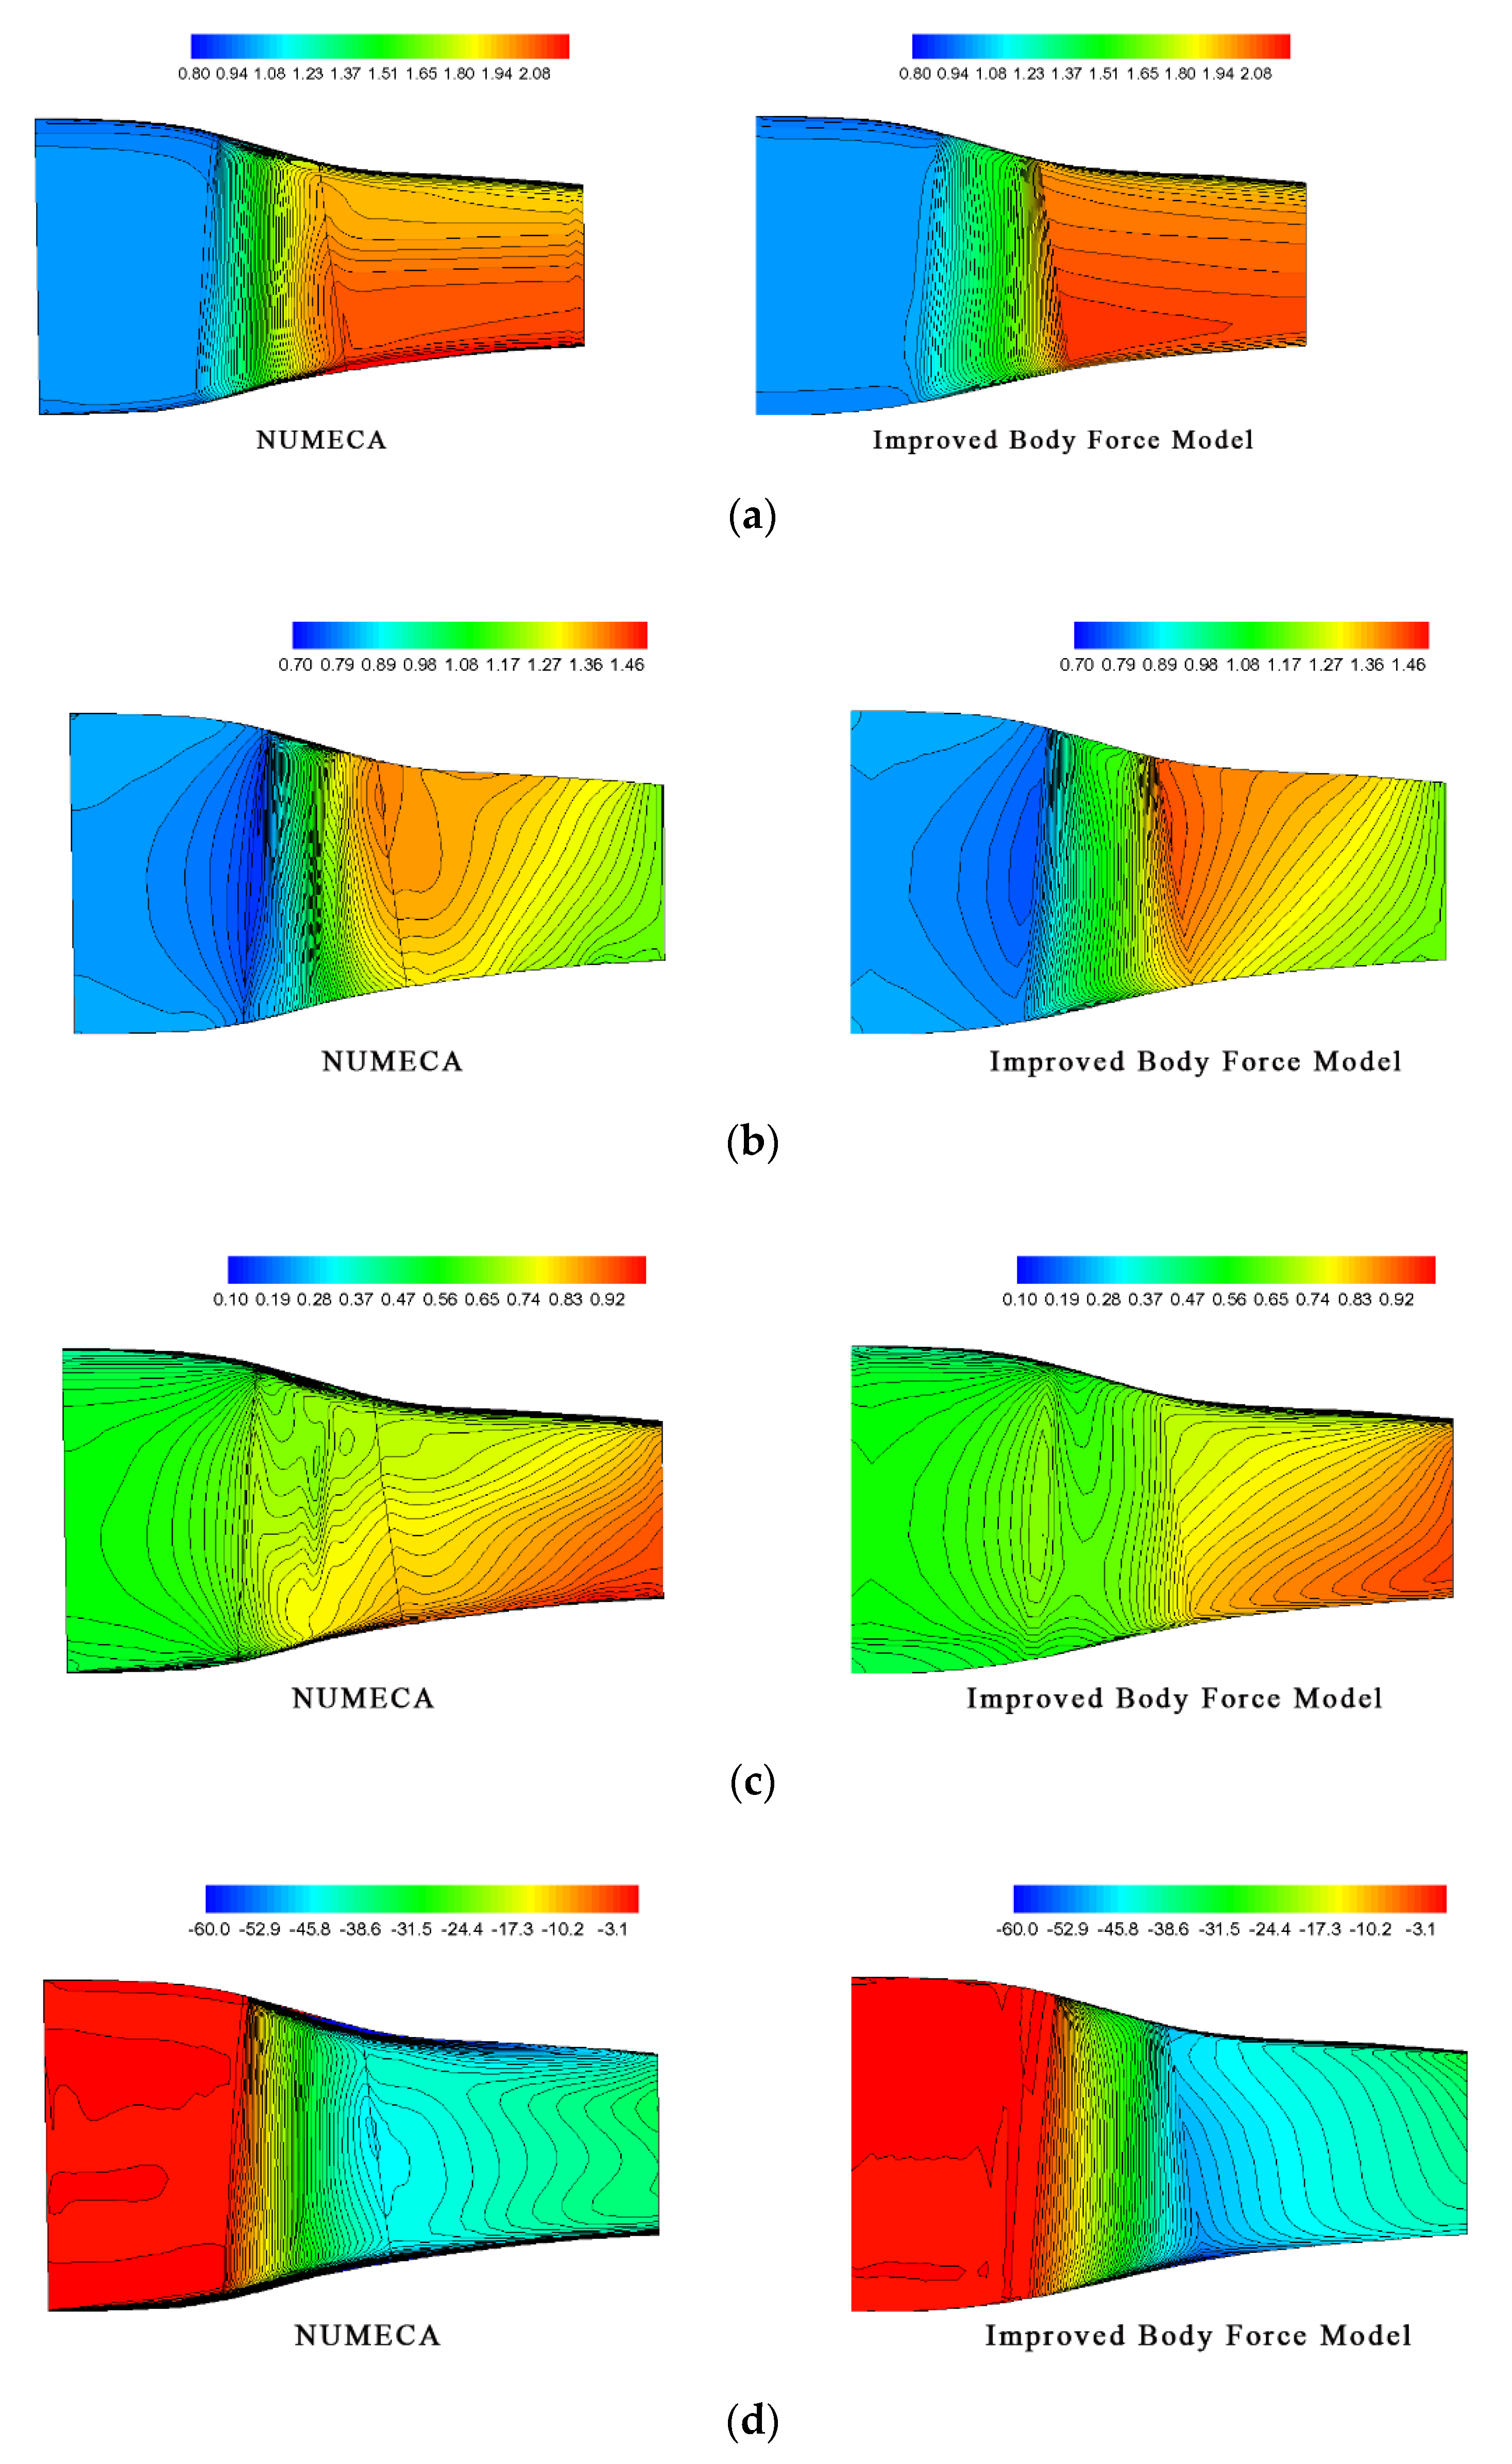
Figure 13 presents the pitch-averaged total temperature ratio, total pressure ratio, Mach number, and swirl angle at the outlet along the spanwise direction for a 98% choked mass flow (Figure 12) for the experimental data, NUMECA FINE, and body force models. Compared with the Gong and Li models, the distributions of the performance parameters around the hub and shroud obtained using the improved body force model were better and agreed well with the experimental data. The errors about the NUMECA FINE and improved body force model in the comparisons with the experimental data in Figure 13a–c are listed in Table 2. Figure 14 presents the Mach number contours, pressure contours, total pressure contours, and swirl angle contours on the meridional plane for a 98% choked mass flow. The comparison between the NUMECA FINE and the improved body force model indicated that the results’ overall distribution trends were basically the same. In the rotor region illustrated in Figure 14, it could be approximated that the pressure and total pressure increased linearly along the streamwise direction. The inlet airflow was also deflected through the blade passage, with the flow angle increasing almost linearly.
It should be noted that based on the COMSOL software, this model could be further optimized in future work. It could be assumed that the local entropy gradients ∂s/∂x and ∂s/∂r are functions of the local parameter ρVx, where Vx and ρ are the local axial velocity and density, respectively. The values of the local entropy gradients ∂s/∂x, ∂s/∂r and the local parameter ρVx were extracted from the 3D steady single-passage RANS solutions. In that case, the flow field of aircraft/engine integration under clean and distorted inflows can be simulated easily using this model.

5. Conclusions

Body forces substituted into the RANS equations as the source terms instead of the actual blade rows solved using the COMSOL–CFD code were improved to better predict the compressor performance. The flow field performances of Rotor 37, including the pressure rise, flow turning, and loss effects caused by the blade rows were simulated by the improved body force model. Compared with the experimental data, NUMECA FINE, Gong’s model, and Li’s model the following conclusions can be drawn:
  • Based on the COMSOL software, the improved body force model could directly simulate the viscous flow close to the blade passage walls and the momentum exchange between fluids. The improved parallel force formula is modified using Marble’s results, indicating that the magnitude of the parallel force is proportional to the entropy gradient along the meridional streamline extracted from 3D steady single-passage RANS solutions. Therefore, the modeling process of the body force is easier and more physical.
  • The improved normal force formula no longer contains the term g(local), which makes the simulation processes more efficient. Compared with those of NUMECA FINE, the total number of grid points for the HMNF module is less at least an order of magnitude, and it takes less time to compute them. The simulation results for the Rotor 37 indicate that the improved body force model could capture the flow field through a turbomachinery blade row well within a proper accuracy range. When 3D, full-annulus, unsteady, multi-row calculations through the compressor or integrated calculations of the aircraft and engine were performed, the improved body forces could be substituted into the RANS equations as the source terms instead of the actual blade rows, and it could greatly reduce the total number of grid points and save significant computer resources, including CPU time and memory.
  • Because body forces are added into the governing equations as source terms, the improved body force formula was defined at grid points of the body force domain. The COMSOL software could easily and accurately translate the body force formula inputs extracted from solutions solved by the NUMECA FINE-Turbo EURANUS to grid points of the body force domain. The COMSOL software environment can easily facilitate all steps in the modeling, part definition, meshing, simulation, and data post processing processes.

Author Contributions

Conceptualization, Y.L.; validation, Y.L. and J.H.; investigation, Y.L., J.H. and A.X.; writing—original draft preparation, Y.L., S.Z. and W.T.; writing—review and editing, X.H. and Y.S.; supervision, H.X. All authors have read and agreed to the published version of the manuscript.

Funding

This research was funded by the Natural Science Foundation of Hunan Province, China (No. 2021JJ40741) and the National Science and Technology Major Project (No. J2019-V-0017-0012 and No. J2019-IV-0017-0085).

Institutional Review Board Statement

Not applicable.

Informed Consent Statement

Not applicable.

Data Availability Statement

Not applicable.

Conflicts of Interest

The authors declare no conflict of interest.

References

  1. Ricci, M.; Mosele, S.G.; Benvenuto, M.; Astrua, P.; Pacciani, R.; Marconcini, M. Retrofittable Solutions Capability for Gas Turbine Compressors. Int. J. Turbomach. Propuls. Power 2022, 7, 3. [Google Scholar] [CrossRef]
  2. Burberi, C.; Michelassi, V.; del Greco, A.S.; Lorusso, S.; Tapinassi, L.; Marconcini, M.; Pacciani, R. Validation of steady and unsteady CFD strategies in the design of axial compressors for gas turbine engines. Aerosp. Sci. Technol. 2020, 107, 106307. [Google Scholar] [CrossRef]
  3. Li, Y.L.; Sayma, A.I. Computational fluid dynamics simulations of blade damage effect on the performance of a transonic axial compressor near stall. Proc. Inst. Mech. Eng. Part C J. Mech. Eng. Sci. 2015, 229, 2242–2260. [Google Scholar] [CrossRef]
  4. Jian, H.; Hu, W. Numerical Investigation of Inlet Distortion on an Axial Flow Compressor Rotor with Circumferential Groove Casing Treatment. Chin. J. Aeronaut. 2008, 21, 496–505. [Google Scholar] [CrossRef] [Green Version]
  5. Shen, X.B.; Wang, H.F.; Lin, G.P.; Bu, X.Q.; Wen, D.S. Unsteady simulation of aircraft electro-thermal deicing process with temperature-based method. Proc. Inst. Mech. Eng. Part G J. Aerosp. Eng. 2020, 234, 388–400. [Google Scholar] [CrossRef]
  6. Sun, H.O.; Wang, M.; Wang, Z.Y.; Magagnato, F. Numerical investigation of surge prediction in a transonic axial compressor with a hybrid BDF/Harmonic Balance Method. Aerosp. Sci. Technol. 2019, 90, 401–409. [Google Scholar] [CrossRef]
  7. Hu, Y.; Nie, C. Exploration of combined adjustment laws about IGV, stator and rotational speed in off-design conditions in an axial compressor. Sci. China Technol. Sci. 2010, 53, 969–975. [Google Scholar] [CrossRef]
  8. Chu, F.; Dai, B.; Lu, N.; Ma, X.; Wang, F. Improved fast model migration method for centrifugal compressor based on bayesian algorithm and Gaussian process model. Sci. China Technol. Sci. 2018, 61, 1950–1958. [Google Scholar] [CrossRef]
  9. Webster, R.; Sreenivas, K.; Hyams, D.; Hilbert, B.; Briley, W.; Whitfield, D. Demonstration of Sub-system Level Simulations: A Coupled Inlet and Turbofan Stage. In Proceedings of the 48th AIAA/ASME/SAE/ASEE Joint Propulsion Conference & Exhibit, Atlanta, GA, USA, 30 July–1 August 2012. [Google Scholar]
  10. Li, S.; Liu, Y.; Omidi, M.; Zhang, C.; Li, H. Numerical Investigation of Transient Flow Characteristics in a Centrifugal Compressor Stage with Variable Inlet Guide Vanes at Low Mass Flow Rates. Energies 2021, 14, 7906. [Google Scholar] [CrossRef]
  11. Gong, Y. A Computational Model for Rotating Stall Inception and Inlet Distortions in Multistage Compressors. Ph.D. Thesis, Massachusetts Institute of Technology, Cambridge, MA, USA, 1998. [Google Scholar]
  12. Hsiao, E.; Naimi, M.; Lewis, J.P.; Dalbey, K.; Gong, Y.; Tan, C. Actuator duct model of turbomachinery components for powered-nacelle Navier-Stokes calculations. J. Propuls. Power 2001, 17, 919–927. [Google Scholar] [CrossRef]
  13. Hyoungjin, K.; Mengsing, L. Flow simulation of N3X hybrid wing body configuration. In Proceedings of the 51st AIAA Aerospace Sciences Meeting including the New Horizons Forum and Aerospace Exposition, Grapevine, TX, USA, 7–10 January 2013. [Google Scholar]
  14. Kim, H.; Liou, M.-S. Optimal Shape Design of Mail-Slot Nacelle on N3-X Hybrid Wing Body Configuration. In Proceedings of the 31st AIAA Applied Aerodynamics Conference, San Diego, CA, USA, 24–27 June 2013; p. 2413. [Google Scholar]
  15. Qiushi, L.; Yongzhao, L.; Tianyu, P.; Da, L.; Ha’nan, L.; Yifang, G. Development of a coupled supersonic inlet-fan Navier–Stokes simulation method. Chin. J. Aeronaut. 2018, 31, 237–246. [Google Scholar]
  16. Marble, F.E.; Hawthorne, W. Three-dimensional flow in turbomachines. High Speed Aerodyn. Jet Propuls. 1964, 10, 83–166. [Google Scholar]
  17. Xu, L. Assessing viscous body forces for unsteady calculations. J. Turbomach. 2003, 125, 425–432. [Google Scholar] [CrossRef]
  18. Ritos, K.; Kokkinakis, I.W.; Drikakis, D. Performance of High-Order Implicit Large Eddy Simulations. Comput. Fluids 2018, 173, 307–312. [Google Scholar] [CrossRef]
  19. Lange, M.; Vogeler, K.; Mailach, R.; Gomez, S.E. An experimental verification of a new design for cantilevered stators with large hub clearances. J. Turbomach. 2013, 135, 041022. [Google Scholar] [CrossRef]
  20. Wang, Y.; Chen, W.; Wu, C.; Ren, S. Effects of tip clearance size on the performance and tip leakage vortex in dual-rows counter-rotating compressor. Proc. Inst. Mech. Eng. Part G J. Aerosp. Eng. 2015, 229, 1953–1965. [Google Scholar] [CrossRef]
  21. Zhu, Y.; Luo, J.; Liu, F. Flow computations of multi-stages by URANS and flux balanced mixing models. Sci. China Technol. Sci. 2018, 61, 1081–1091. [Google Scholar] [CrossRef]
Figure 1. Illustration of body forces parallel and normal to the local flow.
Energies 15 04389 g001
Figure 2. Schematic diagram of the meridional streamline.
Energies 15 04389 g002
Figure 3. Demands of models on accuracy versus resources.
Energies 15 04389 g003
Figure 4. Schematic of the NASA Rotor 37.
Energies 15 04389 g004
Figure 5. NUMECA FINE computational mesh. (a) Perspective view and (b) View from casing at LE and TE of hub.
Energies 15 04389 g005
Figure 6. Distribution of y+ on walls of the hub, blade, and shroud.
Energies 15 04389 g006
Figure 7. Mesh independence verification. (a) Mass flow rate and (b) Adiabatic efficiency.
Energies 15 04389 g007aEnergies 15 04389 g007b
Figure 8. HMNF module computational mesh. (a) 3D view and (b) Meridional plane view.
Energies 15 04389 g008aEnergies 15 04389 g008b
Figure 9. Mesh independence verification. (a) Mass flow rate; (b) Pressure ratio.
Energies 15 04389 g009
Figure 10. NASA Rotor 37 blade geometry parameters. (a) The camber angle α (rad); (b) The spacing h (m); (c) The solidity σ (1); and (d) The blockage b (1).
Energies 15 04389 g010aEnergies 15 04389 g010b
Figure 11. The pitchwise-averaged entropy contours. (a) View on the meridional plane and (b) View around shroud and hub.
Energies 15 04389 g011aEnergies 15 04389 g011b
Figure 12. Rotor 37 pressure ratio versus mass flow rate.
Energies 15 04389 g012
Figure 13. Comparison of Rotor 37 flow characteristics at outlet along the span. (a) Total pressure ratio distribution; (b) Swirl angle distribution; (c) Total temperature distribution; and (d) Mach distribution.
Energies 15 04389 g013aEnergies 15 04389 g013b
Figure 14. The pitchwise−averaged parameter contours on the meridional plane. (a) Dimensionless total pressure contours; (b) Dimensionless pressure contours; (c) Mach contours; and (d) Swirl angle contours.
Energies 15 04389 g014
Table 1. Design parameters of the NASA Rotor 37.
ParametersValue
Blade number36
Inlet hub-to-tip ratio0.7
Blade aspect ratio1.19
Tip solidity1.29
Tip relative inlet Ma1.48
Rotating speed (rpm)17,188
Mass flow rate (kg/s)20.19
Total pressure ratio2.106
Adiabatic efficiency (%)87.7
Table 2. The errors in the comparisons with the experimental data.
NUMECA FINEImproved Body Force Model
Figure 13a3.2%3.4%
Figure 13b8.3%14%
Figure 13c3.7%2.8%
Publisher’s Note: MDPI stays neutral with regard to jurisdictional claims in published maps and institutional affiliations.