Abstract
As commercial transportation complexes, expressway service buildings have large passenger flow and a poor energy-saving effect, and have become the focus of energy conservation and emissions reduction efforts in the transportation field. At the same time, the particularity of the function determines that it is within the scope of no municipal supporting facilities, which renders them typical energy island-type buildings. This paper takes the expressway service buildings in a cold area as the research object, and carries out the correlation and partial correlation analysis of the factors influencing the operating energy consumption of the air-conditioning system. For the analysis of factors affecting the energy consumption of expressway service buildings during the operation period, considering that most of the service buildings are in the form of heating and cooling air conditioners, this paper chooses to represent the “refrigeration period” with a more obvious degree of influence. At the same time, during the operation period, because the ontological characteristics have been determined according to the analysis results, the outdoor meteorological characteristics are the main factors affecting the energy consumption of expressway service buildings. These include the dry bulb temperature and horizontal plane solar irradiance index, as well as the indoor comprehensive environment parameters: temperature, CO2 concentration index, indoor personnel density index. Based on the above analysis, a low energy consumption operation strategy for the air-conditioning system is proposed. The results of this article are of great significance for the construction of energy consumption models for expressway service buildings and the adoption of low energy consumption strategies.
1. Introduction
As commercial transportation complexes, expressway service buildings have large passenger flow and a poor energy saving effect, and have become the focus of energy saving and emissions reduction efforts in the transportation field. At the same time, the particularity of the function determines that it is within the scope of no municipal supporting facilities, which renders them typical energy island-type buildings. The expressway service district has the energy supply characteristics of the “energy island type” and the energy consumption characteristic of a “high permeability coefficient.” Traditional expressway service buildings all need to build independent energy supply facilities, such as generator sets and heating boilers, and their investment remains high. Therefore, according to the energy consumption and energy consumption characteristics of existing expressway service buildings, it is of great significance to take energy-saving measures in the operation stage by analyzing the factors influencing air-conditioning operation energy consumption. Judging from the current on-site survey statistics of expressway service buildings in cold areas, the dual-purpose air-conditioning forms of “fan coil unit + fresh air system” are mostly used. At the same time, this paper analyzes the factors affecting the energy consumption of expressway service buildings during the operation period, mainly considering the “cooling period” with a more obvious impact.
Existing expressway service districts in cold regions were selected for statistical analysis of building energy consumption. The selected service districts include: 10 service districts belonging to the Daguang, Jingshi, Baojin, Zhangshi and Hengde expressways around the Xiongan New Area. Specifically, they include: Shenzhou, Xushui, Gaocheng, Dingzhou, Xiongxian, Cuizhuang, Hengshui, Quyang, Tangxian and Nanjiang expressway service districts. The energy consumption per unit area and total energy consumption data of the existing expressway service district are shown in Figure 1.
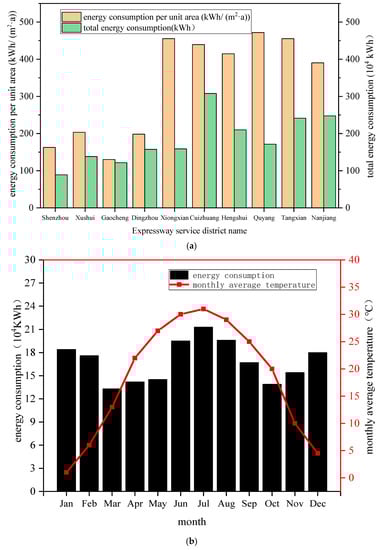
Figure 1.
Energy consumption and monthly temperature of expressway service buildings in 2019. (a) Building Energy consumption of typical expressway service districts in 2019. (b) Monthly building energy consumption and average temperature of new districts.
From Figure 1a, it can be concluded that the energy consumption per unit area of the four service districts of Shenzhou, Xushui, Gaocheng and Dingzhou is significantly lower than that of the other six service districts. Because the four service districts belong to the newly-built service districts on the Daguang and Beijing-Shijiazhuang Expressways, they use novel ground-source heat pump units and combine cooling and heating sources. The Xiongxian, Cuizhuang, Hengshui, Quyang, Tangxian and Nanjiang service districts are old service districts, and the cooling and heating use traditional methods, so the energy consumption data are quite different. It can also be concluded from the figure that the total energy consumption and the energy consumption per unit area between the expressway service districts in adjacent areas are also quite different, and the difference between the maximum value and the minimum value is large [1]. After actual measurement and analysis, it was found that the main reasons for the large differences in building energy consumption in expressway service districts are: different geographical locations and climatic conditions; different forms of cold and heat sources; large differences in passenger flow density and business conditions. Thus, the optimization measures are different. Among the 10 measured expressway service districts, the energy consumption density of the four newly built service districts is in the range of 150~200 kWh/(m2·a), and the energy consumption density of the six old service districts is 400~470 kWh/(m2·a). This greatly exceeds the energy consumption density of ordinary public buildings in the “China Building Energy Conservation Annual Development Research Report,” which shows that its energy saving potential is huge. Figure 1b shows the annual monthly energy consumption and the average temperature of the 10 service districts. It can be seen from Figure 1b that July to October is the main energy consumption time period in the expressway service district in cold regions. Due to the warm winter phenomenon in the central part of Hebei Province in the past two years, during the day, the average temperature during the working hours of the air conditioner can reach more than 5 °C, which leads to a reduction in heat loss and the energy consumption of the air conditioner during this period. At the same time, the window-to-wall ratio of buildings in the expressway service area is higher than that of general public buildings, and they are located in remote areas. Compared with urban buildings, the heat island effect is lacking, and the effect of solar radiation is more significant. Therefore, the energy consumption of air conditioning and refrigeration in summer is higher than that of heating in winter [2]. Compared with urban buildings, the heat island effect is lacking, and the effect of solar radiation is more significant. Therefore, the energy consumption of air conditioning and refrigeration in summer is higher than that of heating in winter. As the main building serving people in the expressway service district, the expressway service building has the highest energy consumption density in the expressway service district [3]. From the perspective of the energy consumption composition of expressway service buildings, the average energy consumption ratio of the 10 service buildings measured in 2019 is: air conditioning energy consumption, lighting energy consumption, coal or natural gas energy consumption, water heater energy consumption and other electrical equipment energy consumption The proportions of total energy consumption are: 42.6%, 15.1%, 16.8%, 7.2% and 18.3%, respectively. The energy consumption by the air-conditioning operation has become the primary factor in the energy consumption of expressway service buildings.
The three major factors that affect the energy consumption of expressway service buildings are the outdoor meteorological characteristics, ontological building characteristics and indoor environmental characteristics. Among them, the characteristics of the building body include overall characteristics such as building orientation, building scale, window-to-wall ratio, body shape coefficient and shading coefficient; thermal performance characteristics of the envelope structure such as the heat transfer coefficient, thermal inertia and ventilation times; and equipment characteristics such as the capacity of cold and heat sources, lighting and water heater power. For the operating energy consumption of the air-conditioning system, because the characteristics of the building itself have been determined, the influencing factors are mainly external factors, that is, the outdoor meteorological characteristics and indoor environmental characteristics. There are many factors that affect the energy consumption of air-conditioning system operation. According to the “General Specification for Building Energy Conservation and Renewable Energy Utilization” GB 55015-2021, the main influencing factors are external disturbance factors, that is, outdoor meteorological characteristics; and internal disturbance factors, that is, indoor environmental parameters. For highway service buildings, the outdoor meteorological elements that affect the energy consumption of air conditioners include five parameters: temperature, air pressure, humidity, wind direction and wind speed. According to the TMY(typical meteorological year) parameter composition of typical meteorological years determined in the “Meteorological Parameter Standard for Building Energy Conservation” (JGJ/T 346-2014), the factors affecting the energy consumption of air-conditioning operation include: dry bulb temperature, total solar radiation on the horizontal plane, outdoor air pressure, relative humidity, and outdoor wind speed, a total of five parameters. The indoor environmental factors that affect the energy consumption of air conditioners include four parameters: indoor temperature, humidity, CO2 concentration and personnel density parameters. This paper specifically analyzes the factors influencing the operating energy consumption of the air-conditioning system, in order to obtain the main factors affecting the operating energy consumption of the air-conditioning system, and proposes low-energy consumption operation strategies.
2. State of the Art
The research and development of energy-saving adaptive technology in the building operation stage is mainly based on building usage characteristics and actual operation data. In 2006, Yang Jie [4] and others took Shanghai World Expo Exhibition Hall as the object of empirical analysis, simulated the building’s energy consumption and comprehensively analyzed the key influencing factors, and concluded that the main factor affecting energy consumption is passenger flow and the outer protective structure. In 2009, Sun Shengnan [5] and others took a large passenger station as the object of analysis. The building energy consumption simulation value was the dependent variable and the passenger flow was the independent variable. In 2012, Mambo [6] et al. analyzed the engineering response to the carbon emission problem of an existing terminal building, which is to control and integrate the indoor environmental system with external conditions and passenger flow. The unique properties, comfort standards, control point settings and control strategies of the indoor microclimate in airport terminals are discussed. In 2013, Deng Xiang [7] and others combined the theory of organizational behavior and took large shopping malls as the research object to study the relationship between customer behavior changes and building energy consumption, especially air conditioning energy consumption, and proposed to adjust the operation of air conditioners and other equipment according to customer behavior characteristics. In 2014, Vorovin [8] established a hybrid neural network model to analyze the influencing factors and simulate and verify the hourly power consumption data of the Finnish energy market, and proved the accuracy of the energy consumption prediction method. In 2015, Eshetu [9] et al. took a large waiting hall in Addis Ababa as an example, analyzed the impact of passenger flow on building energy consumption and the correlation between passenger flow and building energy consumption of large waiting halls. In 2016, Wang Tao [10] et al. took the expressway service area of Anhui province in a hot summer and cold winter area as an example, conducted a survey and questionnaire survey on the relevant factors influencing air-conditioning energy consumption, constructed a multiple linear regression model and proposed a passenger flow model. The energy consumption of air conditioners is one of the key factors affecting energy consumption in service districts. Based on the energy consumption monitoring of CABR near-zero energy consumption demonstration buildings of the China Academy of Building Research, Li Huai [11] and others proposed an effective method in the energy-saving operation stage, combining the characteristics of the energy system, aiming at comfort and system energy saving. The refined management strategy of behavioral energy saving, especially “optimized management of operation strategy based on actual operation data,” has a certain guiding significance for energy saving management in the operation stage of ultra-low energy consumption buildings in high-speed service districts. Chai [12] et al. analyzed and predicted the factors influencing road transportation energy consumption based on the BMA model. It is expected that China’s road transportation energy consumption will reach 347,363 ktoe by the end of 2020. Achour [13] used the logarithmic mean Divisia index method (LMDI) to summarize the factors influencing transportation energy consumption in Tunisia in terms of energy intensity, the transportation structure effect, transportation intensity effect, economic output and population size effect. Based on the operational characteristics of expressway toll stations and maintenance centers, Li [14] initially tried to use the Divisia logarithmic average index method to analyze the factors influencing energy to clarify the evolution of energy consumption. In 2017, Ren Nannan [15] and others proposed an ultra-low-energy building operation management strategy based on actual building operation data in severe cold regions. Relying on the actual operation data of demonstration buildings, data were collected and sorted in the cooling, heating and transition seasons, in order to provide a better understanding of how the building works. The ultra-low energy consumption buildings in the operation phase shall adjust the energy-saving measures based on the operation data. Bourdeau [16] analyzed the energy consumption of three campus buildings in Paris from 2014 to 2017, identified the main energy consumption factors, such as equipment and personnel, and decomposed and reconstructed the power demand curve. In 2018, Zhao Guanghui [17] and others proposed a green and intelligent building energy consumption integrated management system, which focused on the setting and control of the two parameters of passenger flow and building ambient temperature, and conducted a simulation study, which verified the validity of the control model. In 2020, Zheng Lintao [18] and others conducted an investigation and analysis of the passenger flow of five large shopping malls in Guangdong, built a model based on the actual passenger flow, and used the energy consumption simulation software system to simulate and analyze energy consumption, and compared it with the measured data. For comparison, the corresponding energy-saving measures are determined according to the model analysis results. These constructive methods adopted by scholars at home and abroad to study the factors influencing building energy consumption have strong reference value. Through the above literature and advanced research methods, we can draw the conclusion that the difference in energy consumption of buildings of different properties depends on a variety of factors. By analyzing the energy consumption levels and factors influencing different types of buildings and establishing energy consumption prediction models, we can effectively take energy-saving measures, reduce operation and maintenance costs, and accurately predict the energy consumption scale of similar buildings.
3. Methodology
The DesignBuilder software system takes Energyplus as the core and is widely used in building energy consumption simulation, and its accuracy has been verified [19]. In this paper, DesignBuilder was used to select Baoding in the cold area to establish a typical building model, and the indoor environment parameters were set to remain unchanged. At a certain time, the outdoor meteorological parameters remain unchanged. According to the energy consumption simulation, correlation and partial correlation methods are used to analyze the influence of various indoor environmental parameters on the energy consumption of air conditioners [20]. Therefore, the main factors affecting the energy consumption of expressway service buildings in cold regions are obtained.
3.1. DesignBuilder Energy Consumption Simulation
The CLIMATE-CONSULTANT software system is used to analyze the outdoor meteorological conditions in Baoding where typical buildings are located. CLIMATE-CONSULTANT thermal comfort and boundary parameters can be set individually, according to what is suitable for indoor comfort and the energy consumption analysis of public buildings [21]. CLIMATE-CONSULTANT can directly call the climate data of 8760 h per year in EPW format. The EPW format is the data format adopted by the building energy consumption simulation software EnergyPlus, which contains the climate data of tens of thousands of regions around the world. In this paper, the typical building area is assumed to be Baoding in a cold climate area, and the meteorological conditions used are the data of the Raoyang observation point. Its hourly meteorological data, including solar radiation, dry bulb temperature, dew point temperature, wind speed and other parameters that characterize climate characteristics in typical meteorological years, are shown in Figure 2; the outdoor dry bulb temperature is shown in Figure 3.
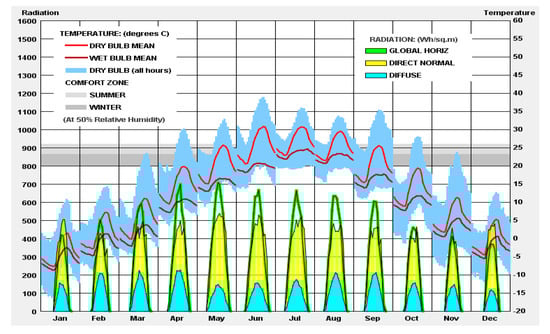
Figure 2.
Hourly Meteorological Data of Typical Meteorological Years in Baoding Area.
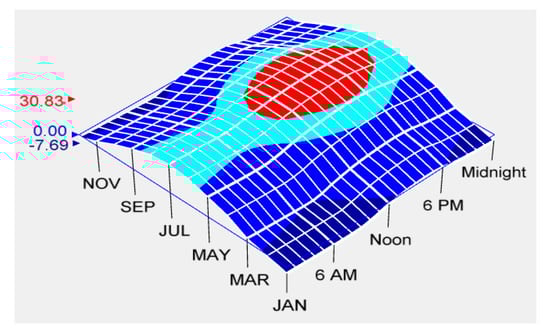
Figure 3.
Typical Meteorological Year Dry Bulb Temperature in Baoding Area.
According to Figure 2 and Figure 3, it can be seen that in the Baoding area, April, May, September, and October are the transition seasons, and the dry bulb temperature is basically within the comfortable temperature range. When the temperature is lower or higher than the comfortable temperature, passengers can pass through, adding or removing clothing to achieve thermal comfort. From the hourly temperature point of view, the highest temperature in a day occurs at 11~21 o’clock. Based on Figure 3 and field investigation, the start and end time of the heating and cooling calculation period in Baoding can be determined, as shown in Table 1.

Table 1.
Starting and ending time of heating and cooling.
Among them, the thermal parameters of the building and the enclosure structure, heating, ventilation and air conditioning parameters are set according to the “General Specification for Building Energy Conservation and Renewable Energy Utilization” GB 55015-2021, and the building type is selected as a Class B public building in a cold area. The typical building constructed in this paper has 2 floors above ground (without basement), the building area is 2350 m2, the usable building area is 2200 m2, the building base area is 46.8 m × 7.8 m × 3 m, the building height is 13.8 m, and the body shape coefficient is 0.25. The window–wall ratio is 0.15 for east and west, 0.35 for south and 0.21 for north.
3.1.1. Typical Building Model
The main functional areas of a typical building include the retail area, dining area and entertainment area on the first floor, and offices, conference rooms, and guest rooms on the second floor. Its facade and roof are appropriately simplified, as shown in Figure 4 and Figure 5.
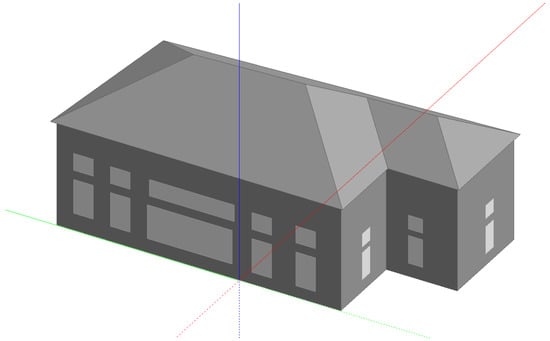
Figure 4.
Typical highway service building DesignBuilder model.
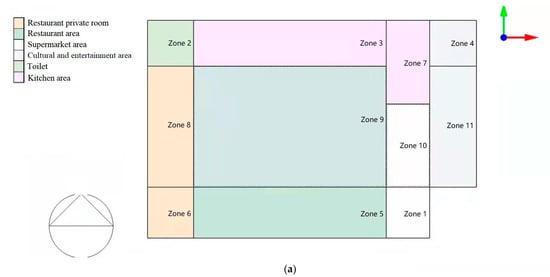
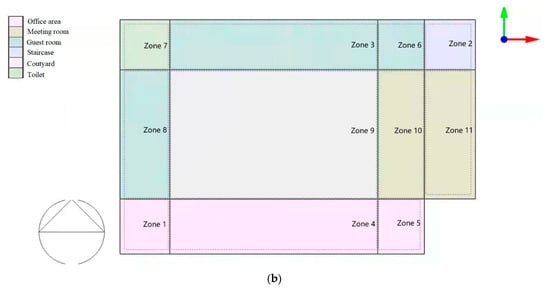
Figure 5.
DesignBuilder floor plan of typical expressway service building. (a) First floor. (b) Second floor.
3.1.2. Building Orientation
The Weather Tool is used to compare and analyze the annual solar radiation on the façades facing each other [22]. According to the solar radiation heat gain in the overheating period and the supercooling period in the whole year, the local relative optimal building orientation is obtained, and the EPW data in Beijing and Shijiazhuang are selected to determine the best orientation for the area. As shown in Figure 6, the orientation of typical highway service buildings adopts the best orientation of buildings in the area [23].
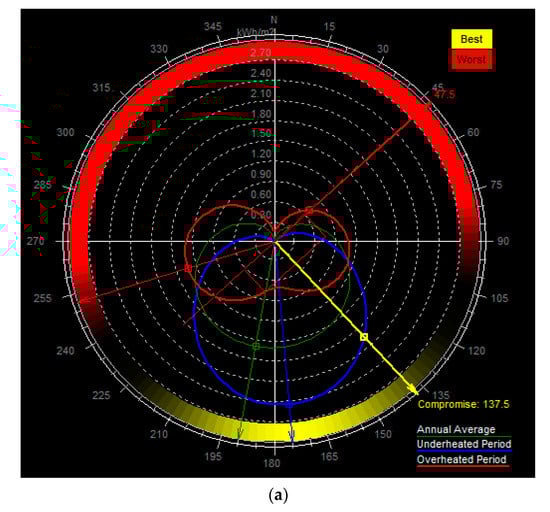
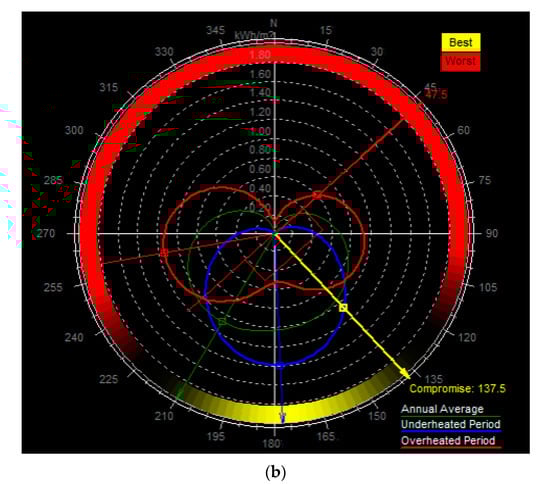
Figure 6.
The best orientation of typical buildings in cold regions. (a) Beijing (42.5 degrees east south). (b) Shijiazhuang (42.5 degrees east south).
3.1.3. Cold and Heat Sources and Air Conditioning Systems
Due to the lack of a municipal energy supply system, geographical location and environmental advantages, the current highway service buildings often use the “ground source heat pump” cooling and heat source method [24]. The specific parameters of the ground source heat pump used in typical expressway service buildings are shown in Table 2. The air-conditioning system adopts VRF multi-connected central air-conditioning system with IPLV ≥ 3.90.
Table 2.
Cold and heat sources of typical expressway service buildings.
3.1.4. Indoor Comfort Environment Range Setting
The Comfort Environment Index was referred to in setting interior design parameters. In this section, the parameter system takes a fixed limit, that is, the temperature is set to 26 °C, the relative humidity is 60%, and the fresh air volume is 30 m3/(h·person); the other parameters are set in the “General Specification for Building Energy Conservation and Renewable Energy Utilization” GB 55015-2021. The ventilation frequency of the room is set to be adjustable 0.2 times/hour~10 times/hour, and meets the “Design Code for Heating Ventilation and Air Conditioning of Civil Buildings” GB50736-2012.
3.1.5. Indoor Heat Disturbance
The personnel, equipment, lighting power and operating time of air conditioning and heating systems in the main functional rooms are based on the “General Specification for Building Energy Conservation and Renewable Energy Utilization” GB 55015-2021, as shown in Table 3 and Table 4.
Table 3.
Power density of personnel, lighting and equipment in main functional rooms.
Table 4.
Operating hours of air-conditioning and heating systems.
3.1.6. Definition of Building Envelope
A typical expressway service building is a Class B public building, and the main parameters of the envelope structure are set according to the “General Specification for Building Energy Conservation and Renewable Energy Utilization” GB 55015-2021, as shown in Table 5.
Table 5.
Main envelope parameters.
3.1.7. Simulation Results
The simulation time is selected as the non-heating season from April to October, and the simulation results of air-conditioning energy consumption are shown in Table 6.
Table 6.
Power density of personnel, lighting and equipment in main functional rooms.
3.2. Analysis of Influence of Outdoor Meteorological Parameters on Energy Consumption of Air Conditioning Operation
The Pearson correlation coefficient in the SPSS (Statistical Product and Service Solutions) software system was used to characterize the relationship between the five parameters and the energy consumption of the air conditioner, and the parameters with strong energy consumption were selected. The indoor environmental parameters of typical expressway service buildings were set unchanged, and the monthly air-conditioning energy consumption values simulated by the DesignBuilder software system were analyzed by Pearson correlation and partial correlation with the monthly meteorological parameters, and the key factors affecting energy consumption were obtained.
3.2.1. Correlation Analysis
According to the “Meteorological Parameter Standard for Building Energy Conservation” (JGJ/T 346-2014), the composition of TMY parameters for a typical meteorological year was determined. The specific meteorological parameters selected for correlation analysis included five factors: dry bulb temperature, total solar radiation on the horizontal plane, outdoor air pressure, relative humidity and outdoor wind speed. The SPSS system was used to analyze the correlation of the selected factors influencing energy consumption. The monthly data from April to October were used, as shown in Table 7. The Pearson correlation coefficient analysis was used [25]. The variables affecting the energy consumption of air-conditioning operation are all continuous data that obey the normal distribution and are independent of each other, and approximate the correlation between the distance variables. Therefore, the correlation of the variables can be directly measured by the Pearson correlation coefficient. The specific calculation formula of the Pearson coefficient method is shown in Equation (1). The closer the absolute value of the coefficient r is to 1, the stronger the correlation; the closer it is to 0, the weaker the correlation. If |r| = 1, it means that the two analytical objects are perfectly linearly related. If |r| = 0, it means that the two analytical objects are completely uncorrelated (not linearly related). The strength of the correlation between the two variables can be divided into the following grades: when |r| ≥ 0.8, it is regarded as a strong correlation; when 0.5 ≤ |r| < 0.8, it is regarded as a moderate correlation; when 0.3 ≤ |r| < 0.5, it is regarded as weak correlation; when |r| < 0.3, it indicates that the correlation between variables is very weak [26].
Table 7.
Building energy consumption and influencing factors in existing service districts.
3.2.2. Partial Correlation Analysis
Partial correlation analysis means that when two variables are related to a third variable at the same time, the influence of the third variable is eliminated, and only the process of analyzing the degree of correlation between the other two variables is used to determine the R value of the correlation coefficient. The partial correlation coefficient r calculation and t test are shown in Formulas (2) and (3). Among the related variables, two factors, dry bulb temperature and total solar radiation on the horizontal plane, have influences on three factors: outdoor air pressure, relative humidity and outdoor wind speed [27]. Therefore, on the basis of correlation analysis, partial correlation analysis was further used to control the first two factors (second-order) and the last three factors (third-order) and to analyze the influence of other factors on the energy consumption of air-conditioning operation [28]. Partial correlation analysis was used, with t-test confidence intervals of 98% and 97%, and both-sided Sig values were less than 0.05.
3.3. Analysis of the Influence of Indoor Environmental Parameters on the Energy Consumption of Air Conditioners
In order to calculate the influence of different parameters on the energy consumption of air-conditioning operation, according to the “Code for Design of Heating, Ventilation and Air-conditioning for Civil Buildings” GB50736-2012, different values of indoor environmental parameters are set within the comfortable range [29]. The energy consumption model of a typical expressway service building is still constructed according to 2.1, and the outdoor meteorological parameters are set to remain unchanged at a certain time, and the indoor temperature, humidity, CO2 concentration and personnel density parameters are adjusted in turn, and the corresponding building energy consumption is calculated by using DesignBuilder software [30], in order to judge the influence of indoor environmental parameters on the energy consumption of air-conditioning operation [31]. The parameter indicators are set to 3–4 levels, that is, the indoor temperature settings in summer [25 °C, 26 °C, 27 °C, 28 °C], the humidity settings [30%, 50%, 70%] and the indoor temperature settings in winter [19 °C, 20 °C, 21 °C, 22 °C], while relative humidity is still set to [30%, 50%, 70%], CO2 concentration is set to [400 ppm, 700 ppm, 1000 ppm] and personnel density is set to [10 m2/p, 20 m2/p, 30 m2/p].
3.3.1. Single Factor Analysis of the Influence of Air Conditioning Operation Energy Consumption
The outdoor meteorological parameters were set as fixed values at a certain time, and the summer working conditions were: dry bulb temperature 30.8 °C, horizontal plane solar radiation value 0.951 kW, outdoor air pressure 1005.3 mbar, relative humidity 67.5% and outdoor wind speed 2.1 m/s. The winter working conditions were: dry bulb temperature 6.8 °C, solar radiation value on horizontal plane 1.086 kW, outdoor air pressure 1020.6 mbar, relative humidity 36.7% and outdoor wind speed 1.9 m/s. When calculating the change in a parameter of the indoor environment, other parameters were set to fixed values according to 3.1.
3.3.2. Partial Correlation Analysis
The change in indoor population density had the most significant impact on the energy consumption of the air-conditioning system, and the indoor population density parameter also had a significant impact on the other three parameters [32,33]. Considering the coupling correlation of indoor environmental parameters, the SPSS system was still used to control the density of indoor personnel, and the partial correlation coefficient rij(k) was obtained to characterize the influence of various environmental parameters on the energy consumption of air-conditioning operation [34]. Using partial correlation analysis, the confidence interval of the t-test was 98%, and the two-sided value of Sig was less than 0.05.
4. Results
4.1. Analysis Results of Correlation between Outdoor Meteorological Factors and Air-Conditioning Energy Consumption
The correlation and partial correlation analysis results between outdoor meteorological factors and air-conditioning energy consumption are shown in Table 8 and Table 9.
Table 8.
SPSS-related analysis of building energy consumption in existing service districts.
Table 9.
Partial correlation analysis results.
From the results of correlation and partial correlation analysis, the outdoor meteorological strong correlation parameters affected by the energy consumption of air-conditioning in expressway service buildings included two indicators: dry bulb temperature and total solar radiation on the horizontal plane.
4.2. Correlation Analysis Results between Indoor Environmental Factors and Air-Conditioning Energy Consumption
The relationship between the parameters of the indoor environment and the energy consumption of the air conditioner can be obtained from Figure 7.
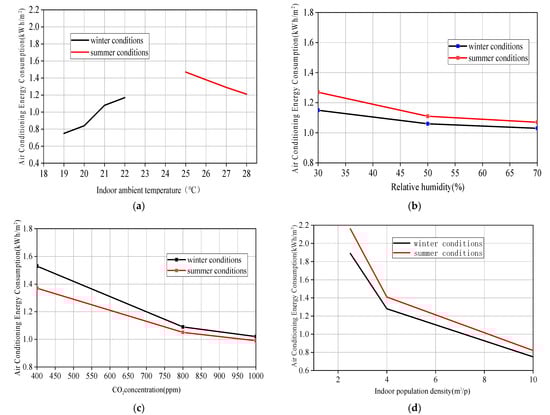
Figure 7.
Influence of Indoor Environmental Parameters. (a) Correlation between temperature and air conditioning energy consumption. (b) Correlation between relative humidity and air conditioning energy consumption. (c) Correlation between CO2 concentration and air conditioning energy consumption. (d) Correlation between population density and air conditioning energy consumption.
The partial correlation analysis results of indoor environmental parameters and air-conditioning energy consumption are shown in Table 10.
Table 10.
Partial correlation analysis results.
From Figure 7a and Table 10, it can be concluded that the correlation between indoor ambient temperature and the operating energy consumption of the air-conditioning system is strong in both winter and summer, with positive and negative correlations in winter and summer, respectively, and the correlation coefficient in winter is higher than that in summer; from Figure 7b and Table 10, it can be concluded that the indoor air humidity is negatively correlated with the operating energy consumption of the air-conditioning system in both winter and summer. The correlation in winter is greater than that in summer, and the correlations are both weak, with a 50% boundary. When the relative humidity is higher than the cut-off point, the correlation with the energy consumption of the air-conditioning operation is very weak and can be regarded as irrelevant; from Figure 7c and Table 10, it can be concluded that the indoor CO2 concentration is related to the energy consumption of the air-conditioning system operation. There is a cut-off point of 800 ppm. When it is lower than this cut-off point, the CO2 concentration is strongly correlated with the operating energy consumption of the air-conditioning system, and when it is higher than the cut-off point, there is a strong correlation; from Figure 7d and Table 10, it can be seen that the density of indoor personnel is strongly correlated with the operating energy consumption of the air-conditioning system.
5. Conclusions
From the results of correlation and partial correlation analysis, the outdoor-weather-related parameters that affect the energy consumption of air-conditioning in expressway service buildings include two indicators: dry bulb temperature and total solar radiation on the horizontal plane. The indoor environment strongly correlated parameters that affect the energy consumption of air-conditioning in expressway service buildings include indoor temperature and indoor population density. When the indoor CO2 concentration index is lower than the cut-off point of 800 ppm, it is a strong correlation factor, and when it is higher than the cut-off point of 800 ppm, it is a weak correlation factor. At the same time, based on the above analysis, it can be concluded that the low energy consumption operation of the air conditioning system of the expressway service building should have the following characteristics:
- (1)
- The indoor ambient temperature has a significant impact on the operating energy consumption of the air-conditioning system. Combined with the temporary and streamlined characteristics of expressway service building personnel, the indoor temperature can be based on the obtained “acceptable threshold,” combined with “Civil Building Heating Ventilation and Air Conditioning Design Code” GB50736-2012, which is set according to the limit value;
- (2)
- The relative humidity above the 50% cut-off point has little effect on the operating energy consumption of the air-conditioning system, and the relative humidity below the 50% cut-off point has a significant impact on the operating energy consumption of the air-conditioning system. Therefore, in the daily operation process, it should be appropriately increased;
- (3)
- The CO2 concentration has a significant impact on the operation of the air-conditioning system. The CO2 concentration below the 800 ppm cut-off point has a gradually increasing influence on the energy consumption of the air-conditioning system. Therefore, in the daily operation process, the CO2 concentration value (corresponding to the number of air changes) should not be calculated. If the setting is too low, it is necessary to comprehensively consider the setting of air quality requirements and energy saving requirements;
- (4)
- The density of indoor people has the greatest impact on the energy consumption of the air-conditioning system, and has a significant impact on the other three parameters of the indoor environment. Therefore, the precise setting of the “hourly room rate” index based on the change in indoor personnel density is of great significance for the energy-saving operation of air conditioners. The hourly occupancy rate of expressway service building personnel is significantly different from the value given in the relevant energy-saving codes and needs to be corrected.
Author Contributions
Conceptualization, X.R. and L.J.; methodology, L.J.; validation, X.R.; formal analysis, L.J.; investigation, L.J.; data curation, L.J.; writing—original draft preparation, L.J.; writing—review and editing, L.J.; visualization, L.J.; project administration, X.R. and L.J. All authors have read and agreed to the published version of the manuscript.
Funding
This research was funded by Key R&D Program of Hebei Province, grant number 20374507D.
Conflicts of Interest
The authors have no conflict of interest. The funders had no role in the design of the study; in the collection, analyses, or interpretation of data; in the writing of the manuscript, or in the decision to publish the results.
References
- Xi, R. Research on Indoor Environment Research and Improvement Measures of Large-Scale Commercial Complex Buildings in Xi’an. Master’s Dissertation, Xi’an Engineering University, Xi’an, China, 2018. [Google Scholar]
- Zhao, D.; Xu, Q. Research on operating energy consumption of ultra-low energy building air conditioning system based on uncertainty quantitative analysis. HVAC 2021, 51, 67–74. [Google Scholar]
- Sun, S.; Zhang, X.; Wang, S.; Jiang, D. Analysis of air conditioning load characteristics of large railway passenger stations. Build. Therm. Vent. Air Cond. 2009, 28, 8–11. [Google Scholar]
- Yang, J.; Zhang, X.; Wang, L. Analysis of Influencing Factors of Air Conditioning Load Index of Shanghai World Expo Pavilion Buildings. HVAC 2006, 36, 77–80. [Google Scholar]
- Xu, G.; Zhao, L. Characteristics of passenger flow in subway stations and their influence on air-conditioning load of personnel. HVAC 2022, 52, 154–159. [Google Scholar]
- Mambo, A.D.; Efthekhari, M. Supervisory Control of Indoor Environment Systems to Minimise the Carbon Footprint of Airport Terminal Buildings—A Review. In Sustainability in Energy and Buildings; Springer: Berlin/Heidelberg, Germany, 2012. [Google Scholar]
- Deng, X. Research on Energy-Saving Operation and Management of Large Supermarkets. Master’s Dissertation, Chongqing University, Chongqing, China, 2013. [Google Scholar]
- Voronin, S.; Partanen, J. Forecasting electricity price and demand using a hybrid approach based on wavelet transform, ARIMA and neural networks. Int. J. Energy Res. 2014, 38, 626–637. [Google Scholar] [CrossRef]
- Li, D.; Yan, Y.; Zeng, X. Combined Short- term Prediction Model of Station Entry Flow in Urban Rail Transit. Urban Rapid Rail Transit. 2017, 30, 54–58. [Google Scholar]
- Wang, T.; Yang, Y.; Jian, L. Research on the Quantitative Relationship between Building Air Conditioning Energy Consumption and Influencing Factors in Expressway service districts in Hot Summer and Cold Winter Areas—A Case Study of Expressway service districts in Anhui Province. Transp. Res. 2016, 2, 43–48. [Google Scholar]
- Li, H.; Wu, J.; Yu, Z.; Xu, W. Research on energy-saving operation and management practice of CABR passive ultra-low energy buildings. Build. Sci. 2016, 32, 1–5. [Google Scholar]
- Chai, J.; Lu, Q.Y.; Wang, S.Y.; Lai, K.K. Analysis of road transportation energy consumption demand in China. Transp. Res. Part D Transp. Environ. 2016, 48, 112–124. [Google Scholar] [CrossRef]
- Achour, H.; Belloumi, M. Decomposing the influencing factors of energy consumption in Tunisian transportation sector using the LMDI method. Transp. Policy 2016, 52, 64–71. [Google Scholar] [CrossRef]
- Li, D.Q.; Wang, D.Y. Decomposition analysis of energy consumption for an freeway during its operation period: A case study for Guangdong, China. Energy 2016, 97, 296–305. [Google Scholar] [CrossRef]
- Ren, N.; Sun, J. Research on energy-saving operation and management strategies of ultra-low energy consumption buildings in severe cold regions. Low Carbon World 2017, 34, 215–216. [Google Scholar]
- Bourdeau, M.; Guo, X.; Nefzaoui, E. Buildings energy consumption generation gap: A post-occupancy assessment in a case study of three higher education buildings. Energy Build. 2017, 159, 610–611. [Google Scholar] [CrossRef]
- Zhao, G.; Zhu, Q. Research on Smart Building Energy Management System. Mod. Build. Electr. 2018, 9, 1–5. [Google Scholar]
- Zheng, L.; Zhao, L. Investigation and analysis on the work and rest of staff in large shopping malls in areas with hot summers and warm winters. HVAC 2020, 50, 92–99+115. [Google Scholar]
- Wang, H. Analysis of energy consumption management for air-conditioning system operation in public buildings. Clean Air-Cond. Technol. 2012, 71–72+76. [Google Scholar]
- Huang, B. Research on Energy Consumption Simulation and Energy Saving of Large Shopping Malls in Guangdong. Master’s Dissertation, Guangzhou University, Guangzhou, China, 2019. [Google Scholar]
- Garcia, J.; Coelho, L. Energy efficiency strategies in refrigeration systems of large supermarkets. Int. J. Energy Environ. Econ. 2010, 4, 64–70. [Google Scholar]
- Xiao, Y. Energy Consumption Simulation of Building Air-Conditioning System and Energy-Saving Optimization Operation Analysis. Master’s Dissertation, Wuhan Textile University, Wuhan, China, 2014. [Google Scholar]
- Lee, J.H.; Ryu, S.H.; Song, Y.H. Analysis of peak flow reduction for rainfall characteristics in optimal sewer networks. In Proceedings of the Korea Water Resources Association Conference; Korea Water Resources Association: Seoul, Korea, 2011. [Google Scholar]
- Wang, J.; Kang, J. Research on Quantitative Relationship between Body Design Parameters of Residential Buildings and Energy Saving in Cold Regions. Model. Meas. Control. C 2017, 78, 496–512. [Google Scholar] [CrossRef]
- Wang, Y. Simulation Analysis and Energy Saving Optimization of Air Conditioning System in a Public Building in Changsha. Master’s Dissertation, Hunan University, Changsha, China, 2017. [Google Scholar]
- Missaoui, R.; Joumaa, H.; Ploix, S.; Bacha, S. Managing energy Smart Homes according to energy prices: Analysis of a Building Energy Management System. Energy Build. 2014, 71, 155–167. [Google Scholar] [CrossRef]
- Wu, J.; Li, H.; Yu, Z.; Guo, J.; Lv, M. Optimization operation analysis of HVAC system in a near-zero energy office building. Build. Sci. 2020, 36, 35–41. [Google Scholar]
- Chidiebere, O.C. Multivariate Approach to Partial Correlation Analysis. Sci. J. Appl. Math. Stat. 2015, 3, 165–168. [Google Scholar] [CrossRef][Green Version]
- Elsisy, M.; Shayan, M.; Chen, Y.; Tillman, B.W.; Go, C.; Chun, Y. Assessment of mechanical and biocompatible performance of ultra-large nitinol endovascular devices fabricated via a low-energy laser joining process. J. Biomater. Appl. 2021, 36, 332–345. [Google Scholar] [CrossRef] [PubMed]
- Liu, C.; Zhao, T.; Zhang, J.; Ma, L.; Liu, X.; Li, W.; Yang, X. Power consumption analysis of VRV air conditioning system and centralized air conditioning system based on building energy consumption monitoring platform. Build. Sci. 2016, 32, 108–115. [Google Scholar]
- Wang, W.; Teng, J.Y. The Construction of Key Technology System for Ultra-Low Energy Consumption Green Building in Severe Cold Regions. Intell. Build. Smart City 2018, 75–77. [Google Scholar] [CrossRef]
- Kaye, N.B.; Hunt, G.R. The Effect of Floor Heat Source Area on the Induced Airflow in a Room. Build. Environ. 2010, 45, 839–847. [Google Scholar] [CrossRef]
- Zhang, B.; Li, Y.H.; Lau, J.; Liu, M.S. Demand control ventilation: Influence of terminal box minimum airflow setting on system energy use. Energy Build. 2014, 79, 173–183. [Google Scholar] [CrossRef]
- Rojas, D.P. Atrium Building Design: Key Aspects to Improve Their Thermal Performance on the Mediterranean Climate of Santiago de Chile. Int. J. Low-Carbon Technol. 2014, 9, 327–330. [Google Scholar] [CrossRef]
Publisher’s Note: MDPI stays neutral with regard to jurisdictional claims in published maps and institutional affiliations. |
© 2022 by the authors. Licensee MDPI, Basel, Switzerland. This article is an open access article distributed under the terms and conditions of the Creative Commons Attribution (CC BY) license (https://creativecommons.org/licenses/by/4.0/).