
Modeling the Process and Properties of Ash Formation during Pulverized Biomass Combustion

Abstract
:1. Introduction
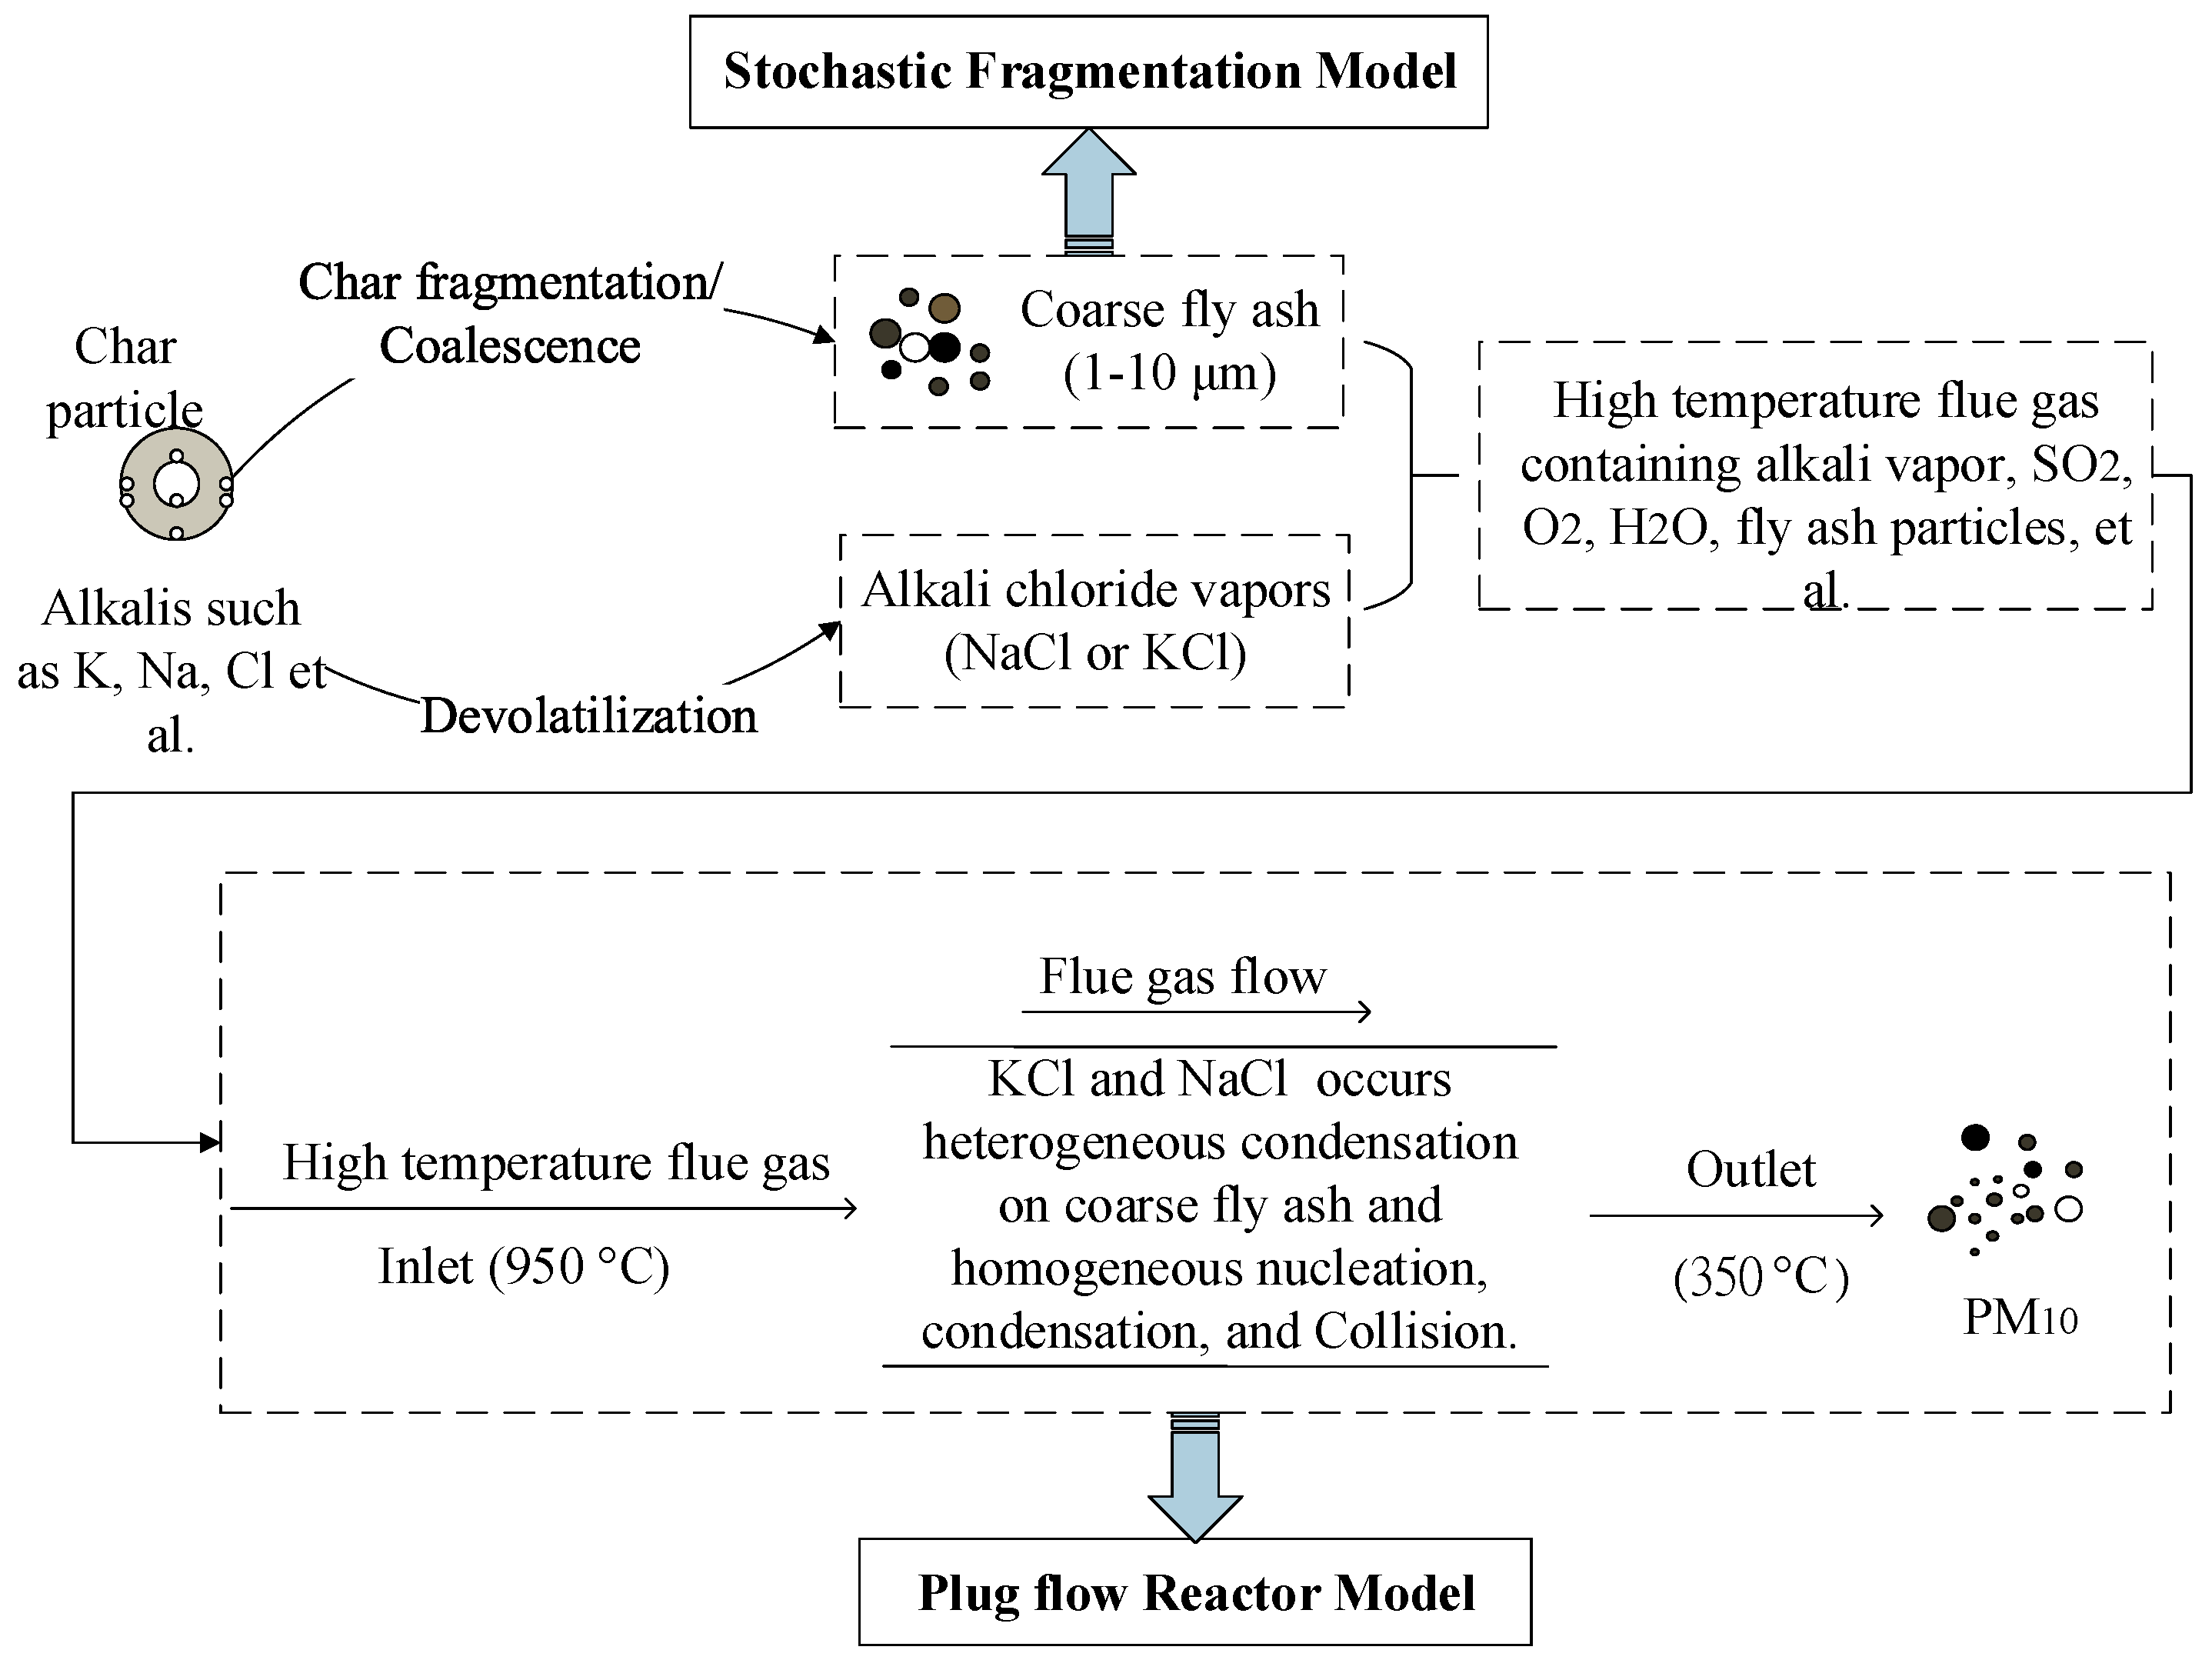
2. Modeling
2.1. Residual Fly Ash Formation Model
2.2. Model for the Evolution of the Aerosol
2.3. Model for the Evolution of the Aerosol
3. Results and Discussion
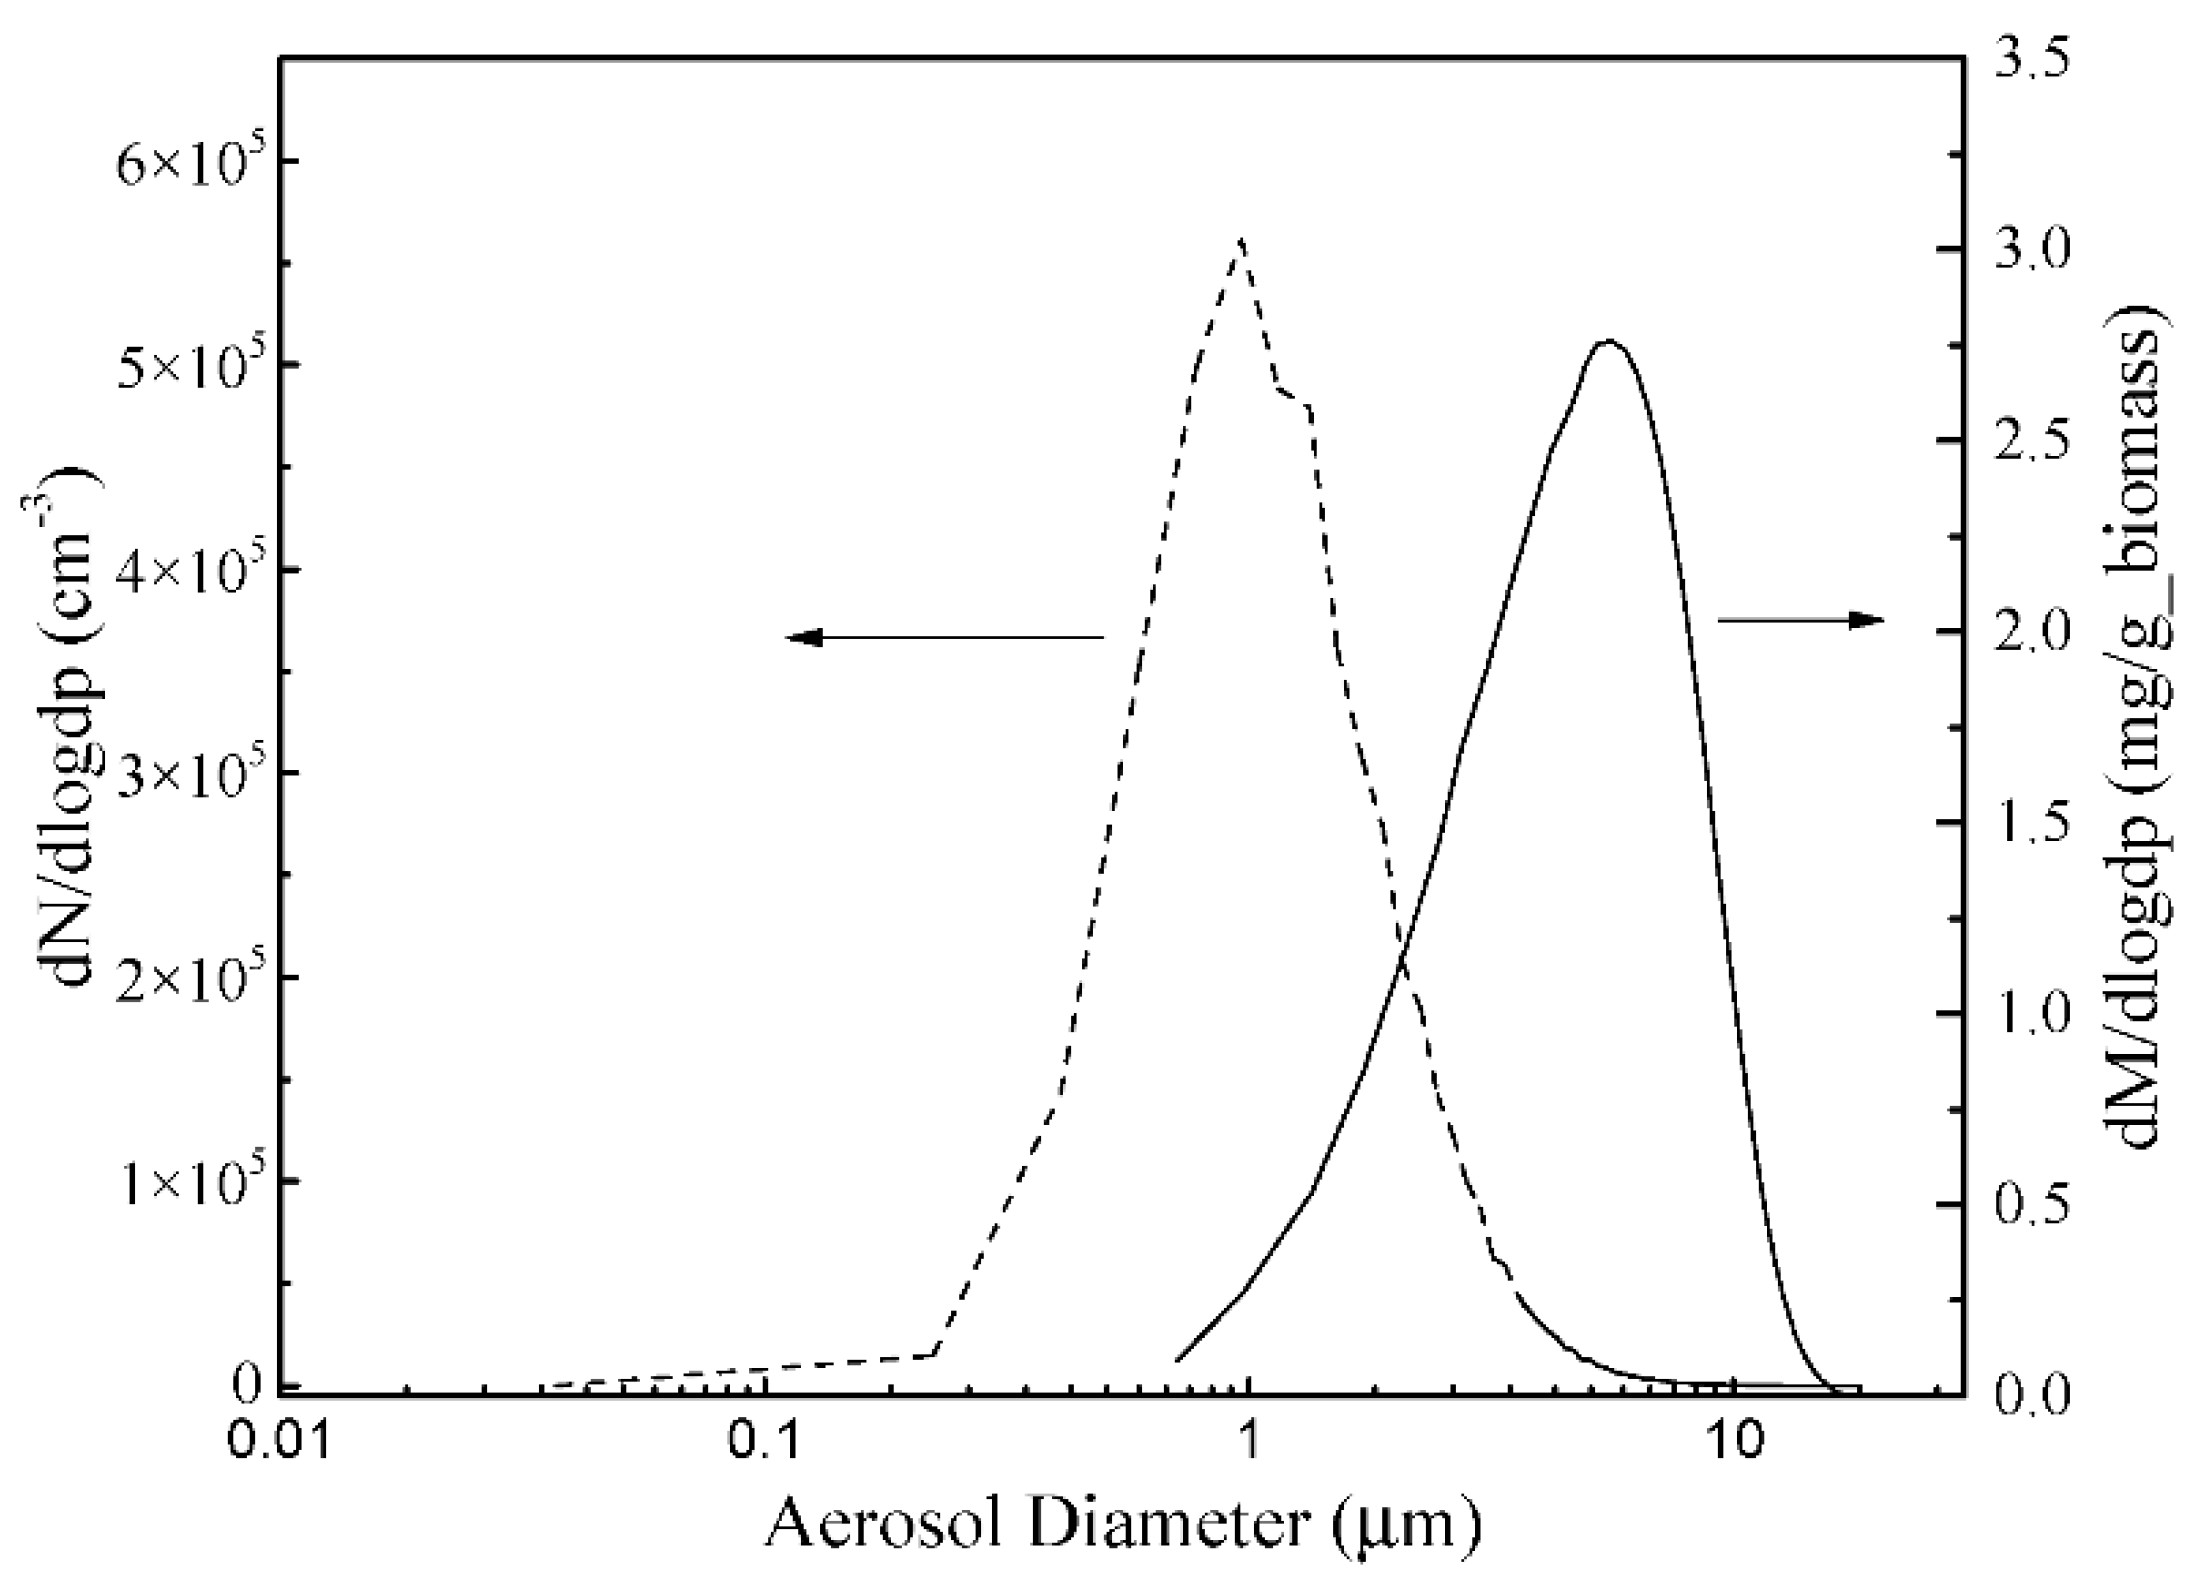
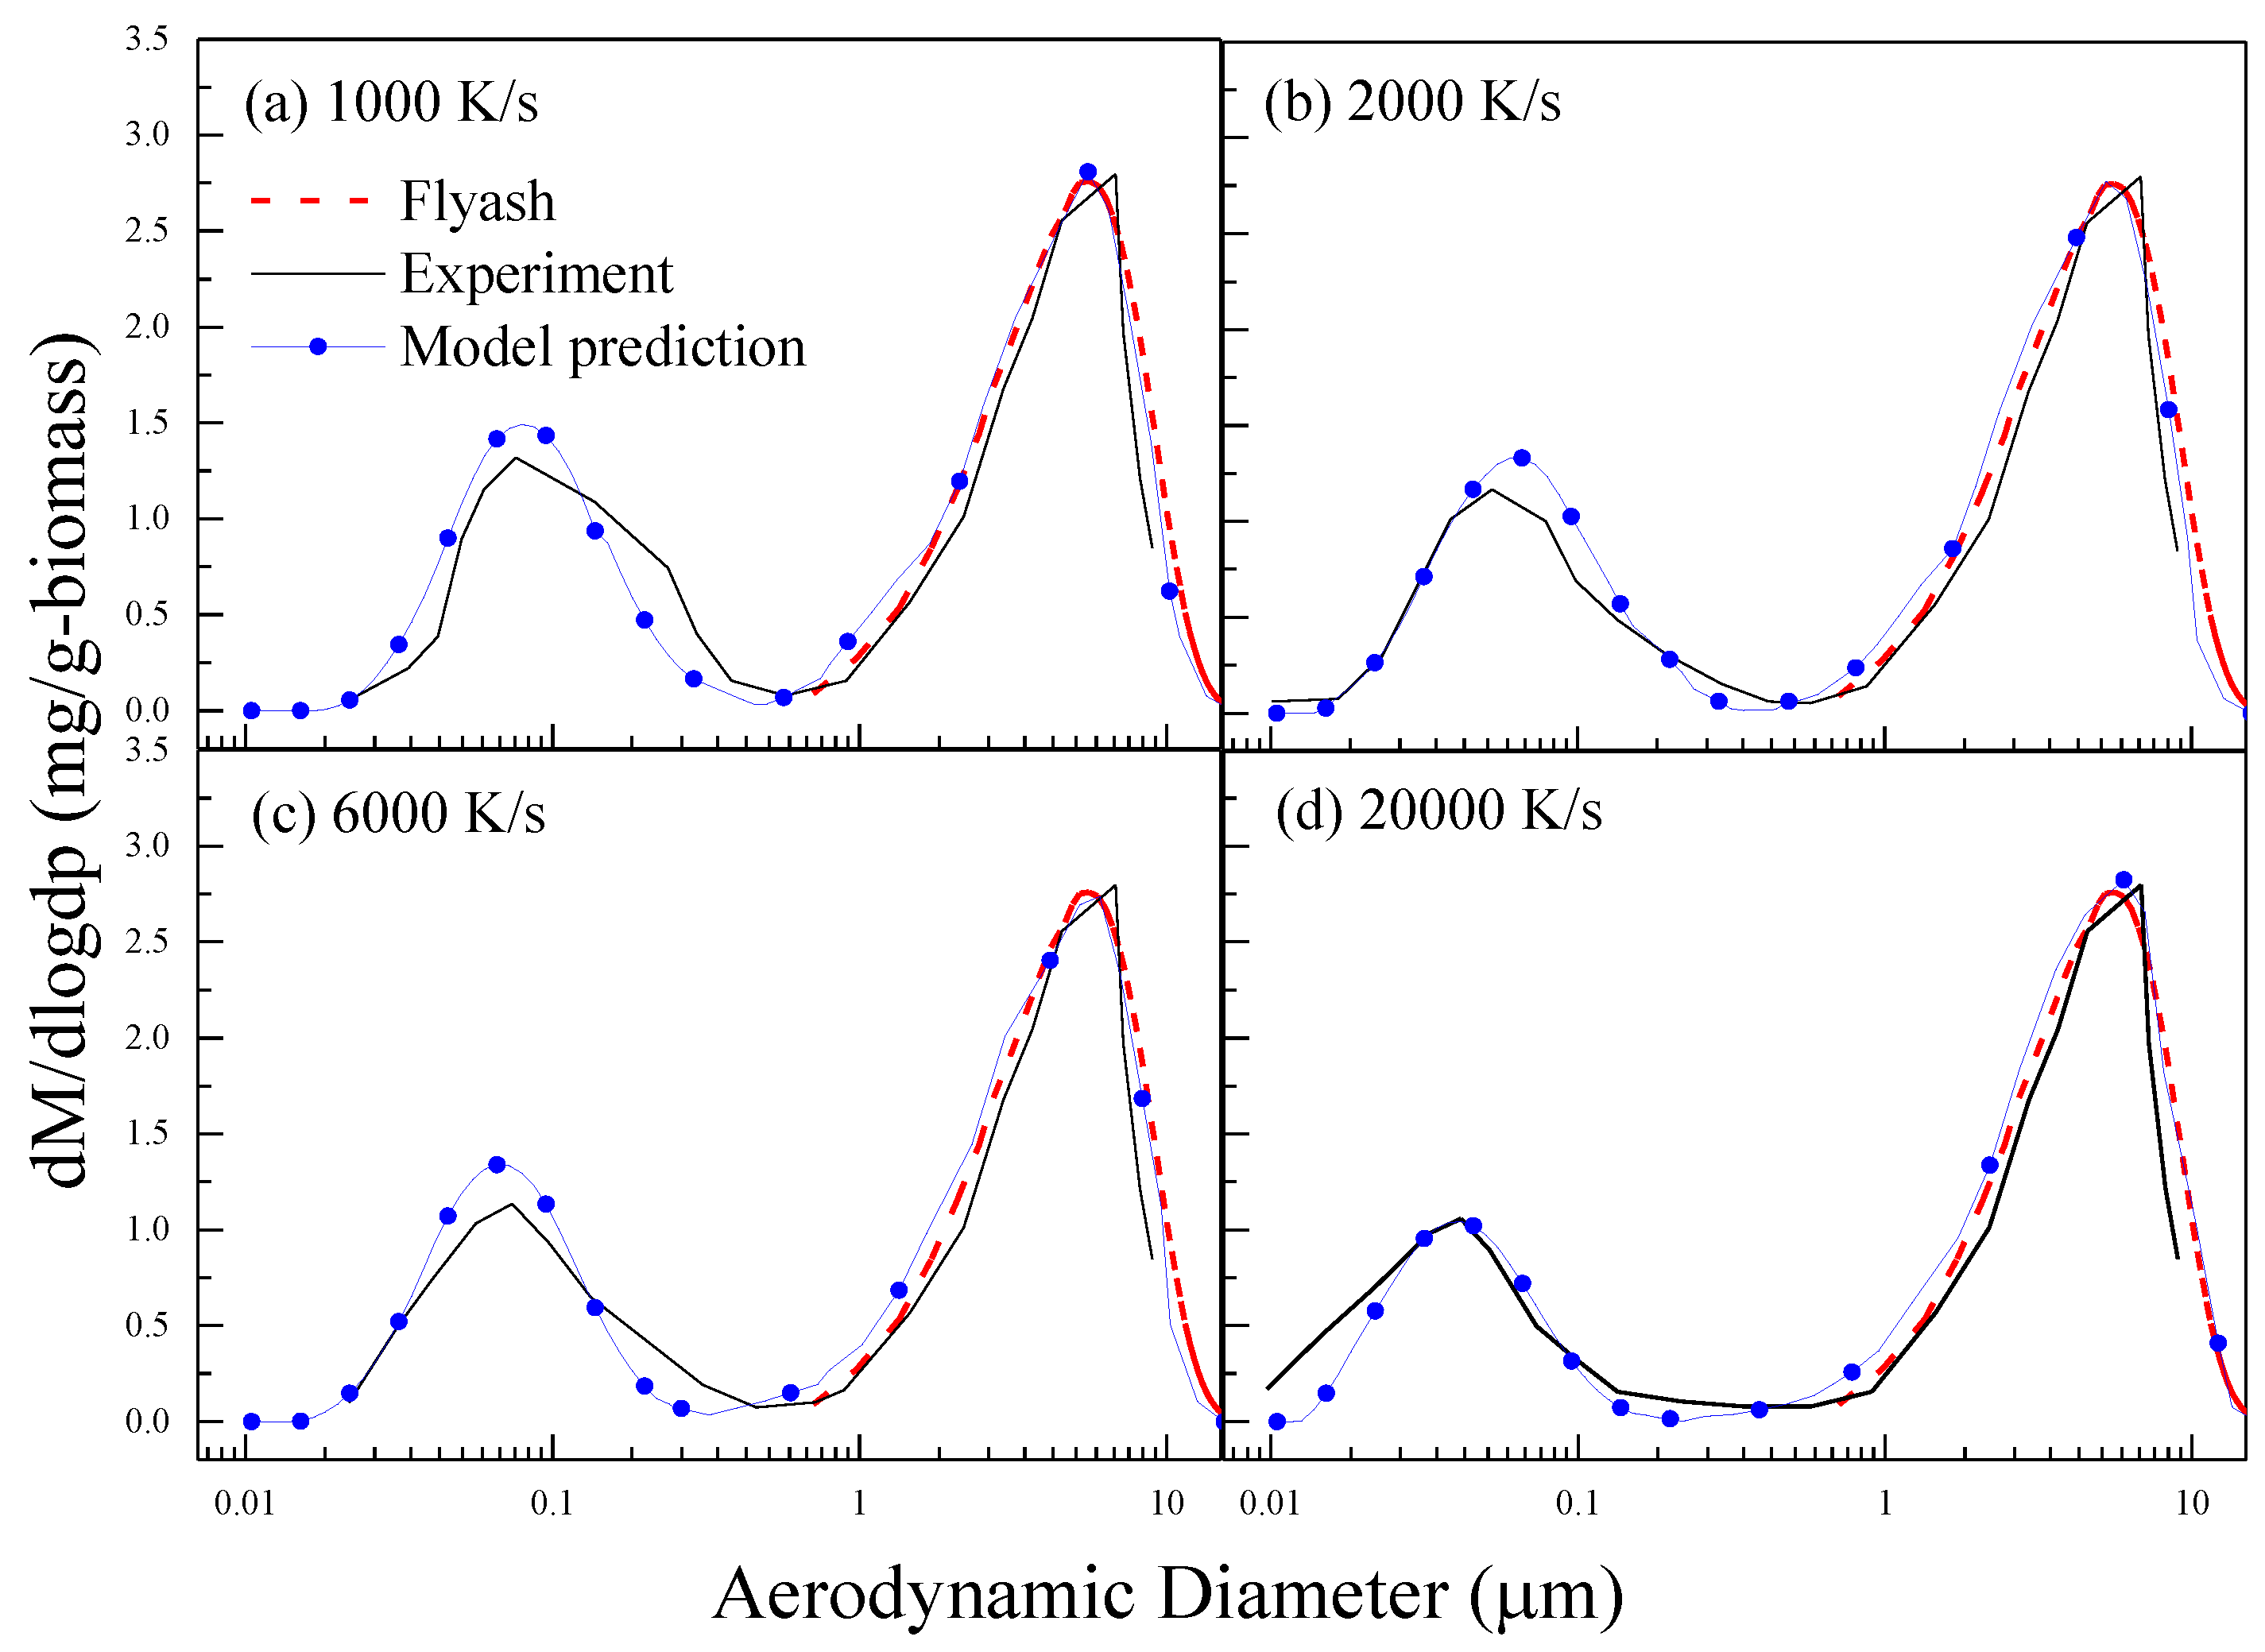
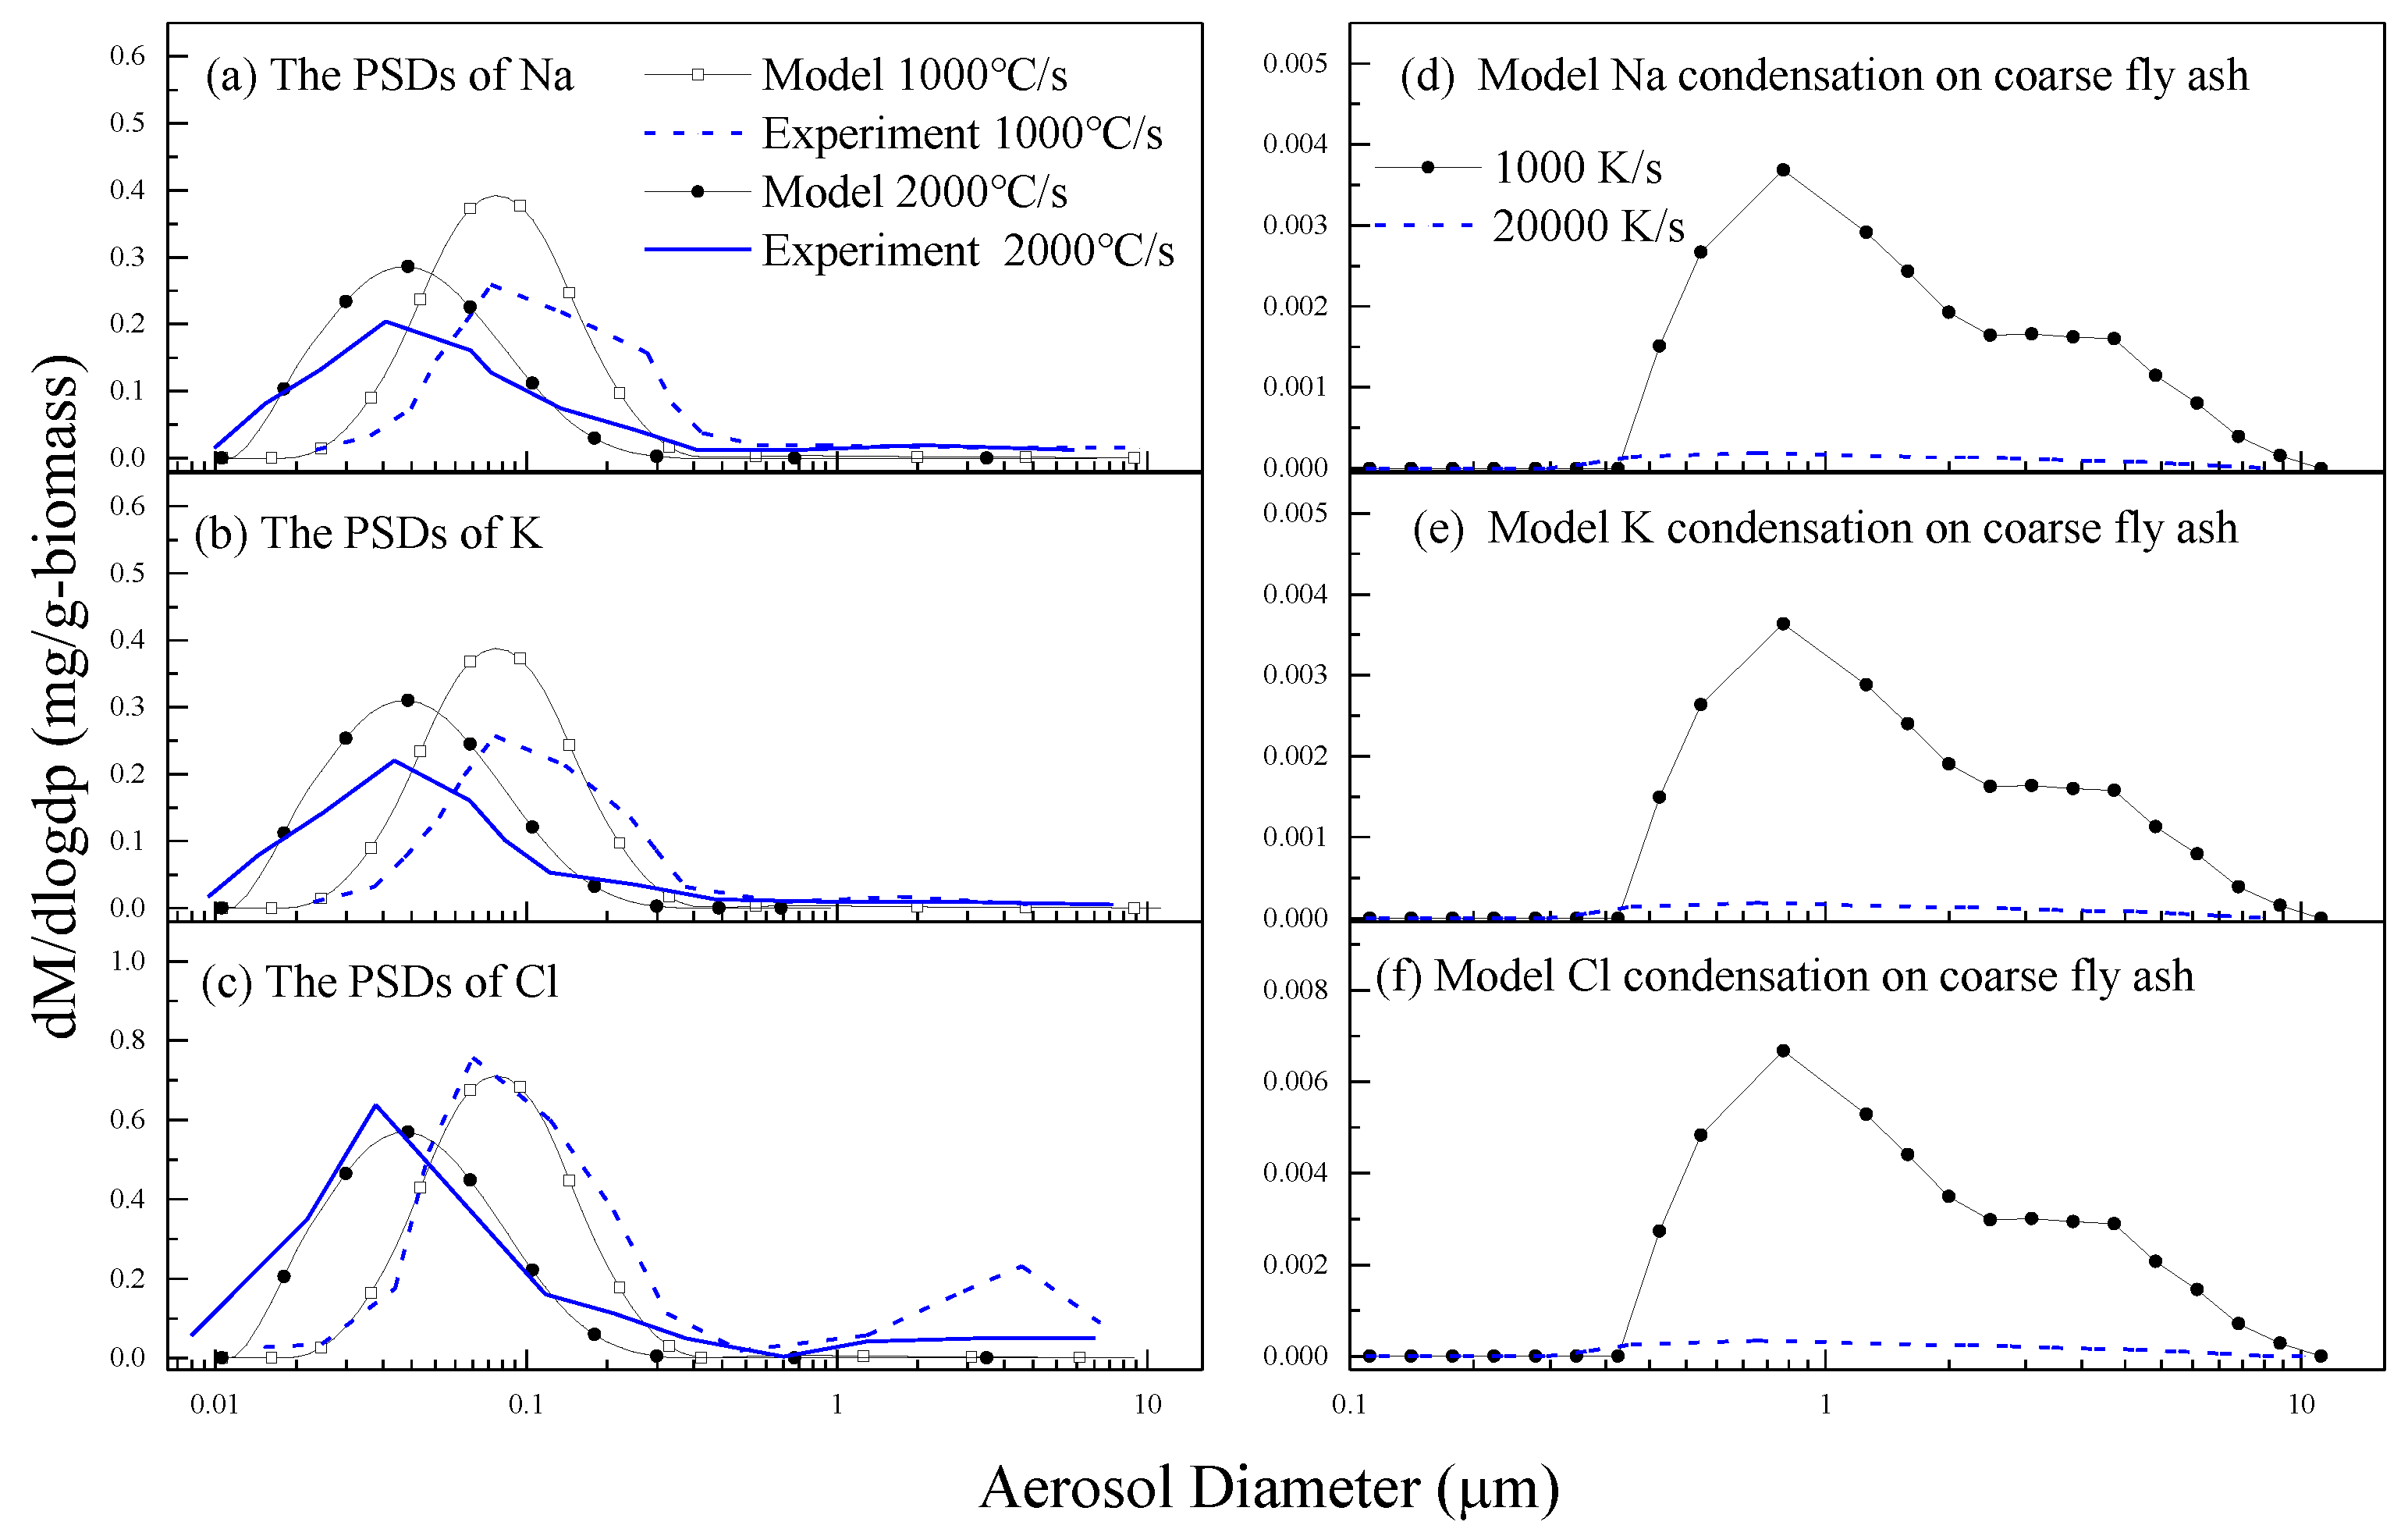
3.1. Model Validation of the PSDs of PM10 and Its Elements
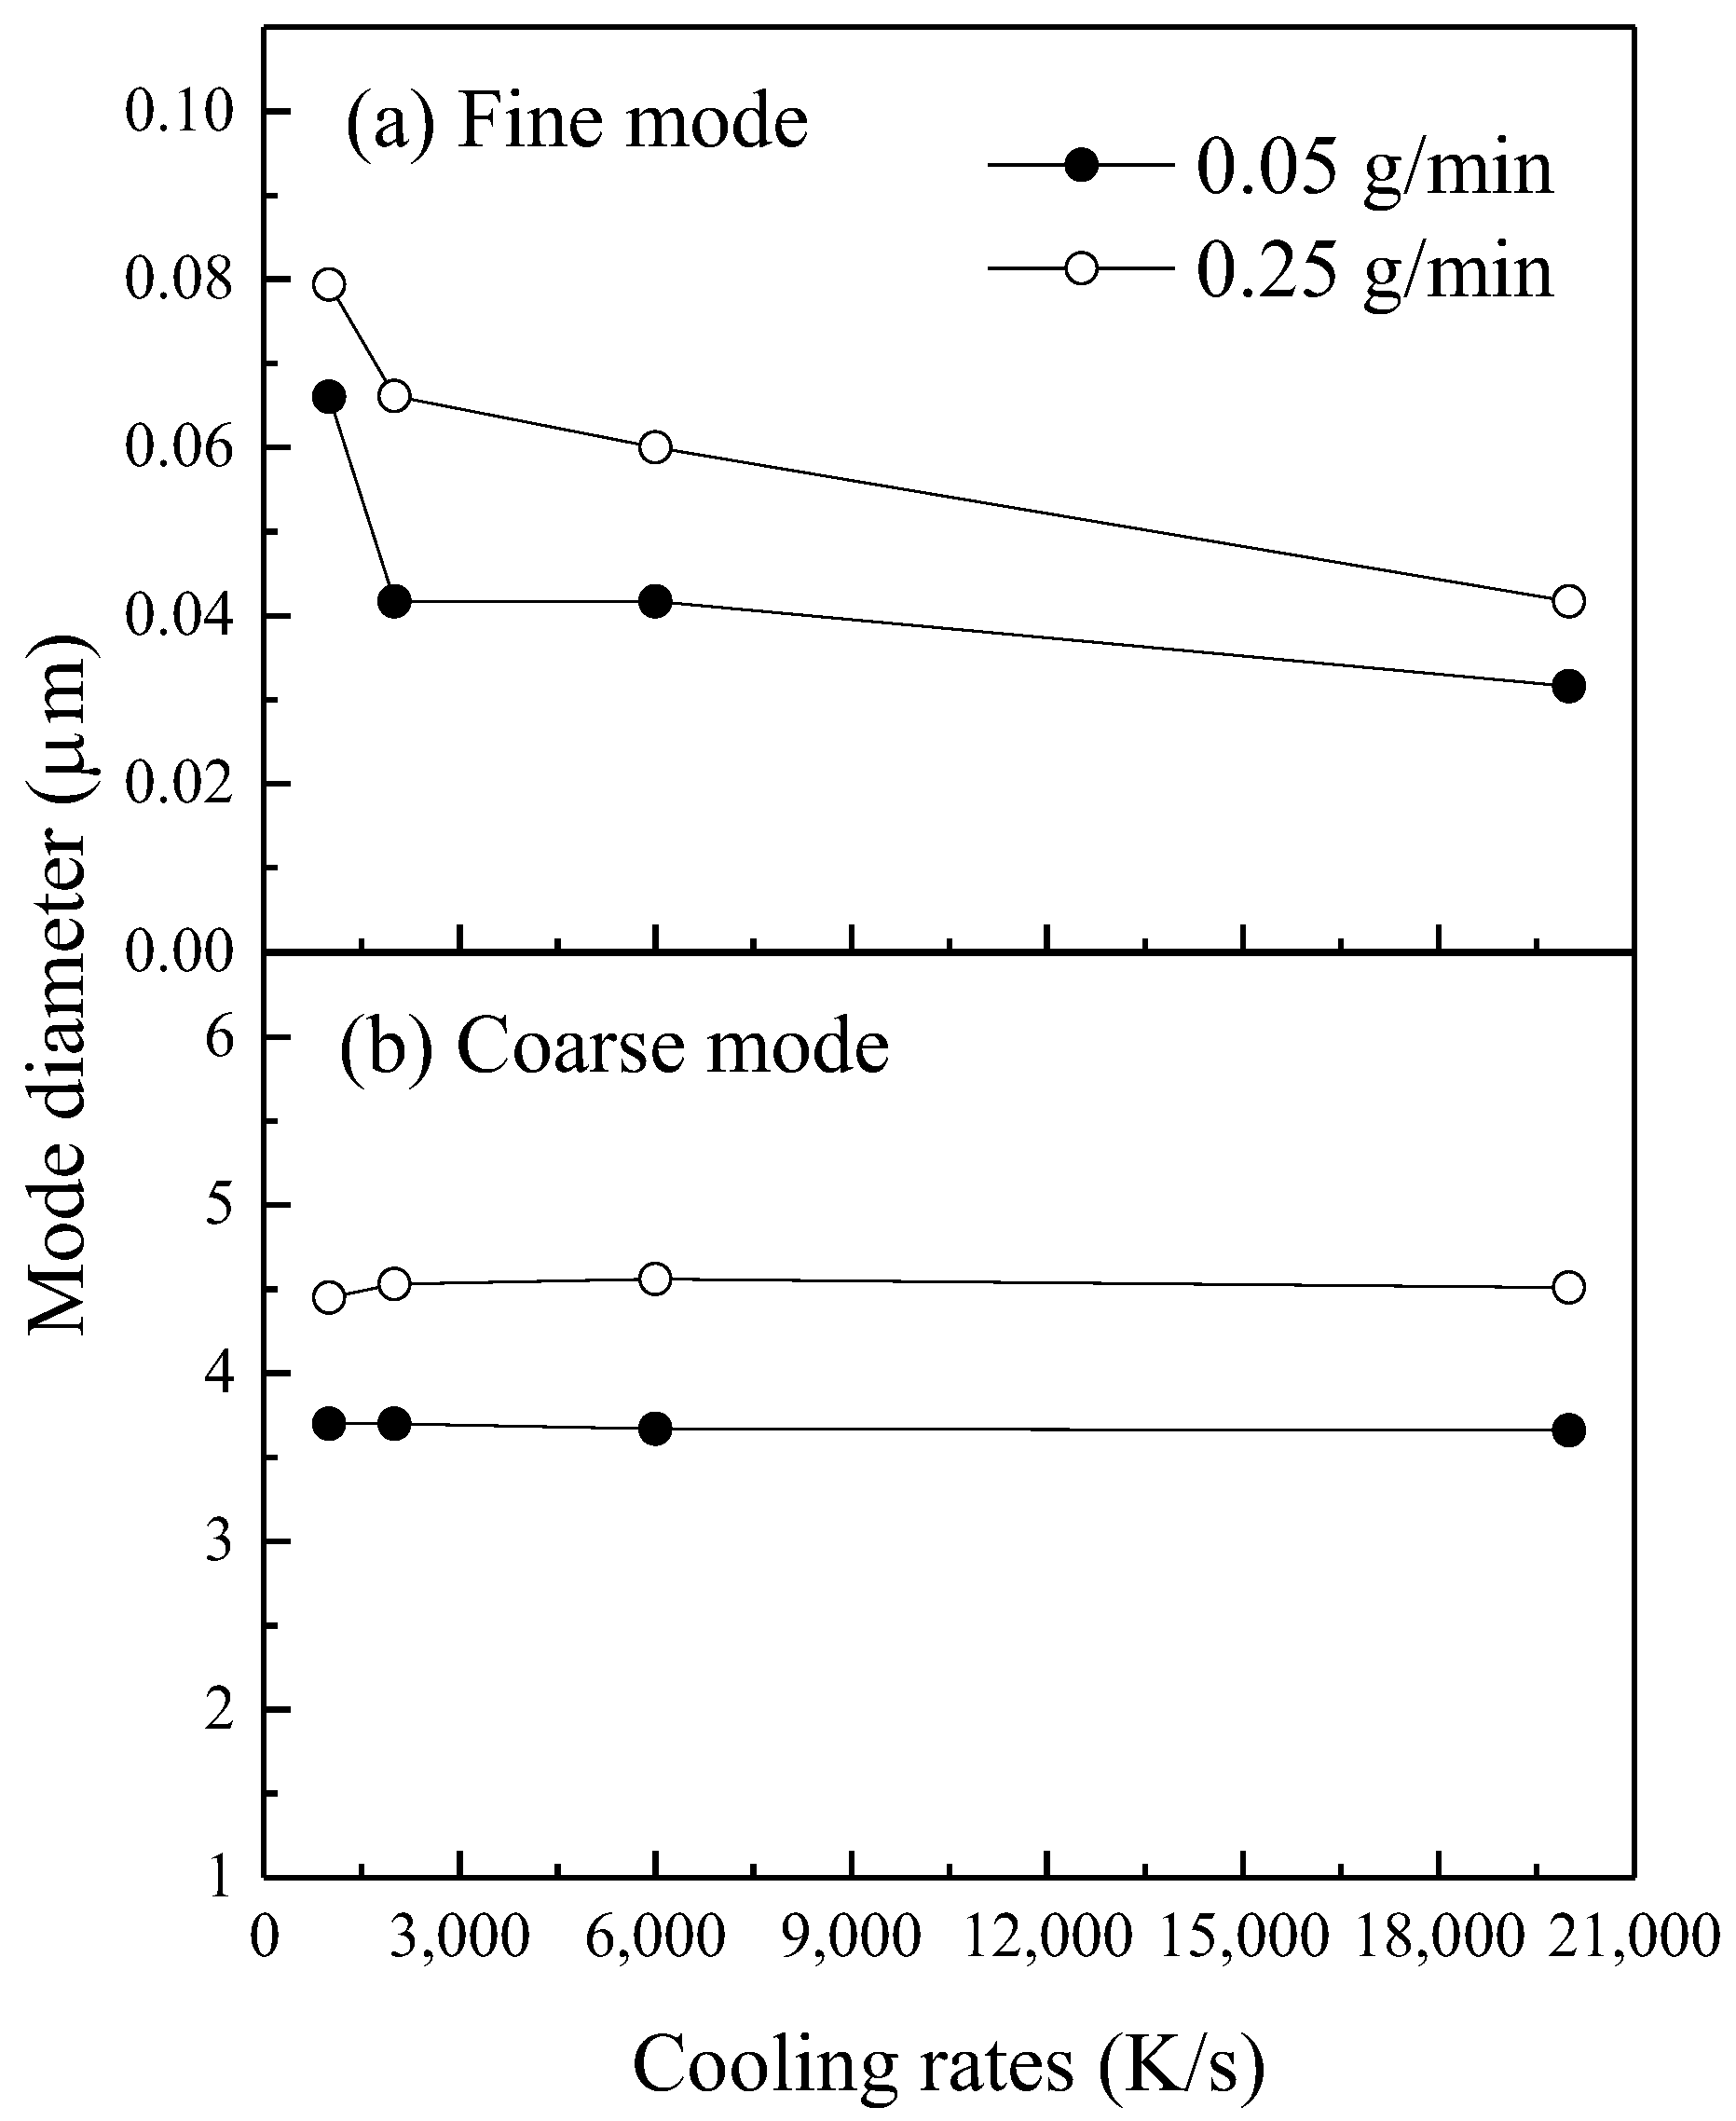
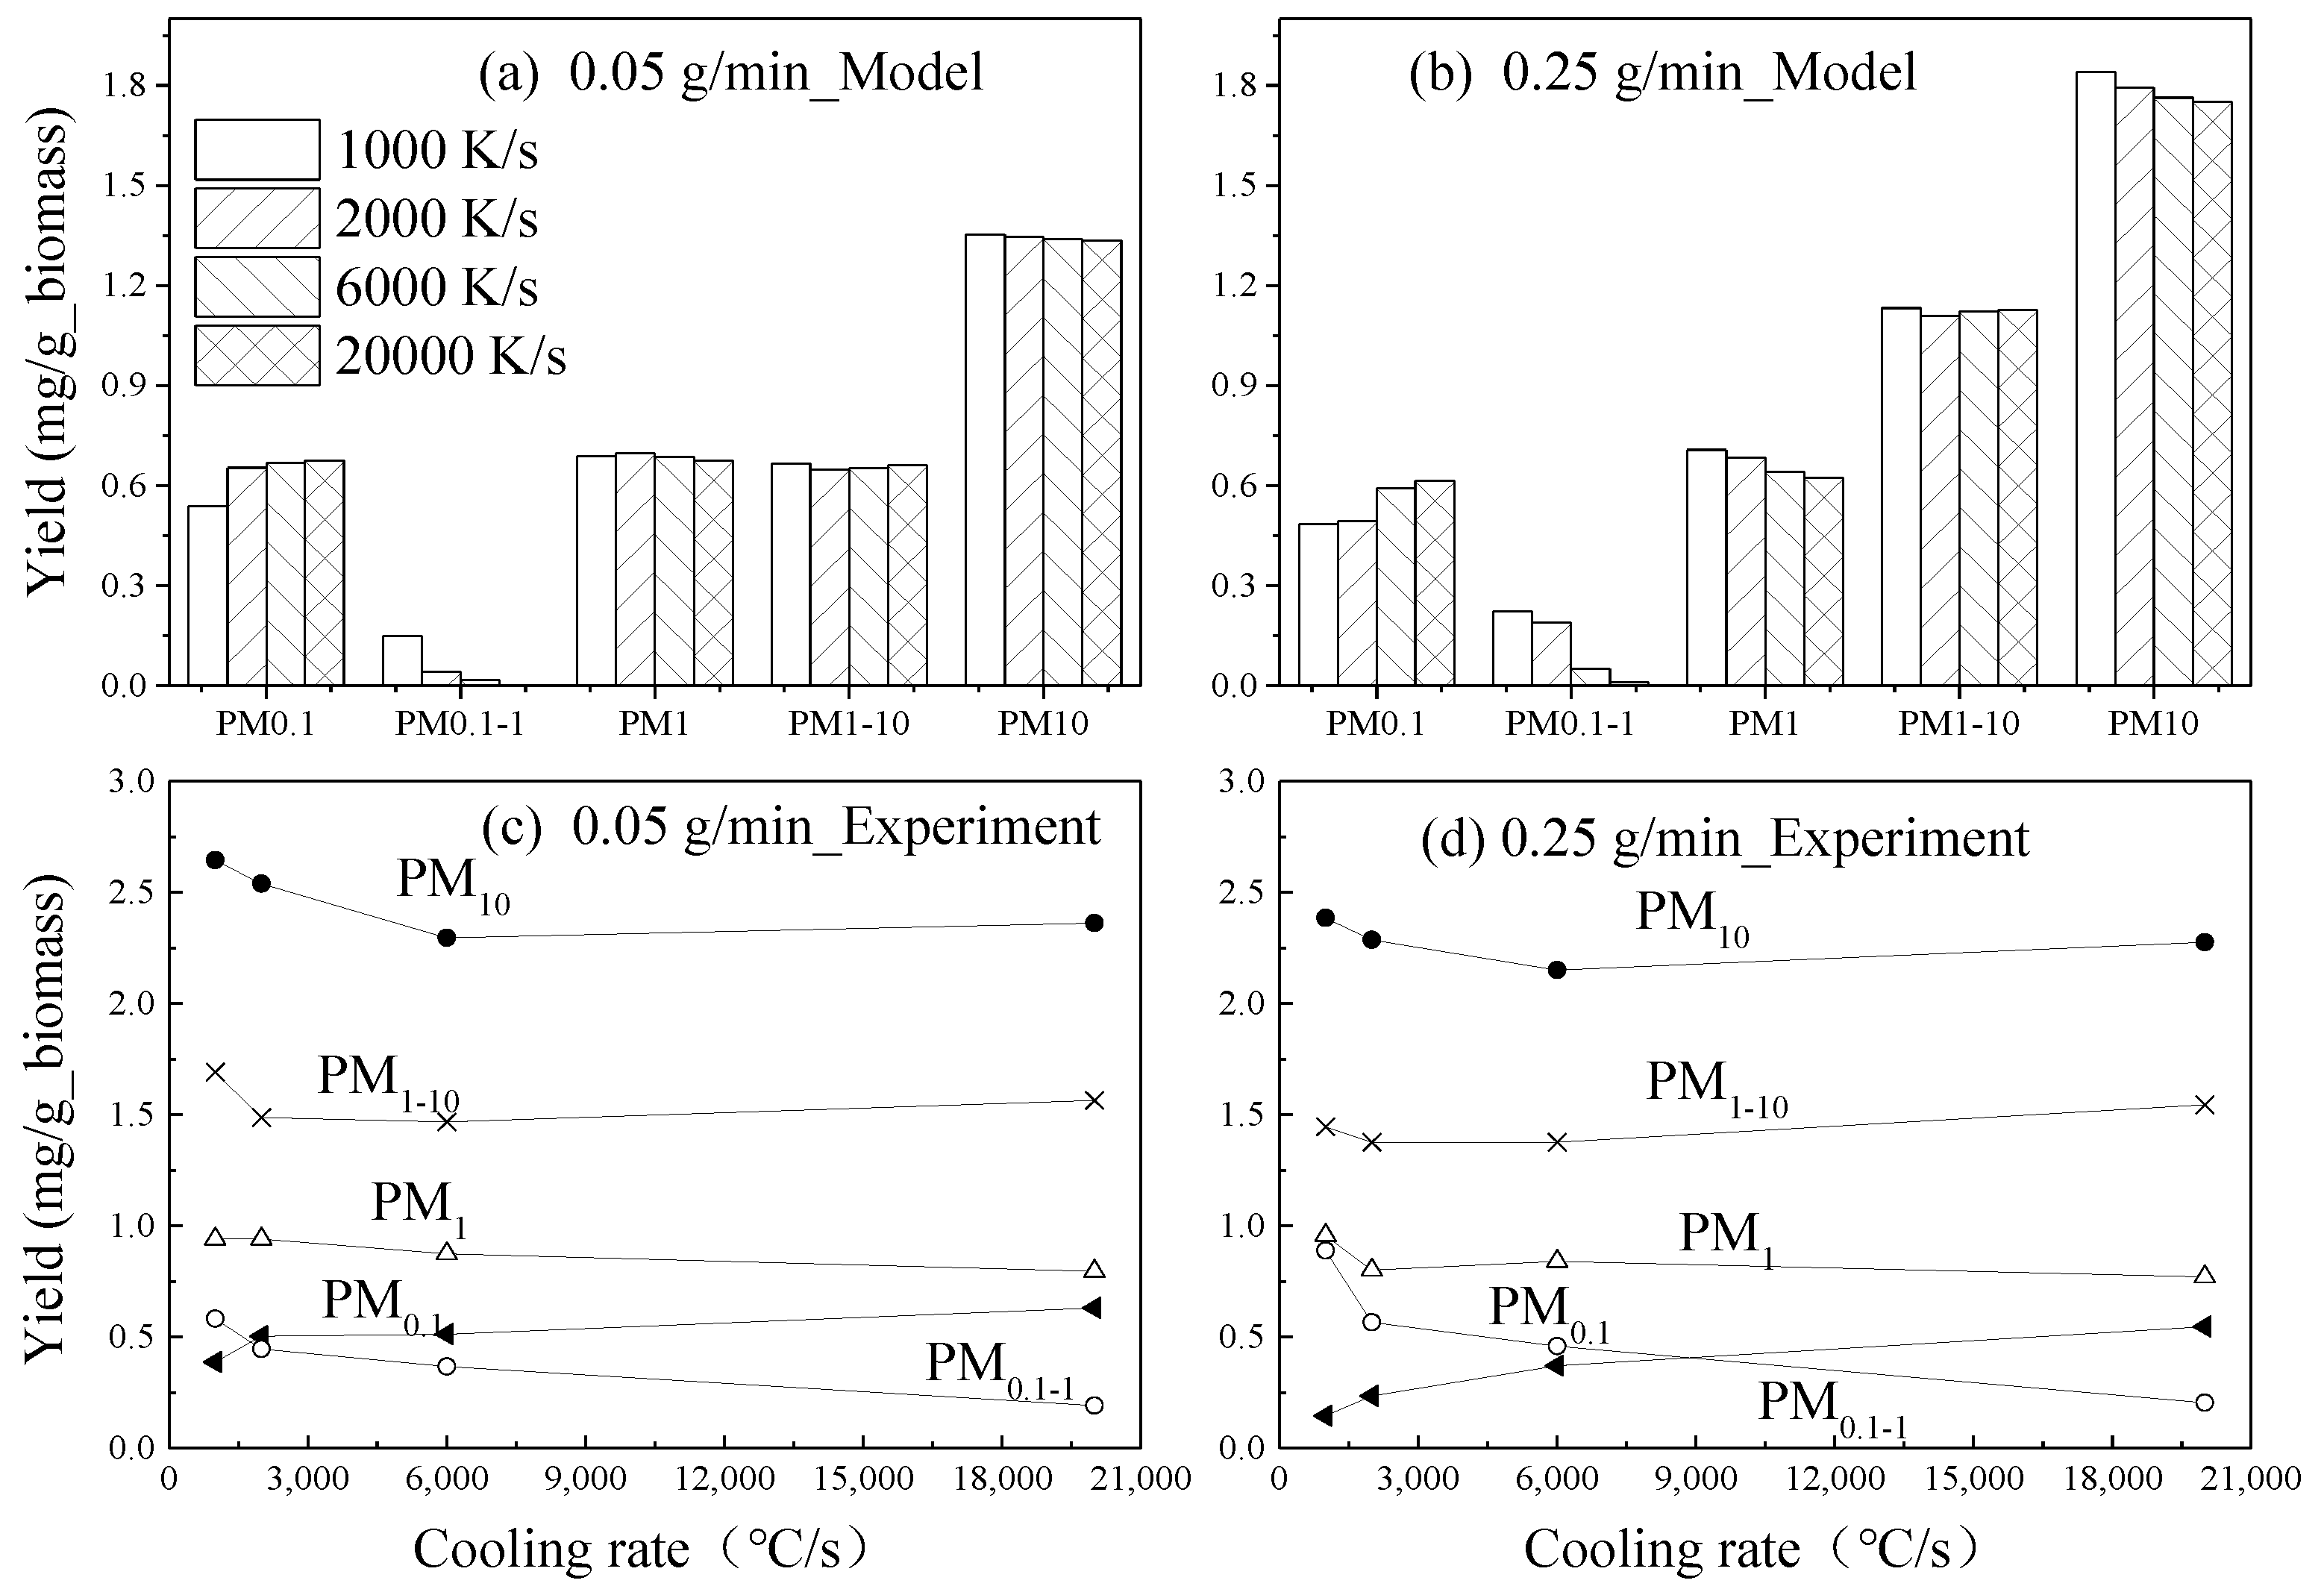
3.2. The Properties of PM10 and Its Elements
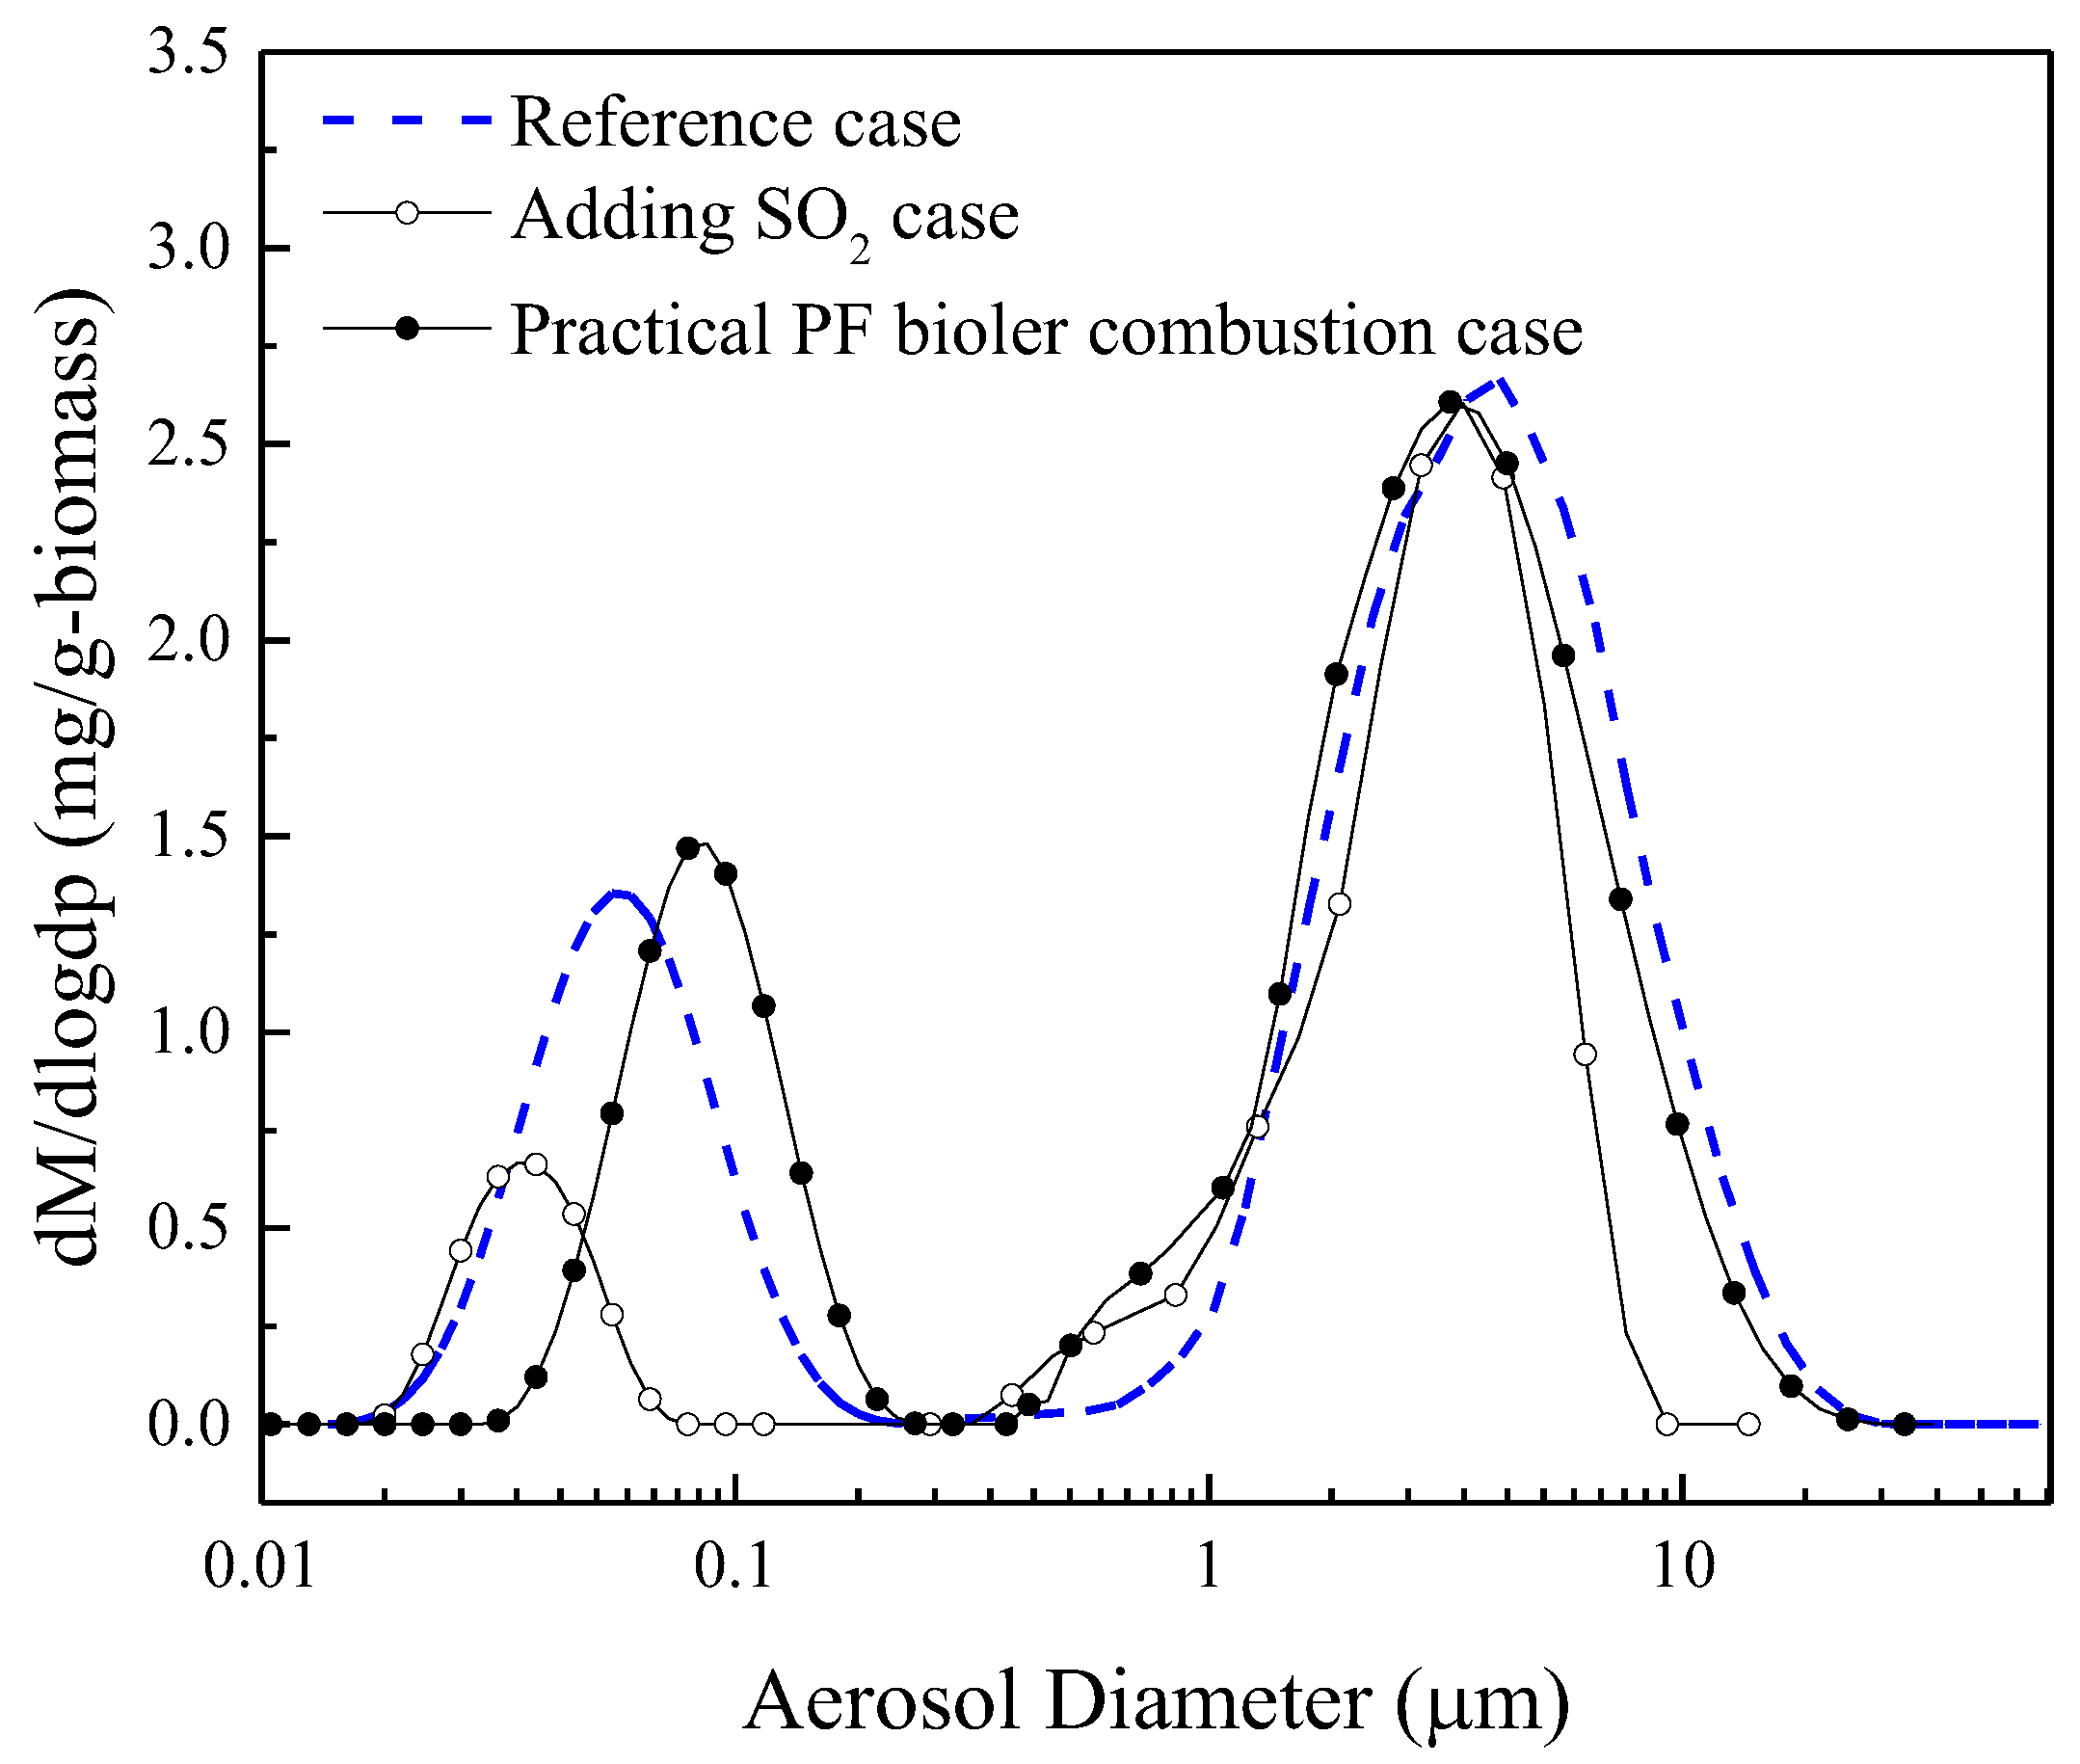
3.3. Further Numerical Research
- (1)
- Practical PF boiler combustion case: air–fuel ratio is about 1.25, cooling rate is 400 °C/s.
- (2)
- Adding SO2 case: biomass feeding rate is 0.05 g/min and cooling rate is 1000 °C/s, adding 50 ppm SO2, 5% H2O, and 5% O2 to flue gas.
- (3)
- Reference case: biomass feeding rate is 0.05 g/min and cooling rate is 1000 °C/s.
4. Conclusions
Author Contributions
Funding
Institutional Review Board Statement
Informed Consent Statement
Data Availability Statement
Conflicts of Interest
Nomenclature
| the percentage of the sieved mass with the size larger than dp | |
| diameter of fuel particle, µm | |
| the parameter to characterize the fineness of the fuel particles, µm | |
| the index to define the uniformity of the fuel particle sizes | |
| the ash particle size, µm | |
| the fuel density, kg/m3 | |
| the ash density, kg/m3 | |
| the mass of a single fuel particle, kg | |
| the mass of a single ash particle, kg | |
| the ash content of the biomass | |
| the mass fraction of the ash released into gas phase | |
| the average breaking times | |
| the breaking times of a single particle | |
| C(i) | Volume fraction of matter i |
| Growth rate of the critical cluster of matter i, mol/(m3·s) | |
| , | Cunningham sliding factor of particles k and i |
| the diameter of an existing particle, µm | |
| D | Gas molecular diffusion rate, m2/s |
| Coefficient of correction | |
| Boltzmann constant, 1.3806 × 10⁻²³ J/K | |
| Knudsen number | |
| Molecular mass of matter i, kg | |
| Avogadro constant, 6.022 × 1026/mol | |
| Equilibrium concentration of critical clusters, 1/m3 | |
| Vapor pressure of species i, Pa | |
| Saturated vapor pressure of matter i, Pa | |
| Vapor pressure of the vapor on the surface of the existing particles, Pa | |
| Vapor pressure on an infinite plane, Pa | |
| Rg | Gas constant, 8.314 J/(mol·K) |
| S | Saturation ratio |
| T | Temperature, K |
| Zerdovich factor | |
| Surface tension, N/m | |
| Particle density of species i, kg/m3 | |
| Average free path of gas molecules, m | |
| Number concentration of particle k, 1/m3 | |
| Collision rate of particles (particles i and k), m3/s | |
| , | Volume of particles k and i, m3 |
| Viscosity of medium, kg/(m·s) |
References
- Baxter, L. Biomass-coal co-combustion: Opportunity for affordable renewable energy. Fuel 2005, 84, 1295–1302. [Google Scholar] [CrossRef] [Green Version]
- Livingston, W.R. The Status of Large Scale Biomass Firing—The Milling and Combustion of Biomass Materials in Large Pulverized Coal Boilers; IEA Bioenergy: Paris, France, 2016; p. 88. ISBN 978-1-910154-26-7. [Google Scholar]
- Yin, C. Development in biomass preparation for suspension firing towards higher biomass shares and better boiler performance and fuel range ability. Energy 2020, 196, 117–129. [Google Scholar] [CrossRef]
- Hansen, S.B.; Jensen, P.A.; Frandsen, F.J.; Wu, H.; Bashir, M.S.; Wadenbäck, J.; Sander, B.; Glarborg, P. Deposit probe measurements in large biomass-fired grate boilers and pulverized-fuel boilers. Energy Fuels 2014, 28, 3539–3555. [Google Scholar] [CrossRef]
- Nielsen, H.; Frandsen, F.; Damjohansen, K.; Baxter, L.L. The implications of chlorine-associated corrosion on the operation of biomass-fired boilers. Prog. Energy Combust. Sci. 2000, 26, 283–298. [Google Scholar] [CrossRef]
- Zheng, Y.; Jensen, A.D.; Johnsson, J.E. Deactivation of V2O5-WO3-TiO2 SCR catalyst at a biomass-fired combined heat and power plant. Appl. Catal. B Environ. 2005, 60, 253–264. [Google Scholar] [CrossRef] [Green Version]
- Schill, L.; Fehrmann, R. Strategies of coping with deactivation of NH3-SCR catalysts due to biomass firing. Catalysts 2018, 8, 135. [Google Scholar] [CrossRef] [Green Version]
- Olsen, B.K.; Kügler, F.; Castellino, F.; Jensen, A.D. Poisoning of vanadia based SCR catalysts by potassium: Influence of catalyst composition and potassium mobility. Catal. Sci. Technol. 2016, 6, 2249–2260. [Google Scholar] [CrossRef] [Green Version]
- Nielsen, L.B.; Livbjerg, H. Combustion Aerosols from Potassium-Containing Fuels. Ph.D. Thesis, Technical University of Denmark (DTU), Lyngby, Denmark, 1998. [Google Scholar]
- Wang, X.; Hu, Z.; Adeosun, A.; Liu, B.; Ruan, R.; Li, S.; Tan, H. Particulate matter emission and K/S/Cl transformation during biomass combustion in an entrained flow reactor. J. Energy Inst. 2018, 91, 835–844. [Google Scholar] [CrossRef]
- Damoe, A.J.; Wu, H.; Frandsen, F.J.; Glarborg, P.; Sander, B. Impact of coal fly ash addition on combustion aerosols (PM2.5) from full-scale suspension-firing of pulverized wood. Energy Fuels 2014, 28, 3217–3223. [Google Scholar] [CrossRef]
- Jiang, L.; Sheng, C. Correlation of sub-micrometer ash formation from pulverized biomass combustion with ash composition. Energy Fuels 2019, 33, 5893–5902. [Google Scholar] [CrossRef]
- Wang, Y.; Li, X.; Wendt, J.O.L. On ash deposition rates from air and oxy-combustion of pulverized coal pretroleum coke and biomass. Energy Fuels 2019, 33, 5849–5858. [Google Scholar] [CrossRef]
- Xu, M.; Yu, D.; Yao, H.; Liu, X.; Qiao, Y. Coal combustion-generated aerosols: Formation and properties. Proc. Combust. Inst. 2011, 33, 1681–1697. [Google Scholar] [CrossRef]
- Liaw, S.B.; Wu, H. Importance of flue gas cooling conditions in particulate matter formation during biomass combustion under conditions pertinent to pulverized fuel applications. Proc. Combust. Inst. 2021, 38, 5201–5208. [Google Scholar] [CrossRef]
- Gao, X.; Wu, H. Combustion of volatiles produced in situ from the fast pyrolysis of woody biomass: Direct evidence on its substantial contribution to sub-micrometer particle (PM1) emission. Energy Fuels 2011, 25, 4172–4181. [Google Scholar] [CrossRef]
- Liaw, S.B.; Deng, C.; Wu, H. A novel two-stage alumina reactor system for burning volatiles generated in situ from biosolid: Effect of pyrolysis temperature and combustion conditions on PM1 emission. Energy Fuels 2018, 32, 9438–9447. [Google Scholar] [CrossRef]
- Gao, X.; Wu, H. Biochar as a fuel: 4. Emission behavior and characteristics of PM1 and PM10 from the combustion of pulverized biochar in a drop-tube furnace. Energy Fuels 2011, 25, 2702–2710. [Google Scholar] [CrossRef]
- Christensen, K.A.; Stenholm, M.; Livbjerg, H. The formation of submicron aerosol particles, HCl and SO2 in straw-fired boilers. J. Aerosol Sci. 1998, 29, 421–444. [Google Scholar] [CrossRef]
- Jöller, M.; Brunner, T.; Obernberger, I. Modeling of aerosol formation during biomass combustion for various furnace and boiler types. Fuel Process. Technol. 2007, 88, 1136–1147. [Google Scholar] [CrossRef]
- Christensen, K.A.; Livbjerg, H. A plug flow model for chemical reactions and aerosol nucleation and growth in an alkali-containing flue gas. Aerosol Sci. Technol. 2000, 33, 470–489. [Google Scholar] [CrossRef] [Green Version]
- Haykiri-Acma, H.; Baykan, A.; Yaman, S.; Kucukbayrak, S. Effects of fragmentation and particle size on the fuel properties of hazelnut shells. Fuel 2013, 112, 326–330. [Google Scholar] [CrossRef]
- Hansen, S.B.; Glarborg, P.; Jappe Frandsen, F.; Jensen, P.A. Model for Deposition Build-Up in Biomass Boilers. Ph.D. Thesis, Technical University of Denmark, Lyngby, Denmark, 2015. [Google Scholar]
- Kassman, H.; Bäfver, L.; Åmand, L. The importance of SO2 and SO3 for sulphation of gaseous KCl—An experimental investigation in a biomass fired CFB boiler. Combust. Flame 2010, 157, 1649–1657. [Google Scholar] [CrossRef]
- Wu, H.; Bashir, M.S.; Jensen, P.A.; Sander, B.; Glarborg, P. Impact of coal fly ash addition on ash transformation and deposition in a full-scale wood suspension-firing boiler. Fuel 2013, 113, 632–643. [Google Scholar] [CrossRef]
- Xu, M.; Yue, A.; Sheng, C. Modeling K-containing vapors transforming into sub-micrometer particles in flue gas of pulverized straw combustion. Energy Fuels 2020, 34, 440–449. [Google Scholar] [CrossRef]
- Jensen, J.R.; Nielsen, L.B.; Schultz-Møller, C.; Wedel, S.; Livbjerg, H. The nucleation of aerosols in flue gases with a high content of alkali—A laboratory study. Aerosol Sci. Technol. 2000, 33, 490–509. [Google Scholar] [CrossRef]
- Xu, M.; Sheng, C. Modelling particle size distribution of residual fly ash from pulverized biomass combustion. J. Biobased Mater. Bioenergy 2021, 15, 75–82. [Google Scholar] [CrossRef]
- Korbee, R.; Shah, K.V.; Cieplik, M.K.; Betrand, C.I.; Vuthaluru, H.B.; van de Kamp, W.L. First line ash transformations of coal and biomass fuels during PF combustion. Energy Fuels 2010, 24, 897–909. [Google Scholar] [CrossRef]
- Frandsen, F.J. Ash Formation, Deposition and Corrosion When Utilizing Straw for Heat and Power Production. Ph.D. Thesis, Technical University of Denmark, Kongens Lyngby, Denmark, 2011. [Google Scholar]
- Biagini, E.; Narducci, P.; Tognotti, L. Size and structural characterization of lignin-cellulosic fuels after the rapid devolatilization. Fuel 2008, 87, 177–186. [Google Scholar] [CrossRef]
- Holmgren, P.; Wagner, D.R.; Strandberg, A.; Molinder, R.; Wiinikka, H.; Umeki, K.; Broström, M. Size, shape, and density changes of biomass particles during rapid devolatilization. Fuel 2017, 206, 342–351. [Google Scholar] [CrossRef]
- Rosendahl, L.A.; Yin, C.; Kær, S.K.; Friborg, K.; Overgaard, P. Physical characterization of biomass fuels prepared for suspension firing in utility boilers for CFD modelling. Biomass Bioenergy 2007, 31, 318–325. [Google Scholar] [CrossRef]
- Zeuthen, F.J.; Livbjerg, H.; Glarborg, P.; Jappe Frandsen, F. The Formation of Aerosol Particles during Combustion of Biomass and Waste. Ph.D. Thesis, Technical University of Denmark, Lyngby, Denmark, 2007. [Google Scholar]
- Seinfeld, J.H.; Prandis, S.N. Atmospheric Chemistry and Physics of Air Pollution: From Air Pollution to Climate Change, 2nd ed.; John Wiley & Sons: New York, NY, USA, 2006; pp. 491–505. [Google Scholar]
- Hu, Z.; Wang, X.; Ruan, R.; Li, S.; Bai, S.; Zhang, J.; Tan, H. Effect of SO2 addition on PM Formation From Biomass Combustion In An Entrained Flow Reactor. Energy Fuels 2018, 32, 11030–11037. [Google Scholar] [CrossRef]
- Dahneke, B. Simple Kinetic Theory of Brownian Diffusion in Vapors and Aerosols; Meyer, R.E., Ed.; Academic Press: New York, NY, USA, 1983; pp. 97–138. [Google Scholar]
- Allen, M.D.; Raabe, O. Slip correction measurements of spherical solid aerosol particles in an improved Millikan apparatus. Aerosol Sci. Technol. 1985, 4, 269–286. [Google Scholar] [CrossRef]
- Jöller, M.; Brunner, T.; Obernberger, I. Modeling of aerosol formation during biomass combustion in grate furnaces and comparison with measurements. Energy Fuels 2005, 19, 311–323. [Google Scholar] [CrossRef]
- Damoe, A.J.; Jensen, P.A.; Frandsen, F.J.; Wu, H.; Glarborg, P. Fly ash formation during suspension firing of biomass: Effects of residence time and fuel type. Energy Fuels 2017, 31, 555–570. [Google Scholar] [CrossRef]


| Biomass Feeding Rates /g min−1 | Cooling Rate /°C·s−1 | Initial Nuclei Number Concentration/107 cm−3 | Initial Nuclei Size/nm | Nucleation Temperature /°C |
|---|---|---|---|---|
| 0.05 | 1000 | 2.6 | 59.7 | 596 |
| 2000 | 6.18 | 45.1 | 594 | |
| 6000 | 6.21 | 45.2 | 593 | |
| 20,000 | 21.8 | 30.3 | 588 | |
| 0.25 | 1000 | 5.87 | 75.2 | 652 |
| 2000 | 8.96 | 65.9 | 650 | |
| 6000 | 17.9 | 52.4 | 650 | |
| 20,000 | 32.9 | 43.4 | 646 |
Publisher’s Note: MDPI stays neutral with regard to jurisdictional claims in published maps and institutional affiliations. |
© 2022 by the authors. Licensee MDPI, Basel, Switzerland. This article is an open access article distributed under the terms and conditions of the Creative Commons Attribution (CC BY) license (https://creativecommons.org/licenses/by/4.0/).
Share and Cite
Xu, M.; Sheng, C. Modeling the Process and Properties of Ash Formation during Pulverized Biomass Combustion. Energies 2022, 15, 4417. https://doi.org/10.3390/en15124417
Xu M, Sheng C. Modeling the Process and Properties of Ash Formation during Pulverized Biomass Combustion. Energies. 2022; 15(12):4417. https://doi.org/10.3390/en15124417
Chicago/Turabian StyleXu, Mingzi, and Changdong Sheng. 2022. "Modeling the Process and Properties of Ash Formation during Pulverized Biomass Combustion" Energies 15, no. 12: 4417. https://doi.org/10.3390/en15124417