Article

Conceptual Study and Development of an Autonomously Operating, Sailing Renewable Energy Conversion System

by
Christopher Rickert
1,
Anurag Mohanan Thevar Parambil
2 and
Mareike Leimeister
3,*
1
Faculty of Production Engineering, University of Bremen, 28359 Bremen, Germany
2
Faculty of Physics and Electrical Engineering, University of Bremen, 28359 Bremen, Germany
3
Department System Technology, Fraunhofer Institute for Wind Energy Systems IWES, Am Luneort 100, 27572 Bremerhaven, Germany
*
Author to whom correspondence should be addressed.
Energies 2022, 15(12), 4434; https://doi.org/10.3390/en15124434
Submission received: 29 April 2022 / Revised: 13 June 2022 / Accepted: 14 June 2022 / Published: 17 June 2022

Abstract

:
With little time left for humanity to reduce climate change to a tolerable level, a highly scalable and rapidly deployable solution is needed that can be implemented by any country. Offshore wind energy in international waters is an underused resource and could even be harnessed by landlocked countries. In this paper, the use of sailing wind turbines operating autonomously in high seas to harvest energy is proposed. The electrical energy that is generated by the wind turbine is converted to a renewable fuel and stored onboard. Later, the fuel will be transferred to shore or to other destinations of use. The presented idea is explored at the system level, where the basic subsystems necessary are identified and defined, such as energy conversion and storage as well as propulsion subsystems. Moreover, various operating possibilities are investigated, including a comparison of different sailing strategies and fuels for storage. Existing ideas are also briefly addressed and an example concept is suggested as well. In this paper, the proposed sailing renewable energy conversion system is explored at a higher level of abstraction. Following up on this conceptual study, more detailed investigations are necessary to determine whether the development of such a sailing renewable energy conversion system is viable from an engineering, economic, and environmental point of view.

Graphical Abstract

1. Introduction

Climate change is well on its way to wreaking havoc. The application of renewable energy is a way of stopping it in its tracks. A huge increase in the demand for renewable energy is expected as the world moves to a carbon-neutral economy. Offshore wind energy is a highly effective way to meet this rising demand, but the sites suitable for the installation of bottom-fixed offshore wind turbines are fairly limited when set in relation to the available ocean area. By means of floating wind turbine systems, more areas can be used for deployment, but still, there are limits.
Thus, there is a need to investigate ways to harness energy from areas further away from the shore and in the high seas (also known as international waters). The idea of a Sailing Renewable Energy Conversion (SailREC) System is born from this need. A SailREC System is proposed as a technological system capable of harvesting different renewable energy sources, including their conversion and subsequent storage. It is envisioned as an autonomously operating sailing vessel. Such a solution would come with the following advantages over a moored-floating or bottom-fixed wind turbine:
  • Fast realisation and deployment: The SailREC System could be licensed as a ship and operate in international waters provided that favourable legislation is developed in the future under the United Nations Convention on the Law of the Sea (UNCLOS) [1]. Thus, fewer permits and authorisations might be needed;
  • Cost-effectiveness: The design of a SailREC System can be optimised for mass production, causing economies of scale to take effect;
  • Small footprint: Subsea infrastructure, e.g., grid connection and mooring lines, is not required;
  • Tool for energy security: A SailREC System could be used by countries with limited energy resources within their territorial boundaries.
The idea of harnessing energy for areas further away from the shore is not completely new. The state of the art is briefly described in Section 1.1, while the objectives and structure of this paper are outlined in Section 1.2.

1.1. State of the Art

A few ideas and concepts related to SailREC Systems do already exist. Some of these are presented in the following.

1.1.1. Concept of the National Institute of Environmental Studies of Japan

The National Institute of Environmental Studies of Japan (NIES) proposes a floating wind farm that is not moored [2]. The concept has multiple wind turbines arranged in a line on semi-submersible hulls, as shown in Figure 1. The energy is converted to hydrogen by electrolysis of seawater and later transported to shore by a supply ship. The whole platform is mobile, which allows it to avoid storms and increase energy yield. Based on simulation studies, an annual average capacity factor of 42.6% is expected to be achieved [3].

1.1.2. Farwind Concept

Farwind [4]—a spin-off of Ecole Centrale de Nantes—is working on a concept of an autonomous sailing energy ship propelled by wind, as presented in Figure 2. Propulsion is achieved using Flettner rotors. The kinetic energy of the ship is used to generate electrical energy by means of two hydrokinetic turbines attached to the hull. This electric energy can be either stored in batteries or converted further to chemical energy and stored as hydrogen, methanol, or ammonia.

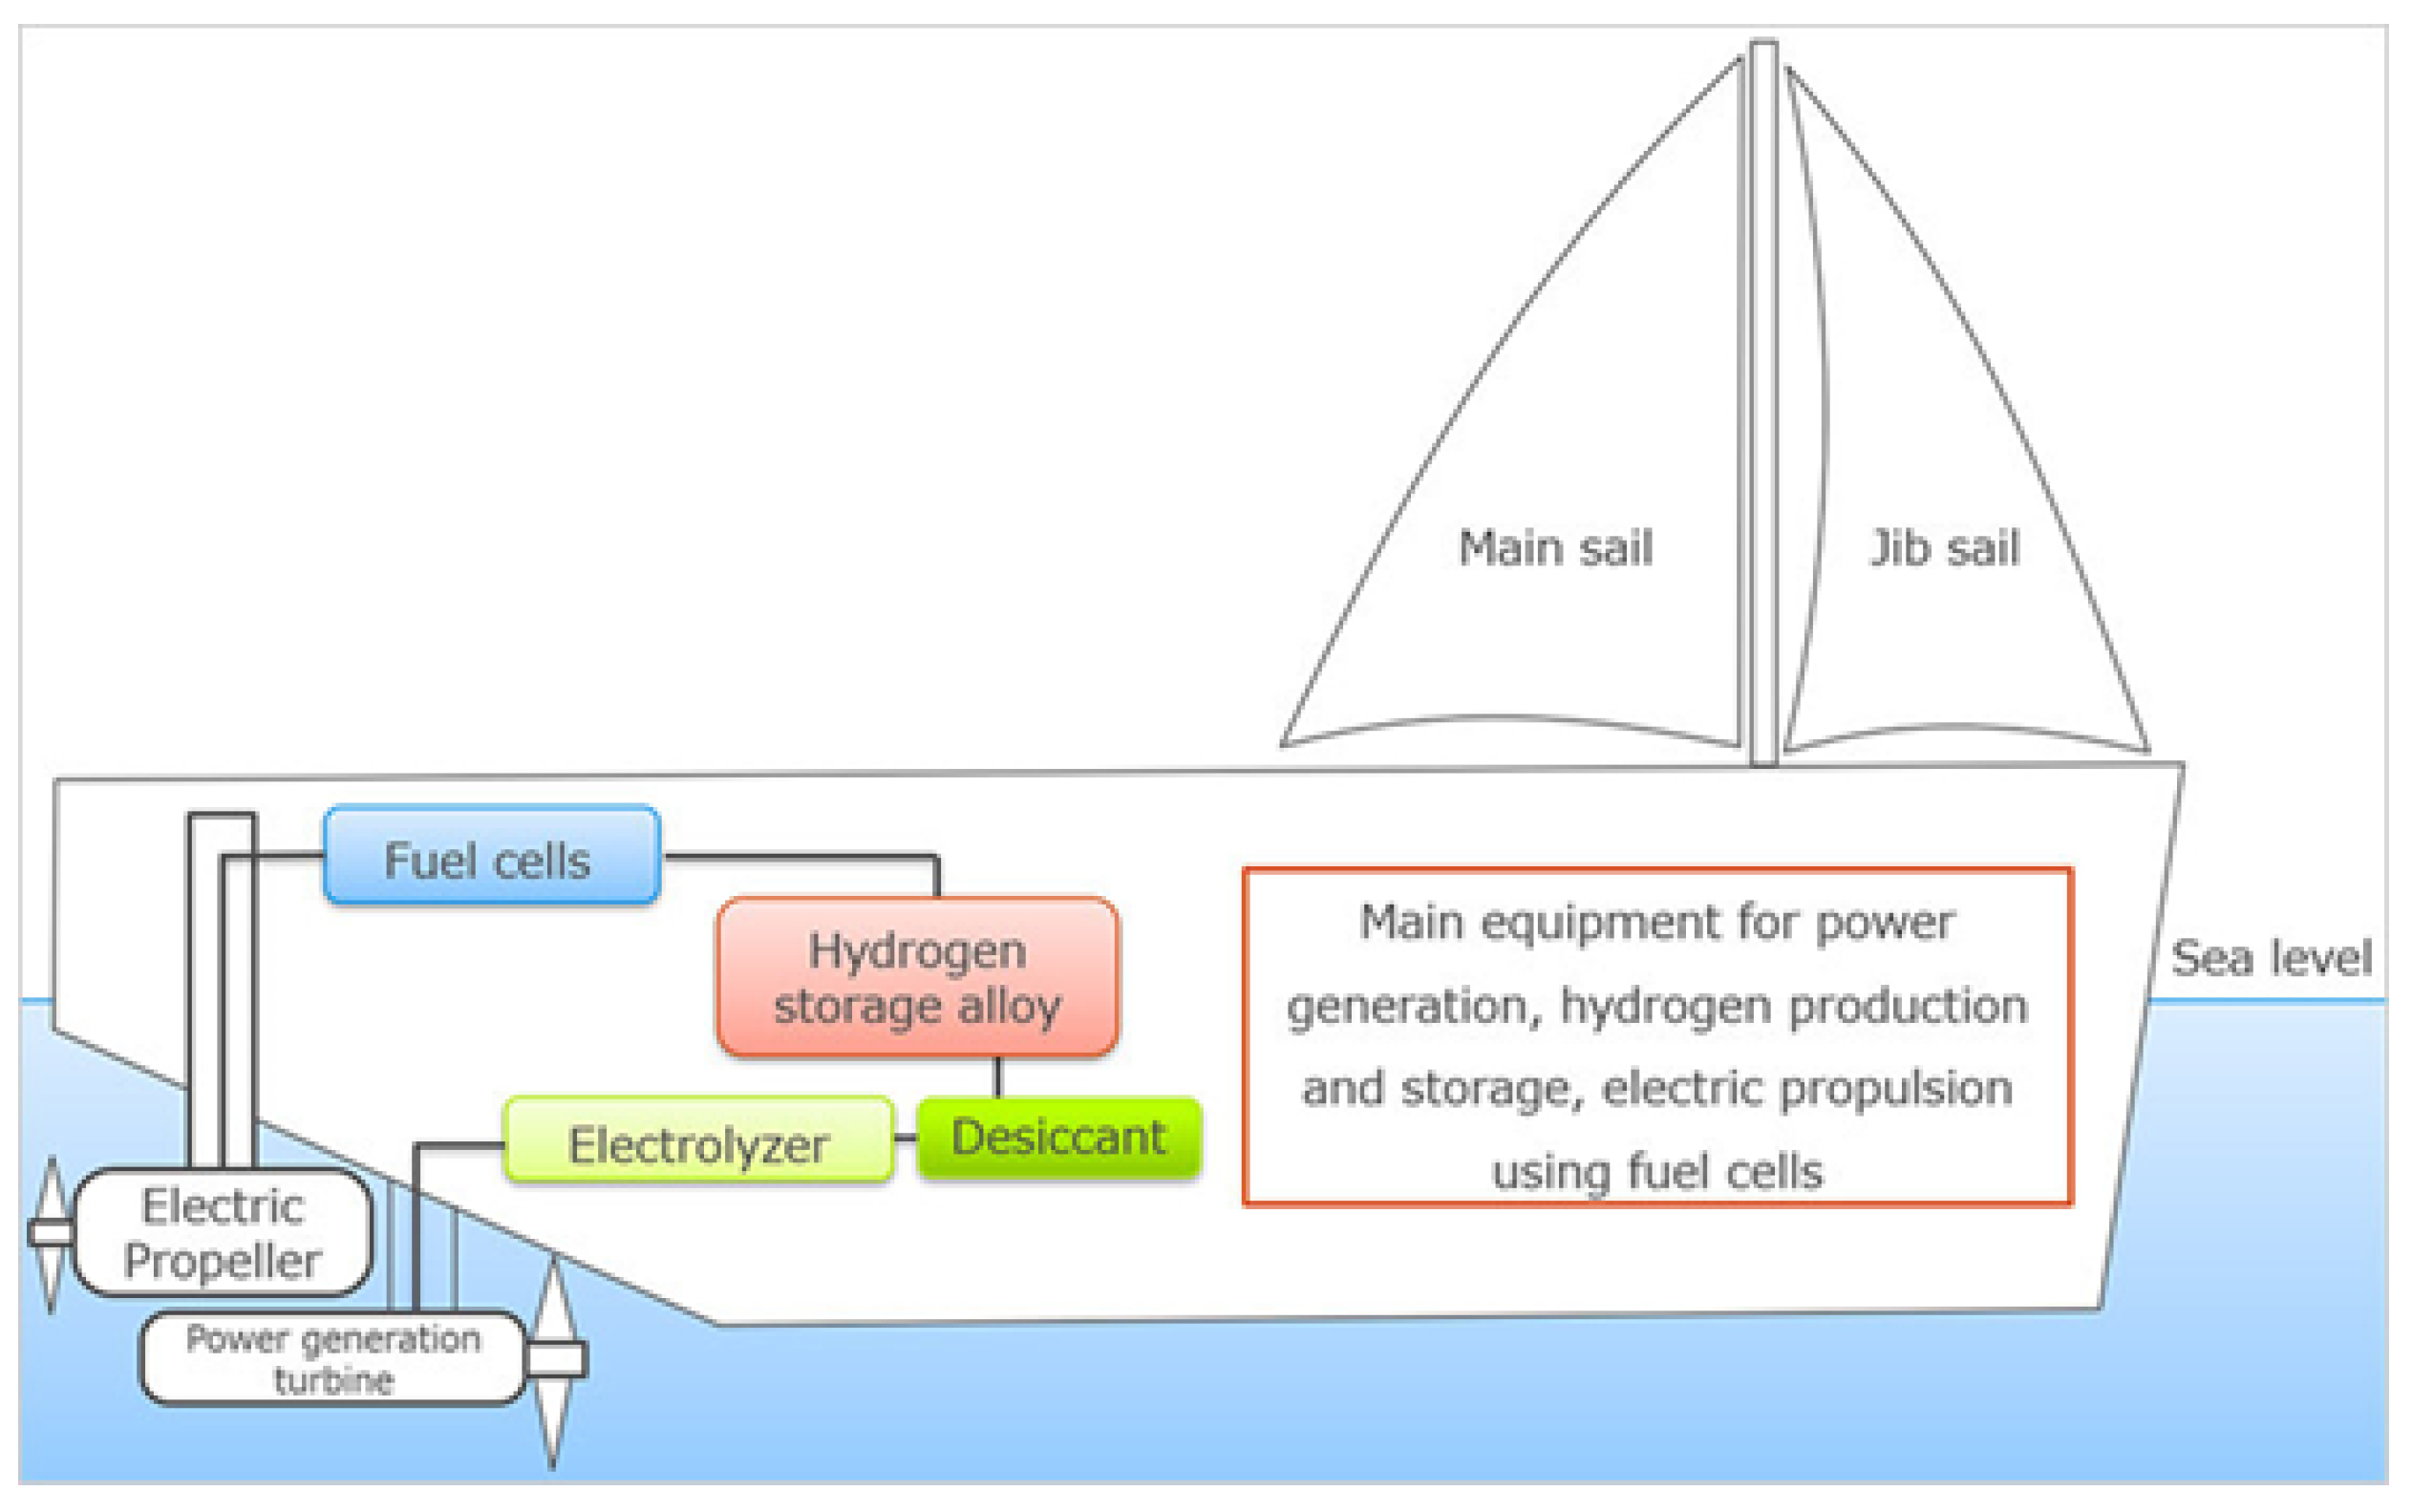
1.1.3. Wind Hunter Project

Another concept [6] being developed in a corporate-academic partnership is the Wind Hunter Project. The aim is to make zero-emission commercial shipping possible using hydrogen fuel and wind power. Energy is harvested using sails and is stored as hydrogen, which will be used for powering a propeller when the wind speed is low (cf. Figure 3 for further details). The concept’s feasibility was demonstrated on a sailing yacht, and the subsystems involved were investigated [7].

1.1.4. Other Concepts

Furthermore, there are numerous patents on related technologies. Raj [8] proposes the idea of harvesting wind, wave, and solar energy and storing it in batteries to be used for propelling a ship, so it can maintain an appropriate speed on a route. Gizara [9] describes the use of a remote-controlled vessel: While sails propel the vessel, energy is harvested by a water turbine and stored as hydrogen. Meller [10] proposes vessels using sails for propulsion. The vessels are propelled along a linear path. The harvested energy is then stored as hydrogen in inflatable containers. Vidal [11] patented the idea of an improved method of propulsion for floating systems that are not moored. An energy recovery method is also mentioned. Salomon [12] describes an idea to use modified sailboats (the sails are kept upright with the help of lighter-than-air balloons instead of masts) for the capture and conversion of wind energy to hydrogen. The generated hydrogen is stored in metal hydride. The transport of stored energy in chemical form is an important step. The supply chain of hydrogen on a pilot scale is demonstrated in the project HySTRA [13]. Within the project, a liquefied hydrogen carrier ship is being built as well as gaseous hydrogen tanks for transport on roadways.

1.2. Research Objectives and Approach
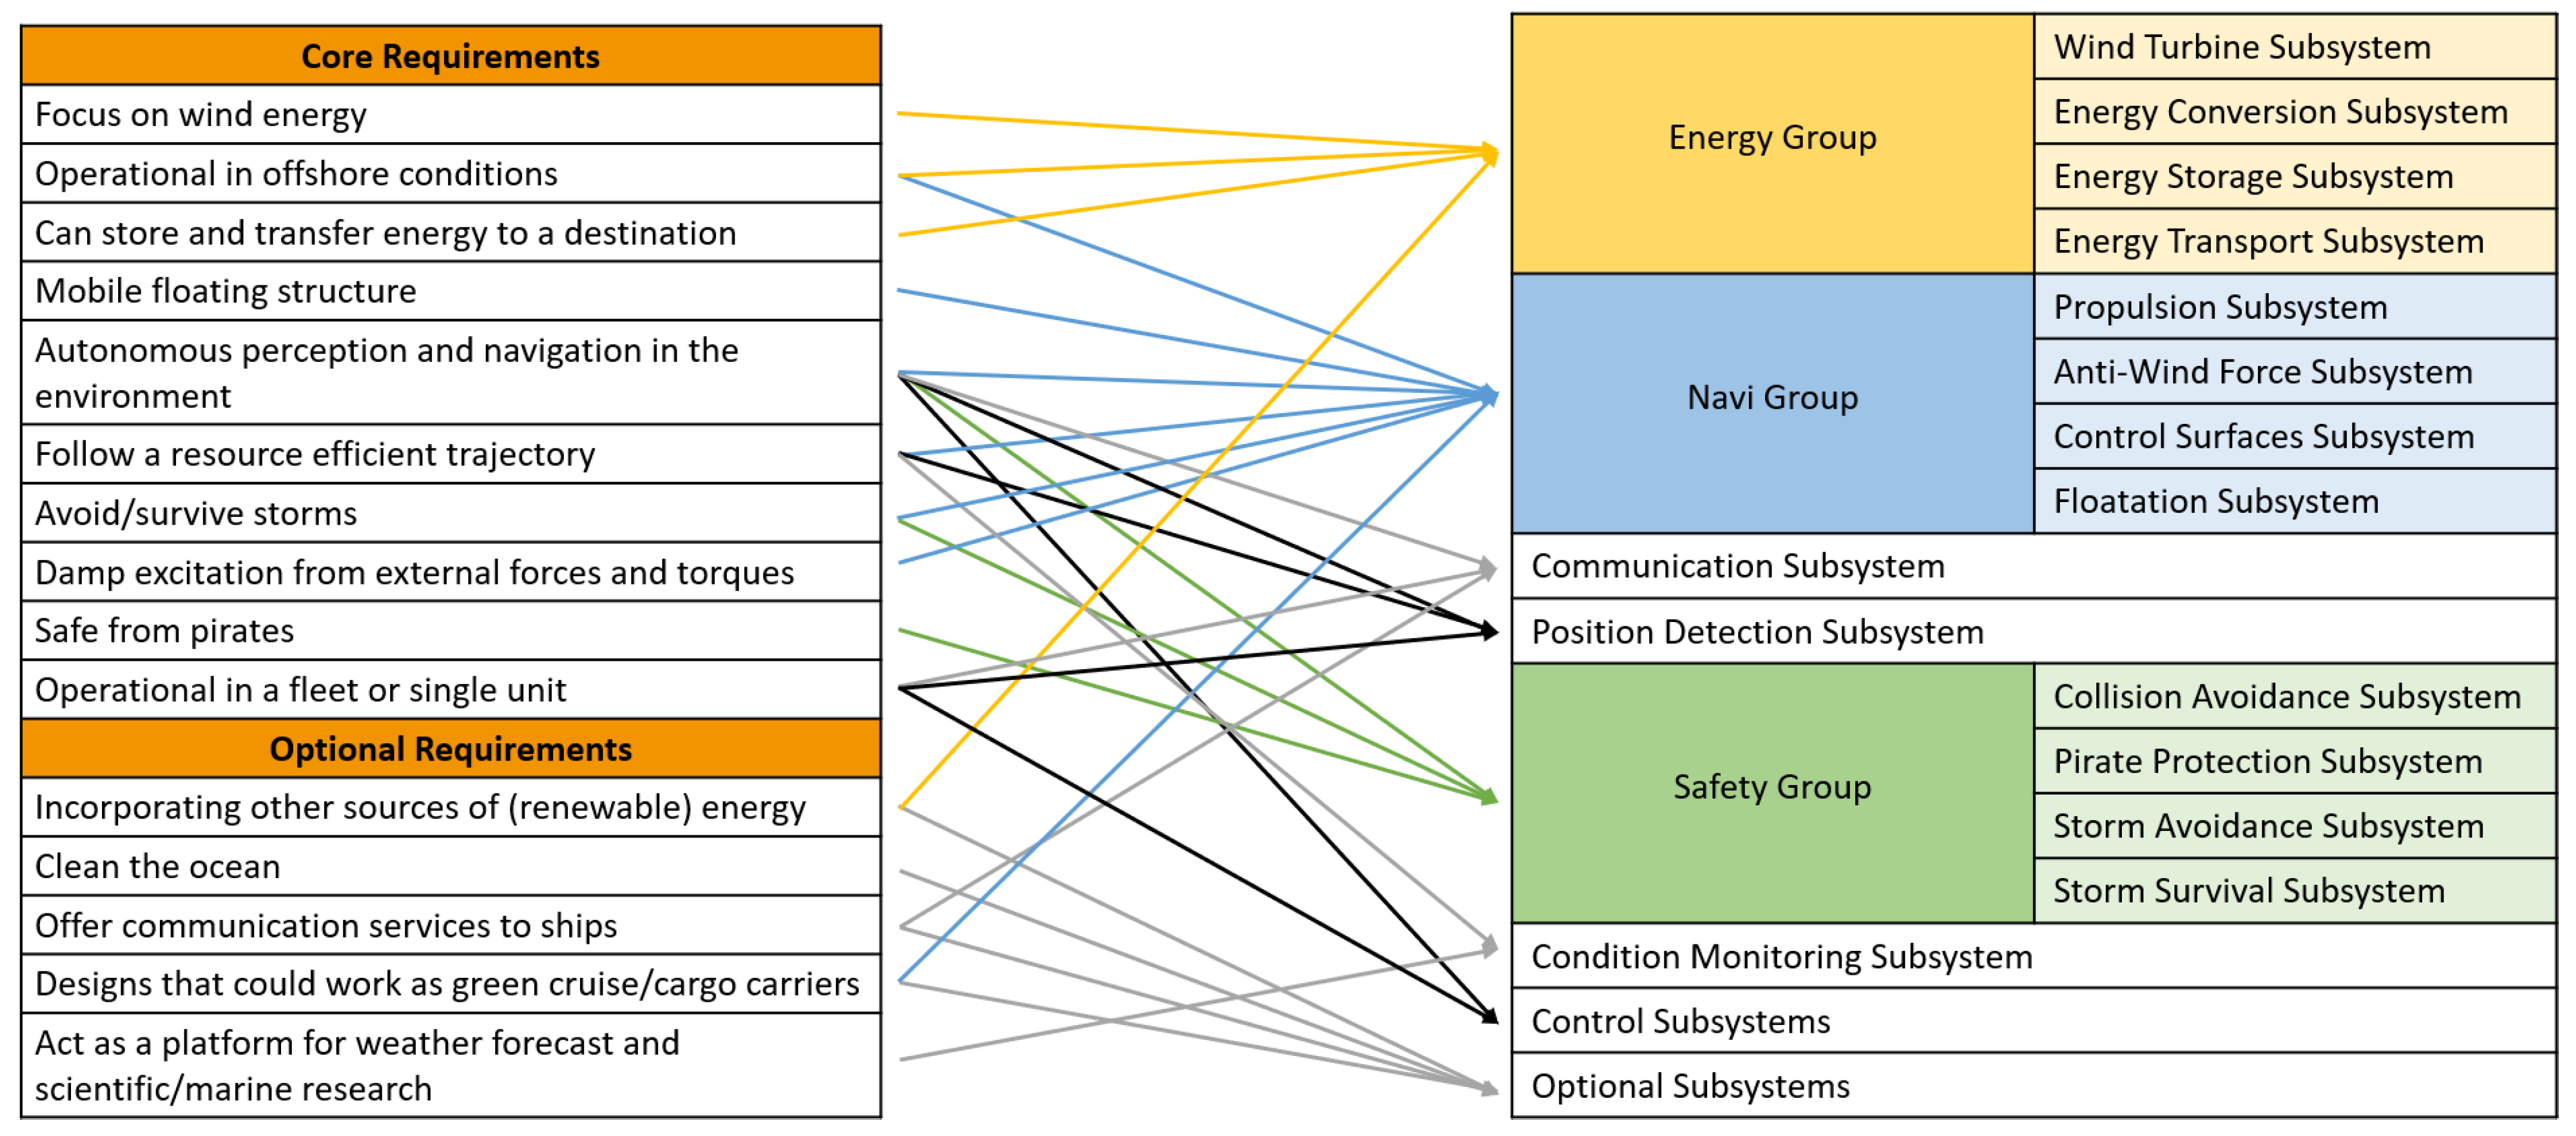
The objective of this paper is the conceptual development of a SailREC System as an autonomously operating sailing vessel that could even be deployed in high seas for harvesting different types of renewable energy. The main focus, however, is initially on wind energy. The concept of a SailREC System is investigated at the system level, and various basic subsystems are identified and defined. These are described in Section 2 along with the underlying method and requirements. Some subsystems, in particular, the Energy Conversion and Energy Storage Subsystems as well as the Propulsion Subsystem, are investigated in detail in Section 3 and Section 4, respectively. Furthermore, different sailing strategies are discussed and assessed with respect to their expected energy yield and ease of technical realisation (Section 5). Based on the detailed investigations into single subsystems, a conceptual SailREC System design is presented in Section 6. Within the context of the discussion and outlook (Section 7), this concept design is set in comparison to the existing ideas for similar system technologies outlined in Section 1.1. Finally, the paper is rounded off with conclusions (Section 8).

2. System Synthesis

In this work, the terminology commonly used for systems engineering is applied [14]. The SailREC System is conceptualised by first revealing the requirements of a floating energy harvesting system. These requirements are then classified as core, optional, and generic requirements. The complete list of requirements is tabulated in Appendix A. Then, the requirements are used to define the subsystems that would be required to fulfill them. Figure 4 shows the requirements and the subsystems that are identified. The subsystems are described in more detail in the following.

2.1. Energy Group

The Energy Group is comprised of subsystems which are part of the generation of energy as well as conversion, storage, and transport thereof.
The Wind Turbine Subsystem is the primary source of energy for a SailREC System as considered in this study. Due to the specific application of the wind turbine on a floating and moving SailREC System without any grid connection, the operational strategies and wind turbine control need to be adjusted.
The electricity generated by the Wind Turbine Subsystem and all other energy plants implemented on a SailREC System is converted by the Energy Conversion Subsystem into renewable fuel. All components necessary for chemical energy conversion, such as electrolysers, storage of chemical precursors, and chemical reactors, belong to this subsystem. The conversion and storage of energy are further elaborated on in Section 3.
The storage of the produced renewable fuel is taken over by the Energy Storage Subsystem.
All the hardware and software necessary to transfer the captured energy to a desired place (e.g., a port or a floating fuel station for ships) belongs to the Energy Transport Subsystem. There are many implementation options for this. In the case that a SailREC System travels on its own to a port to transfer the produced fuel, the Energy Transport Subsystem will likely consist of software for the most part. If, on the other hand, a tanker docks in the open ocean on to the SailREC System to pick up fuel, the tanker belongs to the subsystem.

2.2. Navi Group

The Navi Group is the set of subsystems necessary for making the SailREC System navigable and controllable and to keep it in a stable state of motion in all degrees of freedom.
All the components needed to accelerate the SailREC System in the water make up the Propulsion Subsystem. This facilitates location change, course correction during operation, avoidance of collisions with other vessels, staying away from the coast during storms, and more. It is not a requirement for the Propulsion Subsystem to have both Active and Passive Propulsion Components, however, it can be an advantage. Active Propulsion Components generate a force by themselves and not through an external potential. Their operation would necessitate the use of a power source, which could be stored renewable fuel or electric power. Passive Propulsion Components, on the other hand, generate a force through an external potential applied to the SailREC System. This could be a sail or a Flettner rotor. The Wind Turbine Subsystem itself creates a high thrust force and, hence, can also be used as a Passive Propulsion Component.
Movement of the SailREC System in wind direction decreases the resultant wind velocity on the wind turbine, which results in reduced power output. Thus, the Anti-Wind Force Subsystem compensates or reduces any force that is acting downwind on the system. Not all potential solutions are able to compensate for the wind turbine thrust, but only reduce it. While a water parachute could reduce the thrust, a keel may be able to completely compensate for the thrust in wind direction if the SailREC System would sail perpendicularly to the wind, similarly to a sailing ship.
The Control Surfaces Subsystem comprises surfaces that have fluid flowing over them. These are movable to control the state of motion by changing the angle of attack. The SailREC System can not only have control surfaces in the water but as well in the air. A control surface that likely needs to be implemented is a rudder. How many and which control surfaces will be used depends on the overall design of the SailREC System.
The Floatation Subsystem must be able to withstand the loads to which the SailREC System is subjected at sea, e.g., waves, currents, and overturning moments of the wind turbine. This is realised by the following components: The Buoyancy Component, which could simply be a ship hull, generates buoyancy for the whole system and, hence, compensates for the gravitational force. The Counter Torque Component compensates for torques, such as the torque generated by the thrust on the wind turbine and tower, or the torque applied to the rotor axis of the wind turbine. The Damping Component dampens the SailREC System’s angular oscillations and ensures a stable frequency response to external excitation, bringing the system back to an equilibrium state.

2.3. Communication Subsystem

A Communication Subsystem will be needed for the communication of the SailREC System with other interfaces, e.g., a control centre onshore, other SailREC Systems, ships, or vessels in the vicinity. The Communication Subsystem will be used for the transmission of telemetry data, which will include the sensor and condition monitoring data and can also include scientific data. The Communication Subsystem will be required to receive control commands from an external, onshore control centre. There is also the possibility of using the same transponders to act as an alternate network at sea for ship communication.
The hardware is mainly expected to comprise satellite communication and very high-frequency radio links. A combination of a low-cost and high-capacity, very small aperture service for use in most cases and an alternative service in the L-band can be an option. To ensure that the connection to shore is reliable, two independent communication channels with different systems and frequencies can be used. The end-to-end communication would need to be encrypted so as to protect it from access and threats arising from hostile parties [15,16].

2.4. Position Detection Subsystem

A Position Detection Subsystem is required for a SailREC System to localise itself, primarily for the safety of its own and other vessels. The subsystem will assist on a local level in detecting nearby or approaching vessels and on a global level in tracking them in the high seas. Thus, the Position Detection Subsystem plays a crucial part in making the SailREC System follow the desired trajectory. The positional information is also required for enabling the transfer of fuel in the case of a tanker docking to the SailREC System, or also making the decision of docking to a port if the system is navigating to one.

2.5. Safety Group

The high seas are territories where the deployment of any assets of value will need to be guarded from physical damage due to harsh conditions and theft.
The Collision Avoidance Subsystem is responsible for avoiding collisions with other vessels or other obstacles, such as sea banks. This would involve the use of both Communication and Position Detection Subsystems to detect its own and the positions of vessels in the vicinity, then communicate the expected path with others, involve the control centre if required, and also adapt the course to achieve a margin of safety from collision.
As a SailREC System has resources of value, including fuel or stored energy, machinery, and the material used for construction, it must be protected from theft by using a Pirate Protection Subsystem. Since the SailREC System is envisioned as autonomous, the possible solutions are a design that is hard to access by other parties and steal from, as well as a strategic deployment in areas of operation where hostile activity might be avoided.
The Storm Avoidance Subsystem is responsible for adapting the course of the SailREC System in such a way to avoid storms and other extreme environmental conditions. This subsystem also decides whether an expected storm is too dangerous and should be avoided or passed through. For this task, position data, global weather data, and data from other systems of its kind will likely be used.
The Storm Survival Subsystem is responsible for increasing the chance of survival if an environmental risk factor was underestimated by the Storm Avoidance Subsystem or to improve the stability if areas of extreme environmental conditions need to be passed through. Possible mechanisms may include floodable sections, increasing the draught of the system to reduce the centre of gravity, etc.

2.6. Condition Monitoring Subsystem

There must be sensors used along the SailREC System to track the health of critical subsystems. This can be monitored for safe operation and predictive maintenance of the system. The data acquired by the Condition Monitoring Subsystem is sent out to the control centre through the Communication Subsystem. The SailREC System could also have on-board sensors to monitor the weather, which can be used for trajectory planning, apart from using these data for research and science.

2.7. Control Subsystems

The Central Control Subsystem is the main decision unit of a SailREC System and ensures an autonomous fail-safe operation. The task of this subsystem is to coordinate the work and requirements of all subsystems with a focus on controlling the course of the system to maximise energy yield. It should also be able to keep the SailREC System in safe operation when possible subsystem failures occur.
There will be a need for a control centre onshore for the monitoring and operation of fleets of SailREC Systems. The facility will keep track of and set trajectories for the fleets based on global weather data and will have the ability to take over control from autonomous mode if required. The control centre will also communicate with ships making distress calls when they radio a SailREC System.

2.8. Optional Subsystems

The subsystems described next are optional and are not required for a SailREC System to work. Some of them might have a positive impact on the energy yield or lead to additional revenue.
An Ocean Cleanup Subsystem installed on the SailREC System can be used to clean oceans of floating plastics. A collection mechanism that does not require the use of any power would be ideal. The collected plastic can also be transferred to shore when fuel is transferred. Furthermore, to collect plastics, the subsystem can—depending on the design—increase the hydrodynamic drag in the wind direction, thereby acting as an Anti-Wind Force Subsystem. This would facilitate increased power production by the wind turbine.
The incorporation of additional energy sources, such as solar, wave, or even ocean thermal energy conversion, can be thought of. While such additional subsystems, falling into the Energy Group, will increase the energy output of the SailREC System, their utilisation might not result in a lower cost per unit of energy due to more costly and complex construction and design.
The SailREC System can also transport cargo during its usual operation. The optimal path for maximum energy yield may coincide in part with trading routes. So the transportation of cargo could bring additional revenue. Furthermore, as the mass of the whole system increases, the inertia is increased as well, which can lead to lower drift velocities and, thus, a higher effective wind speed at the wind turbine and, in turn, more generated power.
Just as with cargo, the concept can be extended to include the transport of people with a passenger module. Additional safety features might be required in this case.
An aquafarm incorporated into the SailREC System can also be used for carbon capture and to generate additional resources. The carbon capture can be performed by feeding farmed algae to a pyrolysis reactor.

3. Evaluation of the Energy Conversion Subsystem and Energy Storage Subsystem

In a SailREC System, the energy harvested needs to be converted and stored in chemical form. In Section 3.1, the conversion of renewable power to hydrogen (liquid and gaseous), ammonia, and methanol are discussed as well as the state-of-the-art thereof.—Another option that could be of interest is methane, which, however, is omitted from the analysis. The reason for this decision is the advantages of methanol over methane, such as higher efficiency, lower cost of transportation, and higher volumetric energy density, even though the production costs of both are similar [17].—A primary analysis using a trade study is performed for the choice of the fuel to store the energy (Section 3.2).

3.1. Conversion Process

The starting step of all electric Power to X (P2X) conversion processes investigated is the generation of hydrogen, which is obtained by means of electrolysis of water (Section 3.1.1). Then storage takes place either as hydrogen (liquid or gaseous) (Section 3.1.2), or further conversion to ammonia (Section 3.1.3) or methanol (Section 3.1.4) using the Haber–Bosch process and methanol synthesis, respectively.—Hydrogen storage via physisorption, metal hydrides, and organic liquids containing molecules capable of reversibly releasing it are not investigated [18].—A point to focus on would be that the processes of conversion to ammonia and methanol are assumed to be seaworthy and remotely operable on a small scale. This scale of production is not usually seen in plants that produce these fuels commercially.

3.1.1. Electrolysis

The SailREC System, as envisioned in this study, has seawater as a primary source of water. Since direct seawater electrolysis is not established yet, conventional polymer electrolyte membrane (PEM) or alkaline electrolysis of seawater might be performed after purification steps [19]. Solid oxide electrolysers are still in the research and development phase in terms of technological maturity, apart from having the challenges of thermal cycling, chrome migration, and corrosion while offering higher electrical efficiency. Likewise, direct seawater electrolysis faces the challenge of designing selective electrodes that suppress chloride chemistry [20]. The use of PEM electrolysers is foreseen, as they have a faster response to supply changes, higher power density, and less maintenance compared to alkaline electrolysers, though PEM electrolysers have a higher cost in the application. The electrolysers would be fed by purified water. The by-product of the purification of seawater is brine. This would have to be disposed of, and unlike in coastal waters, discharge in the high seas is not expected to have a negative impact on the environment, but further inspection of this and the legal regulations would be required.

3.1.2. Hydrogen

Hydrogen (H2) is a clean energy carrier, has a high gravimetric energy density, and can be used in fuel cells and combustion engines to get back energy, where the former has higher efficiency than the latter but does not reach the efficiency of batteries. The challenges in hydrogen-based storage are that it is expensive and the fact that it is the least dense element, which creates the need for either compression or liquefaction owing to volumetric constraints. Storage of hydrogen as a high-pressure gas (H2(g)) requires the use of composite materials for the vessel, whereas the liquefaction process for obtaining liquid hydrogen (H2(l)) is energy-intensive [21].

3.1.3. Ammonia

Ammonia (NH3) is also a clean energy carrier in the sense that it does not release carbon dioxide at the point of use as an energy source. It can be used to generate energy with conventional technologies with modifications (e.g., ammonia can be reformed to yield hydrogen and nitrogen, which can be used in internal combustion engines [22], gas turbines, and alkaline fuel cells without further purification [23]). It has half the energy density of gasoline and is easier to store than liquid or gaseous hydrogen. Although toxic and corrosive, the transmission and storage technologies are mature. The Haber–Bosch process is considered for synthesis, and the nitrogen (N2) needed for this can be separated from air using pressure swing absorption (PSA). The process of electrochemical synthesis of ammonia is not explored since the yield rates and efficiencies are still low and below commercially viable levels. Furthermore, the Haber–Bosch process is not flexible—it is optimised for continuous operation. If the process is run at uneven intervals, there are risks of lower catalyst and equipment lifetime due to thermal cycling and reduced production efficiency. A hydrogen and nitrogen buffer would be required in the SailREC System to take care of renewable energy intermittency. Another approach might be to make the process vary its output just as with energy by plant design and operation techniques. This capability to turn down could be a better solution if possible [23,24,25,26].

3.1.4. Methanol

Methanol (CH3OH) is another option as an energy carrier. It is liquid at room temperature and has advantages due to its compatibility with existing infrastructure—including tanks, pipelines, and fuelling stations—as well as its suitability for application in combustion engines [27]. The carbon dioxide (CO2) for the production of methanol can be sourced from carbon capture from processes releasing it, such as cement manufacturing, steel-making, or biomass and power plants, or even obtained through direct air capture (DAC), which can be either onshore or locally at the SailREC System (there are containerised solutions available for DAC, which might be well suited for application in the SailREC System [28]). For nitrogen, separation from air is competitively easier than for carbon dioxide due to the higher concentration of the former in the atmosphere (78% for N2, <0.5% for CO2). DAC of carbon dioxide is still under development and is not competitive enough with flue gas capture on a commercial level [29]. If DAC at the SailREC System is not used, then the transport of carbon dioxide to the system and its storage will need to be addressed. The conversion reaction is not flexible enough to account for the power intermittency and it follows that buffers for the feed-stocks will be required just as in the case of the Haber–Bosch process for ammonia.

3.2. Trade Study

A trade study is conducted because the choice of the fuel to use as energy storage is highly complex. To do so, an abstract representation of the system and underlying processes is made (cf. Appendix B for more details). The steps included are the harvesting of energy by a wind turbine, required conversions to chemical sources, storage on the SailREC System, followed by transport, and the final use of the energy in the form of heat and electricity. Similar chains of production, transport, and use of the different fuels are followed to make comparisons between the options possible. The flow chart for liquid hydrogen is presented in Figure 5. The hydrogen gas generated after electrolysis is liquefied and stored as a liquid on-board in Dewar tanks (cf. Appendix B.1 for further details on the storage tank) at 20.68 K (i.e., −252.47 °C) at a pressure of 4 bar. The liquefier consumes 10 kWh for the liquefaction of 1 kg of hydrogen. Thus, the efficiency of the block is calculated as 70%. The flow charts for gaseous hydrogen, ammonia, and methanol can be found in the Appendix B.2. Overall, the trade study is conducted for a specific use case, as summarised in Table A2 in the Appendix B.3.
The trade parameters used in the trade study, along with their values and weights (considering a range of 1–10), are listed in Table 1. As technology in the energy sector is very cost-driven, the trade parameter levelised cost of energy (LCOE) is given the highest weight of 10. Having the main motivation of a SailREC System of delivering clean energy in mind, 7 is assigned as the weight for the trade parameter on environmental friendliness. Another trade parameter is the partial load capability, which is the ability to produce fuel with interruptions in input power. Fuels requiring chemical reactors and intermediate steps would be at a disadvantage in this assessment. The weight for the partial load capability is set higher than the remaining ones because power harvested in a SailREC System could be subject to periodic stopping. Considering the fact that the weight of the fuel itself and its storage containment needs to be carried by the SailREC System, the trade parameter displaced water volume—referring solely to the specific fuel and storage tank (in future studies, the weight of the production facilities, auxiliary systems, etc. of the fuel can also be taken into account)—is defined, since fuel which requires more displaced water volume may also require a more challenging design of the entire SailREC System. Further trade parameters are the technology readiness level (TRL) of the systems finding use in the Energy Conversion and Storage Subsystems as well as the safety of maintenance personnel. Finally, the transport infrastructure readiness level in 2032 is thought of as a measure of the maturity of infrastructure ten years from now, for transporting the fuel through pipelines, rail tracks, etc., and connecting ports (where SailREC Systems would offload) with points of use inland.
Only for the trade parameters LCOE and displaced water volume are values calculated (cf. Appendix B.1 for further details on the calculation of LCOE), which, however, are not intended to represent exact values but rather serve as indicative measures that can be used for comparison within the trade study. For the remaining trade parameters, the values are quantified by ranking. This is achieved by distributing the values from 1 to 4, with 1 representing the worst-scoring fuel and 4 the best-scoring one. This ranking is based on literature research and discussions with, among others, experts from the Department Hydrogen Labs and Field Tests of the Fraunhofer Institute for Wind Energy Systems IWES. For the evaluation of the trade study, the values are normalised for each trade parameter. Subsequently, the normalised values are multiplied by their respective weights. Finally, the sum of all weighted values across the parameters reflects the score for each fuel. Upon this, the best ranked fuel option turns out to be liquid hydrogen, followed by gaseous hydrogen, methanol, and then ammonia (cf. Table 1).
The span of values in the scaled and weighted final score gives a picture of how each fuel will perform against the others according to the selected trade parameters. The values range from 18.04 for ammonia to 29.44 for liquid hydrogen. Furthermore, the values for liquid and gaseous hydrogen are close to each other at 29.44 and 27.27, respectively, which is also the case for ammonia (18.04) and methanol (20.14). Finally, it can be seen that the values of ammonia and methanol are just about two-thirds of the values for hydrogen (liquid and gaseous).
As mentioned earlier, it is very complex to decide which fuel is most suitable. The trade study provides a framework for making this decision, although the result may not be completely objective and unequivocal. In the following, some critical points of view and areas of improvement for the trade study are addressed. The fuel options explored sometimes have their own niche use cases (e.g., ammonia is used for the production of fertiliser); in the study, only the use of fuel for heat and electricity generation is taken into consideration. The fuel ending up with a lower score in this trade study might not make it a bad choice for it to be produced on a SailREC System if another application of the generated chemical is the aim. The projected future demand for each fuel, which is used not only for power generation but also as a feed stock for other chemicals and similar applications, could be explored in further studies. Furthermore, when referring to the trade parameter LCOE, it should be clear that a value for each fuel is calculated, which, however, does not correspond to the market price of the fuel. It is just an indicative value and, hence, all the CAPEX and OPEX are not meticulously charted but can still be used for comparison of fuels. The abstraction made in the flow charts is fundamental in nature; detailed design and modelling can be performed in further studies:
  • For example, in the abstract representation of the model, the process for desalination as well as PSA and DAC—in the case of ammonia and methanol, respectively (cf. Appendix B.2)—are not taken into consideration;
  • Furthermore, the model can be adapted for a more detailed investigation of seaborne transport and the use of pipelines and railways for transportation on land instead of trucks;
  • The processes used (such as liquefier, Haber–Bosch process, etc.) are taken to be continuous processes and are assumed to be performed on the scale of the power rating of the SailREC System. From an engineering perspective, the processes could be considered batch processes. This is not modelled accordingly in the trade study. Considering buffer storage between processes and aptly power-rated processes would need further exploration.
Finally, the trade study is subjective in the choice of parameters, the weights assigned to those, and the varied assumptions used in the spreadsheet calculations (cf. Appendix B.1). Under a different set of these, the ranking of fuels may vary. For reasons of simplicity, in this study, some of the assumptions are made to allow comparison of the different fuel options and might not represent the optimal design decision for each of them.

4. Investigations on the Propulsion Subsystem

The Propulsion Subsystem shall serve for navigation (e.g., for course correction, driving to a port, etc.) and stabilisation (i.e., to keep the SailREC System stable under dynamic forces, for example, under extreme weather conditions).
The overall stability of the SailREC System should be ensured using passive means, while powered propellers would provide support in the case of adverse conditions where a higher degree of precision and faster response time is essential. The requirements for the Propulsion Subsystem in terms of stabilisation may be similar to those for dynamic positioning (DP) [30]. DP is used in drilling and oil and gas exploration vessels. For instance, when used in floating production storage and offloading vessels, which are usually moored, the DP system assists in position mooring when there are severe environmental conditions [31]. This system relies heavily on the Control Subsystems and the Position Detection Subsystem to produce control outputs that actuate the propellers to maintain a specific position or heading.
The general navigation of the SailREC System to follow a trajectory should not happen by means of powered propellers. Some potential sailing strategies are described in Section 5. Wind assisted propulsion, such as by wind sails or Flettner rotors, can also be used to manipulate the motion around a trajectory and at the same time reduce fuel consumption, as demonstrated in applications in container ships [8]. The use of active propulsion should be kept to a minimum to reduce the energy required for navigation.
In the following, it is elaborated in more detail on propellers (Section 4.1) and the prime mover (Section 4.2).

4.1. Propeller

For the navigating procedures, screw-type propellers could be used. An exhaustive list of various propulsion systems can be found in the book by Carlton [32].
For the stabilisation procedures, propellers typically applied in DP applications are foreseen to be used. These are mainly azipod or cycloidal propellers, as they have a high degree of manoeuvrability and shorter positioning times compared to other propellers. Thus, a probable Propulsion Subsystem solution for the SailREC System would be a combination of a screw propeller—as a main propeller for the navigation procedure—and multiple propellers, which might be combinations of azimuth mounted and cycloidal type propellers, for the stabilisation procedures. To decrease the overall cost of the subsystem, the design might settle on some simpler configurations. Further studies on the Control Subsystems and propeller configuration of the SailREC System would be required.

4.2. Prime Mover and Fuel

The mechanical means of powering the propulsion is provided broadly by two-stroke engines. These engines have higher efficiencies and can be coupled directly with the propellers when compared with four-stroke engines.—The four-stroke engines have higher power densities and lower height requirements, though they will need a reduction gear to reduce the high speed of rotation before coupling with the propeller [33].—These engines mainly use diesel currently, but a development towards the use of alternative fuel is being made where propulsion powered by hydrogen, methanol, or ammonia is used. In a SailREC System, these are the very fuels that could be produced and would be used in the engines. With higher demands for more efficient and cleaner ships, hybrid technology (i.e., additional use of batteries) is also being adopted and integrated into the marine industry. The use of battery technology is shown to reduce the annual operational cost of ships as compared with diesel-mechanical propulsion systems [34]. This is—apart from the target of environmental friendliness and carbon neutrality—a sound argument for designing a propulsion system which is powered electrically rather than just chemically.
A possible electric propulsion architecture that can be used in a SailREC System is shown in Figure 6. The wind turbine feeds the power bus with energy, which is used by the electrolyser and in the conversion processes (Haber reactor or methanol synthesis reactor). The energy will also be used by other subsystems and auxiliary systems. Part of the energy is stored in the electrical form in batteries, which can be used to feed the bus. The bus can also be energised by using the stored fuel through a chemical to power conversion (X2P) when required. The whole control of power on the bus should be monitored by a power management system. The prime movers for the propellers are electric motors, and they source power from the bus. The SailREC System will require a battery (or other storage technology) to conserve energy to supply power for conversion processes that would need power when the wind turbine is not generating (enough) power, as the processes may not be flexible enough to be turned up and down depending on the fluctuating supply of power. The power bus can be based on AC (alternating current) or DC (direct current); currently, AC-based applications are more prevalent for marine applications. The study by Chai et al. [35] has shown benefits in the use of DC-based systems—in both electrical performance and fuel efficiency—in a diesel–electric marine vessel. The challenge would be the safety of the system, as designing protection devices for DC applications is of increased difficulty.

5. Assessment of Different Sailing Strategies

As envisaged, now it is considered that a SailREC System will sail on an energy yield-optimised trajectory, which might change dynamically. Such a trajectory might be closed, which means that the SailREC System starts the trajectory at a position and reaches after one cycle a point very close to the start position. In this chapter, different trajectory types and strategies to follow such a trajectory are presented and evaluated. These are categorised into Downwind&Upwind (Section 5.1), Circle (Section 5.2), and Beam Reach (Section 5.3). The final evaluation is covered in Section 5.4.

5.1. Downwind&Upwind

For the strategy Downwind&Upwind, the SailREC System, as depicted schematically in Figure 7, sails downwind for a specified distance and then reverts the moving direction or turns and drives straight upwind until it reaches the start point. In the downwind phase, in which the wind turbine is operating, the resulting thrust force drives the SailREC System forward while the hull resistance slows down the forward motion, and—to increase the effective wind speed at the wind turbine—the driving speed can be further reduced by means of a water brake, providing additional hydrodynamic drag. In the upwind phase, the wind turbine is stopped, the water brake is released, and the active propulsion system is used to drive back against the wind; however, opposing forces due to hydrodynamic drag as well as aerodynamic drag on the parked wind turbine are again present.
This Downwind&Upwind sailing strategy might not be an ideal one since wind energy can only be captured for a fraction of the time of one cycle. However, it is easy to calculate the energy yield for this strategy and, hence, obtain a lower limit for the possible energy performance.
For the evaluation of the effective power, a steady-state condition is considered, meaning that the velocity of the SailREC System in the direction of travel ( v drift ) is constant and, hence, its derivative ( v ˙ drift ) is zero, and it is assumed that all other parts of the SailREC System except for the wind turbine rotor plane, the hull, and the brake have no aero- or hydrodynamic drag, respectively. In the following, the downwind and upwind phases are first considered separately. In the downwind phase, the equilibrium of the forces on the wind turbine ( F Thrust ), hull ( F Hull ), and brake ( F Brake ), as presented in Equation (1), with the total mass of the SailREC System ( m System ), is used as the calculation basis.
F = m System v ˙ drift = F Thrust F Hull F Brake = steady state 0
The thrust on the wind turbine can be expressed according to Betz’s law [36] (Equation (2)), with the density of air ( ρ Air ), the swept area of the rotor blades ( A rot ), the axial induction factor (a), and the effective wind speed at the wind turbine ( v effective ), which itself is derived from the undisturbed wind speed ( v wind ) following Equation (3).
F Thrust = 1 2 ρ Air A rot 4 a ( 1 a ) v effective 2
v effective = v wind v drift .
The total resistance of a hull in water (of density ρ water ) depends—as presented in Equation (4)—on its wetted surface ( A Wetted ) and total resistance coefficient ( C T ), which depends on the Froude Number and, thus, on the specific hull length and actual drift velocity [37,38].
F Hull = 1 2 ρ water A Wetted C T v drift 2 .
The drag from the brake is derived from Equation (5) in relation to the projected area of the brake ( A Brake ) and its resistance coefficient ( C W ).
F B r a k e = 1 2 ρ water A Brake C W v drift 2 .
Substitution of Equations (2), (4) and (5) in Equation (1) and solving for v drift results in Equation (6).
v drift = τ 1 + τ v wind , with τ = ρ Air 4 a ( 1 a ) ρ Water A Brake C W + A Wetted C T .
For the upwind phase, the equilibrium Equation (7) contains only the propulsion force ( F Propulsion ) and drag force on the hull. Thus, the propulsion force can be directly computed by using Equation (8), based on Equation (4).
F = m System v ˙ drift = F Propulsion F Hull = steady state 0
F Propulsion = 1 2 ρ Water A Wetted C T v drift 2 .
The time for one cycle shall be 2 t , i.e., once t for the downwind and once t for the upwind phases. The effective power ( P effective ), as expressed in Equation (9), is then the remainder of the power generated by the wind turbine ( P WindTurbine ) during the downwind phase less the power required by the propulsion system ( P Propulsion ) during the upwind phase.
P effective = t 2 t P WindTurbine t 2 t P Propulsion .
The power of a wind turbine is computed following Equation (10) [36].
P WindTurbine = 1 2 ρ Air A r o t 4 a ( 1 a ) 2 ( v wind v drift ) 3 .
The distance of travel within each phase is set to be s. For simplicity, it is assumed that the SailREC System drives back at the same drift speed as in the downwind phase. Hence, the pure power required by the propulsion system ( P ´ Propulsion ) can be determined according to Equation (11).
P ´ Propulsion = F Propulsion s t = F Propulsion v drift .
The SailREC System would use the energy of the fuel produced from the wind energy captured during the downwind phase to drive back.—There are also other possibilities with higher efficiency, such as superconductors or flywheels, that could be used for this purpose. As, however, this is a worst-case calculation, the round-trip efficiency of the produced fuel is used.—Thus, a round-trip efficiency ( η RoundTrip ) is introduced to the pure propulsion power calculation (Equation (12)).
P Propulsion = 1 η Round Trip P ´ Propulsion .
Finally, the effective power of the Downwind&Upwind strategy, using Equations (8)–(10) and (12), is computed as summarised in Equation (13).
P effective = ρ Air A rot a ( 1 a ) 2 ( v wind v drift ) 3 1 4 η Round Trip ρ Water A Wetted C T v drift 3 .

5.2. Circle

In the Circle strategy, the SailREC System sails downwind on a circular trajectory. After one cycle, the SailREC System has sailed around the trajectory. The wind is assumed to always be tangential to the circular trajectory, which is justifiable under the aspect that a large diameter is considered and the main wind flows are, from a global perspective, almost smoothly changing their direction. The wind velocity is taken as a constant over the entire trajectory. This strategy might represent an ideal one because the SailREC System can harvest energy for the entire time and only needs to perform the manoeuvre of steering. While perfectly circular trajectories are unlikely to occur, trajectories with circular characteristics are not rare. We suggest having a look at www.windy.com (accessed on 22 April 2022) and trying to spot some of these. Evaluating this strategy might show how much energy can be produced in the best case while sailing downwind. Furthermore, it is easy to calculate the energy yield for this strategy as well.
The same model as shown in Figure 7 is used, however, the active propulsion might not be required for this sailing strategy. The effective power output of the Circle strategy is computed based on the law of energy conversion (Equations (14) and (15)) underlying the circular motion shown in Figure 8. The thrust energy is considered as input energy to the system, and drag and energy for staying on the circular path as output energy. The system is considered to always be in a steady state so that the kinetic energy does not change.
The energy required to stay on a circular trajectory ( E Centripetal ) is zero because the centripetal force ( F Centripetal ) is always perpendicular to the direction of motion ( d s ).
E Centripetal = F Centripetal d s = 0
F Thrust d s = F Brake d s + F Hull d s F Thrust = F Brake + F Hull .
Equation (15) leads to the same relation as Equation (1). Therefore, the effective power for the Circle strategy, as summarised in Equation (16), is the same as in the downwind phase for the Downwind&Upwind strategy.
P effective = P Wind Turbine P effective = 2 ρ Air A rot a ( 1 a ) 2 ( v wind v drift ) 3 .

5.3. Beam Reach

One other strategy to be suggested, which, however, will not be evaluated in more detail, is to sail more beam reach and use the wind turbine as presented in Figure 9. In the strategies Circle and Downwind&Upwind, the wind velocity at the wind turbine is always reduced by the amount of the drift velocity. When sailing more beam reach, the component of v drift , which is perpendicular to A rot , could be reduced considerably. This would increase v effective and cause the turbine to generate more energy than in Circle and Downwind&Upwind. When sailing beam reach, a sailboat can get faster than the true wind [38]. The focus in the case of a SailREC System would be to maximise power generation, not speed.

5.4. Evaluation of the Different Sailing Strategies Presented

To assess the different sailing strategies presented beforehand, Equations (13) and (16) are utilised to determine the effective power in both Downwind&Upwind and Circle for an exemplary scenario. Due to the conceptual character of this study, no distinct values for either the wetted surface and total resistance coefficient of the hull or the projected surface and resistance coefficient of the brake are known. Thus, it is assumed that A Wetted is 10% and A Brake is 1% of the swept area of the wind turbine rotor. All specific parameter values used in the exemplary scenario for calculating the effective power values are listed in Table A3. With Equation (6), this results in a drift velocity that is around 20% of the wind speed.
Figure 10 shows, for the two sailing strategies Downwind&Upwind and Circle, as well as for a fixed-location wind turbine, the produced power over the undisturbed wind speed (Note: Here, it is not referred to the power curve of the wind turbine but to the power output of a system that implements a sailing strategy, and, hence, the power based on the energy generated over time for one cycle is meant by the term produced power.). The Vestas V150-4.2 MWTM, with a 150 m rotor diameter, 4 MW rated power (Prated), and 22.5 m/s cut-out wind speed [39], is used in this exemplary scenario to sketch the power curve for the fixed-location wind turbine, which is indicated by a dashed line after having reached rated power. From this, the curves for the produced power following the two different strategies are derived and included in Figure 10 by means of dashed lines as well. For Circle and the fixed-location wind turbine, the wind speed range in which 4 MW are generated is assumed to be the same length. For Downwind&Upwind, the cut-out wind speed is the same as for Circle, since Downwind&Upwind in the downwind phase is the same as Circle. Furthermore, the upper limit for the power produced by a system implementing the Downwind&Upwind sailing strategy is 2 MW because the rated power of 4 MW can only be reached for half of the time.
One can see in Figure 10 that the main effect of the sailing strategies Circle and Downwind&Upwind is a shift of the effective power curve towards higher wind speeds. This is also clear from the term ( v wind v drift ) in Equation (10). A second and related effect is a reduced growth rate of the power curve. The gradient at 4 MW for Downwind&Upwind is smaller than the gradient of the fixed-location wind turbine at the same power.
While for Circle and Downwind&Upwind, the rated power range (i.e., the range in which rated power is delivered) is shifted to higher wind speeds compared to a fixed-location wind turbine, it is expected that the rated power range of Beam Reach starts at lower wind speeds and ends at higher ones. The decreased start of the rated power range is expected because sailboats can get faster than the true wind speed when sailing in a beam reach style [38]. The increased end of the operational range is expected because the sailing style becomes more and more similar to downwind sailing when increasing the angle β (cf. Figure 9).
The capacity factors for offshore fixed-location wind turbines were in the range of about 20–58% in the years 2010–2018 [40]. This range comes from the variety of environmental offshore sites and the installed wind turbine systems. For example, the Hywind Scotland wind farm, with moored-floating wind turbines off the North Sea coast of Scotland, achieved a capacity factor of around 57% [41]. The wind farm Nordsee Ost 1, with bottom-fixed wind turbines in the German North Sea, achieved just a yearly capacity factor of about 36% in 2019 [42]. In the FARWIND project, it is also shown that the capacity factor of a fixed-location wind turbine in the North Atlantic Ocean can be up to 80% [43]. Jamil et al. [43] write that it is still unclear whether traditional offshore wind energy turbines can be installed there. The same opinion is shared, which is why capacity factors of fixed-location wind turbines that would be deployed in the North Atlantic are not taken into account in the analysis here. Moreover, this is another point that justifies the research on SailREC Systems.
At the same time, it is shown that the capacity factor for the FARWIND energy ship can be around 80% in the North Atlantic Ocean [43]. For the sailing wind farm proposed by the NIES, the capacity factor is expected to be around 40% in the exclusive economic zone of Japan [3]. These projects use different technical designs. Both use simulations to determine the capacity factors. The simulations were performed differently and used different boundary conditions. Both, however, have in common that they implemented a kind of beam reach sailing strategy. The generated power is maximised when the wind comes from a beam.
The capacity factors of SailREC Systems (60% on average) seem to be predominantly higher than those of fixed-location wind turbines (40% on average), but this will depend on the specific sailing strategy. The different sailing strategies are technically feasible with different degrees of ease, but are more complex than the long-standing fixed-location wind turbines (although one may argue that fixed-location wind turbines may also be the most difficult to realise due to their deployment in the high seas and the use of innovative moored-floating systems):
  • For Beam Reach, the highest capacity factor of all three strategies is expected: The capacity factors of systems that implement some kind of Beam Reach strategy (e.g., the FARWIND energy ship and the sailing wind farm by the NIES) are—with a mean value of 60%—20% higher than those of today’s fixed-location wind energy farms. Beam Reach likely has the highest capacity factor due to the large wind speed range at which rated power is delivered, and trajectory planning might be easier than for Circle. Beam Reach could be like Downwind&Upwind applied to a line that is perpendicular to the incoming wind. However, it is argued that Beam Reach is the strategy most difficult to realise as there are effects, such as heeling (happening because the force of a sail, i.e., thrust in Figure 9, and the force of the hull and keel systems together generate a torque, rolling a sailboat away from the wind [38]), which do not occur during downwind sailing but need to be handled when sailing beam reach;
  • While Downwind&Upwind requires no special wind fields such as Circle but just wind, only a little trajectory planning is needed as the wind turbine will continuously sail down a line and ship up. Furthermore, effects such as heeling do not occur. This is why it is considered the easiest to implement out of the three sailing strategies considered. The maximum capacity factor for this strategy is limited to 50% because the wind turbine operates only half the time of one cycle. For these reasons, it is imagined that capacity factors of 20–30% are possible with Downwind&Upwind. If this guess is right, Downwind&Upwind has a lower capacity factor than a fixed-location wind turbine;
  • While the hardware for Circle could be similar to that of Downwind&Upwind—it could be argued at this point that Circle does not necessarily need a propulsion system; however, this is considered too dangerous—it is more of a challenge to plan and maintain a circular trajectory. More complex software is likely required. Circle is considered one step harder to implement after Downwind&Upwind. Systems that implement a Circle strategy reach rated power at just a higher wind speed compared to fixed-location wind turbines, which is due to the drift velocity of the system. Furthermore, the capacity factor can be optimised through continuous relocation to sites with better environmental conditions and by setting the general area of operation to an area far offshore with high wind speeds. For these reasons, it is imagined that systems implementing Circle can compete with fixed-location offshore wind turbines regarding the capacity factor.
The results of the preceding discussion are summarised in Table 2. Further aspects not yet considered may change the results. Thus, subsequent detailed investigations would be necessary to validate them.

6. Description of the Developed Design

A rough concept for a SailREC System is developed based on the system synthesis presented in Section 2. It has to be mentioned that the concept is just one possibility of how a SailREC System can be implemented. Figure 11 shows a sketch of the concept from both behind (cf. Figure 11a) and the left (cf. Figure 11b), while Table 3 summarises the main properties. The individual subsystems and the justification for their choices are covered in the following.

6.1. Wind Turbine

The wind turbine is set to have a rated power of 4 MW. Representative dimensions are taken from the V117 by Vestas, namely 117 m rotor diameter and 84 m hub height [39]. However, the wind turbine should have a direct-drive generator with permanent magnets because this concept prioritises reliability, low maintenance, and high efficiency over price. The mass is hence estimated to be 453 t according to a wind turbine scaling model [44].

6.2. Sailing Strategy

The development and construction processes of a SailREC System are very likely to be more complex and costly than those of a fixed-location offshore wind turbine. To justify the higher investment, it is aimed at a higher capacity factor. According to the evaluation in Section 5, since Beam Reach is the only strategy with a higher capacity factor than a fixed-location wind turbine, this sailing strategy shall be deployed in the proposed SailREC System. The ability to yaw the rotor enables a wide range of operating states to account for changing wind speeds and directions. The power generation could be described in the form of a polar plot as done by Babarit et al. [5]. Based on a conservative estimation and since the SailREC System is smaller and therefore more manoeuvrable than the sailing type offshore wind farm by the NIES [3], a capacity factor of 50% is assumed.

6.3. Energy Conversion

Even if liquid and gaseous hydrogen both rank best in the evaluation covered in Section 3, liquid hydrogen is considered more suitable for the following reasons not yet considered: First of all, the logistical effort of transporting gaseous hydrogen is much greater than that of liquid hydrogen.—In a calculation based on the developed supply chain models, it is found that four liquid hydrogen trucks transport the same amount of energy as 20 gaseous hydrogen trucks. Thus, a society choosing liquid hydrogen benefits, for example, from less traffic, fatigue of streets or other infrastructure, and noise pollution.—Furthermore, the manufacturing costs for a gas tank (not considered in the supply chain models) are expected to be higher than for a liquid tank due to the higher complexity of producing a carbon fibre tank compared to a steel tank.
The implementation would happen with PEM electrolysers. The required number of PEM modules would be housed in commercially available containers. This enables modularity as well as easy manufacturing and maintenance. The wind turbine powers the electrolysers and the liquefaction plants. Assuming an electrolysis efficiency of 75% and a liquefaction efficiency of 70%, based on the trade study from Section 3, results in an electrolysis capacity of about 1.93 MW and a liquefaction capacity of 2.07 MW—all other power consumers are neglected at this early stage of the system design. Based on the data provided by a manufacturer of electrolyser containers [45], it is calculated that five 20-ft containers weighing 16 t (based on data for an alkaline electrolyser container due to missing information on the weight of a PEM container) each, for a total of 80 t, are necessary.

6.4. Energy Storage

For storing liquid hydrogen, specialised containers are considered, as sketched in Figure 12. Each container has the outer dimensions and corner fittings of a 40-ft container, which simplifies the logistics of the supply chain.—Because corner fittings are widely used at, for example, ports and train loading stations, existing transport infrastructure can be easily utilised. With the containerised solution, the liquid hydrogen can always stay in one tank. Thus, discharging and filling steps and the associated pumping losses are avoided.—Each of these containers incorporates a double-walled, vacuum-insulated stainless steel tank to store the liquid hydrogen. In Section 3, the storage efficiency of a truck tank comparable in size to the proposed container and a tank eight times larger, both double-walled and vacuum-insulated, is modelled. For the truck tank, the thermal efficiency is about 93% and, for the bigger tank, 97% for 60 days of storage. Given the advantage of simplifying the supply chain, the drawback of having 4% less thermal efficiency is seen as acceptable. Part of the container is also a small gaseous hydrogen tank to capture vaporised hydrogen due to boil-off. When the container is in the SailREC System, the boil-off is directly fed into the liquefaction plant or used for onboard fuel cells. Each container has an active cooling unit to reduce the boil-off. The SailREC System has an interface to power a container with electricity, to enable filling with liquid hydrogen and the withdrawal of vaporised hydrogen. During the supply chain, transport systems may support only a few of these interfaces or none of these.
In a rough calculation, the weights of the liquid and gaseous hydrogen tanks are determined as 5465 kg and 822 kg, respectively. For the liquid hydrogen tank, the payload is 2358 kg of hydrogen. The additional structural weight of the container is assumed to be 3800 kg.—This is the empty weight of a standard 40-ft container [46]. For simplicity, the same weight is assumed to be the structural weight.—Another 3000 kg must be considered for extra hardware, such as an active cooling unit or photovoltaic modules. In total, this sums up to a weight of around 15.5 t for one storage container. One container has an energy capacity of 78.5 MWhH2 when considering the liquid hydrogen payload. For an energy harvesting cycle of 60 days and an assumed wind turbine capacity factor of 50%, about 14 containers are required to store the produced hydrogen of around 1100 MWh. Thus, the total weight of all hydrogen storage containers is approximately 217 t.

6.5. Navi Group

The Active Propulsion Component to be used has two modes: one to generate thrust and drive the SailREC System forward, and one for regeneration. In the latter mode, the propeller will work as a generator and deliver electricity to the power bus. This component will be optimised for the regeneration mode. The Wind Turbine Subsystem will be used as a Passive Propulsion Component. The thrust acting on the wind turbine is used to move the SailREC System. This subsystem will primarily provide propulsion in order to improve energy efficiency.
For the Anti-Wind Force Subsystem, a combination of four symmetrical keels is used to fully compensate for the thrust on the wind turbine in the direction of the undisturbed wind, preventing the wind from turning the system away from the wind and allowing a small curve radius. The arrangement of the keels, as presented in Figure 11, is inspired by the wing arrangement of a typical aeroplane.
Each of the two rear keels has a rudder attached to steer the SailREC System. This makes up the Control Surfaces Subsystem.
The Buoyancy Component of the Floatation Subsystem consists of several hollow bodies. Most of the buoyancy is generated by two long, fully submerged bodies that are connected to the main platform via struts. Floodable sections allow the system to be trimmed, the draught to be adjusted, or the payload to be increased. Only a small fraction of buoyancy is provided by multiple smaller bodies that are also connected to the same struts but are positioned between the main deck and the fully submerged bodies. This arrangement will minimise the area of the Floatation Subsystem that is exposed to waves. To dimension the Buoyancy Component, the total mass of the SailREC System needs to be compensated for by the mass of water displaced. Considering the masses of all subsystems and components as listed in Table 3—with reserving 200 t for additional equipment and assuming the structural mass to be 40% of the system mass as done by Babarit et al. [5]—a system mass of 1553 t is obtained. The displaced water volume, however, is increased by 20% to account for the floodable sections, resulting in a total of 1864 m3. By assuming a length of the long, fully submerged bodies of 70.2 m—this length excludes the cone of the buoyancy bodies in the front section (cf. Figure 11), which, however, is considered in Table 3 for the overall system length by adding 2 m—which is 60% of the rotor diameter, the diameter of the buoyancy bodies (the smaller buoyancy bodies’ volume is neglected at this stage of development) is about 4.1 m. The catamaran-style arrangement of the buoyancy bodies makes up the Counter Torque Component. While the two large, fully submerged buoyancy bodies located 70.2 m apart (given as the distance between the centres of the considered buoyancy bodies; thus, the cylinder radius needs to be added twice to obtain the overall width of the system, as provided with 74.3 m in Table 3) provide static torque countering, they do not generate additional buoyancy in dynamic situations, such as when the system rolls. This, however, is provided by the multiple smaller buoyancy bodies.

6.6. Payload Area

The catamaran arrangement creates a large deck area, which is to be used to store all liquid hydrogen containers, electrolyser containers, and any other required payload. The payload area is estimated at 3744 m2 (because of the inclined arrangement of the struts and the required walkable areas, the length of the payload area is assumed to be 60.2 m and the width 62.2 m). Considering two levels of stacking on the deck and a utilisation rate of 70% (the rest of the space is used, for example, for accessing containers or the container interface, etc.), a total of 44 40-ft equivalent containers can be stored on the deck. Since 14 40-ft containers are needed for the liquid hydrogen storage and five 20-ft containers for the electrolysers, 27 40-ft equivalent containers remain available for other equipment.

7. Discussion and Outlook

In this section, the concept design from Section 6 is put into the context of the existing systems mentioned in Section 1.1. Based on this, the properties of the concept design and its limitations are discussed, and future steps required to develop the concept design further are pointed out.
The concept design from Section 6 implements, such as the FARWIND energy ship and the proposed wind farm by the NIES, a kind of Beam Reach sailing strategy, as all designs are expected to reach their peak power when the wind comes from a beam. Another property that all proposals share is a catamaran-style floating platform. The concept design from Section 6 and the wind farm from the NIES use both primarily or only wind turbines to generate electricity [3]. The NIES concept incorporates 11 wind turbines [3] instead of one for the concept design. On the other hand, the FARWIND energy ship uses only hydrokinetic turbines to generate electricity. A hydrokinetic turbine is also intended to be implemented by the concept from Section 6, but not as the primary electricity generator. By comparing the sizes, the NIES proposal stands out with a length of around 2 km [3]. The concept design (74.3 m) and the FARWIND energy ship (31.7 m) [5] are on a much smaller scale. The same relationship holds for the electrical power output. The FARWIND energy ship with its two hydro turbines has a rated power of 1.8 MW [5], the concept design generates with its single wind turbine 4 MW (the electricity generated by the Propulsion Subsystem in generation mode—acting as a hydro turbine—is neglected), and the NIES wind farm 55 MW with its 11 wind turbines [3]. Concerning manoeuvrability, Tsujimoto et al. [3] state that a turning operation takes a few hours. The FARWIND energy ship and the concept design are expected to be much more manoeuvrable, simply because they are much smaller. The FARWIND energy ship’s manoeuvrability in operation is expected to be better than that of the concept design. The reason for this is seen in the Flettner rotors, which can be adjusted very fast to a new wind direction compared to the limiting rotational speed of the wind turbine rotor. The difference in manoeuvrability can not be quantified at the moment, nor can it be answered if the expected reduced manoeuvrability compared to the FARWIND energy ship is a measurable drawback for the capacity factor of the concept design. This might depend on the number of fast course changes during operation. The concept design is, compared to the other two designs, still in a very conceptual phase and introduces many new untested ideas, as is the aim of this study. The open question of how well these ideas would work in reality is, for example, applicable to the liquid hydrogen storage containers. Susiso Frontier, the world’s first liquid hydrogen transport ship, entered service in 2020 [47]. The ship has a 1250 m3 large vacuum-insulated liquid hydrogen storage tank [47]. It can not be said how well this technology can be adapted for the proposed storage containers. It also needs to be investigated in detail whether the Floatation Subsystem, with its smaller and larger buoyancy bodies, can provide sufficient stability even in extreme wave conditions. Further technical and economic studies are necessary to judge the suitability of the concept. For example, the sailing properties and energy performance, which are not explored at all and are just based on a conservative guess, can be investigated. All parts of the construction, being below or at the waterline, could be analysed in a CFD simulation. For this, in particular, the interaction with waves should be explored. It might also be important to simulate the concept design as a whole system to investigate the coupled dynamics and responses.

8. Conclusions

This paper introduces the concept of a SailREC System as a technology to rapidly build up the production of renewable fuels without barriers to growth, as the oceans are very large. A SailREC System is generically defined by the subsystems identified in this paper, so that any SailREC System is describable. Subsystems with close interfaces to each other are grouped. A SailREC System needs, for example, subsystems from the Energy Group to convert and store energy generated by the Wind Turbine Subsystem. Further subsystems—belonging to the Navi Group—are required to provide ship-like properties to move and steer, but also to improve the energy efficiency of the wind turbine. Other subsystems enable remote control and autonomous operation or provide safety. Within this study, some subsystems are investigated in more detail. Coming under the Energy Group, ammonia, methanol, gaseous hydrogen, and liquid hydrogen are being investigated as options for the fuel to be produced on board. A trade study, focusing mainly on LCOE (as a result of supply chain modelling) but also addressing, among others, infrastructure readiness level in 2032 and environmental friendliness, reveals that liquid hydrogen, closely followed by gaseous hydrogen, ranks first, whereas methanol and ammonia score just about two-thirds of the highest value. A further focus is placed on the sailing strategy and three alternatives are investigated, including the assessment of their effects on the effective electrical power being generated by the system. In conclusion, the highest capacity factor, though the highest technical challenge, is expected with a strategy where the wind comes from a beam. Based on the identified subsystems and detailed investigations, a concept design is developed that features a 4 MW wind turbine and converts energy into liquid hydrogen stored in double-walled, vacuum-insulated containers that are meant to be easily transportable, utilising existing infrastructure. The overall appearance of the proposed SailREC System is that of a catamaran with the wind turbine in the middle of the beam. This specific concept design shows some similarities as well as some differences compared to other existing ideas for comparable system technologies. Overall, the presented concept study serves as a basis for further in-depth investigations into individual subsystems and a detailed system design. The elaborated technology of SailREC Systems may pave the way to future offshore renewable energy research and development.

Author Contributions

Conceptualisation, C.R. and A.M.T.P.; methodology, C.R. and A.M.T.P.; software, C.R. and A.M.T.P.; validation, C.R., A.M.T.P. and M.L.; formal analysis, C.R. and A.M.T.P.; investigation, C.R. and A.M.T.P.; resources, M.L.; data curation, C.R. and A.M.T.P.; writing—original draft preparation, C.R. and A.M.T.P.; writing—review and editing, C.R., A.M.T.P. and M.L.; visualisation, C.R. and A.M.T.P.; supervision, M.L.; project administration, C.R. and A.M.T.P.; funding acquisition, M.L. All authors have read and agreed to the published version of the manuscript.

Funding

This research was funded by the German Fraunhofer Institute for Wind Energy Systems IWES.

Institutional Review Board Statement

Not applicable.

Informed Consent Statement

Not applicable.

Data Availability Statement

The data presented in this study are available on request from the authors.

Acknowledgments

Many thanks go to Jan Wenske for establishing contact with Fraunhofer IWES. Without his lectures, we would not have been so enthusiastic about wind energy and would not have come up with this idea. We would also like to thank all the colleagues from Fraunhofer IWES who gave us feedback on our way. In this sense, special thanks go out to Kevin Schalk and all the other people at the Department Hydrogen Labs and Field Tests of Fraunhofer IWES that supported us. Since the content of this paper is based on project work that was carried out within the framework of Master studies at the University of Bremen, we would like to thank the university for offering this opportunity. In the end, C.R. would like to thank the Faculty of Aerospace Engineering from the University of Applied Sciences Aachen for his Bachelor’s programme, from which much of the learning could be applied in this study.

Conflicts of Interest

The authors declare no conflict of interest. The funders had no role in the design of the study; in the collection, analyses, or interpretation of data; in the writing of the manuscript, or in the decision to publish the results.

Abbreviations

The following abbreviations are used in this manuscript:
ACAlternating Current
CAPEXCAPital EXpenditure
CH3OHMethanol
CO2Carbon dioxide
DACDirect Air Capture
DCDirect Current
DPDynamic Positioning
H2Hydrogen
H2(g)Gaseous Hydrogen
H2(l)Liquid Hydrogen
IWESInstitute for Wind Energy Systems
LCOELevelised Cost Of Energy
NIESNational Institute for Environmental Studies of Japan
NH3Ammonia
N2Nitrogen
OPEXOPerational EXpenditure
PEMPolymer Electrolyte Membrane
PSAPressure Swing Absorption
P2XPower to X
SailRECSailing Renewable Energy Conversion
TRLTechnology Readiness Level
UNCLOSUnited Nations Convention on the Law Of the Sea
UoFUse of Fuel
X2PChemical to Power conversion

Appendix A. System Requirements

Table A1. Complete list of requirements identified through freewheeling.
#Core Requirements
1Focus on wind energy
2Operational in offshore conditions
3Can store and transfer energy to a destination
4Mobile floating structure
5Autonomous perception and navigation in the environment
6Follow a resource efficient trajectory
7Avoid/survive storms
8Damp excitation from external forces and torques
9Safe from pirates
10Operational in a fleet or single unit
Optional Requirements
11Incorporate other sources of (renewable) energy
12Clean the ocean
13Offer communication services to ships
14Designs that could work as green cruise/cargo carriers
15Act as a platform for weather forecast and scientific/marine research
16Possible to manufacture at a port
17Act as a refuelling station for ships
18Enrich biomass
Generic Requirements
19Low levelised costs of energy
   Modular design
   Possibility of mass production
   Economically viable
   Low and easy maintenance
   Ease in stored energy delivery
20High reliability
21Long lifecycle
22Sustainable design
23Pragmatic design solution
24Safe for environment and marine life

Appendix B. Detailed Results of the Trade Study on Energy Conversion and Energy Storage Subsystems

Appendix B.1. Calculation Approach for the Trade Study

The SailREC System is approximated and calculations are performed using spreadsheets. The flow charts (cf. Figure 5 and Figure A2, Figure A3 and Figure A4) give a schematic representation of the processes and associated costs that are used in the calculations. In the flow charts, the blocks that are filled white (i.e., blocks for electrical energy that is sourced from the turbine, electrolyser for generation of hydrogen, onboard storage, etc.) are the ones that are common for all the four fuel options, while the respective efficiencies and costs may still differ. The blocks with a colour fill of blue are the stages which are primarily different from those of others (i.e., liquefier, compressor, Haber–Bosch process, and methanol synthesis). The losses that occur at corresponding stages are indicated by arrows on top of them. The blocks with a grey filling and rounded edges (i.e., desalination, DAC, and PSA) are stages required in the SailREC System but are not exactly used in the calculations as a subsystem. The text in red fonts also shows the differences between the options.
The general idea used in the calculation is to compute the efficiency of each block, which represents a relevant stage or component in the chain. If CAPEX is considered, it is represented with a red $ sign, while for OPEX it is a green one. There are certain losses in the blocks, which are taken into account to get the efficiency of the blocks. Finally, the overall efficiency is calculated as the product of all the single block’s efficiencies. This is multiplied by the electrical power from the wind turbine to obtain the total energy that is realised each year. The costs and the energy calculated are used to get the LCOE of each flow chain. Another parameter used for assessing the options in the trade study is the measure of hull volume that will be required. Here, only the mass of fuel harvested at the end of the loading cycle and the mass of the tank used to store it are considered, and the equivalent volume of water to be displaced is determined.
The main assumptions made in the calculation approach are listed in the following:
  • The wall thickness calculation for the tanks (for storage and transportation) leans towards the ASME Boiler and Pressure Vessel Code [48,49].
  • The shape of the tanks is assumed to be a cylinder.—Use of spherical tanks could be better as their volume to surface area ratio is higher, reducing the losses due to heating. They are also stronger than cylindrical tanks with the same wall thickness. However, the spherical tanks are costlier to manufacture [50].
  • The tank material is stainless steel except for gaseous hydrogen, for which carbon fiber is used.—Another method could be the use of a stack of gas bottles, each having a smaller diameter, if only materials of lower allowable stress can be used.
  • Only material costs are considered for tank CAPEX.
  • The cooling loss of fuels that are not stored at ambient temperature is calculated as the heat energy flowing into the storage tank. In the case of liquid hydrogen and ammonia, they need to be stored in so-called Dewar tanks—double-layered tanks where there is a vacuum maintained between the layers.
  • Thermal radiation is only considered as a source of heat inflow (cf. Figure A1). The top and bottom flat surfaces are not considered in the modelling. The view factor is estimated according to the radiation between two concentric cylinders of a finite length according to VDI e.V. [51].
  • The required energy for transport till port through the sea and on land from port till plant with a truck is taken into account.—Other ways of transporting the fuel, such as pipelines, rail transport, etc., can be modelled in further studies. There is a major push in the direction of the development of hydrogen transport infrastructure such as the hydrogen grid [52].
  • The conversion efficiency used in the stage/block use of fuel (UoF) is the average of combined heat and power fuel cells and that of combined cycle gas turbines [21,23]. The same UoF conversion efficiency is considered across the different fuels.
Figure A1. Radiation model taken for storage.
Energies 15 04434 g0a1

Appendix B.2. Flow Charts for the Different Storage Options

The process chain for gaseous hydrogen as the stored fuel is depicted in Figure A2. Storage takes place at 200 bar pressure and at ambient temperature.
Figure A2. Gaseous hydrogen as the stored fuel.
Energies 15 04434 g0a2
The process chain for the storage of ammonia is presented in Figure A3. For the calculations, a cost for the unit mass of the nitrogen gas is considered instead of an in-situ PSA plant. Ammonia is stored in Dewar tanks at 238.15 K (i.e., −35 °C). It is produced at 300 °C and 200 bar pressure in the Haber reactor, where the Haber–Bosch process is performed at 200–350 bar pressure and 300–500 °C with multiple passes over the catalyst bed with an ammonia conversion rate of 15% [23], and is brought to 1 bar pressure and the aforementioned temperature in the liquefaction process. The change in enthalpy is taken as the energy required for this step. A cracking process, which converts ammonia to hydrogen, is considered, and the associated loss is factored into the UoF efficiency.
Figure A3. Ammonia as the stored fuel.
Energies 15 04434 g0a3
The process chain for methanol as the stored fuel is depicted in Figure A4. Here, a cost for the unit mass of CO2 gas is considered instead of in-situ DAC (alternatively, CO2 can be delivered to the SailREC System when the fuel is offloaded to a tanker or at the port). Storage happens at the ambient pressure and temperature. The methanol synthesis from hydrogen and carbon dioxide is an exothermic reaction requiring 80–110 bar pressure, 200–300 °C, and catalysts. The reaction requires recirculation of the product gas since the conversion to the product does not occur in one step.
Figure A4. Methanol as the stored fuel.
Energies 15 04434 g0a4

Appendix B.3. Variable Values for Specific Use Case

Table A2. Variables and their values for the specific case used to make the choice of fuel.
VariableValue Requirements
Rated power of the turbine4 MW
Capacity factor of the turbine0.38
Days of energy farming45
Distance to port for offloading1000 km
Days of transport60
Transport to shore solutionTanker
Distance port to plant300 km
Temperature of air, water11 °C, 5 °C

Appendix C. Boundary Conditions for the Calculation of the Effective Power Curves

Table A3. Values used to generate Figure 10 from Equations (16) and (13); the induction factors are for each strategy the maximum (cf. Figure A5).
VariableValue
C W 1.33
C T 0.0045
A r o t 17,671.458 m2
A W e t t e d / A r o t 0.1
A B r a k e / A r o t 0.01
ρ A i r 1.225 kg/m3
ρ W a t e r 1000 kg/m3
η R o u n d T r i p 0.399
a D o w n w i n d & U p w i n d 0.22
a C i r c l e 0.29
a F i x e d L o c a t i o n W i n d T u r b i n e 1 3
Figure A5. Effective power over the induction factor, for a true wind speed of 16 m/s.
Energies 15 04434 g0a5

References

  1. United Nations. United Nations Convention on the Law of the Sea of 10 December 1982. 2001. Available online: https://www.un.org/depts/los/convention_agreements/texts/unclos/UNCLOS-TOC.htm (accessed on 22 April 2022).
  2. Manabe, H.; Uehiro, T.; Utiyama, M.; Esaki, H.; Kinoshita, T.; Takagi, K.; Okamura, H.; Satou, M. Development of the floating structure for the Sailing-type Offshore Wind Farm. In Proceedings of the OCEANS 2008—MTS/IEEE Kobe Techno-Ocean, Kobe, Japan, 8–11 April 2008; pp. 1–4. [Google Scholar] [CrossRef]
  3. Tsujimoto, M.; Uehiro, T.; Esaki, H.; Kinoshita, T.; Takagi, K.; Tanaka, S.; Yamaguchi, H.; Okamura, H.; Satou, M.; Minami, Y. Optimum routing of a sailing wind farm. J. Mar. Sci. Technol. 2009, 14, 89–103. [Google Scholar] [CrossRef]
  4. FARWIND. Technology. Available online: https://farwind-energy.com/ (accessed on 20 July 2021).
  5. Babarit, A.; Clodic, G.; Delvoye, S.; Gilloteaux, J.C. Exploitation of the far-offshore wind energy resource by fleets of energy ships—Part 1: Energy ship design and performance. Wind Energy Sci. 2020, 5, 839–853. [Google Scholar] [CrossRef]
  6. Mitsui, O.S.K. Lines. “Wind Hunter Project” Starts—Zero-Emission Project with Wind Propulsion and Hydrogen. 2020. Available online: https://www.mol.co.jp/en/pr/2020/20080.html (accessed on 2 August 2021).
  7. Mitsui, O.S.K. Lines. “Wind Hunter Project” Zero Emission Ship Sailing by Wind and Hydrogen Succeeded in the Demonstration Experiment by the Yacht “WINZ MARU”. 2021. Available online: https://www.mol.co.jp/en/pr/2021/21112.html (accessed on 22 April 2022).
  8. Raj, A. Process for Harvesting, Storing, and Using Renewable Energy to Propel and Power Boats and Ships, and Maximize Their Average Speed. U.S. Patent 2015/0027125 A1, 29 January 2015. [Google Scholar]
  9. Gizara, A.R. Turbine-Integrated Hydrofoil. U.S. Patent 2007/0046028 A1, 1 March 2007. [Google Scholar]
  10. Meller, M. Wind-Power Linear Motion Hydrogen Production Systems. U.S. Patent 7,146,918 B2, 12 December 2006. [Google Scholar]
  11. Vidal, J.P. System for Propulsion of Boats by Means of Winds and Streams and for Recovery of Energy: Expired. U.S. Patent 4,371,346, 1 February 1983. [Google Scholar]
  12. Salomon, R.E. Process of Converting Wind Energy to Elemental Hydrogen and Apparatus Therefor. U.S. Patent 4,335,093, 15 June 1982. [Google Scholar]
  13. HySTRA. CO2-Free Hydrogen Energy Supply-Chain. Available online: http://www.hystra.or.jp/en/gallery/ (accessed on 19 July 2021).
  14. Beale, D.; Bonometti, J. Chapter 2: Systems Engineering (SE)—The Systems Design Process. Available online: https://www.eng.auburn.edu/~dbeale/ESMDCourse/Chapter2.htm (accessed on 22 April 2022).
  15. Rødseth, Ø.; Tjora, Å. A system architecture for an unmanned ship. In COMPIT’14; Hamburg University of Technology: Hamburg, Germany, 2014; pp. 291–302. [Google Scholar]
  16. Rødseth, Ø.; Lee, K. Secure Communication for E-Navigation and Remote Control of Unmanned Ships. In COMPIT’15; Hamburg University of Technology: Hamburg, Germany, 2015; pp. 44–57. [Google Scholar]
  17. Räuchle, K.; Plass, L.; Wernicke, H.J.; Bertau, M. Methanol for Renewable Energy Storage and Utilization. Energy Technol. 2016, 4, 193–200. [Google Scholar] [CrossRef]
  18. Office of Energy Efficiency & Renewable Energy. Materials-Based Hydrogen Storage. Available online: https://www.energy.gov/eere/fuelcells/materials-based-hydrogen-storage (accessed on 9 August 2021).
  19. Dresp, S.; Dionigi, F.; Klingenhof, M.; Strasser, P. Direct Electrolytic Splitting of Seawater: Opportunities and Challenges. ACS Energy Lett. 2019, 4, 933–942. [Google Scholar] [CrossRef]
  20. Guo, Y.; Li, G.; Zhou, J.; Liu, Y. Comparison between hydrogen production by alkaline water electrolysis and hydrogen production by PEM electrolysis. IOP Conf. Ser. Earth Environ. Sci. 2019, 371, 042022. [Google Scholar] [CrossRef]
  21. Shell International. Shell Hydrogen Study: Energy of the Future?-Sustainable Mobility through Fuel Cells and H2. Available online: https://wupperinst.org/fa/redaktion/downloads/projects/Shell_SH2S_StakeholderPresentation_080617.pdf (accessed on 3 August 2021).
  22. Han, D.; Liu, Y.; Huang, Z. The Use of Ammonia as a Fuel for Combustion Engines. In Engines and Fuels for Future Transport. Energy, Environment, and Sustainability; Kalghatgi, G., Agarwal, A.K., Leach, F., Senecal, K., Eds.; Springer: Singapore, 2022; Volume 42, pp. 233–256. [Google Scholar] [CrossRef]
  23. Siemens Energy. Power-to-X: A Closer Look at e-AMMONIA. Available online: https://www.siemens-energy.com/global/en/offerings/technical-papers/download-ptx-a-closer-look-at-e-ammonia.html (accessed on 9 June 2021).
  24. Lan, R.; Irvine, J.T.; Tao, S. Ammonia and related chemicals as potential indirect hydrogen storage materials. Int. J. Hydrog. Energy 2012, 37, 1482–1494. [Google Scholar] [CrossRef]
  25. Palys, M.J.; Daoutidis, P. Using hydrogen and ammonia for renewable energy storage: A geographically comprehensive techno-economic study. Comput. Chem. Eng. 2020, 136, 106785. [Google Scholar] [CrossRef]
  26. Wu, T.; Fan, W.; Zhang, Y.; Zhang, F. Electrochemical synthesis of ammonia: Progress and challenges. Mater. Today Phys. 2021, 16, 100310. [Google Scholar] [CrossRef]
  27. Zhen, X.; Wang, Y. An overview of methanol as an internal combustion engine fuel. Renew. Sustain. Energy Rev. 2015, 52, 477–493. [Google Scholar] [CrossRef]
  28. DACMa GmbH. BLANCAIR Is the First Direct Air Capture Machine that Continuously Captures Carbon Dioxide from the Ambient Air. Available online: https://www.blancair.com/wind-turbine/ (accessed on 2 August 2021).
  29. Siemens Energy. e-Methanol: A Universal Green Fuel. Available online: https://www.siemens-energy.com/global/en/offerings/technical-papers/download-e-methanol-white-paper.html (accessed on 9 June 2021).
  30. Holvik, J. Basics of Dynamic Positioning. In Proceedings of the Dynamic Positioning Conference, Houston, TX, USA, 13–14 October 1998. [Google Scholar]
  31. Sørensen, A.J. A survey of dynamic positioning control systems. Annu. Rev. Control 2011, 35, 123–136. [Google Scholar] [CrossRef]
  32. Carlton, J. Marine Propellers and Propulsion; Elsevier: Oxford, UK, 2012. [Google Scholar] [CrossRef]
  33. MAN Energy Solutions. Basic Principles of Ship Propulsion. Available online: https://www.man-es.com/docs/default-source/marine/tools/basic-principles-of-ship-propulsion_web_links.pdf?sfvrsn=12d1b862_10 (accessed on 13 July 2021).
  34. Jeong, B.; Oguz, E.; Wang, H.; Zhou, P. Multi-criteria decision-making for marine propulsion: Hybrid, diesel electric and diesel mechanical systems from cost-environment-risk perspectives. Appl. Energy 2018, 230, 1065–1081. [Google Scholar] [CrossRef] [Green Version]
  35. Chai, M.; Bonthapalle, D.R.; Sobrayen, L.; Panda, S.K.; Wu, D.; Chen, X. Alternating current and direct current-based electrical systems for marine vessels with electric propulsion drives. Appl. Energy 2018, 231, 747–756. [Google Scholar] [CrossRef]
  36. Gasch, R.; Twele, J.; Bade, P.; Conrad, W.; Heilmann, C.; Kaiser, K.; Kortenkamp, R.; Kühn, M.; Langreder, W.; Liersch, J.; et al. Windkraftanlagen; Vieweg+Teubner: Wiesbaden, Germany, 2005. [Google Scholar] [CrossRef]
  37. U.S. Naval Academy. Chapter 7: Resistance and Powering of Ships. In EN400: Principles of Ship Performance: Course Notes. Version: Spring 2020; U.S. Naval Academy: Annapolis, MD, USA, 2020; p. i–7–44. [Google Scholar]
  38. Püschl, W. Physik des Segelns: Wie Segeln Wirklich Funktioniert, 1st ed.; WILEY-VCH Verlag GmbH & Co. KGaA: Weinheim, Germany, 2012. [Google Scholar] [CrossRef]
  39. Vestas. 4MW Platform. Available online: https://nozebra.ipapercms.dk/Vestas/Communication/4mw-platform-brochure/?page=1 (accessed on 22 April 2022).
  40. IRENA. Future of Wind: Deployment, Investment, Technology, Grid Integration and Socio-Economic Aspects (A Global Energy Transformation Paper); International Renewable Energy Agency: Abu Dhabi, United Arab Emirates, 2019. [Google Scholar]
  41. Equinor. Hywind Scotland Remains the UK’s Best Performing Offshore Wind Farm. 2021. Available online: https://www.equinor.com/en/news/20210323-hywind-scotland-uk-best-performing-offshore-wind-farm.html (accessed on 18 July 2021).
  42. Smith, A.Z. Germany’s Offshore Wind Capacity Factors. 2015. Available online: https://energynumbers.info/germanys-offshore-wind-capacity-factors (accessed on 11 January 2022).
  43. Jamil, R.A.; Chaigneau, A.; Gilloteaux, J.C.; Lelong, P.; Babarit, A. Comparison of the capacity factor of stationary wind turbines and weather-routed energy ships in the far-offshore. J. Physics: Conf. Ser. 2019, 1356, 012001. [Google Scholar] [CrossRef] [Green Version]
  44. Fingersh, L.; Hand, M.; Laxson, A. Wind Turbine Design Cost and Scaling Model: Technical Report: NREL/TP-500-40566. Available online: https://www.nrel.gov/docs/fy07osti/40566.pdf (accessed on 3 August 2021).
  45. Hydrogenics. HySTAT® HyDROGEN GENERATORS. Available online: https://pdf.directindustry.com/pdf/hydrogenics/hystat-hydrogen-generators/33492-420313.html (accessed on 22 April 2022).
  46. Yildiz, T. Design and Analysis of a Lightweight Composite Shipping Container Made of Carbon Fiber Laminates. Logistics 2019, 3, 18. [Google Scholar] [CrossRef] [Green Version]
  47. HESC. Hydrogen Energy Supply Chain (HESC): A World-First Project. 2022. Available online: https://www.hydrogenenergysupplychain.com/ (accessed on 12 March 2022).
  48. ASME. An International Code: 2015 ASME Boiler & Pressure Vessel Code VIII: Rules for Construction of Pressure Vessels, Division 1, 2015th ed.; The American Society of Mechanical Engineers: New York, NY, USA, 2015. [Google Scholar]
  49. Seeli, H.; Dorapudi, S.H.; Satish, P.V.; Kumar, S.N. Designing and Analysis of Cryogenic Storage Vessels. Int. J. Sci. Eng. Res. 2016, 7, 65–76. [Google Scholar]
  50. Bulling, B. Why Are Spherical Storage Tanks Prevalent in Gas & Oil Facilities? 2015. Available online: https://www.linkedin.com/pulse/why-spherical-storage-tanks-prevalent-gas-oil-bryan-bulling (accessed on 2 August 2021).
  51. VDI, E.V. (Ed.) VDI-Wärmeatlas, 11th ed.; Springer: Berlin/Heidelberg, Germany, 2013. [Google Scholar] [CrossRef]
  52. Martin, N. Germany and Hydrogen €9 Billion to Spend as Strategy Is Revealed. 2020. Available online: https://www.dw.com/en/germany-and-hydrogen-9-billion-to-spend-as-strategy-is-revealed/a-53719746 (accessed on 3 August 2021).
Figure 1. Floating wind farm proposed by the NIES; Reprinted with permission from Ref. [2]. 2008, IEEE.
Energies 15 04434 g001
Figure 2. Farwind energy ship [5].
Energies 15 04434 g002
Figure 3. Concept of the Wind Hunter Project; Reprinted with permission from Ref. [6]. 2020, MOL.
Energies 15 04434 g003
Figure 4. Mapping of requirements to subsystems.
Energies 15 04434 g004
Figure 5. Liquid hydrogen as the stored fuel.
Energies 15 04434 g005
Figure 6. Use of electric propulsion in the SailREC System.
Energies 15 04434 g006
Figure 7. Sketch of the SailREC System for the Downwind&Upwind control strategy.
Energies 15 04434 g007
Figure 8. Sketch of the Circle sailing strategy.
Energies 15 04434 g008
Figure 9. Simplified illustration of the forces and velocities while sailing beam reach; inspired by [38] (p. 16).
Energies 15 04434 g009
Figure 10. Effective power of different sailing strategies; dashed lines indicating the produced power curves after reaching rated power.
Energies 15 04434 g010
Figure 11. Concept sketch (not proportionally scaled). (a) View from behind. (b) View from the left.
Energies 15 04434 g011
Figure 12. Sketch of the liquid hydrogen storage container (view from the top).
Energies 15 04434 g012
Table 1. List of trade parameters, their fuel-specific values, and weights used.
Trade ParametersUnitParameter ValuesWeights
Liquid HydrogenGaseous HydrogenAmmoniaMethanol
LCOE[€cent/kWh]24.4518.8138.1622.2910
Environmental friendliness[-]43217
Partial load capability[-]341.51.55
Displaced water volume[m3]62.50164.58144.24158.024
TRL[-]431.51.54
Transport infrastructure
readiness level in 2032
[-]1.51.5434
Safety of maintenance personnel[-]32142
Scaled and weighted final value[-]29.4427.2718.0420.14
Rank[-]1243
Table 2. Rating matrix of a fixed-location wind turbine and the sailing strategies Downwind&Upwind, Circle, and Beam Reach; rating from 1 (best) to 4 (worst).
Sailing StrategyCapacity FactorPrated Wind Speed RangeEase of Technical Realisation
Beam Reach1low–high4
Circle2high3
Downwind&Upwind4high2
Fixed-location offshore wind turbine2medium1
Table 3. Main properties of the proposed concept.
PropertyValue
Wind turbine rated power, mass4 MW, 435 t
Electrolyser power, mass1.93 MW, 80 t
Time of one energy harvesting cycle60 d
Energy harvested per harvesting cycle1100 MWhH2
Fuel to be producedLiquid hydrogen
Energy storage solution, mass (including H2)Double-walled, vacuum-insulated stainless steel tank in a containerised solution, 217 t
Total capacity of 40-ft equivalent containers44
Number of 40-ft containers carried for energy storage14
Number of 20-ft containers carried for electrolysis5
Mass of additional hardware (e.g., liquefaction plants)200 t
System length, width72.2 m, 74.3 m
Structural mass (e.g., struts, beams)642 t
Publisher’s Note: MDPI stays neutral with regard to jurisdictional claims in published maps and institutional affiliations.

