Essay

Molecular Dynamics Simulation of the Oil–Water Interface Behavior of Modified Graphene Oxide and Its Effect on Interfacial Phenomena

1
School of Petroleum Engineering, China University of Petroleum (East China), Qingdao 266580, China
2
School of Foreign Languages, Hubei University of Technology, Wuhan 430068, China
*
Author to whom correspondence should be addressed.
Energies 2022, 15(12), 4443; https://doi.org/10.3390/en15124443
Submission received: 20 May 2022 / Revised: 9 June 2022 / Accepted: 15 June 2022 / Published: 18 June 2022
(This article belongs to the Topic Applications of Nanomaterials in Energy Systems)

Abstract

:
Graphene oxide, as a new two-dimensional material, has a large specific surface area, high thermal stability, excellent mechanical stability and exhibits hydrophilic properties. By combining the carboxyl groups on the surface of graphene oxide with hydrophilic groups, surfactant-like polymers can be obtained. In this paper, based on the molecular dynamics method combined with the first nature principle, we first determine the magnitude of the binding energy of three different coupling agents—alkylamines, silane coupling agents, and haloalkanes—and analytically obtain the characteristics of the soft reaction. The high stability of alkylamines and graphene oxide modified by cetylamine, oil, and water models was also established. Then, three different chain lengths of simulated oil, modified graphene oxide–water solution, and oil-modified graphene oxide–water systems were established, and finally, the self-aggregation phenomenon and molecular morphology changes in modified graphene oxide at the oil–water interface were observed by an all-atom molecular dynamics model. The density profile, interfacial formation energy, diffusion coefficient and oil–water interfacial tension of modified graphene oxide molecules (NGOs) at three different temperatures of 300 K, 330 K, and 360 K were analyzed, as well as the relationship between the reduced interfacial tension and enhanced oil recovery (EOR).

1. Introduction

Polymers, surfactants, and alkalis are the main repellents in current chemical flooding, but a single chemical can only improve the oil displacement efficiency or sweep efficiency. Combination flooding [1] has synergistic effects, with surfactants significantly reducing the interfacial tension at the oil–water interface and increasing the number of capillary numbers. Alkalis injected into the reservoir can chemically react with organic acids in the reservoir, thereby reducing adsorption losses. However, the traditional tertiary oil recovery chemical agents, which can improve the level of recovery, are limited, The nanoparticles are uniform in size and can form compact, well-structured monolayers at the water/non-aqueous phase interface. The emulsions are very stable under high temperatures and high-salt reservoir conditions [2]. Nanoparticle-stabilized emulsions have a high viscosity, which can help manage migration rates during oil transport and provides a viable method of pushing highly viscous oil out of the subsurface, relative to surfactants with a high retention on reservoir rocks [3]. Some oil fields in the geological reserves still constitute 50% of the unswept region, and people are in urgent need of a breakthrough in conventional chemical agents to significantly improve recovery factors [4].
Nanoparticles have the advantages of a large specific surface area and small size and have some special properties different from those of conventional chemical agents. A large number of scholars in China and abroad have carried out a series of theoretical, experimental, and simulation work on the influence of the concentration, size, and charge of nanoparticles on the oil recovery factor [5,6,7]. Wang et al. [8] found that oil droplets could be spontaneously detached from the solid surface when the charge of the nanofluid composed of charged nanoparticles reached a certain critical value. The modified nanoparticles can effectively reduce the interfacial tension and improve the carrying capacity of water relative to the oil phase. Luo et al. [9] used molecular dynamics to study the self-assembly behavior of SiO2 nanoparticles at the oil–water interface and found that the modified nanoparticles could effectively reduce the interfacial tension and improve the carrying capacity of water relative to the oil phase. Jia et al. [10] used experimental methods and found that amphiphilic graphene flake nanofluids could form a solid interfacial film, which reduced the interfacial tension at the oil–water interface. Through this mechanism, the oil droplets on the rock surface were desorbed. Compared with conventional chemical flooding, in this agent, the oil displacement efficiency of nanofluids was increased by two times.
At present, the research on nanoparticles is mainly focused on experimental aspects [11,12,13]. The simulation means for modified nanoparticles are still at the stage of exploration and realization [14,15]. This study selected alkyl-modified graphene oxide as the research object and used the all-atom molecular dynamics simulation method [16] to study the diffusion of modified nanoparticles (NGOs) in the aqueous phase and the self-aggregation phenomenon at the oil–water interface. We also established two different models through the visualization software Materials Studio. Model I analyzed the dispersion nature of nanoparticles in the aqueous phase, Model I analyzed the dispersion properties of nanoparticles in the water phase, while Model II observed the molecular configuration of nanoparticles at the oil–water interface and the self-aggregation phenomenon of nanoparticles at the oil–water interface. The interaction of modified nano molecules on the oil–water phase at three temperatures was investigated according to the constructed models, and finally, the effect of modified graphene oxide on the interfacial tension at different temperatures was revealed.

2. Models and Methods

Molecular dynamics simulation is commonly used method for the software, Material Studio, Lammps, Amber, etc. This visualization software, with built-in rich algorithms, a powerful interactive interface, and multi-scale and multi-functional modules, is widely used in the field of molecular property simulation. The properties of the oil–water interface [17], the aggregation pattern of the solution [18], and the wettability of oil droplets on the solid surface [19] were investigated by domestic and foreign scholars under the action of chemical flooding systems. The simulation process is chosen from all-atom molecular dynamics simulation, which has the advantage of a high accuracy compared to dissipative molecular dynamics simulation [20].

2.1. Model Construction

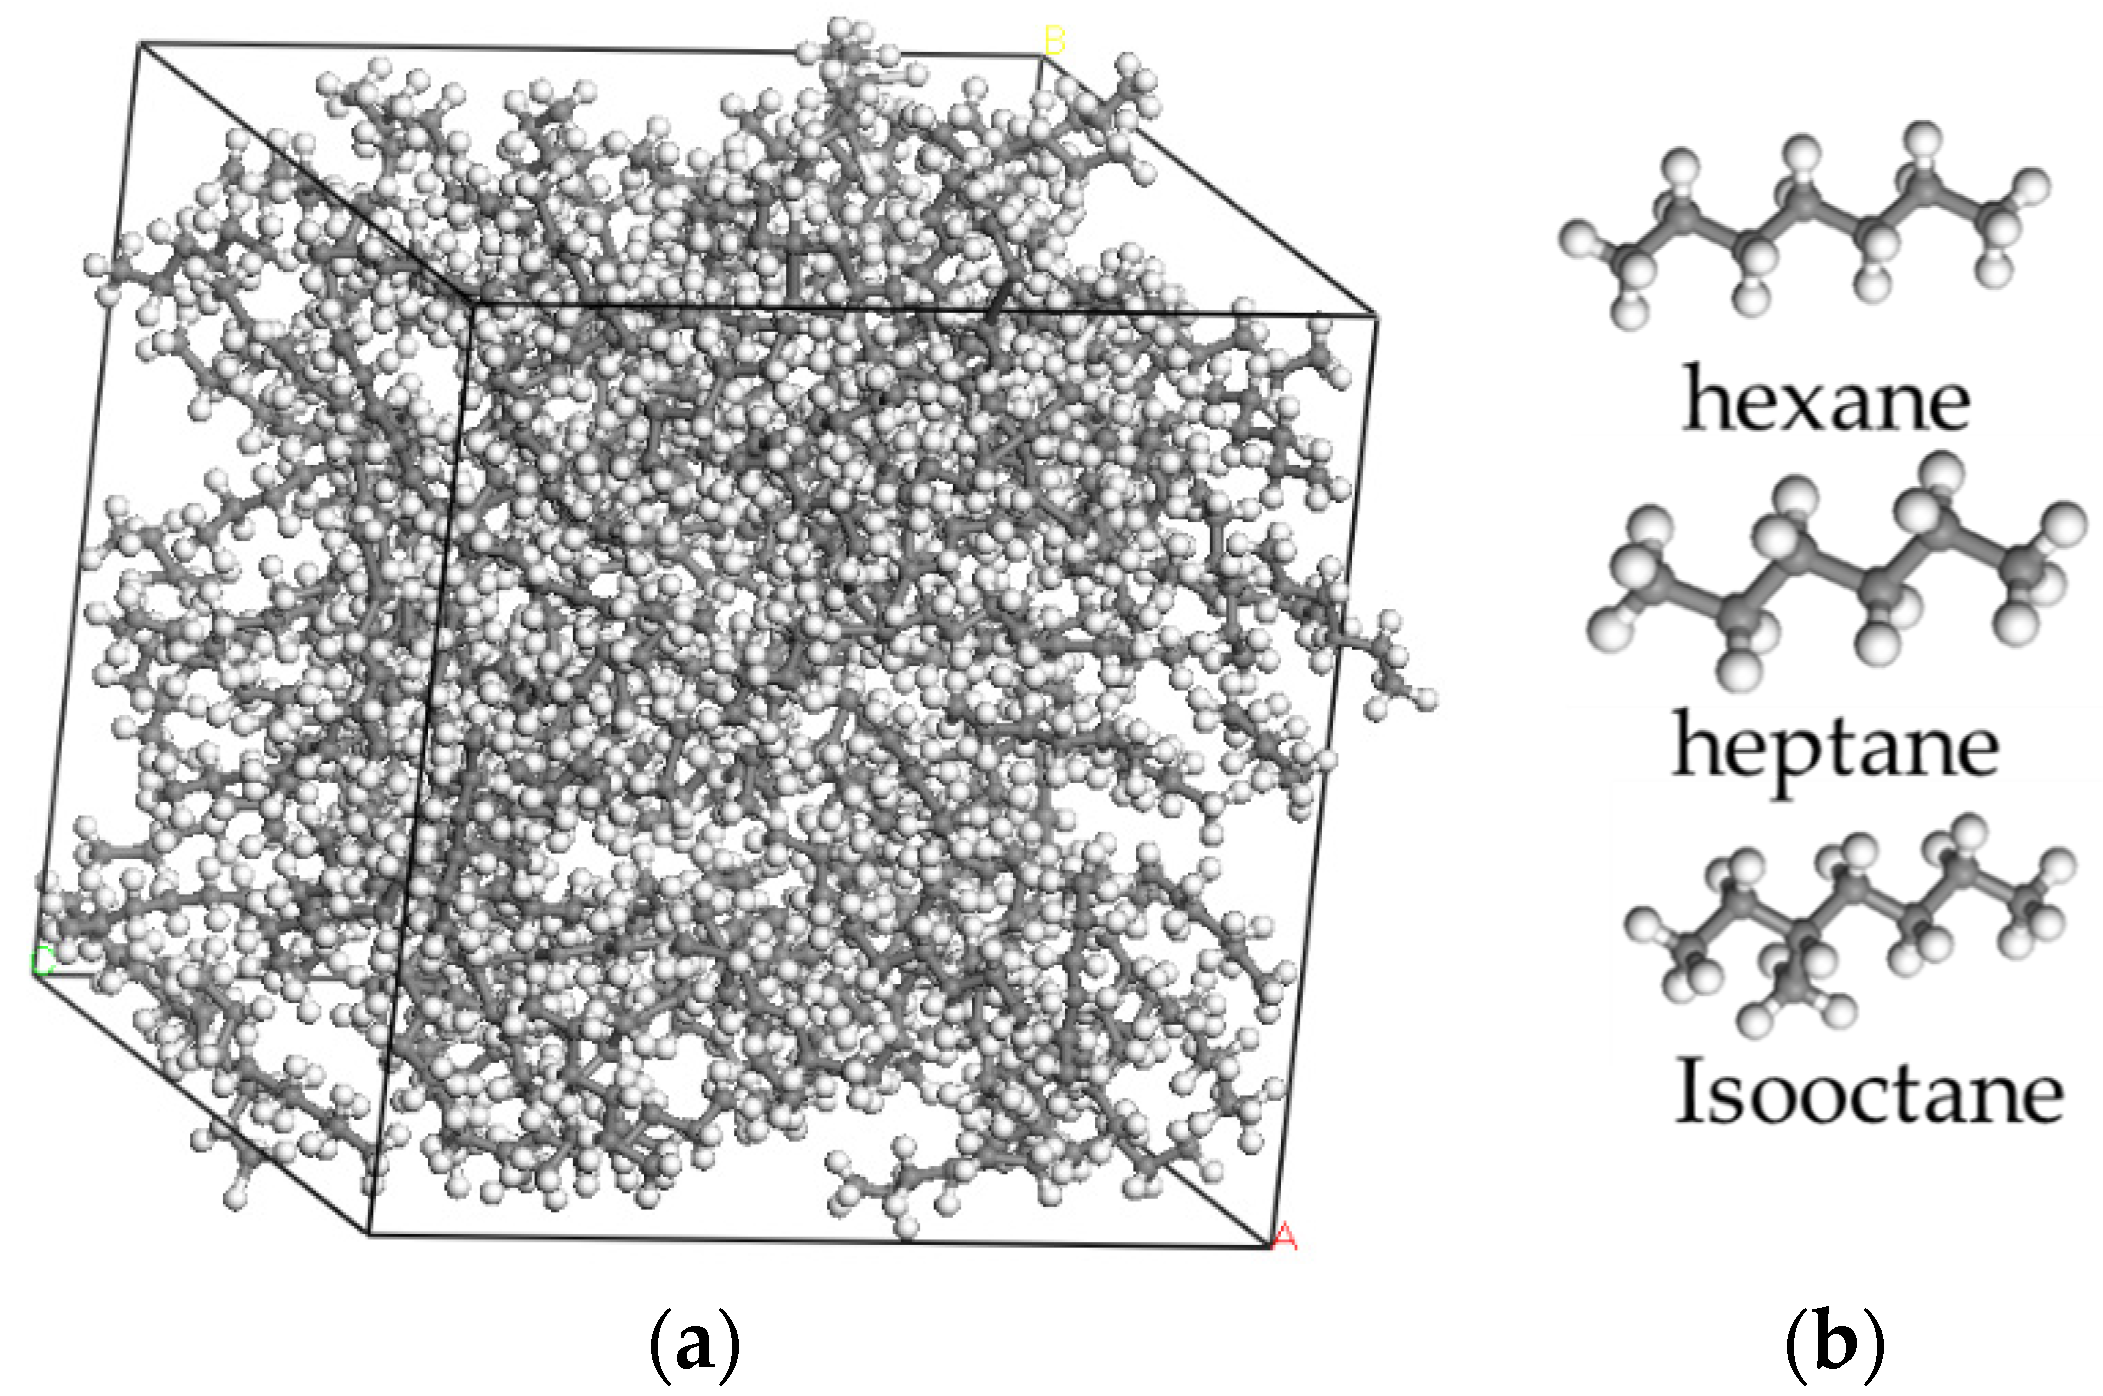
The simulations were completed with Materials Studio (MS) software, and the simulation process was carried out using the COMPASS force field [21]. Firstly, the simulations established three crude oil systems with different molecular compositions of hexane, heptane, and isooctane, as shown in Figure 1.
The binding energies required for the reaction of the three different coupling agents with graphene oxide were obtained according to the first principle [22], and the parameters are shown in Table 1. The binding energy of haloalkane with graphene oxide was +0.47, which means that the reaction of haloalkane with graphene oxide was not easy to carry out; the reaction conditions were harsh, and the resulting structures were unstable. However, the binding energies of −1.96 and −1.68, for alkylamines and silane coupling agents with graphene oxide, respectively, indicate that the reaction process of alkylamines and silane coupling agents with graphene oxide is easier; the reaction conditions are milder and the resulting products have a good structural stability.
To investigate the effect of graft length on the properties of graphene oxide, the binding energies of thirteen, sixteen, and nineteen alkylamines were separately investigated. As shown in Table 2, the binding energies gradually decreased with increasing alkylamine carbon chain length, indicating that, as the alkylamine carbon chain length increased, the reaction proceeded with more ease, and the structure of the resulting modified graphene oxide products became more stable.
To investigate the interaction between water molecules, the reservoir surface, and modified graphene oxide, the adsorption energy of water molecules on the surface of the modified graphene oxide was simulated.
As shown in Table 3, with 13 alkylamines, the adsorption energy of the modified water molecule is −1.06; with 16 alkylamines, the modified graphene oxide adsorption energy is −0.94; and with 19 alkyls, the modified graphene oxide adsorption energy is −0.76. The adsorption of water molecules on both types of modified graphene oxide is an exothermic process, and the surface of the modified product is strongly chemisorbed. Additionally, the octadecylamine-modified graphene oxide had the weakest interaction with water compared to the other chain lengths.
An analysis of the change in binding energy and adsorption energy shows that as the graft chain length increases, the exothermic reaction is enhanced and the binding energy increases. As the graft chain length increases, the adsorption is a spontaneous process and the adsorption energy decreases. On balance, the final choice was to choose s with a relatively smooth reaction process, a high adsorption energy of the modified molecules with water, and a better reduction in interfacial tension.
By oxidizing a thin layer of graphene, structures containing -COOH and -OH on the surface could be obtained. In this study, alkyl long-chain groups were grafted onto the surface of graphene oxide using the azide chemical reaction of cetylamine, as shown in Figure 2.
A thin-layer, graphene oxide model with a diameter of 1.8 nm was constructed, and seven cetylamine long chains were grafted on the unilateral side of the graphene oxide model to obtain partially alkyl-modified graphene oxide nanoparticles (NGOs). The NGOs before and after modification are shown in Figure 3.
To investigate the dispersion properties of nanoparticles in water, a water–NGO miscible system was built. A square simulation box with a size of 21.92 Å × 21.92 Å × 21.92 Å was created by “amorphous cells tools”. The mixed solution system contained 56.4% water and 42.6% NGOs. The initial constructed model is shown in Figure 4a. To investigate the self-aggregation of nanoparticles at the oil–water interface, a columnar simulation box of 26.25 Å × 26.25 Å × 777.61 Å was constructed by the “build layer” tool. To eliminate the influence of periodic boundaries, a thickness of 10 was added above the oil model. The initial model of the vacuum layer is shown in Figure 4b, the molecular dynamics simulation was performed using the “forcite tools”, and the simulation parameters are shown in Table 4.

2.2. Mathematical Model Construction

This simulation used an all-atom molecular dynamics simulation approach, and the Newton’s Equation of motion (1) was used during the simulation:
F i ( t ) = m i a i ( t )
where: F i is combined force on the molecule, m i is relative molecular mass, a i is the acceleration of the molecule. The force on the atom can be obtained from the potential energy concerning the position in the coordinate system as Equation of motion (2):
V r i = m i 2 r i t 2
Because there are no charged molecules in the system, the potential energy function [23] discards electrostatic interactions and constructs a potential energy function that includes inter-bonding atomic interactions and van der Waals forces, with the specific functional relationship shown in Equation (3):
V = b o n d s k r ( r r e q ) 2 + a n g l e s k θ ( θ θ e q ) 2 + d i h e d r a l k ϕ ( 1 + cos [ n ϕ γ ] ) + i < j a t o m s ε i j [ ( r m r i j ) 12 2 ( r m r i j ) 6 ]
where: k r is force constant, r e q is equilibrium bond length, θ e q is equilibrium bond angle, ε i j is van der Waals force constant between atoms, r m is the minimum distance between atoms, and r i j is the distance between atoms at equilibrium.
The integration process uses the Verlet (1967) integral equation of motion algorithm. The advantages of the Verlet integrator are that it has only one energy evaluation per step, requires only a modest amount of memory, and allows relatively large time steps to be used. The Verlet velocity algorithm overcomes the disadvantages of the Verlet step-over method, which is not synchronous. The Verlet velocity algorithm is provided in Equations (4)–(6):
r ( t + Δ t ) = r ( t ) + Δ t v ( t ) + Δ t 2 a ( t ) 2
a ( t + Δ t ) = f ( t + Δ t ) m
v ( t + Δ t ) = v ( t ) + 1 2 Δ t [ a ( t ) + a ( t + Δ t ) ]
where: r ( t ) is relative position, v ( t ) is relative velocity, and a ( t ) is the acceleration of the atom.

2.3. Simulation Details

For Model I, 500 ps of canonical tethered MD simulations were carried out with a simulated temperature of 300 K. For Model II, 500 ps of isothermal isobaric (NPT) MD simulations were first carried out with a pressure level of 0.1 MPa, followed by 500 ps of canonical tethered MD simulations, with three simulated temperatures of 300 K, 330 K, and 360 K selected. The Andersen method [24] was used for temperature control; the Be-redden method [25] was used for pressure control; the Coulomb interaction was calculated using the Ewald method [26]; the truncation radius was 1 nm; the step size was 1.0 fs; and every 100 ps the system trajectory information was recorded once.

3. Characterization of Molecular Dynamics Simulation Results

3.1. Visualization Characterization

The visualization results of Model I are shown in Figure 5. The left panel shows that, after a 500 ps canonical system synthesis simulation, the nanoparticles gradually leaned towards the center through the attraction of their own branched chains and the repulsion of the branched chains by water. The right panel of Figure 5 shows that the nanoparticles are well-dispersed among themselves and show different characteristics from conventional surface-active multimolecular aggregation.
The visualization model of Model II is shown in Figure 6a: the simulation process of NGOs goes through two processes. The first process is the transport of water solution towards the oil–water interface. The second process is the spontaneous orientation of the lipophilic end towards the oil phase, and the spontaneous orientation of the hydrophilic end towards the water phase. The regular self-aggregation at the oil–water interface is shown in Figure 6b.

3.2. Density Profile

The alkyl groups in the modified molecules are mixed with the oil phase, and the GO molecules are distributed on the water phase interface because of the polar group -OH. As shown in Figure 6, the oil and water phases are regularly separated by the modified nanoparticle NGOs. To more intuitively observe the self-assembled structure of the NGOs in the oil–water interface layer and the distribution of oil, water, alkyl, and GO molecules at the interface, the density distribution curves of various molecules along the Z-axis direction were calculated, as shown in Figure 7. The nanoparticle NGOs formed a more disordered self-assembled interfacial film structure. An analysis of the density profiles showed that a distinct oil–water interface at 35 Å formed after being distributed, and the nanoparticles were mainly found in the interfacial range of 15 Å–45 Å.
As shown in Figure 7, the systems appearing along the Z-axis direction are the water phase and NGO–oil phase, with alkyl groups mainly distributed on the oil side. The graphene oxide thin layers are mainly distributed on the water side, forming an interfacial film system at the oil–water interface.

3.3. Interfacial Formation Energy

In order to investigate the stability of the interface in the presence of NGOs at three temperatures, the interaction energy between nanoparticles and water molecules was calculated, the calculation process is shown in Equation (7):
Δ E = ( E N a n o + E W a t e r ) E T o t a l V N a n o
where: Δ E is interaction energy per unit volume; E T o t a l is the total energy of the nanoparticle and water phase system; E N a n o is the energy of the nanoparticle; E W a t e r is the energy of the water phase; and V N a n o is occupied volume of the nanoparticle.
From Table 5, it can be observed that the interaction energy between nanoparticles and water becomes smaller as the temperature increases, indicating that an increasing temperature can reduce the resistance to movement between nanoparticles and water, making them easier to transport to the oil–water interface.

3.4. Diffusion Coefficient

The aggregation pattern of each molecule significantly affects the microstructure of the oil–water emulsion system. The nanoparticulate NGOs are spontaneously transported from the aqueous phase to the oil–water interface, and the temperature resistance and diffusion rates of the NGOs are analyzed by comparing the mean square displacement (MSD), as shown in Equation (8), at the three temperatures of 300 K, 330 K, and 360 K set by the model. The mean square displacement can be characterized by a diffusion coefficient ( D ) related to the simulation time [27]:
D = 1 6 N lim t d d t i = 1 N { [ r i ( t ) r i ( 0 ) ] 2 }
where D is the diffusion coefficient of the molecule, N is a molecular term of diffusion in the system, r i ( t ) is the position of the molecule at the moment, and the differential term is the ratio of mean square displacement to time.
The calculation shows that the mean squared displacement MSD is 7.43 Å at 300 K, 11.98 Å at 330 K, and 18.64 Å at 360 K. As the temperature increases, the NGO diffusion coefficient becomes larger. These results mainly originate from the interaction of the nanoparticle NGOs with the oil phase. The interaction of the surface-oxidized GO molecules with the aqueous phase was much larger than that with the oil phase, and the interaction with the oil phase was greatly enhanced by the surface-grafted cetylamine, so the transportability of the NGOs along the Z-axis was much larger than that of the nanoparticles in the X and Y directions. The results show that the surface-modified alkylamine graphene oxide is highly susceptible to aggregation towards the oil–water interface.
The NGOs move under the combined action of water and oil [28]. As can be seen from Figure 8, the higher the temperature, the greater the slope of the nanoparticle dynamic diffusion curve. It can be observed that the free energy of the mixed-phase is increased and the relative intermolecular displacement rate is expanded under the action of a high temperature, while the NGOs are found to have a good temperature resistance according to the molecular equilibrium conformation.

3.5. Interfacial Tension

The oil phase is divided from the water phase by NGOs, forming a clear oil–water interface. Conventional surfactants can be used to improve recovery by reducing the surface tension at the oil–water interface. Numerous experiments demonstrated that modified 2D nanomaterials can significantly improve the recovery rate of cores. In this paper, the interfacial tensions at the oil–water interface, and at the oil−NGO−water interface at three temperatures of 300, 330, and 360 K, were calculated based on Equation (9) [29], and the results are shown in Figure 9:
γ = 1 2 L z [ p z z 1 2 ( p x x + p y y ) ]
where L z denotes the length of the system in the z-axis direction. p x x , p y y , p z z are denoted by the pressure tensor in the x , y , and z directions, respectively.
In order to compare the effect of conventional surfactants with modified graphene oxide by reducing interfacial tension, the oil–water surface tension of three systems (disodium laureth sulfosuccinate DLS, disodium cocoate monoethanolamide sulfosuccinate DMSS and modified graphene oxide) was measured. The results are shown in Table 6, and the modified graphene oxide was the most effective in reducing interfacial tension.
From Table 7, the interfacial tension in both systems decreases with increasing temperature, and the interfacial tension of the system without the addition of NGOs decreases by 7.2 mN·m−1 with increasing temperature. The analysis showed that the modified graphene oxide could still significantly reduce the interfacial tension between oil and water at 360 K, showing an excellent temperature resistance. The decrease in interfacial tension was observed at all three temperatures with the addition of NGOs, as shown in Table 7, and it was found that the NGOs could be excellent surfactant substitutes.
In the process of tertiary oil recovery, the remaining oil is mainly subject to the combined effect of pressure gradient force, surface tension, cohesive force [30], oil drops and oil films, which are the main methods of maintaining oil in the pore space. By using interfacial tension as an important parameter to describe the nature of the oil–water interface, this paper analyzes the force of oil droplets and oil films in the nanopore space to obtain the mechanism of tertiary oil recovery to improve the recovery factor.
The cohesive force: When there is relative motion between the oil droplets and the solid surface, a force that blocks this motion occurs, and a force of this nature is known as the cohesive force. Pressure gradient force is the constant velocity in the flow through a small orifice compared with the value of change in pressure per unit time. Surface tension can be considered as the contraction force acting on the interface of a unit length of liquid.
It can be observed from Figure 10 that, after NGOs were added, the surface tension (orange line in Figure 10) at the oil drops and oil films in the remaining oil becomes less intense, resistance to the three recovery processes and the kinetic energy required at the injection end decrease, and the remaining oil is more easily displaced.

4. Conclusions

The binding energies of alkylamines, silanes, and haloalkanes were compared, and the most stable binding was found for alkylamines. Using this substance as the object of the study, it was found that the grafted nanoparticles were uniformly dispersed in the aqueous solution without agglomeration. The lipophilic end aggregated towards the center of the molecule, showing a dispersion characteristic different from that of conventional surfactants, which form micelles in solution. After surface grafting of graphene oxide, there are a large number of polar hydroxyl groups on the surface layer, which exhibit a strong hydrophilicity, while a large number of alkyl groups exist on one side, showing strong lipophilicity. Unlike conventional surfactants, a single NGO can exhibit the characteristics of multiple surfactant molecules at the oil–water interface.
The simulations show that there is a self-aggregation phenomenon of NGOs at the oil–water interface, specifically the two processes of transport to the oil–water interface and regular at the oil–water interface. After these two stages, a disordered monolayer interfacial film can be formed at the oil–water interface, and the interfacial film can make the oil–water interface irregular, improving the carrying capacity of water to the oil phase. After the addition of NGO nanoparticles, the increase in temperature reduces the free energy of the interfacial layer, which reduces the resistance between the nanoparticles and the water phase, and the NGOs can be dispersed in the oil–water interface faster, thus accelerating the decrease in the interfacial tension between oil and water. Less energy is required at the injection end, thus making it easier to displace oil drops in small pores and oil films adsorbed on rock surfaces in tertiary oil recovery.

Author Contributions

Conceptualization, J.W. and S.T.; methodology, S.T.; software, S.T.; validation, X.W., Y.H. and Y.F.; formal analysis, S.T.; investigation, Q.X.; resources, X.L.; data curation, X.L.; writing—original draft preparation, S.T.; writing—review and editing, S.T.; visualization, J.W.; supervision, J.W.; project administration, J.W.; funding acquisition, J.W. All authors have read and agreed to the published version of the manuscript.

Funding

The APC was funded by [Wang, J.].

Institutional Review Board Statement

Not applicable.

Informed Consent Statement

Not applicable.

Data Availability Statement

Not applicable.

Conflicts of Interest

The authors declare no conflict of interest.

References

  1. Li, J.B.; Niu, L.W.; Lu, X.G. Performance of ASP compound systems and effects on flooding efficiency. J. Pet. Sci. Eng. 2019, 178, 1178–1193. [Google Scholar] [CrossRef]
  2. Mandal, A.; Bera, A.; Ojha, K. Characterization of Surfactant Stabilized Nanoemulsion and Its Use in Enhanced Oil Recovery. In Proceedings of the SPE International Oilfield Nanotechnology Conference and Exhibition, Noordwijk, The Netherlands, 12 June 2012. [Google Scholar]
  3. Qiu, F.D.; Mamora, D. Experimental Study of Solvent-Based Emulsion Injection to Enhance Heavy Oil Recovery in Alaska North Slope Area. In Proceedings of the Canadian Unconventional Resources and International Petroleum Conference, Calgary, AB, Canada, 19 October 2010. [Google Scholar]
  4. Hanam, S.; Hyuntae, K.; Geunju, L.; Jinwoong, K.; Wonmo, S. Enhanced oil recovery using nanoparticle-stabilized oil/water emulsions. Korean J. Chem. Eng. 2014, 31, 338–342. [Google Scholar]
  5. Irfan, S.A.; Shafie, A.; Yahya, N.; Zainuddin, N. Mathematical Modeling and Simulation of Nanoparticle-Assisted Enhanced Oil Recovery—A Review. Energies 2019, 12, 1575. [Google Scholar] [CrossRef] [Green Version]
  6. Maurya, N.K.; Mandal, A. Investigation of synergistic effect of nanoparticle and surfactant in macro emulsion based EOR application in oil reservoirs. Chem. Eng. Res. Des. 2018, 132, 370–384. [Google Scholar] [CrossRef]
  7. He, Y.F.; Liao, K.L.; Bai, J.M.; Fu, L.P.; Ma, Q.L. Study on a Nonionic Surfactant/Nanoparticle Composite Flooding System for Enhanced Oil Recovery. ACS Omega 2021, 6, 11068–11076. [Google Scholar] [CrossRef]
  8. Wang, J.H.; Wu, H.A. Enhanced oil droplet detachment from solid surfaces in charged nanoparticle suspensions. Soft Matter 2013, 9, 7974–7979. [Google Scholar] [CrossRef]
  9. Luo, F.C.; Ding, B.; Wang, P.H. Molecular dynamics simulation of adsorption properties of alkane-modified SiO2 nanoparticles at oil/water interface. J. China Univ. Pet. 2015, 39, 130–137. [Google Scholar]
  10. Jia, H.; Huang, P.; Han, P.G.; Wang, Q.X.; Wei, X. Synergistic effects of Janus graphene oxide and surfactants on the heavy oil/water interfacial tension and their application to enhance heavy oil recovery. J. Mol. Liq. 2020, 314, 113791–113800. [Google Scholar] [CrossRef]
  11. Wasan, D.T.; NIikolov, A.D. Spreading of nanofluids on solids. Nature 2003, 423, 156–159. [Google Scholar] [CrossRef]
  12. Kondiparty, K.; Nikolov, A.D.; Wasan, D.; Liu, K.L. Dynamic Spreading of Nanofluids on Solids. Part I: Experimental. Langmuir 2012, 28, 14618–14623. [Google Scholar] [CrossRef]
  13. Chen, H.J.; Di, Q.F.; Ye, F.; Gu, C.Y. Numerical simulation of drag reduction effects by hydrophobic nanoparticles adsorption method in water flooding processes. J. Nat. Gas Sci. Eng. 2016, 35, 1261–1269. [Google Scholar] [CrossRef]
  14. Bellussi, F.M.; Laspalas, M.; Chiminelli, A. Effects of Graphene Oxidation on Interaction Energy and Interfacial Thermal Conductivity of Polymer Nanocomposite: A Molecular Dynamics Approach. Nanomaterials 2021, 11, 1709. [Google Scholar] [CrossRef] [PubMed]
  15. Feng, Y.; Hou, J.R.; Yang, Y.L.; Wang, D.S.; Wang, L.K. 2-D Molecular dynamics simulation of the microscopic oil repulsion mechanism at the oil-water interface of nano black card. Oilfield Chem. 2022, 51, 1292–1305. [Google Scholar]
  16. Tsourtou, F.D.; Peroukidis, S.D.; Peristeras, L.D. The phase behaviour of cetyltrimethylammonium chloride surfactant aqueous solutions at high concentrations: An all-atom molecular dynamics simulation study. Soft Matter 2022, 18, 1371–1384. [Google Scholar] [CrossRef]
  17. Li, N.; Sun, Z.Q.; Pang, Y.H. Microscopic mechanism for electrocoalescence of water droplets in water-in-oil emulsions containing surfactant: A molecular dynamics study. Sep. Purif. Technol. 2022, 289, 120756–120769. [Google Scholar] [CrossRef]
  18. Liu, Z.N. MD Simulation-Based Study of the Aggregation Behaviour of Alkyl Benzene Sulfonate Surfactants at the Oil/Water Interface. Master’s Thesis, Northeastern Petroleum University, Daqing, China, 2022. [Google Scholar]
  19. Zhong, J. Molecular Simulation Study of Reservoir Wettability Formation and Its Regulation. Master’s Thesis, China University of Petroleum (East China), Qingdao, China, 2016. [Google Scholar]
  20. Deng, X.J. Simulation Study of the Micelle Aggregation Behavior of Baryonic Surfactants in Solution. Master’s Thesis, China University of Petroleum, Beijing, China, 2021. [Google Scholar]
  21. Kondratyuk, N.D.; Pisarev, V.V. Calculation of viscosities of branched alkanes from 0.1 to 1000 MPa by molecular dynamics methods using COMPASS force field. Fluid Phase Equilibria 2019, 498, 151–159. [Google Scholar] [CrossRef]
  22. Gao, M.K.; Wei, S.Z. First-principles study of the electronic properties of the (Fe, Cr)7C3/MoC interface. Mater. Guide 2022, 36, 87–92. [Google Scholar]
  23. Shan, D.D.; Zhu, J.G.; Shao, Q.F. Numerical simulation study of nanodrop wetting on graphene oxide surface. Technol. Innov. 2021, 23, 101–102, 105. [Google Scholar]
  24. Ström, B.; Rota, A.; Linde-Forsberg, C. In vitro characteristics of canine spermatozoa subjected to two methods of cryopreservation. Theriogenology 1997, 48, 247–256. [Google Scholar] [CrossRef]
  25. Sepehri, M.; Moradi, B.; Emamzadeh, A. High Thickness Uniformity Vaporization Source. U.S. Patent 10805847, 22 September 2005. [Google Scholar]
  26. Petersen, H.G. Accuracy and efficiency of the particle mesh Ewald method. J. Chem. Phys. 1995, 103, 3668–3679. [Google Scholar] [CrossRef]
  27. Chen, Z.L.; Xu, W.R.; Tang, L.D. Theory and Practice of Molecular Simulation, 1st ed.; Chemical Industry Press: Beijing, China, 2007; pp. 62–115. [Google Scholar]
  28. Chanda, J.; Bandyopadhyay, S. Molecular Dynamics Study of Surfactant Monolayers Adsorbed at the Oil/Water and Air/Water Interfaces. J. Phys. Chem. B. 2006, 110, 23482–23488. [Google Scholar] [CrossRef] [PubMed]
  29. Li, K.M.; Liu, Y.L.; Yan, H. Molecular dynamics simulation of self-assembly behavior at SDBS/BMAB oil-water interface. J. Liaocheng Univ. 2019, 32, 623–627. [Google Scholar]
  30. Liu, X.Z.; Yang, Z.P.; Hui, X.Z. Analysis of the force on the remaining oil in the small hole and improvement of the mathematical model. Daqing Pet. Geol. Dev. 2014, 33, 77–82. [Google Scholar]
Figure 1. Molecular configuration of oil droplet composition (grey—carbon, white—hydrogen): (a) oil phase box; (b) oil phase composition.
Energies 15 04443 g001
Figure 2. Azide chemical reaction process.
Energies 15 04443 g002
Figure 3. Modified graphene oxide conformation (gray—carbon atoms; red—oxygen atoms; white —hydrogen atoms; blue—nitrogen atoms): (a) Thin layer of carbon; (b) GO; (c) NGOs.
Energies 15 04443 g003
Figure 4. Schematic diagram of the initial model: (a) Model I (b) Model II.
Energies 15 04443 g004
Figure 5. Schematic diagram of the initial model: (a) Dispersed morphology, (b) NGO distribution.
Energies 15 04443 g005
Figure 6. Self-aggregation equilibrium configuration of the system: (a) Self-aggregation process, (b) self-assembled membrane configuration.
Energies 15 04443 g006
Figure 7. The density of the components in the oil–water and nanoparticle NGO systems.
Energies 15 04443 g007
Figure 8. MSD curves for NGOs at different temperatures.
Energies 15 04443 g008
Figure 9. (1) Change in interfacial tension without and (2) with the addition of NGOs.
Energies 15 04443 g009
Figure 10. Vector diagram of forces on oil droplets and oil film: (a) Force on oil droplets, (b) oil film stresses.
Energies 15 04443 g010
Table 1. The binding energy of different modifiers to graphene oxide.
MaterialAlkylamines and Graphene OxideSilane Coupling Agents and Graphene OxideHalothane and Graphene Oxide
Binding of energy/eV−1.96−1.680.47
Table 2. The binding energy of different graft chain lengths.
MaterialThirteen AlkylSixteen AlkylNineteen Alkyl
Binding energy/eV−1.46−1.68−2.52
Table 3. The adsorption energy of water molecules with modified graphene oxide.
MaterialThirteen AlkylSixteen AlkylNineteen Alkyl
Adsorption energy/eV−1.06−0.94−0.76
Table 4. Model II force field parameters.
Summation MethodCutoff DistanceLong-Range CorrectionBuffer Width
Atom-based12.5 ÅYES0.5 Å
Table 5. The interaction energy of nanoparticles with water per unit volume.
Temperature300 K330 K360 K
Free Energy
E T o t a l ( KJ × mol 1 × nm 3 )374.65312.84281.32
Table 6. Comparison of different surfactants for reducing interfacial tension (mN·m−1).
SurfactantDLSDMSSNGO
Time (Min)
20695449
40524236
60323230
Table 7. Variation of interfacial tension (mN·m−1) at different temperatures.
Temperature300 K330 K360 K
Free Energy
E T o t a l / ( KJ × mol 1 × nm 3 )374.65312.84281.32
Publisher’s Note: MDPI stays neutral with regard to jurisdictional claims in published maps and institutional affiliations.

