Abstract
The research presented in the article was aimed at verifying the effectiveness of environmental taxes in reducing the level of greenhouse gas emissions. For this purpose, data provided by Eurostat in the environmental taxes category were used. They were treated as explanatory variables. Data were entered into the ARMAX models built by the authors. The dependent variable was the emission of two greenhouse gases covered by the research, namely carbon dioxide and methane. The research was carried out in Poland, for which the results obtained for Sweden were used as the benchmark. The built models made it possible to verify the relationship between environmental taxes in the categories of energy, transport, pollution, resources, and the level of CO2 and CH4 emissions. The nature of the explanatory variable was also examined. Environmental taxes can fulfill a fiscal, incentive, and redistributive function. The conducted research shows that these taxes, in fact, fulfill mainly a fiscal function, while redistributive and incentive functions are insufficient. It was also observed that the direction and strength of the impact of taxes differ depending on the greenhouse gas.
1. Introduction
Sustainable development is one of the most important issues shaping the policy of the European Union. It influences economic growth while ensuring the well-being of citizens and caring for the natural environment. Sustainable development is to be achieved through the achievement of 17 goals, which were characterized in the document The 2030 Agenda for Sustainable Development [1]. One of the incentives to accelerate the achievement of the goals in the field of environmental protection are environmental taxes, the idea of which was initiated at the beginning of the 20th century [2,3,4]. The environmental tax is designed to motivate companies and citizens to seek solutions that limit the negative aspects of running a business. Environmental taxes or ecological taxes are defined in various ways. They can be defined as a non-returnable payment to the state that is levied on the object of taxation [5]. S. Ison, S. Peake, and S. Wall define them as taxes on environmentally harmful goods or services or on inputs used in the production of those goods or services [6]. EU countries carry out activities for the protection of the environment, including the use of tax tools, and Nordic countries were one of the first to apply environmental taxes [7,8,9,10]. The greatest challenge related to environmental taxes was to establish a methodology for their determination that would allow for the comparison of taxes paid in the individual Member States. This methodology was determined by Eurostat [11]. It defines which taxes can be classified as environmental categories and divides them into four basic categories: energy taxes, transport taxes, resources taxes, and pollution taxes. In order to be able to compare taxes between individual EU member states, a list of tax bases was created. Therefore, those of the taxes whose tax bases are listed below constitute environmental taxes:
- Energy
- ➢
- Energy products for transport purposes
- ▪
- Unleaded petrol
- ▪
- Leaded petrol
- ▪
- Diesel
- ▪
- Other energy products for transport purposes (e.g., LPG, natural gas, kerosene, or fuel oil)
- ➢
- Energy products for stationary purposes
- ▪
- Light fuel oil
- ▪
- Heavy fuel oil
- ▪
- Natural gas
- ▪
- Coal
- ▪
- Coke
- ▪
- Biofuels
- ▪
- Electricity consumption and production
- ▪
- District heat consumption and production
- ▪
- Other energy products for stationary use
- ➢
- Greenhouse gases
- ▪
- Carbon content of fuels
- ▪
- Emissions of greenhouse gases (including proceeds from emission permits recorded as taxes in the national accounts)
- ▪
- Motor vehicles import or sale (one-off taxes)
- ▪
- Registration or use of motor vehicles, recurrent (e.g., yearly taxes)
- Transport (excluding fuel for transport)
- ➢
- Congestion charges and city tolls (if taxes in national accounts)
- ➢
- Other means of transport (ships, airplanes, railways, etc.
- ➢
- Flights and flight ticket
- ➢
- Vehicle insurance (excludes general insurance taxes)
- Pollution
- ➢
- Measured or estimated emissions to air
- ▪
- Measured or estimated NOx emissions
- ▪
- Measured or estimated SOx emissions
- ▪
- Other measured or estimated emissions to air (excluding CO2)
- ➢
- Ozone-depleting substances (e.g., CFCs or halons)
- ➢
- Measured or estimated effluents to water
- ▪
- Measured or estimated effluents of oxydizable matter (BOD, COD)
- ▪
- Other measured or estimated effluents to water
- ▪
- Effluent collection and treatment, fixed annual taxes
- ➢
- Non-point sources of water pollution
- ▪
- Pesticides (based on, e.g., chemical content, price, or volume)
- ▪
- Manure
- ▪
- Artificial fertilizers (based on, e.g., phosphorus or nitrogen content or price)
- ➢
- Waste management
- ▪
- Collection, treatment, or disposal
- ▪
- Individual products (e.g., packaging, beverage containers, batteries, tires, lubricants)
- ▪
- Noise (e.g., aircraft take-off and landings)
- Resources
- ➢
- Water abstraction
- ➢
- Harvesting of biological resources (e.g., timber, hunted and fished species)
- ➢
- Extraction of raw materials (e.g., minerals, oil, and gas)
- ➢
- Landscape changes and cutting of trees [12].
2. Literature Review
Environmental taxes are fees for using the resources of the natural environment. Environmental taxes are those for which the tax base is a physical unit (or a substitute for a physical unit) of a good that has a proven, specific, negative impact on the environment [13]. They are an addition to the prices of products whose use has a negative impact on the environment. The fee in this form allows for a financial burden on products that are used on a large scale by citizens in a dispersed manner [14]. An example of an environmental tax is the carbon tax. It is applied to fuels in proportion to the greenhouse gas emissions produced by their combustion [15,16,17,18]. As a result, the end user is aware of paying fees for environmental pollution. The functions to be fulfilled by the environmental tax can be divided into three categories, i.e., redistributive, incentive, and fiscal. Redistribution consists of the division of the obtained funds and their allocation, for example, to environmental funds. The fiscal function allows the accumulation of funds for the state budget.
On the other hand, the stimulus function consists of motivating entities to the rational and economic management of resources. Taxes also make it possible to analyze resource consumption in a given country. In the present research, environmental taxes selected by Eurostat were taken into account. The analysis was carried out for available observations, that is, 2011–2019. The authors of the publication examined the relationship between environmental taxes and the level of greenhouse gas emissions. The data used to perform the presented analyzes are presented in Table 1.

Table 1.
Statistical data used during the analysis.
It was assumed that environmental taxes have a positive effect on the level of emissions. To verify the hypothesis, environmental taxes were introduced to the multiple regression model as explanatory variables. The dependent variable, on the other hand, was the amount of greenhouse gas emissions. The research was carried out for Poland and, for comparison, for Sweden (a representative of the Nordic countries, which has significantly reduced greenhouse gas emissions since 2000).
The group of taxes that bring the highest revenues to the state treasury, both in Poland and Sweden, are taxes placed in the energy category (Figure 1). For the energy category, due to the differences in the orders of magnitude, an auxiliary axis (in navy blue) was introduced. They constitute approximately 88% of all environmental taxes in Poland. However, in Sweden, it is about 75%. The amount of taxes in Poland grew, and in the analyzed period, it increased by 45%. In Sweden, on the other hand, it decreased by 8%. The second significant group are taxes from the transport category. In this case, no significant changes in the amount of taxes were observed in 2011–2019. In Poland, the share of taxes placed in the transport category is around 8% throughout the analyzed period, while in Sweden, it is twice as high (20%).
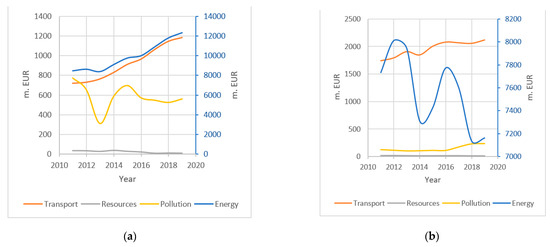
Figure 1.
Environmental taxes in Poland (a) and Sweden (b) in 2011–2019 (right axis for the energy category). Source: own elaboration.
Greenhouse Gas Emissions
Greenhouse gases are gaseous components of the atmosphere, both natural and anthropogenic, which absorb and re-emit infrared radiation [19]. Greenhouse gases include carbon dioxide (CO2), methane (CH4), nitrous oxide (N2O), fluorocarbons (HFCs), perfluorocarbon compounds (PFCs), and sulfur hexafluoride (SF6). Excessive greenhouse gas emissions lead to the greenhouse effect. The NASA Earth Observatory definition says that global warming is an unusually rapid increase in the average surface temperature of the Earth over the past century. The temperature rises as a result of the release of greenhouse gases during the combustion of fossil fuels. The mean global surface temperature increased by 0.6–0.9 °C between 1906 and 2005, and the rate of increase in temperature has almost doubled in the last 50 years [20]. Individual gases have a different degree of influence on the greenhouse effect. Therefore, the presented research focuses on carbon dioxide and methane. CO2 is the most abundant greenhouse gas. On the other hand, the negative impact of methane on the natural environment is much greater than that of other greenhouse gases.
In 2019, CO2 emissions accounted for approximately 80% of total emissions [11]. Carbon dioxide is produced during the combustion of fossil fuels, mainly in the transport, energy, construction, and oil industries [21,22]. Figure 2 presents a choropleth map of the CO2 emissions of the 27 EU member states in 2019. The map was created with the use of the Quantum GIS 3.16.13 spatial information system [23]. It should be noted that the highest level of emissions occurs in Germany, amounting to 567 million Mg CO2. Poland was classified as the second separated group in terms of the amount of CO2 emissions, while Sweden was placed in category 1 because the amount of emissions in Sweden is 7 times lower than in Poland and 15 times lower than in Germany. The lowest emission level among the EU-27 countries has been observed in Malta.
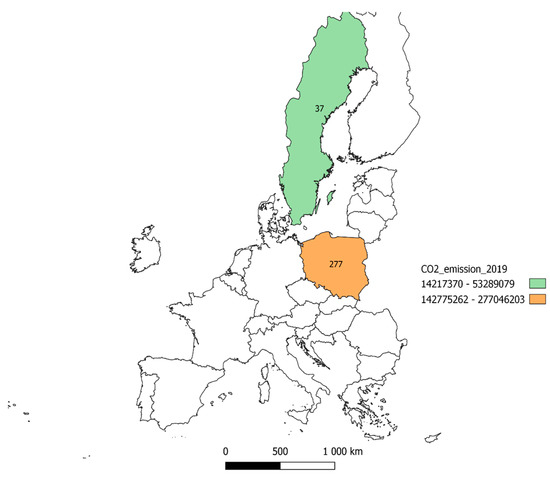
Figure 2.
The 2019 CO2 emissions in Poland and Sweden (m. Mg). Source: own elaboration.
As previously mentioned, carbon dioxide is widely recognized as the main cause of global warming. The reason for this is the share of CO2 in total greenhouse gas emissions. However, the gas that is many times more harmful is methane [24]. Despite the fact that methane disappears relatively quickly from the atmosphere after about 15 years (especially compared to CO2, which can remain in the atmosphere even for thousands of years), it is several dozen times more harmful [25,26,27]. Methane pollutes the air and destroys the ozone layer. CH4 is the basic component of natural gas, as well as biomethane. It is also released into the atmosphere during the exploitation of crude oil and coal. In Poland, the country that is the largest coal producer in Europe, methane emissions during fuel exploitation accounted for 40% of the total CH4 emissions in 2019. Methane is also produced in landfills. However, it is produced most of all in agriculture, where the average share of the EU-27 is 56% of agriculture in total CH4 emissions. The highest share of agriculture in CH4 emissions occurs in Ireland, where it was 94% in 2019.
In the case of emissions generated in the mining industry or waste management, there are methods that allow for their reduction [28,29]. However, in agriculture, it is extremely difficult. Methane is produced by farm animals, and the only effective preventive measure, in this case, would be to eliminate meat consumption. This, in turn, is impossible due to the composition of the human diet, in which meat is a very important component.
The highest level of CH4 emissions occurs again in Germany, and it amounts to 14 million Mg. Malta has the lowest CH4 emissions. In Poland, CH4 emissions in 2019 amounted to 1.6 million Mg, which is almost 10 times higher than in Sweden (Figure 3).
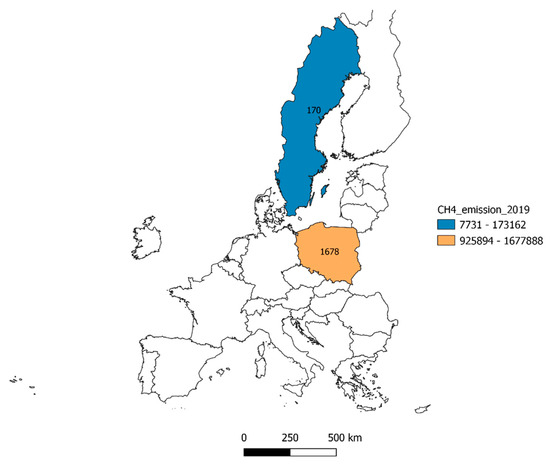
Figure 3.
Methane emissions in Poland and Sweden, 2019 (1000 Mg). Source: own elaboration.
However, it should be noted that the level of greenhouse gas emissions is strongly related to the number of given country inhabitants. Taking this factor into account, an analysis of CO2 and CH4 emissions per capita was performed. In this case, CO2 emission is still one of the lowest in Sweden (about 4 Mg per capita), while the highest occurs in Luxembourg and amounts to about 12 Mg per capita. In Poland, it is about 7 Mg per capita. In turn, CH4 is emitted in the highest amounts in Ireland (0.11 Mg per capita) and the lowest in Bulgaria and Sweden (0.02 Mg per capita). In Poland, it is 0.05 Mg/capita (Figure 4).
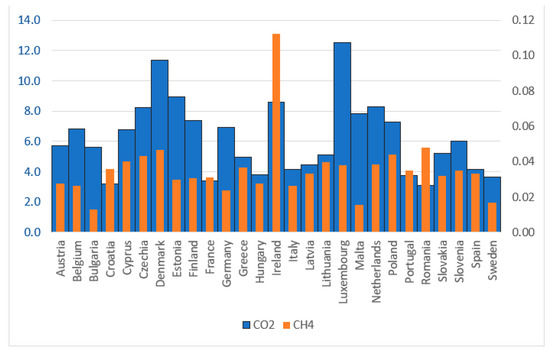
Figure 4.
The volume of CO2 and CH4 emissions in Mg per capita in 2019. Source: own elaboration.
CH4 and CO2 emissions in Sweden are lower than in Poland, also taking into account the population in both countries. Sweden is one of the leaders among countries that effectively reduce greenhouse gas emissions and apply environmental taxes. Therefore, it was this country that was chosen as the benchmark for the results observed in Poland.
The main goal of the research was to verify the relationship between greenhouse gas emissions and environmental taxes. The research was conducted with particular emphasis on Poland. Most publications on this subject are limited to the analysis of greenhouse gas emissions in total and, above all, CO2 [30,31,32,33]. However, the role of environmental taxes is still ambiguous and requires a more in-depth examination [34]. The authors aimed to show that the direction and strength of the impact of taxes differ depending on the greenhouse gas. Therefore, in addition to CO2, the analysis also includes CH4, which has a much more harmful impact on the natural environment. The authors, in addition to determining whether there is a relationship between the dependent variable and the explanatory variables, indicated the nature of this relationship. The method used by the authors also allowed for the analysis of time-delayed correlations between the variables.
In summary, the authors of the article conducted the presented research in order to obtain answers to the following questions:
- Is there a link between emissions and environmental taxes?
- Do environmental taxes, apart from their fiscal function, also fulfill an incentive and redistributive role?
- How do taxes affect greenhouse gas emissions?
- Do environmental taxes affect all greenhouse gas emissions in the same way?
3. Materials and Methods
During the conducted research, the ARMAX Autoregressive Moving Average with Exogenous Input model [35] was used. The ARMAX model consists of a moving average and an autoregressive component. ARMAX is a discrete input/output model for stochastic processes. It is a generalization of the ARMA model that includes an external input variable (X). It is used in stationary or reducible to stationary time series. The stationarity of the time series can be achieved through its differentiation. It enables the verification of the relationship between the dependent variable and a series of explanatory variables. It also made it possible to determine the influence of the explanatory variable on the dependent variable [36,37,38]. The ARMAX model is defined by the following formula:
where
—prediction coefficients;
u(t)—input signal sequence;
n—order of predictor;
e(t)—white noise;
y(t)—output signal sequence.
The structure of the ARMAX model (p,q,b) is defined by the parameters p—autoregressive conditions, q—moving average terms, and b—exogenous input. The ARMAX model allows for the analysis of time-delayed correlations between variables [39,40]. Lag analysis is a specialized technique for studying the relationship between variables. AR is a model in which each value is a linear combination of previous values (lagged). It uses the memory of the process. MA, on the other hand, represents a component in which the current value is a linear combination of the previous values and the deviations of these values. P and q are parameters of model order (delay). They define how many previous observations contribute to the current value of AR (p), MA (q).
To build a plausible model, all potential models were created. The credibility of the model was confirmed and verified by the information criteria of Akaike, Bayesian Schwarz, and Hannan Qiunn. Additionally, the mean absolute percentage error (MAPE) was used to compare the quality of potential models [41,42]. The model with the best parameters was selected: the lowest value of the information criterion and the MAPE error. The nature of the explanatory variable was also determined. The variable may be a stimulant, a destimulant, or a nominant. The growth of the stimulant variable has a positive effect on the dependent variable; in the case of the destimulant, it is negative [36]. The influence of the nominant depends on the nominal value.
4. Results
The conducted research was aimed at verifying whether there is a relationship between environmental taxes and the amount of emissions of selected greenhouse gases: carbon dioxide and methane. Due to this, it was possible to determine whether environmental taxes fulfill an incentive and redistributive function. To perform the relevant analysis, the ARMAX model was used. All four time series were brought to a stationary form through single differentiation. As independent variables, taxes from the energy, transport, pollution, and resources categories were introduced to the model.
Finally, four models were selected:
ARMAX model (1,1,0), where the dependent variable is CO2 emission in Poland, 219 models were created and assessed.
ARMAX model (0,1,2), where the dependent variable is CH4 emission in Poland, 134 models were created and evaluated.
ARMAX model (1,1,1), where the dependent variable is CO2 emission in Sweden, 243 models were created and evaluated.
ARMAX model (0,1,1), where the dependent variable is CH4 emission in Sweden, 128 models were created and assessed.
The models performed were assessed in terms of the level of information criterion and MAPE error. The results of the models’ reliability assessment are presented in Table 2. The MAPE error reports the average value of the forecast errors expressed as a percentage of the actual value of the forecast variable. MAPE values allow to compare the accuracy of forecasts obtained with different models. The adopted models can be considered highly reliable because the average absolute percentage error is in the range of 0.14–0.85%, so it does not exceed 1%. The information criterion is one of the model verification indicators. The Akaike Information Criterion (AIC) is a mathematical method of assessing how well a model fits the data from which it was generated. In statistics, AIC is used to compare various possible models and determine which one will be the most accurate. The models with the lowest value of the information criterion were selected.
Table 2.
Indicators used to verify selected models’ reliability.
The created models made it possible to verify which of the independent variables can be considered statistically significant. Statistical significance indicates that the explanatory variable influences and shapes the dependent variable. The significance was confirmed by analysis of the Student’s t-statistic value and the p (probability) level. A null hypothesis was formulated: the independent variables are statistically irrelevant. Explanatory variables that turned out to be statistically significant were marked with an asterisk (*) in Table 3. Additionally, the nature of the variable is specified in the table. A plus sign means a stimulant, while a minus sign means a destimulant. In the case of carbon dioxide, all explanatory variables were considered statistically significant. Therefore, it can be concluded that all environmental taxes have an impact on the level of CO2 emissions. Taxes in the energy category are destimulants; the rest of the tax groups are stimulants.
Table 3.
Explanatory variables statistically significant for the CO2 model.
The amount of CO2 emissions in the years 2012–2023 was determined, which is presented in Figure 5 and Figure 6, along with empirical emission data for 2011–2019. The analysis of the CO2 time series in Poland shows that after large drops in emissions in the nineties and after 2000 in 2014, CO2 emissions in Poland began to increase. The observed emission reduction was caused at the end of the 20th century mainly by the transformation of the Polish economy and the liquidation of many industrial plants. The increase in emissions after 2014 was due to economic growth. After 2018, the emission stabilized at the level of approximately 300 million Mg. The ARMAX model also allowed for the forecast of the emission level. The forecast was built until 2023. The values obtained indicate that CO2 emissions should be expected to remain at the 300 million Mg level in the near future.
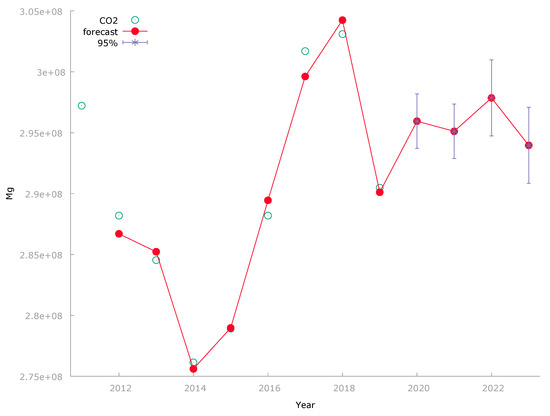
Figure 5.
CO2 emissions in Poland in 2011–2019 with a forecast until 2023. Source: own elaboration.
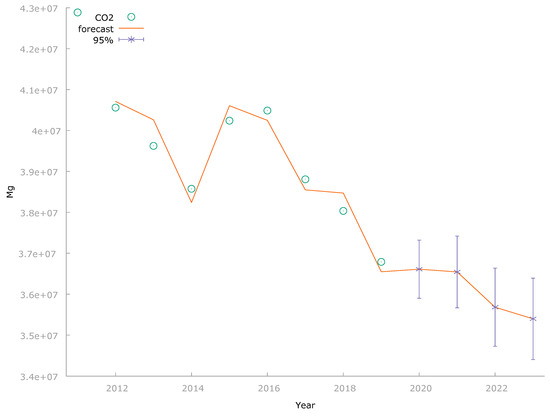
Figure 6.
CO2 emissions in Sweden in 2011–2019 with a forecast until 2023. Source: own elaboration.
Figure 6 shows the model of CO2 emissions in Sweden. In this case, the time series is characterized by a downward trend. In the period analyzed, emissions in Sweden decreased by about 15% and, according to the forecast, by 2023, they will decrease by another 4%. The nature of the explanatory variables is identical in Poland.
Then the ARMAX model of the methane emission time series was created in Poland and Sweden (Figure 7 and Figure 8).
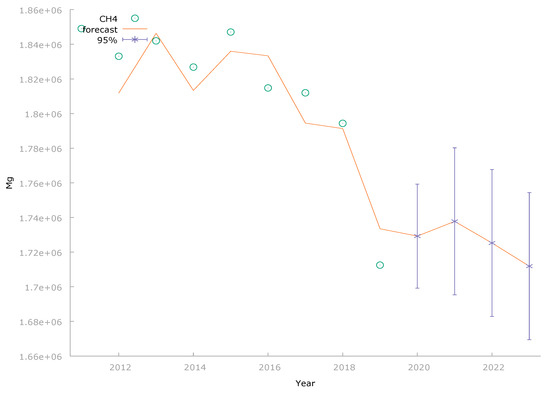
Figure 7.
CH4 emission in Poland in 2011–2019 with a forecast until 2023. Source: own elaboration.
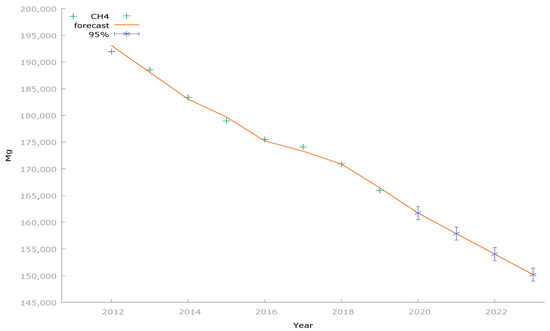
Figure 8.
CH4 emission in Sweden in 2011–2019 with a forecast until 2023. Source: own elaboration.
The model shows that taxes in the energy and transport categories have an impact on the level of emissions in Poland. Additionally, in this case, the energy category is a destimulant, although the emissions decrease. This is caused by a decline in the extraction of fossil fuels in Poland, but also proper waste management, as well as a decline in electricity, gas, steam, and air conditioning supply emissions [11,43]. In Poland, CH4 emissions decreased by 8% in 2011–2019. The created model shows that if the time series of CH4 emissions continues to be influenced by the same factors, by 2023, the emission will decrease by another 2% (Figure 7).
In Sweden, on the other hand, taxes related to the pollution category (Table 4) influence methane emissions.
Table 4.
CH4 Explanatory variables statistically significant for the CH4 model.
In Sweden, methane emissions decreased by 17% in 2011–2019 (Figure 8). According to the created forecast, by 2023, they will decrease by another 10% compared to 2019. In this case, taxes from the pollution category have a positive impact on the reduction of CH4 emissions, which stimulates the reduction of emissions. In the period analyzed, this tax almost doubled. Most of the CH4 emissions in Sweden come from agriculture (77% in 2019).
5. Discussion
The conducted analysis and research results are mostly consistent with the results that can be found in the literature [44]. This is confirmed by the results for both Poland and Sweden [45,46]. However, the model used by the authors has not been used in similar analyzes so far. Apart from indicating whether there is a relationship between the analyzed features, ARMAX also made it possible to determine the nature of this relationship. In the research conducted, it was assumed that if environmental taxes fulfill an incentive and redistributive role in the tested time series, the statistical significance of the explanatory variables of the ARMAX model would be detected. In addition, the correct use of funds obtained through taxes should cause the explanatory variable to take the form of a stimulant. The main function of taxation, i.e., the fiscal function, is obvious; the funds obtained through taxes contribute to the budgets of the EU member states. The ARMAX model made it possible to introduce several explanatory variables into the model. Thanks to this, it allowed to assess the relationship between the amount of carbon dioxide and methane emissions and each of the tax categories separately. The ARMAX model also allowed for the analysis of time-delayed correlations between the variables. Due to this, it is possible to observe the relationship between the amount of greenhouse gas emissions and environmental taxes over time. Therefore, it made it possible to extend the waiting time for the appearance of the tax effects. As the time series was relatively short (due to the adopted time unit), the number of degrees of freedom and the statistical significance of the model parameters made it possible to take into account the annual delays for three models and the two-year delay for the CH4 model in Poland. Furthermore, Poland was compared with Sweden, which was one of the first countries to introduce environmental taxes. As stated, the ARMAX model of CO2 emissions indicates that in the near future, the emissions will stabilize at the level of 300 million Mg per year. To restore the downward trend in CO2 emissions in Poland, additional incentives should be applied. As established, all explanatory variables have an influence on the formation of CO2 time series. Transport, pollution, and resources are the so-called stimulants, which means that their growth has a positive impact on the level of CO2 emissions. However, taxes in the energy category are a destimulant, which means that their increase does not have a positive impact on the level of carbon dioxide emissions, despite a systematic increase in the level of taxes. Due to the fact that taxes in the energy category constitute about 80% of all environmental taxes, CO2 emissions do not decrease as dynamically as expected. Additionally, in the case of Sweden, taxes in the energy category are a destimulant, but CO2 emissions are systematically decreasing. Unlike Poland, energy taxes in Sweden fell by 11% in 2011–2019. This means that the consumption of fossil fuels has decreased. In their place, energy from renewable sources was introduced, which resulted in a decrease in CO2 emissions.
In the case of methane time series, both in Poland and Sweden, a downward trend in the level of emissions is observed. However, in the case of Sweden, these declines are much more dynamic. In Sweden, emissions are mainly related to agriculture. The model indicated that the category of pollution taxes has a positive effect on the volume of CH4 emissions in Sweden. It is related to the reduction of agricultural emissions. The renewable energy sources widely used in Sweden are also significantly contributing to the reduction of methane emissions. In the electricity, gas, steam, and air conditioning supply category, emissions in 2011–2019 decreased by 16%. On the other hand, in Poland, an impact on the time series of taxes in the resource category (extraction of raw materials) category could be expected. However, these taxes are so negligible (0.1% in 2019) that the explanatory variable was considered statistically insignificant.
Known and used techniques for methane drainage in coal seams allow capture of gas accumulated in the seam and released during coal mining. The gas obtained in this way should constitute a valuable source of energy that can be used instead of imported natural gas. Currently, it is often released into the atmosphere or burned. The exploitation of coal deposits can also be divided into two stages. In the first stage, the deposits can be treated as gas bearing, and in the second stage, after the exploitation of methane, coal can be exploited. Such an approach would be positive in many respects. First of all, gas fuel in Poland is obtained in about 70% by import. Therefore, methane could complement Poland’s energy mix and provide the country with a higher level of energy security. Second, removing the gas from the deposit would increase the safety of the miner’s work and reduce the costs of the exploitation itself. Finally, thirdly, the CH4 emission in Poland would be significantly reduced.
6. Conclusions
The presented research made it possible to verify the hypothesis about the existence of an incentive, fiscal, and redistributive function of environmental taxes in the European Union. The ARMAX model was used to confirm this hypothesis. First, it allowed for the revision of the impact of environmental taxes on the level of greenhouse gas emissions. The analysis was carried out for two gases of the greatest importance, i.e., carbon dioxide and methane. Poland was compared with Sweden because it is one of the first countries to implement environmental taxes.
It should be stated that the incentive and redistributive function of environmental taxes is limited. The direction and strength of the impact of taxes vary depending on the greenhouse gas. There are also differences in the effectiveness of individual taxes. In the case of CO2, all tax categories are statistically significant. The most important tax group in terms of financial contribution, energy has no incentive or redistributive function. The increase in the level of taxes in this category does not reduce greenhouse gas emissions. Environmental taxes are rising, but this does not translate into a decrease in emissions. The result was counterproductive. An increase in taxes can only confirm the greater consumption of products on which it was imposed.
The reason is that environmental taxes can be used to reduce greenhouse gas emissions, but it is not a necessary condition. They are often spent reducing the budget deficit or paying off debts. Therefore, environmental taxes primarily play a fiscal role. There was also no possibility of a time delay in obtaining a positive impact of environmental taxes on the level of greenhouse gas emissions which was confirmed by the ARMAX model and research conducted for Sweden. Sweden, which has been at the forefront of environmental taxation countries in Europe, also recorded similar results. The forecasts also support this conclusion. It would therefore be necessary to impose the use of funds obtained through the environmental tax for purposes directly related to the reduction of damage caused by the use of a taxed product, such as fossil fuels. These funds should be used for the research and development of technologies that enable the reduction of harmful substances emissions, as well as for the financing of scientific research in this field and the modernization of existing installations. It also seems necessary for Eurostat to introduce additional statistics that would enable the tracking of the budget categories to which the funds obtained through the environmental tax are sent. As demonstrated by the use of the ARMAX model, environmental taxes not closely related to environmental activities will not bring the intended effect. A redistribution of funds is essential. It will ensure the proper use of environmental taxes, which at the moment may even serve initiatives and investments having a negative impact on the natural environment.
A serious limitation for conducted research is the inability to verify the allocation of funds obtained through taxes. The possibility of introducing this type of data into the model would be highly desirable. Additionally, the authors noticed that the research conducted should be extended with explanatory variables such as, for example, primary energy consumption by product, electricity consumption, the share of renewable energy sources, energy efficiency, or gross domestic product.
In conclusion, it should be stated that the conducted research on the relationship between greenhouse gas emissions and environmental taxes shows that this relationship is insufficient. This is important information that must be used in the process of shaping environmental policy by the European Union and individual member states.
Author Contributions
Conceptualization, A.R.; Formal analysis, A.R.; Funding acquisition, A.M. and J.P.; Investigation, A.R.; Methodology, A.R. and J.P.; Resources, A.R. and J.J.; Software, A.R. and J.J.; Validation, A.M.; Visualization, A.M.; Writing—original draft, A.R., J.J., A.M. and J.P. All authors have read and agreed to the published version of the manuscript.
Funding
The work was elaborated in the frames of the statutory research BK 06/010/BK_22/0054.
Institutional Review Board Statement
Not applicable.
Informed Consent Statement
Not applicable.
Data Availability Statement
Not applicable.
Acknowledgments
This work was supported by the Faculty of Mining, Safety Engineering, and Industrial Automation of the Silesian University of Technology, Gliwice, Poland.
Conflicts of Interest
The authors declare no conflict of interest. The funder had no role in the design of the study; in the collection, analyses, or interpretation of data; in the writing of the manuscript, or in the decision to publish the results.
References
- UN Sustainable Development. Available online: https://sdgs.un.org/goals (accessed on 20 May 2022).
- Oates, W.E. Green Taxes: Can We Protect the Environment and Improve the Tax System at the Same Time? South. Econ. J. 1995, 61, 915. [Google Scholar] [CrossRef]
- Pigou, A.C. The Economics of Welfare 1938, 4th ed.; Weidenfeld and Nicolson: London, UK, 1920. [Google Scholar]
- Ward, H.; Cao, X. Domestic and International Influences on Green Taxation. Comp. Political Stud. 2012, 45, 1075–1103. [Google Scholar]
- Małecki, P. System Opłat i Podatków Ekologicznych w Polsce na tle Rozwiązań w Krajach OECD; Wydawnictwo Uniwersytetu Ekonomicznego: Kraków, Poland, 2012. [Google Scholar]
- Ison, S.; Peake, S.; Wall, S. Environmental Issues and Policies; Pearson Education: London, UK, 2002. [Google Scholar]
- Boqiang, L.; Xuehui, L. The effect of carbon tax on per capita CO2 emissions. Energy Policy 2011, 39, 5137–5146. [Google Scholar]
- Sverker, C.J.; Hammar, H. Environmental taxation for good and for bad: The efficiency and legitimacy of Sweden’s carbon tax. Environ. Politics 2009, 18, 218–237. [Google Scholar]
- Christiansen, A.C. Climate policy and dynamic efficiency gains A case study on Norwegian CO2-taxes and technological innovation in the petroleum sector. Clim. Policy 2001, 1, 499–515. [Google Scholar] [CrossRef]
- Bruvoll, A.; Larsen, B.M. Greenhouse gas emissions in Norway: Do carbon taxes work? Energy Policy 2004, 32, 493–505. [Google Scholar] [CrossRef]
- Eurostat. Available online: https://ec.europa.eu/eurostat/web/main/data/database (accessed on 5 May 2022).
- Eurostat. Available online: Ec.europa.eu/eurostat/cache/metadata/en/env_ac_taxind2_esms.htm (accessed on 5 May 2022).
- Available online: Repozytorium.ka.edu.pl/bitstream/handle/11315/24644/TOMALA_Opodatkowanie_ekologiczne_narzedziem_ochrony_srodowiska_2018.pdf?sequence=1&isAllowed=y (accessed on 10 May 2022).
- Kryk, B.; Kłos, L.; Łucka, I.A. Opłaty i Podatki Ekologiczne po Polsku; Wydawnictwa Fachowe CeDeWu: Warszawa, Poland, 2001. [Google Scholar]
- Metcalf, G.E. Designing a carbon tax to reduce US greenhouse gas emissions. Rev. Environ. Econ. Policy 2020, 3, 63–83. [Google Scholar] [CrossRef]
- Ding, J.; Chen, W.; Wang, W. Production and carbon emission reduction decisions for remanufacturing firms under carbon tax and take-back legislation. Comput. Ind. Eng. 2020, 143, 106419. [Google Scholar] [CrossRef]
- Zhijie, J.; Boqiang, L. Rethinking the choice of carbon tax and carbon trading in China. Technol. Forecast. Soc. Change 2020, 159, 120187. [Google Scholar]
- Lu, C.; Tong, Q.; Liu, X. The impacts of carbon tax and complementary policies on Chinese economy. Energy Policy 2010, 38, 7278–7285. [Google Scholar] [CrossRef]
- United Nations Framework Convention on Climate Change; Dz. U. z 1996 r. poz. 238; United Nations: New York, NY, USA, 1992.
- Available online: https://earthobservatory.nasa.gov/features/GlobalWarming/page2.php (accessed on 6 May 2022).
- Kelvin, O.Y.; Michael, O.D. Chapter 1-CO2 Emission Sources, Greenhouse Gases, and the Global Warming Effect, Advances in Carbon Capture; Woodhead Publishing: Sawston, UK, 2020; pp. 3–28. [Google Scholar]
- Archer, D.; Brovkin, V. The millennial atmospheric lifetime of anthropogenic CO2. Clim. Change 2008, 90, 283–297. [Google Scholar] [CrossRef]
- QGIS. Available online: https://qgis.org/pl/site/forusers/download.html (accessed on 1 May 2022).
- Lynch, J.; Cain, M.; Frame, D.; Pierrehumbert, R. Agriculture’s Contribution to Climate Change and Role in Mitigation Is Distinct From Predominantly Fossil CO2-Emitting Sectors. Front. Sustain. Food Syst. 2020, 4, 518039. [Google Scholar] [CrossRef] [PubMed]
- Saunois, M.; Stavert, A.; Poulter, B.; Bousquet, P.; Canadell, J.; Jackson, R.; Raymond, P.; Dlugokencky, E.; Houweling, S.; Patra, P.; et al. The Global Methane Budget 2000–2017. Earth Syst. Sci. Data 2020, 12, 1561–1623. [Google Scholar] [CrossRef]
- Cain, M.; Lynch, J.; Allen, M.R.; Fuglestvedt, J.S.; Frame, D.J.; Macey, A.H. Improved calculation of warming-equivalent emissions for short-lived climate pollutants. NPJ Clim. Atmos. Sci. 2019, 2, 29. [Google Scholar] [CrossRef]
- Etminan, M.; Myhre, G.; Highwood, E.J.; Shine, K.P. Radiative forcing of carbon dioxide, methane, and nitrous oxide: A significant revision of the methane radiative forcing. Geophys. Res. Lett. 2016, 43, 12614–12623. [Google Scholar] [CrossRef]
- Dreger, M.; Kędzior, S. Methane emissions and demethanation of coal mines in the Upper Silesian Coal Basin between 1997 and 2016. Environ. Socio-Econ. Stud. 2019, 7, 12–23. [Google Scholar] [CrossRef]
- Sechman, H.; Kotarba, M.J.; Kędzior, S.; Kochman, A.; Twaróg, A. Fluctuations in methane and carbon dioxide concentrations in the near-surface zone and their genetic characterization in abandoned and active coal mines in the SW part of the Upper Silesian Coal Basin, Poland. Int. J. Coal Geol. 2020, 227, 103529. [Google Scholar] [CrossRef]
- González-Sánchez, M.; Martín-Ortega, J.L. Greenhouse Gas Emissions Growth in Europe: A Comparative Analysis of Determinants. Sustainability 2020, 12, 1012. [Google Scholar] [CrossRef]
- Hao, L.N.; Umar, M.; Khan, Z.; Ali, W. Green growth and low carbon emission in G7 countries: How critical the network of environmental taxes, renewable energy and human capital is? Sci. Total Environ. 2021, 15, 141853. [Google Scholar] [CrossRef]
- Hájek, M.; Zimmermannová, J.; Helman, K.; Rozenský, L. Analysis of carbon tax efficiency in energy industries of selected EU countries. Energy Policy 2019, 134, 1–11. [Google Scholar] [CrossRef]
- Armeanu, D.; Vintilă, G.; Andrei, J.V.; Gherghina, Ş.C.; Drăgoi, M.C.; Teodor, C. Exploring the link between environmental pollution and economic growth in EU-28 countries: Is there an environmental Kuznets curve? PLoS ONE 2018, 13, e0195708. [Google Scholar] [CrossRef] [PubMed]
- Shahzad, U. Environmental taxes, energy consumption, and environmental quality: Theoretical survey with policy implications. Environ. Sci. Pollut. Res. Int. 2020, 27, 24848–24862. [Google Scholar] [CrossRef] [PubMed]
- Uddin, F.; Dendena Tufa, L.; Yousif, S.M.T.; Maulud, A. Comparison of ARX and ARMAX Decorrelation Models for Detecting Model-Plant Mismatch. Procedia Eng. 2016, 148, 985–991. [Google Scholar] [CrossRef][Green Version]
- Schader, M.; Gaul, W.A.; Vichi, M. Between Data Science and Applied Data Analysis. In Proceedings of the 26th Annual Conference of the Gesellschaft für Klassifikation, Mannheim, Germany, 22–24 July 2002; Springer: Berlin, Germany, 2003. [Google Scholar]
- Hickey, E.; Loomis, D.G.; Mohammadi, H. Forecasting hourly electricity prices using ARMAX–GARCH models: An application to MISO hubs. Energy Econ. 2012, 34, 307–315. [Google Scholar] [CrossRef]
- Ekhosuehi, V.U.; Omoregie, D.E. Inspecting debt servicing mechanism in Nigeria using ARMAX model of the Koyck-kind. Oper. Res. Decis. 2021, 1, 5–20. [Google Scholar]
- Rachad, S.; Nsiri, B.; Bensassi, B. System identification of inventory system using ARX and ARMAX models. Int. J. Control. Autom. 2015, 8, 283–294. [Google Scholar] [CrossRef]
- Simms, L.E.; Engebretson, M.J.; Rodger, C.J.; Gjerloev, J.W.; Reeves, G.D. Predicting lower band chorus with autoregressive-moving average transfer function (ARMAX) models. J. Geophys. Res. Space Phys. 2019, 124, 5692–5708. [Google Scholar] [CrossRef]
- Piłatowska, M. Kryteria informacyjne w wyborze modelu ekonometrycznego. Studia I Pr. Ekon. W Krakowie 2010, 210, 25–37. [Google Scholar]
- Myttenaere, A.; Golden, B.; Grand, B.; Rossi, F. Mean Absolute Percentage Error for regression models. Neurocomputing 2016, 192, 38–48. [Google Scholar] [CrossRef]
- Rybak, A. Rola i Przyszłość Węgla w Zapewnieniu Bezpieczeństwa Energetycznego Polski; Monografia 865; Wydawnictwo Politechniki Śląskiej: Gliwice, Poland, 2020. [Google Scholar]
- Aydin, C.; Esen, Ö. Reducing CO2 emissions in the EU member states: Do environmental taxes work? J. Environ. Plan. Manag. 2018, 61, 2396–2420. [Google Scholar] [CrossRef]
- Jóźwik, B.; Gavryshkiv, A. The Impact of Environmental Tax on Greenhouse Gas Emissions in Visegrad Group Countries. Gospodarka Narodowa. Pol. J. Econ. 2022, 309, 66–78. [Google Scholar] [CrossRef]
- Tomala, M. Opodatkowanie ekologiczne narzędziem ochrony środowiska państw nordyckich, Bezpieczeństwo. Teoria Praktyka 2018, 1, 103–115. [Google Scholar]


Publisher’s Note: MDPI stays neutral with regard to jurisdictional claims in published maps and institutional affiliations. |
© 2022 by the authors. Licensee MDPI, Basel, Switzerland. This article is an open access article distributed under the terms and conditions of the Creative Commons Attribution (CC BY) license (https://creativecommons.org/licenses/by/4.0/).