Article

Logistics and Costs of Agricultural Residues for Cellulosic Ethanol Production

by
Luis Armando Becerra-Pérez
1,2,*,
Luis Rincón
3 and
John A. Posada-Duque
4,*
1
Faculty of Economics and Social Sciences, Autonomous University of Sinaloa, Culiacan 80010, Mexico
2
Biotechnology and Society Research Group, Department of Biotechnology, Faculty of Applied Sciences, Delft University of Technology, 2629 HZ Delft, The Netherlands
3
Centro Internacional de Investigación y Desarrollo—CIID, Montería 230001, Colombia
4
Department of Biotechnology, Delft University of Technology, 2629 HZ Delft, The Netherlands
*
Authors to whom correspondence should be addressed.
Energies 2022, 15(12), 4480; https://doi.org/10.3390/en15124480
Submission received: 20 May 2022 / Revised: 10 June 2022 / Accepted: 14 June 2022 / Published: 20 June 2022
(This article belongs to the Special Issue Biomass Energy for Environmental Sustainability)

Abstract

:
There is global pressure to make advanced biofuels profitable. For cellulosic ethanol, three aspects remain as bottlenecks: collection of feedstocks, pretreatment methods, and enzyme production. In this paper, the first aspect is investigated, by addressing the main challenges for the logistics of agricultural residues. A logistic supply chain of corn stover collection and utilization for cellulosic ethanol production in Mexico is proposed, and a cost structure is designed for its estimation. By applying a value chain methodology, seven links and a set of three minimum selling prices (MSPs) of agricultural residues were determined. Furthermore, the harvest index (HI), crop residue index (CRI), nutrient substitution by extraction of agricultural residues, and harvest costs of corn stover were also calculated for a case study. The main results were a HI of 0.45, a CRI of 1.21, and nutrient substitution potential of 7 kg N, 2.2 kg P2O5, and 12.2 kg K2O per ton of corn stover. The set of the three estimated MSPs for corn stover was: $28.49 USD/ton (for delivery to the biorefinery’s gate), $31.15 USD/ton (for delivery and storage), and $48.14 USD/ton (for delivery, storage, and nutrient replenishment). Given the impact of the feedstock cost on the profitability of cellulosic ethanol, knowing details of the logistical information and its costs is critical to advancing the field of biofuels in Mexico. We also found that only 20% of farmers currently sell their residues; however, 65% of farmers would be willing to do so, a significant percentage for cellulosic ethanol production.

1. Introduction

Biomass is the most abundant renewable resource on earth and has been used as an energy source since ancient times. Although used since the beginning of civilization, fire only caused a real revolution until man was able to transform the chemical energy contained in biomass into heat and light [1]. The history of humanity is linked to power. As society required more outstanding production of goods and services, new energy sources were used, sometimes for efficiency [2] and other times because of the availability of the resources. Thus, from primary energy stored in biomass, we moved on to hydropower then to coal (19th century), oil, and natural gas (20th century); and finally, to nuclear energy in the 1950s [3].
The next great energy transition (21st century) has to do with renewable energies for two fundamental reasons: the foreseeable depletion of oil reserves and global climate change. There is sufficient empirical evidence of the link between these two subjects [4,5,6,7] that nations are obliged to move towards more sustainable energy models. In this context, renewable energies in general, and biomass energy in particular, have returned to center stage, but this time in a very different technological and economic development situation.
Traditionally, humanity has directly burned all types of biomass—cutting down forests and using any kind of waste (plant and animal) capable of generating heat, lighting, and energy. The excessive use of this type of biofuel, called primary [8], has brought severe environmental and social consequences, and it is inefficient. Therefore, its use is increasingly compromised, and in the regions where it is still used, more efficient and sustainable technologies are being promoted.
There are other types of biofuel which can be classified into four categories according to the type of biomass used and its transformation technology: (a) First generation (1G), which are biofuels that use starch, sugar, or vegetable oil as a source and are produced by fermentation, distillation, and transesterification. (b) Second generation (2G), which are biofuels that use lignocellulosic biomass, and they are produced by biochemical or thermochemical means. They could also be produced by gasification or enzymatic hydrolysis and fermentation. (c) Third generation (3G), which are biofuels that can be made from oil extracted from algae and seaweed. (d) Fourth generation (4G), which are biofuels that can be produced from microalgae and cyanobacteria obtained through bioengineering and using carbon capture and storage technology (CCS) [8].
This article analyzes the feedstock use to produce cellulosic ethanol, classified as a 2G biofuel. There are different types of lignocellulosic biomass that are suitable for producing ethanol and other 2G biofuels, such as forest residues; agricultural, agro-industrial, and urban (organic part) wastes; paper waste; sewage plant sludge; and energy crops planted specifically for this purpose. For this paper, we only consider agricultural residues, specifically corn stover (Zea mays), since this is the crop that generates the largest volume of lignocellulosic biomass residues in Mexico [9,10].
The agricultural residues used to produce cellulosic ethanol, and which are usually associated with non-food residues, include corn stover, sorghum straw, sugarcane straw (tops and leaves), sugarcane bagasse, rice straw, wheat straw, barley straw, oat straw, rye residues, and dedicated bioenergy crops such as switchgrass, miscanthus, willow, eucalyptus, poplar, and pine, among others [9]. The specific classification for the biomass is that it comes from agricultural residues and energy crops called lignocellulosic biomass from agricultural land [10]. Figure 1 shows an adaptation of this classification.
Considering only agricultural residues, empirical studies have been conducted to estimate their quantity at a global level. Crop yield, harvest logistics, harvesting technology, primary producer culture, and farmers’ willingness to sell are critical factors determining the net amount of agricultural residue available. Nevertheless, some calculations give an accurate idea of the amount of agricultural residue. Bentsen et al. [12] estimated the global total of agricultural residues as 3.7 billion tons/year, of which approximately 2.8 billion tons/year are corn, rice, and wheat residues. According to Cherubin et al. [13], five billion tons of total agricultural residues in the world are produced. Asia is the largest producer, with 47% of the total, followed by America (29%), Europe (16%), Africa (6%), and finally Oceania (only 2%). In the case of the United States of America (US), at least 1 billion tons of biomass from agricultural residues (main corn stover) and other wood wastes could be sustainably collected each year. That would produce 67 billion gallons of ethanol annually, replacing 30% of gasoline consumption in the US [9]. There are many other cases of European Union and Asian countries where straw as a bioenergy feedstock and the questions of environmental sustainability and economic viability have been studied (Germany [14,15]; Poland [16]; Sweden [17,18]; China [19]). For example, Gradziuk et al. [16] evaluated straw for bioenergy use with data from 16 voivodships (Poland provinces) between 1999 and 2019, and forecasted the amount available up to 2030. To do this, the authors used a methodology that subtracts from the total production of straw from basic cereals, rapeseed and corn, the quantities destined for bedding, fodder, and ploughing (organic fertilizer). They concluded that in Poland, although it is also true for many countries, the agricultural structure of small producers (less than 50 ha) limits an efficient chain of straw, which inhibits its use for bioenergy [16].
In the case of Mexico, although there are several estimates on the volumes of agricultural residues [10,20,21,22,23,24,25,26,27,28], all discordant with each other, there is still a lack of accurate and consistent information on several aspects, including their geographical locations, harvesting logistics, production costs, and their actual disposal.
In this sense, Becerra-Pérez et al. [10] estimated that the net available volume of corn stover in Sinaloa as input for cellulosic ethanol is 1.3 million tons/year. There are two highly productive zones: (a) the Culiacan-Navolato Valley and (b) the Guasave-Los Mochis Valley. According to these estimates, the volume of corn stover in these areas is sufficient to produce 88.7 million gallons/year of ethanol, providing the possibility of establishing two biorefineries (one in each region), which would supply at least 20% of the potential ethanol demand in Mexico.
Hernandez et al. [27] identified, specifically for corn stover, 11 locations nationwide that could supply an ethanol plant, six of which are in Sinaloa, with an ethanol potential of 260 million liters per year. Honorato-Salazar et al. [28] identified eight municipalities nationwide that concentrate the most significant amounts of different types of agricultural biomass residues that can be used for cellulosic ethanol, four of which are in Sinaloa (based on corn), one in Baja California (based on wheat), and three in Tamaulipas (based on sorghum).
Most estimates determined that three crops produce more than 87% of residues in Mexico: corn (43%), sorghum (26%), and sugarcane (18%), which are mostly produced in the states of Sinaloa, Tamaulipas, and Veracruz, respectively [28].
The objective of this research was to design the logistic supply chain of agricultural residues, and from it create a cost structure for harvesting biomass for cellulosic ethanol production. Both the logistic chain and the cost structure were directly validated through fieldwork for a specific case of corn stover harvesting in Mexico. Given that agricultural residues can be used for animal fed or for cellulosic ethanol production, it is essential to determine the minimum selling prices (MSPs). This research was carried out in two phases: a theoretical study and practical fieldwork. In the first phase, the logistic chain was studied and designed, and in the second phase, an intervention case was carried out to validate the designed chain and estimate the harvesting costs. Given the scarce information available in the literature for details and costs of logistics, this article contributes with the design of agricultural-residue-based chains, with the definition of a cost structure for each link in the logistics chain, and with information on the use of lignocellulosic biomass obtained directly from producers, which contributes to a better understanding of the first phase of the cellulosic ethanol production chain.
The article is divided into four parts. The first presents a brief justification and the research objective; the second details the methodology, the study area, the data used, and the fieldwork; the third shows the results and discussion; the fourth summarizes the main conclusions.

2. Materials and Methods

2.1. Study Area and Data

Mexico has an agricultural frontier of 24.6 million ha, of which a total of 21.68 million ha was planted in the 2020 agricultural year, 72% in the rainfed system, and 28% in the irrigated system [29]. The top 10 crops accounting for 80% of the total planted area are: corn (34%), pasture and grassland (13%), beans (8%), sorghum (7%), sugarcane (4%), coffee (3%), fodder oats (3%), fodder corn (3%), wheat (3%), and oranges (2%) [30]. Of the crops above, the most attractive for cellulosic ethanol due to their volumes of residues are corn, sorghum, sugarcane (tops/leaves and bagasse), and wheat, the former standing out with a sown area exceeding 7.4 million ha.
Evaluating agricultural residues involves determining their geographic locations and net available volumes to ensure a sufficient and timely supply within the radius of influence (40 km) of the biorefinery [10,11,31]. For this case study, first, the agricultural regions of Mexico were determined; and second, the geographic locations of the leading agricultural waste producers were determined. For this purpose, the information was classified and filtered according to the following criteria:
(a)
Exclude rainfed agricultural land, given its high dependence on climatic conditions, which generates uncertainty regarding the production of residues. In addition, a large portion of this type of agriculture is for self-consumption, and farmers also carry out livestock activities, which makes it very unlikely that they will decide to sell their agricultural residues.
(b)
Include only regions with sown areas larger than 100,000 ha. The objective is to have a sufficient volume of agricultural residues for at least one cellulosic ethanol plant.
(c)
The set of selected regions must represent at least 80% of the total area of the country, so that most of the agricultural area in the country is included in the analysis.
Hence, twelve agricultural regions of Mexico were selected, representing 83% of the irrigated sown area and 66% of the primary gross domestic product (GDP) (see Table 1). Two aspects stand out: (1) the regions of Sinaloa, Sonora, and Guanajuato represent more than 40% of the sown area, thereby producing the most significant volumes of agricultural residues; and (2) eight out of the twelve agricultural regions have corn as their predominant crop, which presupposes that this crop is the one that generates the most residues in the country.
Subsequently, the geographic locations of the leading agricultural residue sites in Mexico were determined. Table 2 shows the six states that account for 80% of corn cultivation. Only one region (Sinaloa) accounts for 46% of the total planted area and more than 6 million tons of annual production.
Based on the above, the case study selected to validate chain logistics and estimate the costs of agricultural residues focused on corn production in the Sinaloa region. This result is consistent with other studies that also found that Sinaloa is the most suitable region for establishing potential ethanol plants from corn stover [27,28].
It must be made clear that the amount of lignocellulosic biomass available (national, state, and municipal) varies according to the estimation methodology applied, the agricultural cycles included (spring–summer and autumn–winter), the water system contemplated, the harvest index (HI) used, the crop residue index (CRI) estimated, the residue removal rate, the farmers’ practices, etc.

2.2. Agricultural Residue Logistics

A value chain methodology was used for the logistical design of agricultural residue retrieval [33], with sequentially defined links that make up the chain from the marketer’s perspective. This economic agent, who may or may not be a farmer, makes it possible for stover to be transferred from the agricultural producer (original stover owner) to the livestock farmer (livestock feed) or to the biorefinery (cellulosic ethanol). The marketer adds value to the stover in this transfer, so its economic activity was analyzed using cost–benefit accounting principles [11,33]. The MSP was estimated, which would be the purchase price by the biorefinery, or the production cost [11], in case they decide directly to harvest and handle the lignocellulosic biomass.
Furthermore, two types of surveys were applied, the first one to stover traders and the second one to agricultural producers. The methodology for selecting the sample for the first survey was the convenience method [30], and the second sample was determined by the probabilistic method [33]. Four traders (wholesalers) and experts in corn stover logistics were interviewed directly, which combined represent 85% of the total residues traded in the region. Note that in the region where the study was conducted, there is the largest cattle fattening company in Mexico (https://www.sukarne.com/en/) (accessed on 30 May 2022), which demands a large amount of stubble. These four wholesalers are the ones that supply the company with corn stover. The second survey was conducted with agricultural producers to learn about the practices followed for residues, the destination of the stover, the proportion of producers who sell it, the average price, and willingness to sell, among other variables. A total of 192 farmers were interviewed using a 16-question questionnaire (Appendix A). The sample was statistically analyzed with a confidence level of 95%, an error rate of 10%, and a variability of 0.5 (negative and positive).

2.3. Fieldwork

The fieldwork (case study) was conducted in Sinaloa, Mexico in an irrigated and corn-intensive area where agriculture is done for commercial purposes. Both surveys were applied in 2020 (second trimester), and they considered all logistical activities. Information was obtained in the field, and detailed responses were obtained from trading houses, machinery distributors, transport companies, and insurance companies.
In addition, individual farms were examined at harvest time to estimate the HI and the CRI. HI is defined as the ratio of the portion of the crop that is harvested to the total aboveground biomass [34,35]; in the case of corn, it is the percentage of grain of the total biomass harvested (grain and stover) [36]. CRI is defined as the ratio of the dry weight of the residue produced to that of the entire crop [37] and it is obtained from HI using the formula (1/HI-1) [28]. To estimate HI, 14 samples were taken from 14 different plots in the case study. In each plot, 10 m was measured from the edge towards the center of the plot to avoid the “edge effect” (problems in plant development due to pest risks from adjacent plots or agricultural work) [38]; then another ten linear meters were measured, from which three corn plants were randomly selected. Subsequently, the three plants were mixed, and their biomass was separated into grain, cobs, and stover. The biomass was taken to the laboratory and dried until it reached a constant humidity (10%), after which it was carefully weighed.
The financial variables assumed in the model were at market prices, and for the fieldwork, the average salary in the region was applied (for 2020). A standardized area of 1000 ha harvested per trader (wholesaler), 4.5 ton/ha harvested, an interest rate of 16% for capital evaluation, linear depreciation, an exchange rate of 20 $MXN/$USD, 90 days of field activities, biomass transport within a radius of 40 km, 500 kg/bale, and a traditional way of collecting stover via three passes of machinery through the plot (shredding, raking, and baling) were adopted. The technical and financial information was from official sources (crop yields, harvested area, exchange rate, interest rate, etc.) [29,30,32], and the information on machinery and input prices was from private companies (obtained conversationally). The logistical information was found directly in the field thanks to wholesale traders of agricultural residues and farmers. All the information was contrasted and validated by cross-checking data [33], and in those cases where there were differences, averages were obtained.

3. Results and Discussion

3.1. Agricultural Residue Logistics Chain

Although there are variants in the management of agricultural residues, according to the types of residue and practices of each region, the methods most used to collect them include three sequential steps: (a) shredding, which consists of shredding the stalks and other parts of stover (or all of it) to collect a more significant amount of waste; (b) raking, which consists of collecting the stover scattered on the ground in rows, to facilitate the collection; (c) baling, which consists of packing the stover found in rows, which is integrated into bales to be handled and transported to the place of use. This type of logistics process implies that three additional passes with machinery are necessary after the product (grain) has been harvested, which are tractor stalk shredding, tractor raking, and tractor baling. The above logistics do not include the front loading and transporting (usually a flatbed semi-trailer) of bales, which should certainly be considered, since it determines a high percentage of the total costs. Furthermore, the harvesting method is related to the amount of stover that can be extracted. In this regard, Brechbill and Tyner [31] estimated that a technique with three additional passes (shredding, raking, and baling) allows for harvesting up to 70% of the stover.
In comparison, a method with two additional passes of machinery (raking and baling) allows harvesting up to 52%, and a method with only one pass (baling) allows harvesting up to 38% of stover. The single-pass method requires residues to be ejected in a windrow behind the harvester. We found that the maximum harvestable quantity with the three-pass process is 50% of the total biomass that remains in the soil after harvest. Likewise, the number of agricultural activities carried out after the grain harvesting is related to the compaction level of the ground, relating to the erosion; i.e., additional passes of machinery lead to more compaction and more significant water runoff.
Bales can be collected in three sizes and shapes: large round bales, large square bales, and small square bales. Bales of the first two types are called “giant bales”, and the third are called “small bales”. The approximate weight of a giant bales is 500 kg, and that of a small bale is 20 kg. Bales, once made, can be individually wrapped in plastic to prevent moisture loss, but this action comes at a cost—not many producers do it on a regular basis. The most commonly applied system for agricultural residues in the region studied uses large square bales. Although bale size has implications for the handling and transportation of residues, it is not relevant when converted to monetary value, since costs were estimated on a unit basis, per ton and ha.
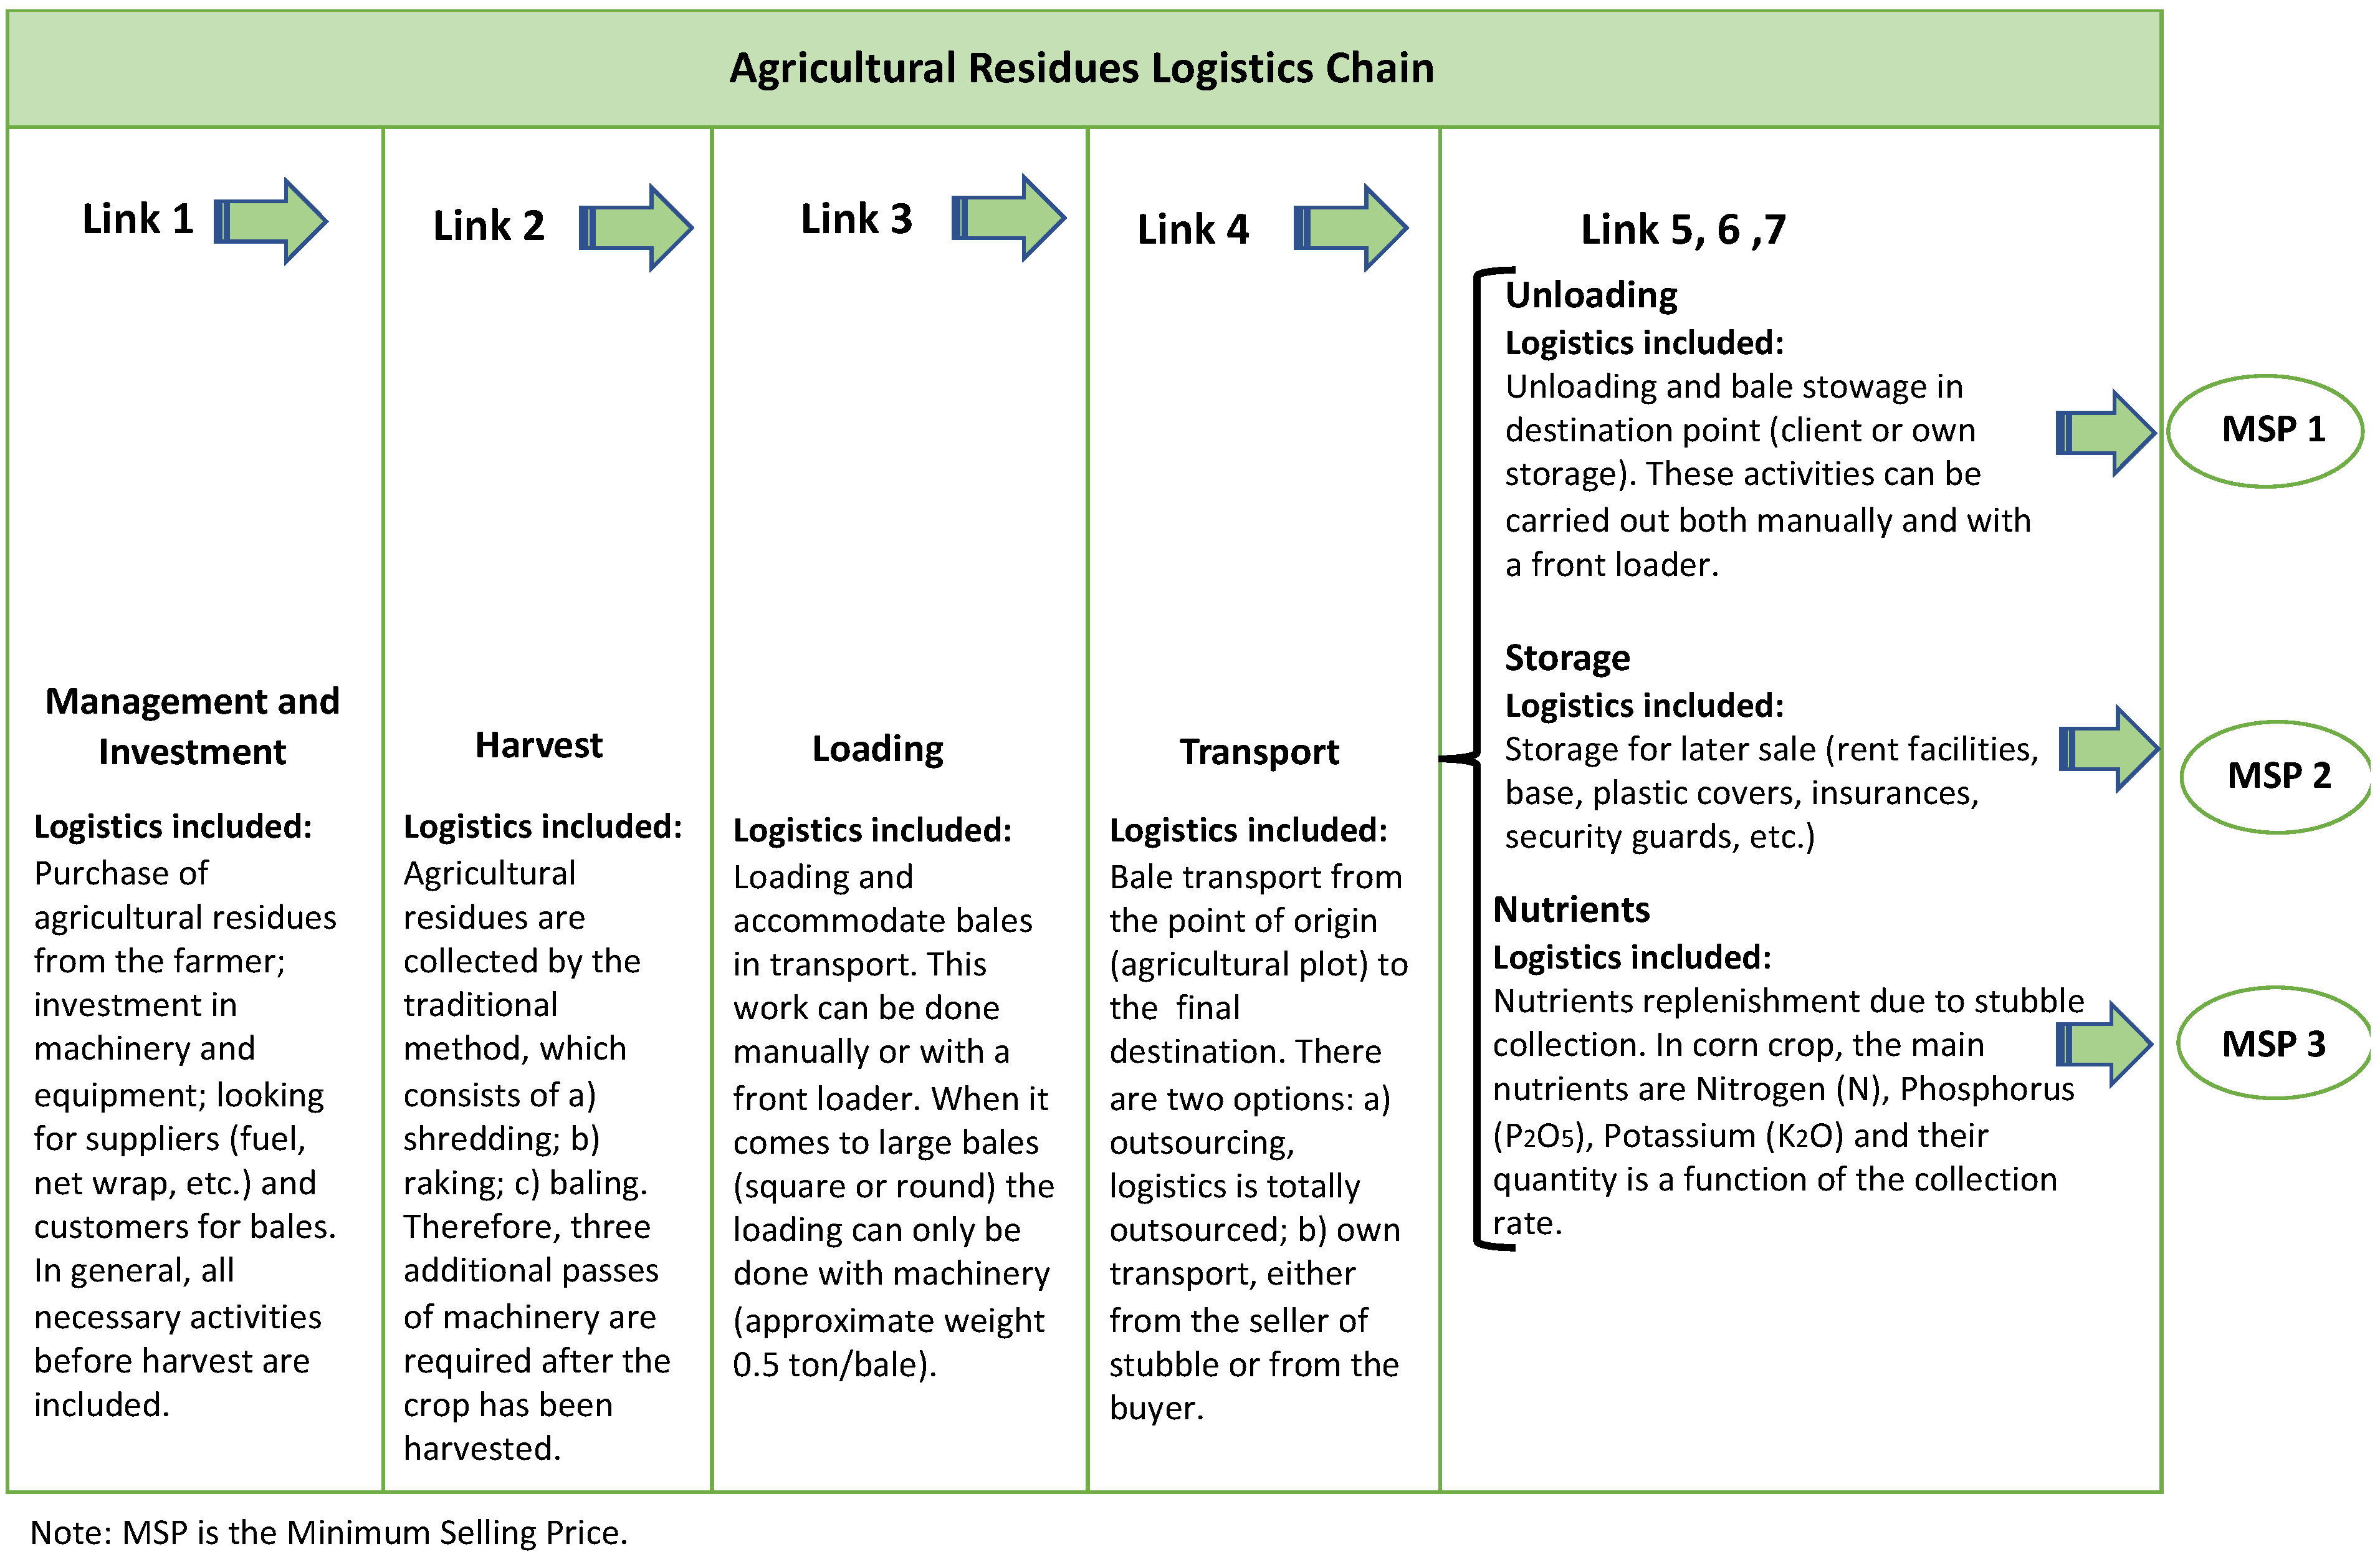
In common practice, agricultural residues are left in the field after harvesting. Several operational tasks are needed to take collect the residues. In this sense, the agricultural residue logistics chain was identified and designed, which was divided into seven links: (1) management and investment; (2) harvest; (3) loading; (4) transport; (5) unloading; (6) storage; (7) nutrients replenishment. The first link includes all pre-harvest actions and investments in machinery and equipment; second, the harvesting of residues; third, bale loading activities in transportation; fourth, the transport itself; fifth, the unloading of bales at the destination point; sixth, the storage of bales; seventh, the replenishment of nutrients in the soil by the extraction of residues. A summary of the logistics involved in each chain link can be seen in Figure 2.
The agricultural residue logistics chain generates three pricing options, here understood as minimum selling prices (MSPs). MSP1 includes costs up to link 5, leaving out storage and nutrients. It is the lowest possible price in the chain and occurs when the stover trader delivers the bales to the biorefinery yards. This price can be even lower when the ethanol plant decides to carry out certain activities in the chain on its own (baling, transport, etc.), which implies backward vertical integration [39]. POET-DSM Advanced Biofuels in Iowa (USA) followed a mixed model: (a) a farmer model, in which the farmer is responsible for the entire collection chain until the stover is delivered to the biorefinery (inside); (b) a custom model, in which the farmer only calls the plant immediately after harvest. In the latter, POET-DSM performs all links in the agricultural residue chain, although they may also subcontract part of the chain (technical visit to the plant in 2018).
MSP2 adds the logistics of harvesting residues up to link 6, including storage costs, such as facilities, construction for the bale base, plastic covers, insurance, and security guards, among others. This price excludes the nutrient link and is higher than MSP1. This fieldwork research found that only 10% of the total stover harvested by wholesale traders is stored by themselves, given the increased costs, the losses due to humidity, and the risk it represents (fire). Therefore, the stock of harvested residues is usually stored at the point of consumption, either for livestock feed or for cellulosic ethanol (potential).
MSP3 aggregates all residue logistics activities up to link seven and is the highest of all. It includes the costs of nutrient replenishment of the soil by stover extraction. This activity should be sustainable, and therefore, it should not cause harmful effects to the ground and yields of subsequent crops. It is important to note that when the trader of agricultural residues is different from the farmer, the former has no economic interests in replenishing nutrients; however, this must be considered in the production costs for the activity to be sustainable in the long term.

3.2. Harvest Index and Crop Residue Index

There are different estimates on the amounts of agricultural residues, depending on the crops included, their varieties, their yields, the water system, the planting density, and general agro-ecological conditions and crop management [11,20,22,23,27,28]. Moreover, not all residues are usable for technical and sustainable reasons, meaning that only a portion of them is available for ethanol production. Furthermore, the owners of these residues are a large number of producers, generally small-scale farmers, who, for various reasons, may decide to sell or not. This generates even more uncertainty for biomass availability. A major problem is knowing the accurate availability of surplus stubble and its supply stability [16].
Therefore, it is imperative to have more precise estimates of the net disposal of agricultural residues at the national and sub-national levels. This implies fieldwork (measurements and validations) to determine, at the municipality or locality level, the actual disposal of agricultural residues, the willingness to sell by the owners of the residues, and the current uses of biomass.
Estimations on residues’ availability has followed a reverse engineering approach, since the methodologies applied go from the general information to the particular information, and from aggregate data to disaggregated data. Estimating residues from communities and municipalities would be much more accurate, when having specific production rates by area and crop, the producer’s willingness to sell, and characterization of the geo-referential location, and only then following a process of data aggregation.
A commonly used mechanism for estimating crop residues involves the HI and CRI [27,28,34,35,36,37]. A review of the literature on these two indices for corn is reported in Table 3. In general, the HI was found to be between 0.33 and 0.65; the mean was 0.48, and the standard deviation was 0.08. This implies that the average corn-grain yield is 48% of the total aerial biomass produced in the crop, with a deviation of 8%. The CRI was in the range of 0.55–2.0. The mean was 1.15, and the standard deviation was 0.37. This indicates that, on average, corn stover production is 1.15 tons per ton of corn grain. Note that the value of the standard deviation of the CRI is very high with respect to the mean, which shows low uniformity for this index.
An HI of 0.45 and a CRI of 1.21 were calculated for the area studied. Note that the estimates are for by a high-yield agricultural irrigated area (12 ton/ha; 80,000–90,000 plants/ha). Thus, the region studied generates 1.2 tons of stover per each ton of corn-grain produced. Additionally, it shows that if a more precise estimate of agricultural residues in Mexico is wanted, it would be necessary to determine the HI and CRI for each zone, municipality, and crop, at least for the regions with the most remarkable agricultural development in the country.
An essential aspect in determining the net availability of agricultural residues for cellulosic ethanol production is the share of accessible biomass, given the orographic conditions of the terrains, roads, and access to the fields; the shape and size of the stover (ground, whole, scattered, grouped, etc.); and climatic conditions, among other aspects that may hamper their collection and use. Due to these multiple uncertain factors, there is no consensus in the literature on the ratio of residues to be extracted. For example, Hernández et al. [27] applied 70% for corn stover, 70–90% for wheat straw, 70% for sugarcane straw, and 100% for sugarcane bagasse, whereas Honorato-Salazar et al. [28] applied 40% for all agricultural residues in Mexico. Other studies set the removal ratio of agricultural residues to between 30% and 50% [36,39,58,59,60]. This research found that 45% of the total residue is being harvested in those plots where stover is being collected.
Another element to consider is the producers’ willingness to sell the residues. This factor is different in each region and is related to the farmer’s practices (stover burning, incorporation into the soil, etc.), livestock raising, conservation agriculture, and the uses and customs of the region. The survey applied to producers in the studied area shows that only 20% of them currently sell their residues, but 65% would be willing to do so, a significant percentage if we think in terms of cellulosic ethanol. Of the remaining 35% that would not be willing to sell, 75% indicated that doing so would affect the nutrients in their plots.

3.3. Replacement of Nutrients

When agricultural residues are extracted from the crop area, nutrients are also removed, which will no longer be incorporated into the soil through the biological processes of mineralization and humification of the biomass. In the case of corn, the most commonly used nutrients are nitrogen (N), phosphorus (P2O5), and potassium (K2O), regardless of the source used [31,58]. Although the correct amounts of nutrients are to be supplied depending on soil analysis (laboratory), in the region studied in this case study, farmers apply an average of 320 units of N, 52 units of P2O5, and 30 units of K2O.
This research found no evidence that nutrient replacement is taking place. However, it is common to add nutrients to the new corn crop regardless of whether stover was harvested. In a scenario of widespread stover harvesting due to cellulosic ethanol production, nutrient replacement would have to be included in the production costs to make this activity sustainable in the long term.
Several studies have analyzed stover collection methods with the objective of extracting the least amounts of nutrients and reducing nutrient replacement costs. To this end, it has been proposed that certain parts of the stover can mostly be extracted, whereas other parts only to a limited extent. In this regard, [58,61,62,63,64] proved the benefits of increasing the extraction of cobs, husks, and leaves; and decreasing the harvesting of stalks, given the carbon–nitrogen ratio of the latter. This helps to reduce the problem known as “nitrogen immobilization” and leads to an approximately 13% reduction in nitrogen requirements in the following crop [36,63].
The natural drying process of the corn plant is the top-down, causing minerals to tend to concentrate in the lower part of the plant [36], and the “carbon-to-nitrogen” ratio in the lower part of the plant is further decreased. Hence, its biological degradation process immobilizes less nitrogen from the soil, making it available for the development of the new plant. Thus, leaving the plant stalks on the field is more beneficial to the new crop harvest than leaving other parts of the stover.
The problem of “nitrogen immobilization” occurs when the decomposing residues have a carbon-to-nitrogen ratio greater than 24:1 [65]. The carbon-to-nitrogen ratios reported in the literature are: stems 60–70:1; stalks 60–125:1; leaves and husks 40–50:1 [36,58,65]. This implies that by removing less carbon (leaving more stalks in the soil), microorganisms will demand less organic nitrogen in the stover decomposition process. Therefore, more nitrogen will be available in the soil for the next crop.
By making logistical changes to harvest fewer stalks, their harvesting can decrease by between 15% and 20%. In comparison, the leaves and husks can increase by 24%, thereby reducing the problem of nitrogen immobilization and reducing nutrient replenishment [36,62].
Regarding the specific amounts of nutrients to be replenished by the extraction of corn stover, a review of literature is presented in Table 4. The averages indicate replenishment of 7 kg N/ton, 2.2 kg P2O5/ton, and 12.2 Kg K2O/ton of harvested corn stover. These amounts should be multiplied by the market price of each nutrient to know the replacement costs. Note that it is necessary to convert these amounts to the fertilizer source units.

3.4. Cost Structure of the Agricultural Residue Logistics Chain

Following the agricultural residue logistics chain shown in Section 3.1, a financial system was developed to estimate the costs, progressively, of each of the seven links that make up the chain. The different costs were grouped into concepts, such as fuel, workforce, machinery, and others. In general, all pre-harvest expenses, including the purchase of stover from the farmer, are accounted for in link 1. Capital investment, although performed before harvest, maintenance, insurance, and depreciation are included in the corresponding link where the machinery is used, i.e., tractors, stalk-shredder, rake, and large square bales in harvest (link 2); front loader in loading (link 3); and truck in transport (link 4). In the case of machinery that can be used in other agricultural activities, only the cost corresponding to the time that the stover harvest lasts (90 days) is included. For the capital analysis, financial functions were used in a Microsoft Excel spreadsheet, including NPV (net present value), PV (present value), FV (future value), IPMT (interest payment total), PMT (payment total), and so on.
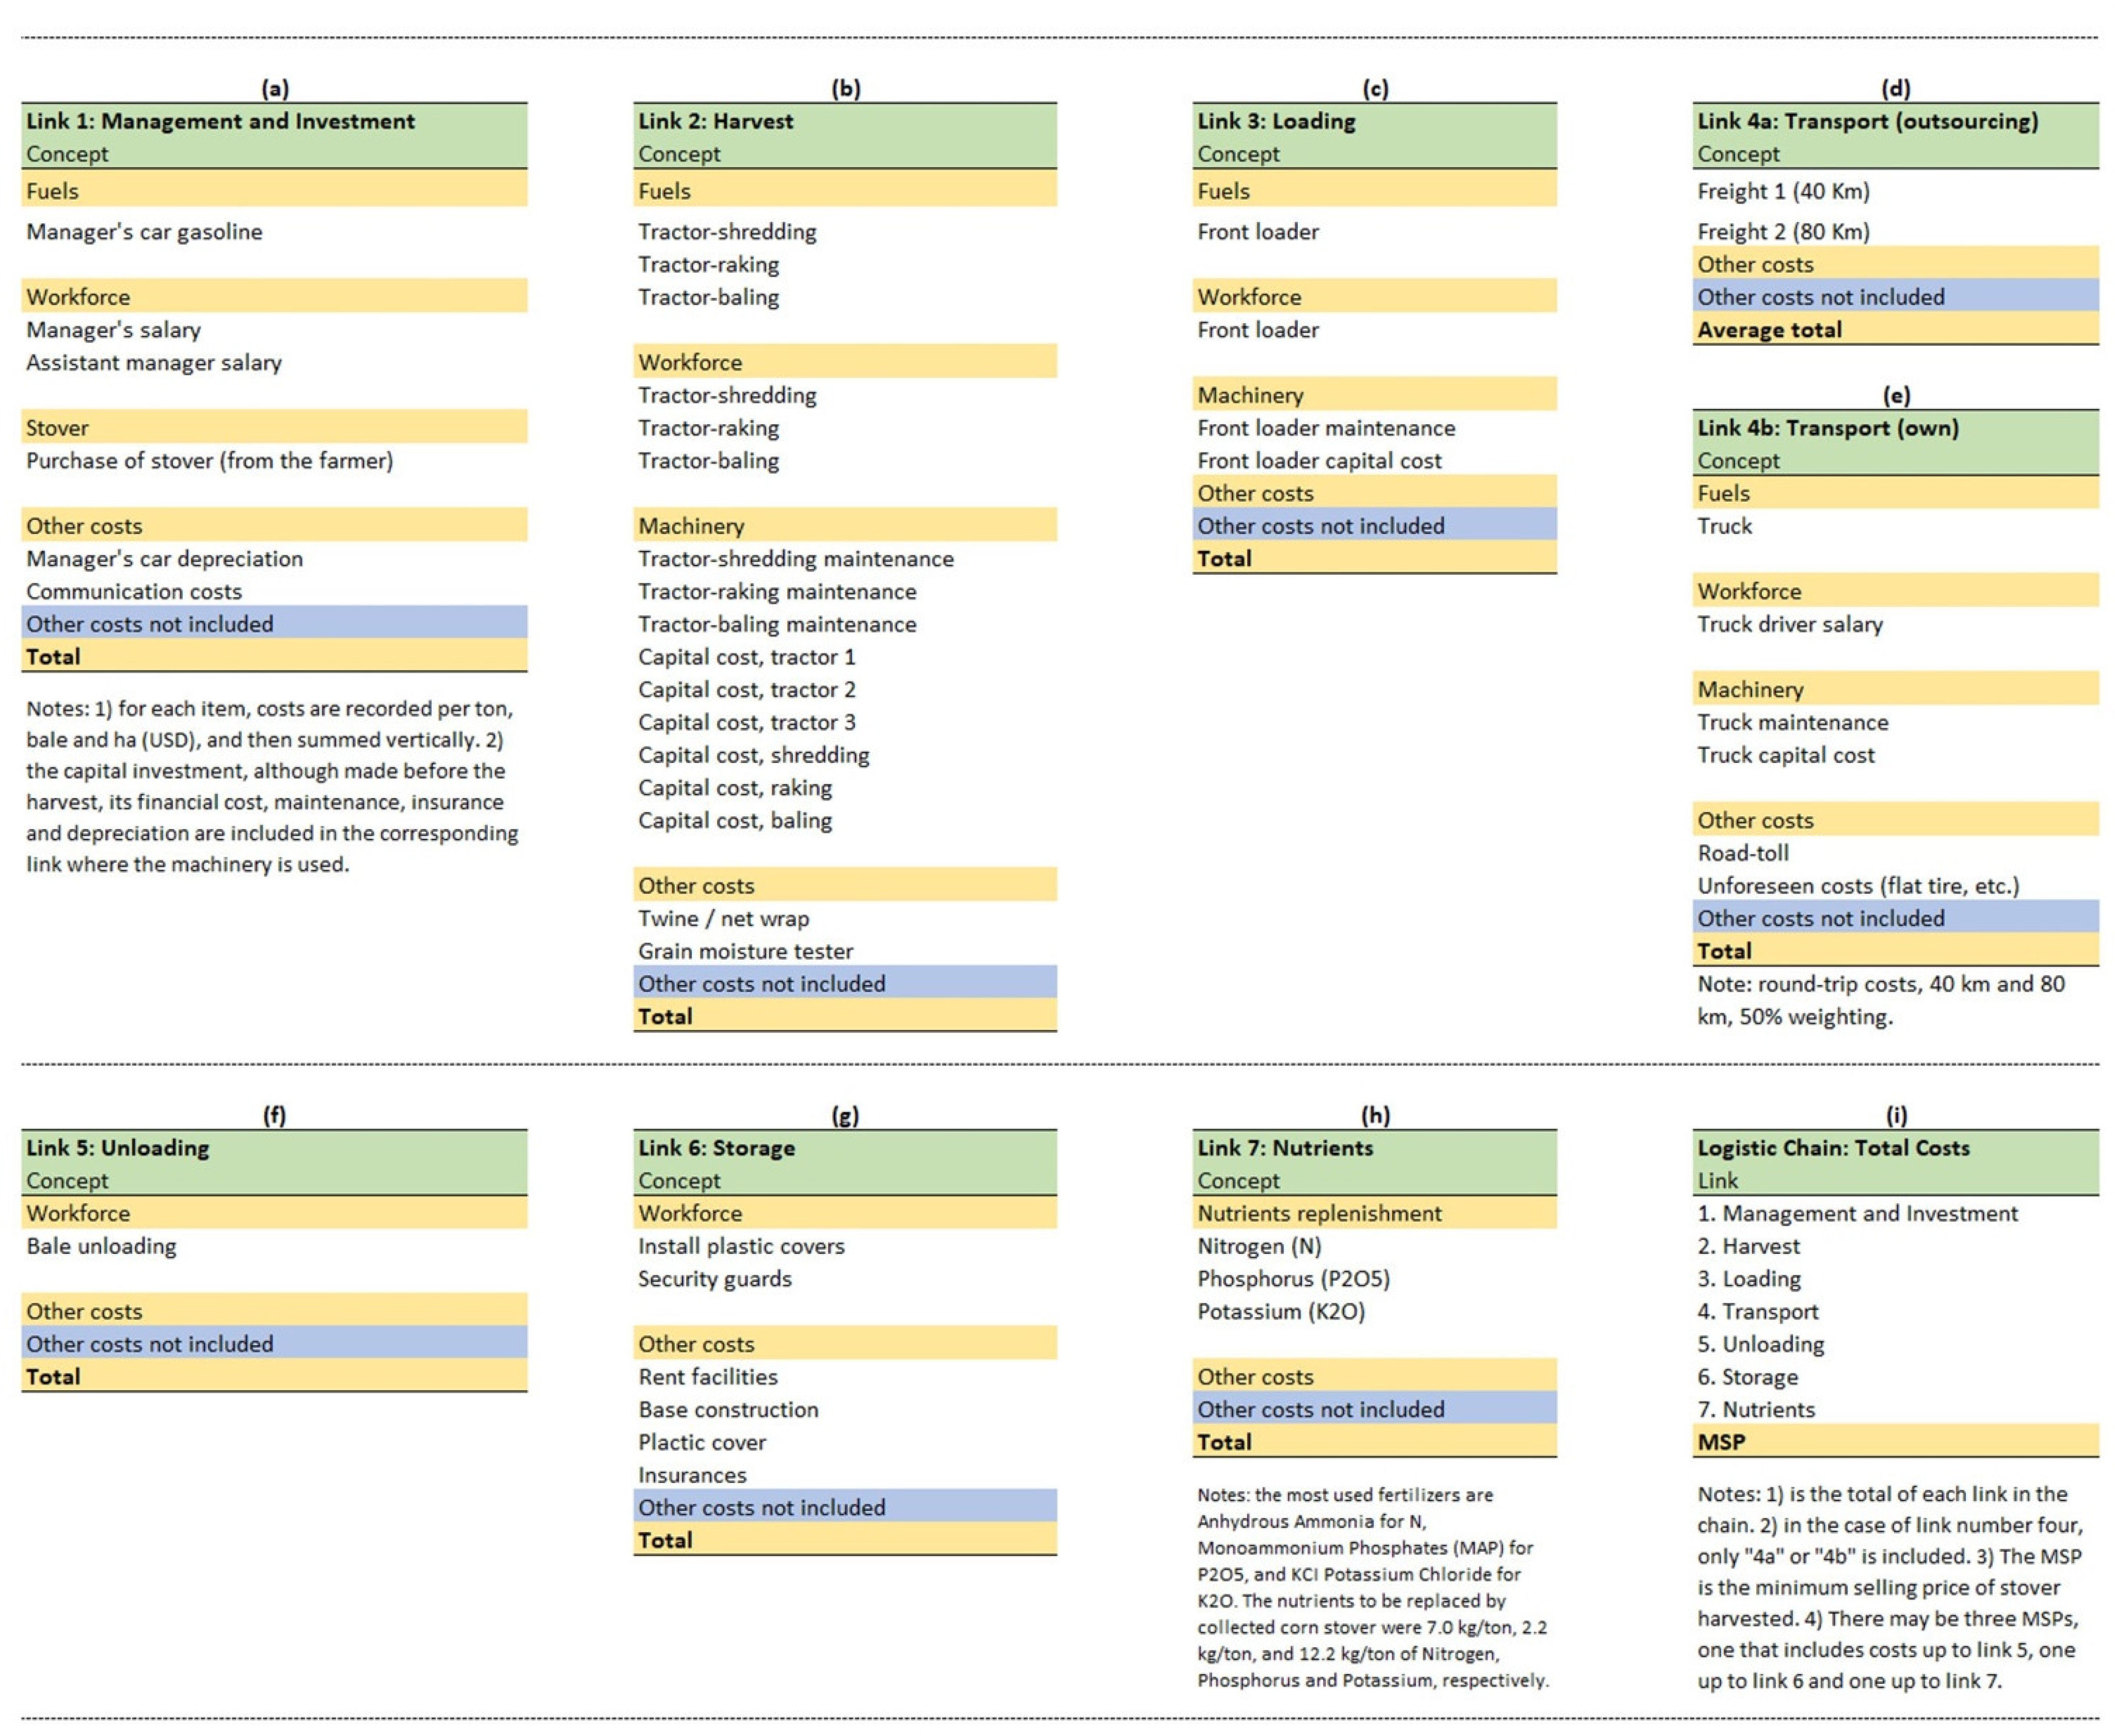
The cost structure was made to be followed and replicated for other regions and crops. With the idea that the structure can be adapted to different conditions at each chain link, the possibility of including additional costs for activities not contemplated in the current design was left open. Each concept must be calculated on a unitary basis per bale, ton, and ha. The complete cost structure can be seen in Figure 3.
In the case of link 4, there are two alternatives: outsourced transport (link 4a) and own transport (link 4b). The first implies that the stover harvester outsources transportation, in which case the average cost of two routes (40 and 80 km) is included; the second means that the harvester has its own transport, in which case the average costs of fuel, labor, capital, maintenance, and insurance for the same two routes are included.
In the case of link 6, there is the option of including the costs of stover storage or not. The first case assumes that the wholesaler trader stores it for later sale, whereas the second case means that the wholesaler trader sells it immediately after harvesting, delivering the product directly from the plot to the client. In general, each link was estimated and added up to the total cost of the agricultural residue logistics chain. The data used for the case study are presented in the following section.

3.5. Case Study: Corn Stover Harvest Costs

Following the logistics chain of agricultural residues and the cost structure defined in the previous sections, a case study was carried out for the corn stover. The final stage of the chain, in which the estimated costs of the seven links must be added, is called the total cost.
In the case study, the total cost of corn stover ($USD/ton, $USD/bale, $USD/ha) is called the minimum corn stover selling price (MCSSP), and it was assumed that a wholesaler trader is involved. Furthermore, this study considers three MCSSPs. The first one considers links up to and including link 5 (i.e., it does not include links 6 and 7), the second one, links up to and including link 6 (i.e., it does not include link 7), and the third one, links up to and including link 7 (i.e., all links are included).
This research found that nutrient replacement is not taking place, as the stover collector is a different agent from the farmer. Therefore, the chain-link called nutrients (link 7) has the value of zero, since this agent has no economic incentive to cover such costs. However, it should be considered to make this activity to make the whole system sustainable in the longer term. Furthermore, we found that the wholesaler trader stores only 10% of the harvested stover, meaning that MCSSP 2 (which includes storage) does not represent the current practice either.
Thereby, in practical terms, the cost of corn stover production that best represents the analyzed region is MCSSP1. There is a high profit margin for the wholesaler trader, since it is not incurring other costs that might be included, especially the replacement of nutrients, thereby affecting the agricultural producer.
In order to able determine the potential profitability of cellulosic ethanol production from corn stover, a plant has at least the following raw material pricing options: (a) purchase corn stover at MCSSP1; (b) purchase corn stover at MCSSP1 plus the costs of nutrient replacement (link 7); (c) carry out the entire logistical chain of corn stover collection on its own, but in this case, its cost would not be very different from that of the wholesaler trader estimated here. Since those prices come from the cost structure and are minimal, for options “a” and “b” (described above), the plant would have to add the wholesaler trader’s profit margin, which is approximately 30%. The options most used by POET-DSM are “b” and “c”, which involve developing close relationships with farmers, intermediaries, and independent agents who rent machinery and carry out complementary logistics activities.
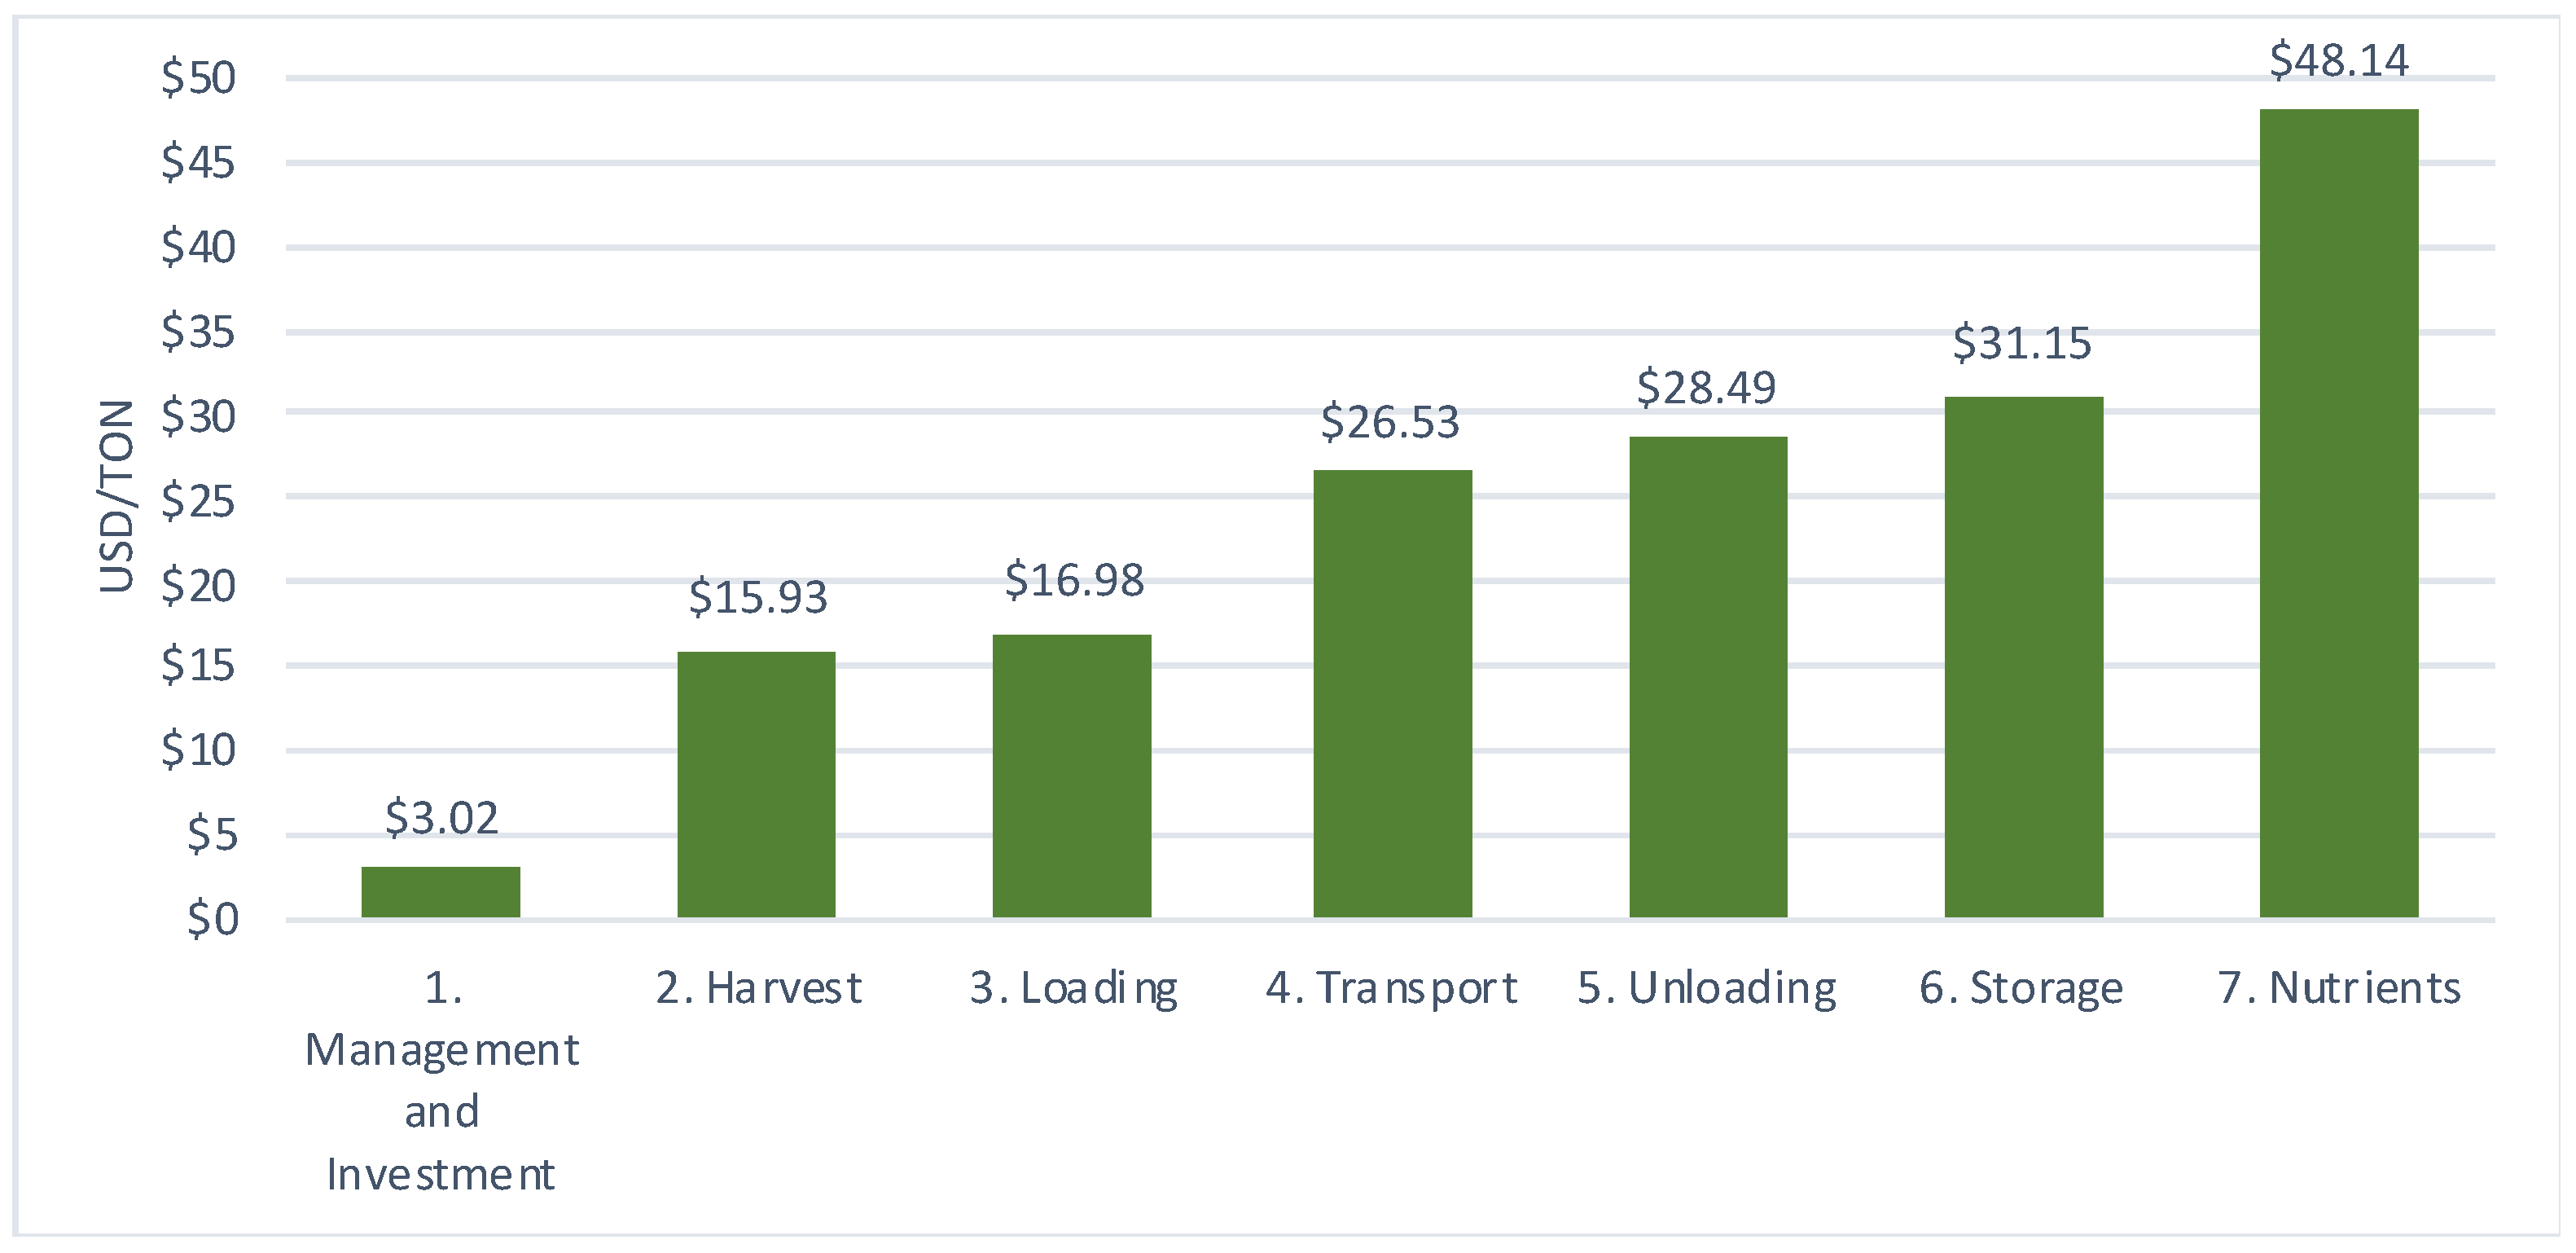
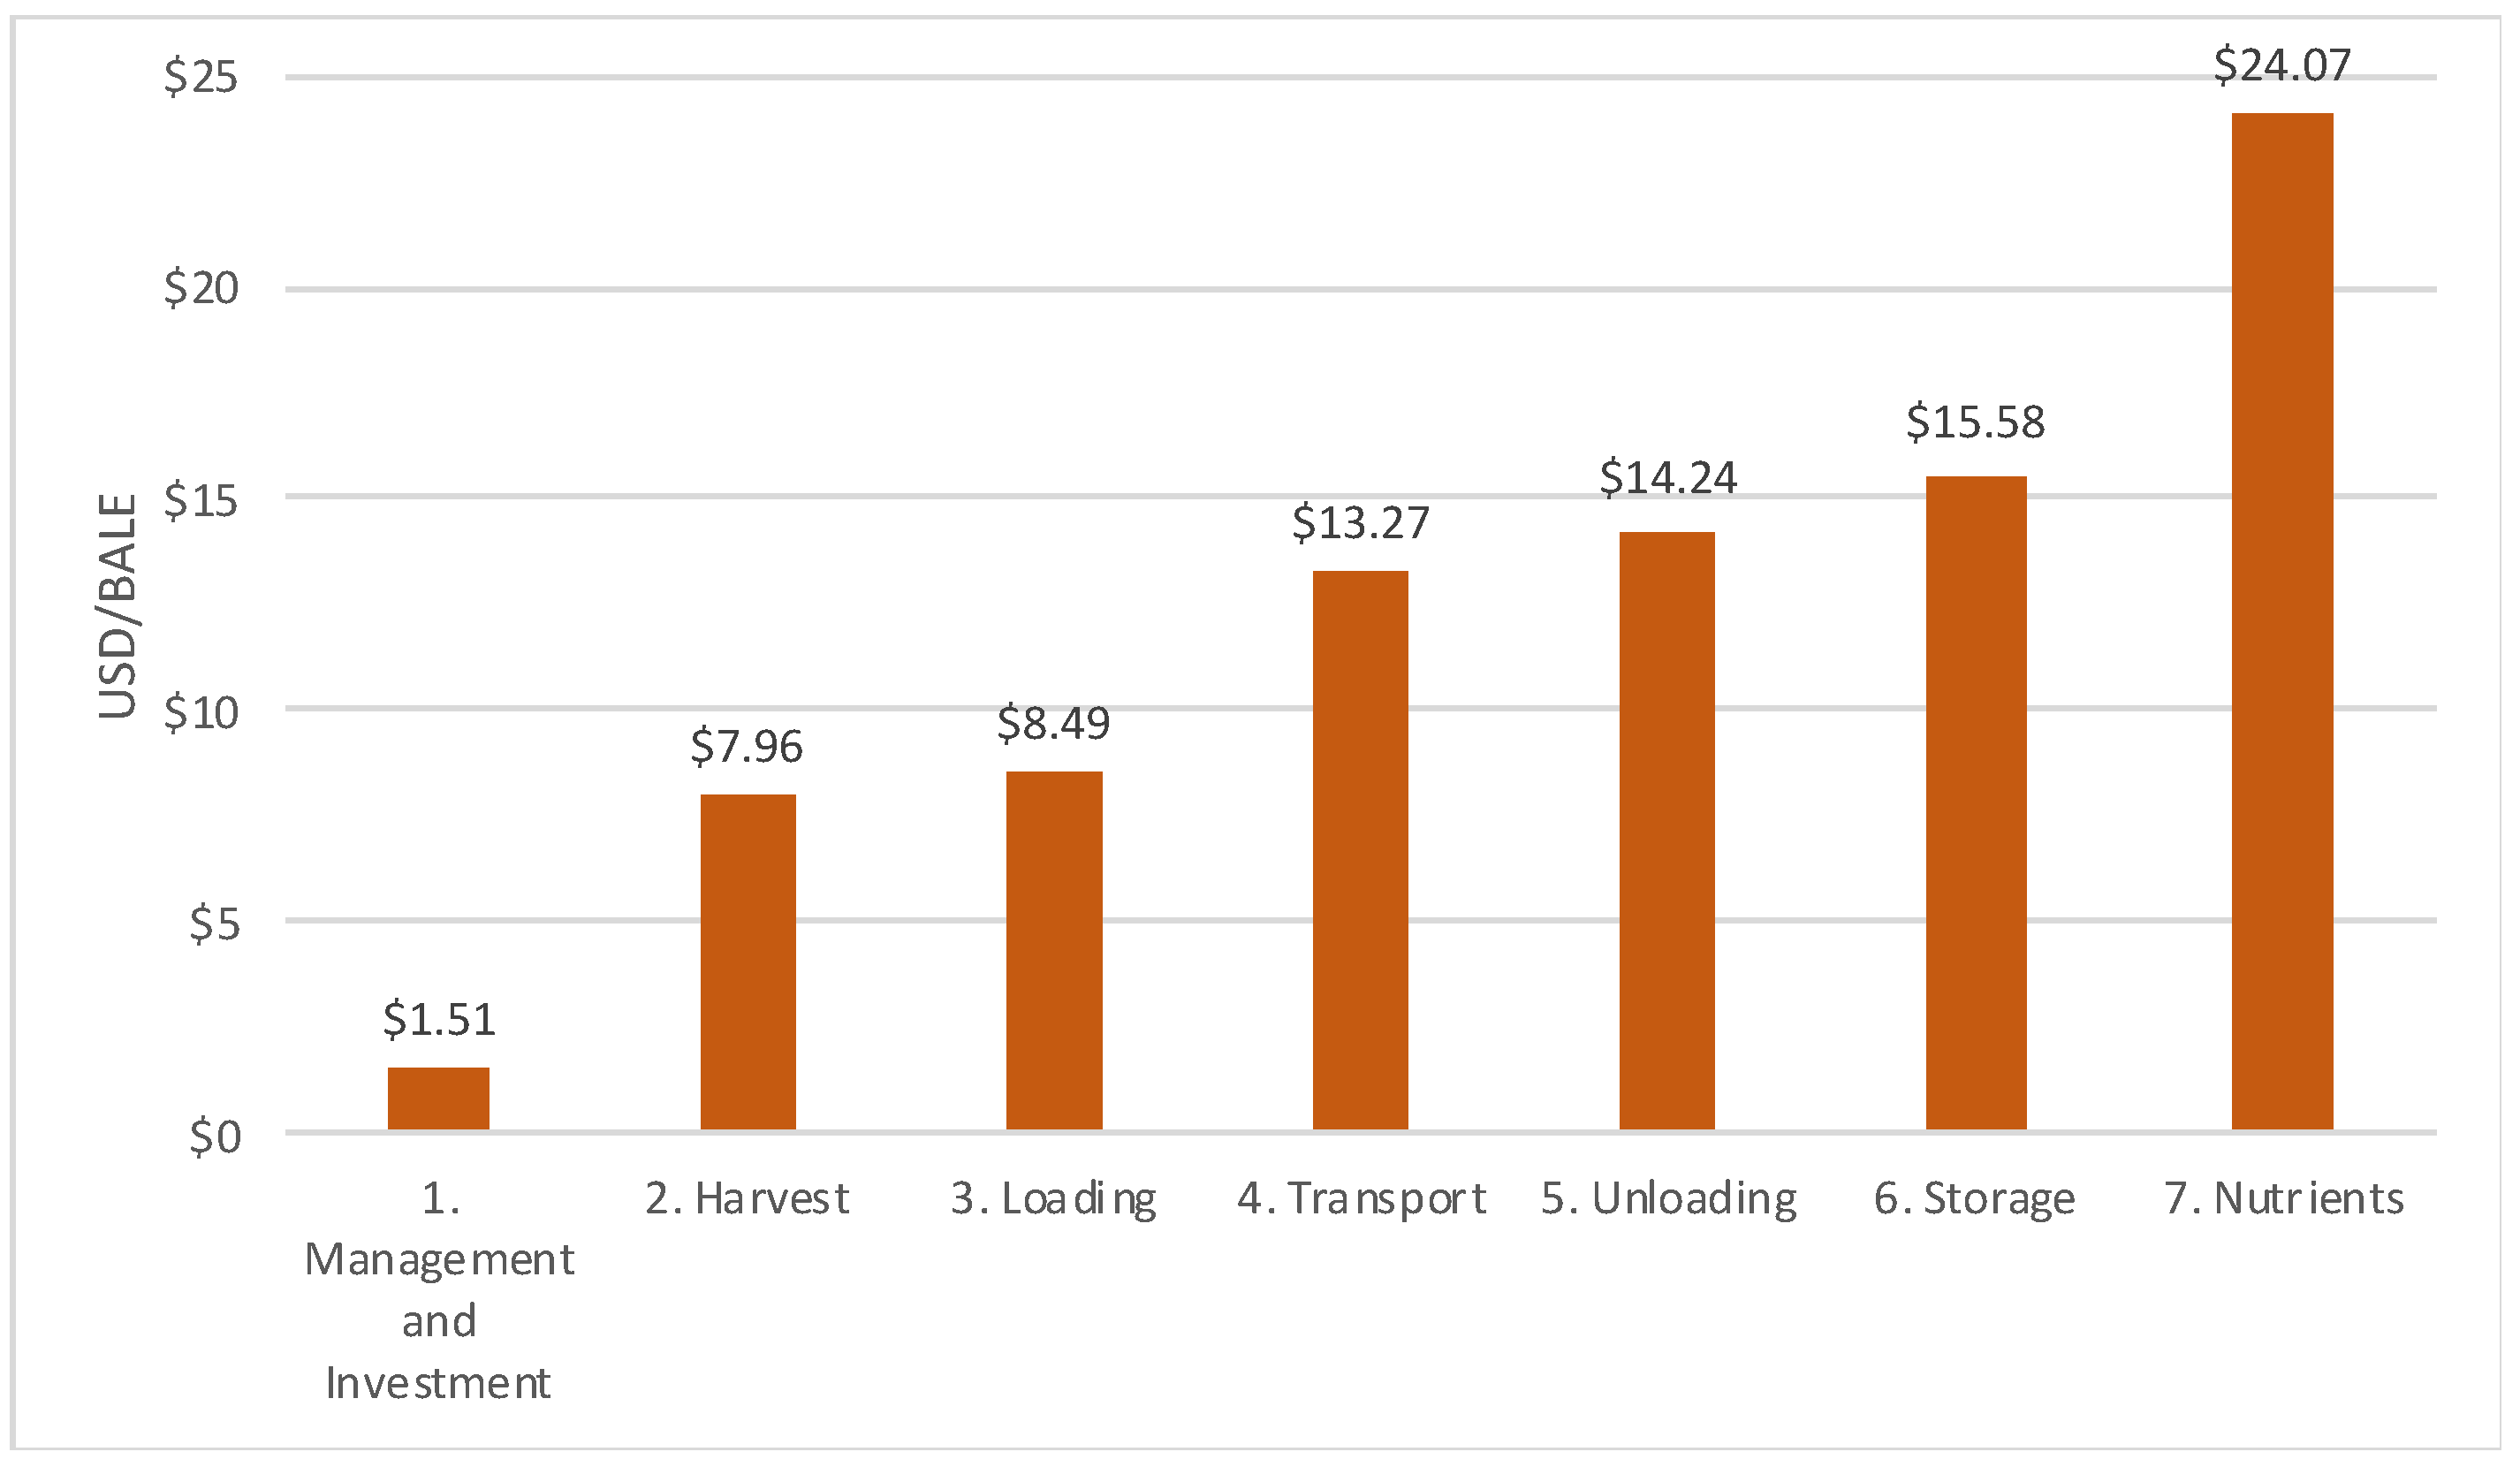
The specific costs per link in the corn stover logistics chain are presented in Table 5. The total estimated costs for different unitary values are $48.14 USD/ton, $24.07 USD/bale, and $216.62 USD/ha. Note that the nutrient link (link 7) has a high weight, 35%, of the total harvest costs, even higher than the harvest link (27%). This can be interpreted in various ways. First, the harvesting of agricultural residues must include the replenishment of nutrients extracted from the soil, and this has a high cost. Second, since nutrients are not currently replenished in Mexico, producers who sell their residues are impoverishing their land, which will have negative consequences on future agricultural yields. Third, the farmer, by selling his stover and not receiving payment for nutrient replenishment, is transferring unpaid value to the wholesaler trader of stover (in other words, the farmer is subsidizing the agricultural residue chain). The aggregated corn stover costs per link for different unitary values—per ton and per bale—are presented in Figure 4 and Figure 5, respectively.
Finally, the three estimated prices (MCSSP1, 2, and 3) are presented in Table 6, these being the basis for the profitability calculations for cellulosic ethanol from corn stover: MCSSP1 $28.49 USD/ton, MCSSP2 $31.15 USD/ton, and MCSSP3 $48.14 USD/ton.

4. Conclusions

Mexico needs to move towards renewable energies that diversify the energy matrix and help mitigate climate change. Evaluating renewable energy alternatives that take advantage of available resources without compromising their availability for future generations is strategic for a nation. In this context, the agricultural residue logistics chain was designed, which integrates seven links and generates three minimum selling prices (MSP) as output. Given the variability in the reported estimates for the availability of agricultural residues, the methodologies applied in the literature were discussed. Such methodologies generally go from the global perspective to a more particular one, whereas in this paper we proposed doing things the other way around, i.e., from local data to aggregated global data. To do this, the harvest index and the crop residue index were calculated for a local area. The information on nutrient replacement by extraction of agricultural residues was also reviewed, addressing an assessment of the harvesting methods, and we concluded that, in the case of corn residues, it is preferable to reduce the extraction of stalks and increase the harvest of other parts of the stover, e.g., cobs, leaves, and husks. Finally, through a cost structure template for agricultural residues, the costs of corn stover were determined for a region of Mexico, which can serve as an example for other areas of the country and abroad. The calculated minimum selling prices for corn stover are: MCSSP1 $28.49 USD/ton (for delivery to the biorefinery’s gate), MCSSP2 $31.15 USD/ton (for delivery and storage), and MCSSP3 $48.14 USD/ton (for delivery, storage, and nutrient replenishment). Given the large role that the cost of the feedstock has in the profitability of cellulosic ethanol, having logistical information on agricultural residue and its costs is essential to advancements in the use of biofuels in Mexico.

Author Contributions

Conceptualization and study design: L.A.B.-P.; review of literature and drafting: L.A.B.-P. and J.A.P.-D.; writing-review and editing: L.A.B.-P., J.A.P.-D. and L.E.R.; fieldwork: L.A.B.-P.; software: L.E.R. and J.A.P.-D.; resources and project administration: L.A.B.-P. All authors have read and agreed to the published version of the manuscript.

Funding

This research was funded by SENER-CONACYT Energy Sustainability Fund (Mexico), and the Autonomous University of Sinaloa (Mexico) through project 259930.

Institutional Review Board Statement

Not applicable.

Informed Consent Statement

Not applicable.

Data Availability Statement

The datasets used and analyzed during the current study are available from the corresponding author on request.

Acknowledgments

We would like to thank Department of Agricultural Economics (Wallace E. Tyner), Purdue University (USA), and Department of Biotechnology, Delft University of Technology (The Netherlands); both received Luis Armando Becerra-Pérez as a postdoctoral fellow, during which time this article was written.

Conflicts of Interest

The authors declare no conflict of interest. We declare that the funders had no role in the design of the study; in the collection, analysis, or interpretation of data; in the writing of the manuscript; or in the decision to publish the results.

Appendix A. Survey to Determine the Use of Corn Stover by the Farmer

Folio: _________
Note: The strictly confidential survey, responses will not be published individually and is only for statistical purposes on agricultural residues.
Date: ___________; Locality:_________; Municipality:_________; State: __________.
1. How many hectares of corn did you plant during the last agricultural cycle? _______ ha.
2. How many tons of corn-grain did you harvest? _______ ton.
3. What variety of hybrid corn did you plant (commercial name)? ________________.
4. As a corn producer, which sector do you belong to?
(a) Social sector (ejido).
(b) Private sector (private property).
(c) Lessor.
5. What did you do with the stover left on your land after harvesting the grain?
(a) Incorporated it into the land.
(b) Burned it.
(c) Sold it as animal feed.
(d) You used it yourself (animal feed and/or another purpose).
6. Regardless of what you did with the corn stover in the last cycle, do you usually sell it?
(a) Yes
(b) No
Note: if the answer is YES continue, otherwise go to question 12.
7. If you sell it, to whom do you usually sell it?
(a) To a person or company that packs it to sell it (a middleman).
(b) To a person who packs it for his own livestock (final consumer).
(c) To a livestock association, which in turn sells it to its members.
(d) Other, which one? ______________
8. If you sell it, what is the most usual process to take it out of your plot?
(a) It is packed directly by the buyer, after you harvest the grain.
(b) You pack it yourself and then sell it.
(c) The buyer brought the cattle into your field.
9. If you sell it, how do you usually get paid for the stover?
(a) Per hectare.
(b) Per ton.
(c) Per bale.
10. If you sell it, at what price did you sell it last crop cycle?
(a) __________ $MXN/ha.
(b) __________ $MXN/ton.
(c) __________ $MXN/bale.
Note: if the answer is “c”, ask the next question, otherwise skip it.
11. If you sold it by bales, how many bales did you get per ha?
(a) ______ small bales (approximately 20 kg).
(b) _______ giant bales (approximately 500 kg).
12. Regardless of whether you incorporated the stover into the land, burned it or used it for your own livestock, if someone wanted to buy it, would you be willing to sell it?
(a) Yes
(b) No
Note: if the answer is NO, ask the next question, otherwise skip it.
13. If the answer to the previous question is NO, for what reason? (you can check several)
(a) It affects the nutrients in the soil.
(b) The price they pay is very low.
(c) You are already using it on your own livestock.
(d) I don’t have the equipment to bale the stover (shredder, rake and baler).
14. Regardless of what you currently do with your stover, which of the following options seem most appropriate to you?
(a) Sell it by hectare, as it is after harvesting the grain (without adding expenses and labor).
(b) Bale it and then sell it (adding expenses and labor).
(c) Not to sell it.
15. According to your experience and the conditions for buying/selling stover in your community, supposing you decided to sell the stover per hectare, as it is left after harvesting the grain (without adding expenses and labor), what would be an adequate price for you?
(a) ______ per ha.
16. If the price you indicated in the previous question were met, how likely would you be to sign a contract for the sale of stover?
(a) High probability.
(b) Medium probability.
(c) Low probability.

References

  1. Jarabo Friedrich, F.; Pérez Domínguez, C.; Elortegui Escartin, N.; Fernández González, J.; Macías Hernández, J.J. El Libro de las Energías Renovables; S.A. de Publicaciones Técnicas: Madrid, Spain, 1998; ISBN 84-86913-01-2. [Google Scholar]
  2. Fernandes, L.H.S.; De Araújo, F.H.A.; Silva, I.E.M.; Neto, J.S.P. Macroeconophysics indicator of efficiency. Phys. A 2021, 573, 125946. [Google Scholar] [CrossRef]
  3. Timmons, D.; Harris, J.M.; Roach, B. La economía de las energías renovables. In A GDAE Teaching Module on Social and Environmental Issues in Economics; Global Development and Environment Institute, Tufts University: Medford, MA, USA, 2014. [Google Scholar]
  4. IPCC (Intergovernmental Panel on Climate Change). Climate Change 2021, the Physical Sciences Basis. Sixth Assessment Report of the IPCC. Working Group I (WGI) Contribution to the Sixth Assessment Report of the IPCC, 2021. WMO, UNEP. Available online: https://www.ipcc.ch/report/ar6/wg1/#FullReport (accessed on 24 March 2022).
  5. Paris Agreement. United Nations Climate Change (Pdf Version). 2015. Available online: https://unfccc.int/process-and-meetings/the-paris-agreement/the-paris-agreement (accessed on 24 March 2022).
  6. Mediavilla Pascual, M. ¿Qué Está Pasando con el Petróleo? 2019. Available online: https://theconversation.com/que-esta-pasando-con-el-petroleo-125260 (accessed on 24 March 2022).
  7. Shell International. World Energy Model, A View to 2100. 2017. Available online: www.shell.com/scenarios (accessed on 11 February 2022).
  8. Radionova, M.V.; Bozieva, A.M.; Zharmukhamedov, S.K.; Leong, Y.K.; Lan, J.C.; Veziroglu, A.; Veziroglu, T.N.; Tomo, T.; Chang, J.; Allakhverdiev, S.I. A comprehensive review on lignocellulosic biomass biorefinery for sustainable biofuel production. Int. J. Hydrogen Energy 2022, 47, 1481–1498. [Google Scholar] [CrossRef]
  9. US/DOE. Billion-Ton Report: Advancing Domestic Resources for a Thriving Bioeconomy, Economic Availability of Feedstocks; ORNL/TM-2016/160; Oak Ridge National Laboratory: Oak Ridge, TN, USA, 2016. Available online: http://energy.gov/eere/bioenergy/2016-billion-ton-report (accessed on 25 April 2022).
  10. Becerra-Pérez, L.A.; Tyner, W.E.; García-Paez, B. Cellulosic Ethanol in Mexico: An Appraisal as Industrial Feedstock. In Advances in Renewable Energy Engineering; Digambar, N.P., Ed.; Akinik Publications: New Delhi, India, 2019; Volume 1, ISNB 978-93-5335-557-9; ISBN 978-5335-558-6. [Google Scholar]
  11. Becerra-Pérez, L.A.; Gastélum-Delgado, M.A.; Posada-Duque, J.A. Deseño, costos y suministro de la cadena de rastrojo de maíz para etanol celulósico en México. In Proceedings of the Congreso Internacional de Energía 2021, Mexico City, Mexico, 20–24 September 2021. [Google Scholar]
  12. Bentsen, N.S.; Felby, C.; Thorsen, B.J. Agricultural residue production and potential for energy and materials services. Prog. Energy Combust. Sci. 2014, 40, 59–73. [Google Scholar] [CrossRef]
  13. Cherubin, M.R.; Oliveira, D.M.D.S.; Feigl, B.J.; Pimentel, L.G.; Lisboa, I.P.; Gmach, M.R.; Varanda, L.L.; Morais, M.C.; Satiro, L.S.; Popin, G.V.; et al. Crop residue harvest for bioenergy production and its implications on soil functioning and plant growth: A review. Sci. Agric. 2018, 75, 255–272. [Google Scholar] [CrossRef] [Green Version]
  14. Gauder, M.; Graeff-Hönninger, S.; Claupein, W. Identifying the regional straw potential for energetic use on the basis of statistical information. Biomass Bioenergy 2011, 35, 1646–1654. [Google Scholar] [CrossRef]
  15. Weiser, C.; Zeller, V.; Reinicke, F.; Wagner, B.; Majer, S.; Vetter, A.; Thraen, D. Integrated assessment of sustainable cereal straw potential and different straw-based energy applications in Germany. Appl. Energy 2014, 114, 749–762. [Google Scholar] [CrossRef]
  16. Gradziuk, P.; Gradziuk, B.; Trocewicz, A.; Jendrzejewski, B. Potential of Straw for Energy Purposes in Poland—Forecasts Based on Trend and Causal Models. Energies 2020, 13, 5054. [Google Scholar] [CrossRef]
  17. Ekman, A.; Wallberg, O.; Joelsson, E.; Börjesson, P. Possibilities for sustainable biorefineries based on agricultural residues—A case study of potential straw-based ethanol production in Sweden. Appl. Energy 2013, 102, 299–308. [Google Scholar] [CrossRef]
  18. Lantz, M.; Prade, T.; Ahlgren, S.; Björnsson, L. Biogas and Ethanol from Wheat Grain or Straw: Is There a Trade-Off between Climate Impact, Avoidance of iLUC and Production Cost? Energies 2018, 11, 2633. [Google Scholar] [CrossRef] [Green Version]
  19. Zhang, C.; Xie, G.; Li, S.; Ge, L.; He, T. The productive potentials of sweet sorghum ethanol in China. Appl. Energy 2010, 87, 2360–2368. [Google Scholar] [CrossRef]
  20. Valdez-Vazquez, I.; Acevedo-Benítez, J.A.; Hernández-Santiago, C. Distribution and potential of bioenergy resources from agricultural activities in Mexico. Renew. Sustain. Energy Rev. 2010, 14, 2147–2153. [Google Scholar] [CrossRef]
  21. Rios, M.; Kaltschmitt, M. Bioenergy potential in Mexico—Status and perspectives on a high spatial distribution. Biomass Convers. Biorefin. 2013, 3, 239–254. [Google Scholar] [CrossRef]
  22. Reyes-Muro, L.; Camacho-Villa, T.C.; Guevara-Hernández, F. Rastrojos: Manejo, Uso y Mercado en el Centro y Sur de México; INIFAP: Aguascalientes, Mexico, 2013; ISBN 978-607-37-0170-9. [Google Scholar]
  23. Borja-Bravo, M.; Reyes-Muro, L.; Espinosa-García, J.A.; Vélez-Izquierdo, A. Crop residues production and consumption in Mexico. In Rastrojos: Manejo, Uso y Mercado en el Centro y Sur de México; Reyes-Muro, L., Camacho-Villa, T.C., Guevara-Hernández, F., Eds.; INIFAP: Aguascalientes, Mexico, 2013; ISBN 978-607-37-0170-9. [Google Scholar]
  24. Aleman-Nava, G.S.; Meneses-Jácome, A.; Cárdenas-Chávez, D.L.; Díaz-Chávez, R.; Scarlat, N.; Dallemand, J.F.; Ornelas-Soto, N.; García-Arrazola, R.; Parra-Saldivar, R. Bioenergy in Mexico: Status and Perspective. Biofuels Biorefin. 2015, 9, 8–20. [Google Scholar] [CrossRef]
  25. Tauro, R.; Ghilardi, A.; García, C.A.; Masera, O. Recursos Biomásicos. In Estado del Arte de la Bioenergía en México; García, C.A., Masera, O., Eds.; Red Temática de Bioenergía (RTB) del Conacyt: Mexico City, Mexico, 2016; ISBN 978-607-8389-11-7. [Google Scholar]
  26. Sadhukhan, J.; Martinez-Hernandez, E.; Amezcua-Allieri, M.A.; Aburto, J.; Honorato-Salazar, J.A. Economic and environmental impact evaluation of various biomass feedstock for bioethanol production and correlation to lignocellulosic composition. Bioresour. Technol. Rep. 2019, 7, 100230. [Google Scholar] [CrossRef]
  27. Hernández, C.; Escamilla-Alvarado, C.; Sánchez, A.; Alarcón, E.; Ziarelli, F.; Musule, R.; Valdez-Vazquez, I. Wheat straw, corn stover, sugarcane, and agave biomasses: Chemical properties, availability, and cellulosic-bioethanol production potential in Mexico. Biofuels Bioprod. Biorefin. 2019, 13, 1143–1159. [Google Scholar] [CrossRef]
  28. Honorato-Salazar, J.A.; Sadhukhan, J. Annual biomass variation of agricultural crops and forestry residues, and seasonality of crop residues for energy production in Mexico. Food Bioprod. Process. 2020, 119, 1–19. [Google Scholar] [CrossRef]
  29. SIAP (Sistema de Información Agrolimentario y Pesquero). Atlas Agoalimentario, 2020; Secretaría de Agricultura, Ganadería y Desarrollo Rural, Gobierno de México: Mexico City, Mexico, 2021. [Google Scholar]
  30. SIACON-NG. Base de Datos de Secretaría de Agricultura, Ganadería y Desarrollo Rural; Gobierno de México: Mexico City, Mexico, 2021. [Google Scholar]
  31. Brechbill, S.C.; Tyner, W.E. The Economics of Biomass Collection, Transportation, and Supply to Indiana Cellulosic and Electric Utility Facilities; Working Paper #08-03; Department of Agricultural Economics, Purdue University: West Lafayette, IN, USA, 2008. [Google Scholar]
  32. INEGI (Instituto Nacional de Estadísticas y Geogrofía). Sistema de Cuentas Nacionales de México; Producto Interno Bruto por Entidad Federativa: Mexico City, Mexico, 2021.
  33. Padilla-Pérez, R.; Oddone, N. Manual para el Fortalecimiento de Cadenas de Valor; LC/MEX/L.1218; CEPAL-FIDA: Mexico City, Mexico, 2016. [Google Scholar]
  34. Smeets, E.; Faaij, A.; Lewandowski, I. A Quick Scan of Global Bio-Energy Potentials to 2050: An Analysis of the Regional Availability of Biomass Resources for Export in Relation to the Underlying Factors; Report NWS-E2004-109; Copernicus Institute, Department of Science, Technology and Society, Utrech University: Utrech, The Netherlands, 2004; ISBN 90-393-3909-0. [Google Scholar]
  35. Unkovich, M.; Baldock, J.; Forbes, M. Variability in Harvest Index of grain crops and potential significance for carbon accounting: Examples from Australian agriculture. In Advances in Agronomy; Sparks, D.L., Ed.; Academic Press: Burlington, VT, USA, 2010; Volume 105, pp. 173–219. [Google Scholar] [CrossRef]
  36. Johnson, J.M.; Wilhelm, W.W.; Karlen, D.L.; Archer, D.W.; Wienhold, B.J.; Lightle, D.T.; Laird, D.; Baker, J.; Ochsner, T.E.; Novak, J.M.; et al. Nutrient Removal as a Function of Corn Stover Cutting Height and Cob Harvest. Bio Energy Res. 2010, 3, 342–352. [Google Scholar] [CrossRef] [Green Version]
  37. Rosillo-Calle, F.; De Groot, P.; Hemstock, S.L.; Woods, J. (Eds.) Non-woody biomass and secondary fuels. In The Biomass Assessment Handbook; Earthscan: London, UK, 2007; ISNB-10 1-84407-285-1; ISBN-13 978-1-84407-285-9. [Google Scholar]
  38. Venugopal, P.D.; Coffey, P.L.; Dively, G.P.; Lamp, W.O. Adjacent Habitat Influence on Stick Bug (Hemiptera: Pentatomidae) Densities and the Associated Damage at Field Corn and Soybean Edges. PLoS ONE 2014, 9, e109917. [Google Scholar] [CrossRef]
  39. David, F.R.; David, F.R. Strategic Management. A Competitive Advantage Approach, Concepts and Cases, 6th ed.; Pearson Education: London, UK, 2017; ISBN-10 1-292-14849-7; ISBN-13 978-1-292-14849-6. [Google Scholar]
  40. Gupta, S.C.; Onstad, C.A.; Larson, W.E. Predicting the effects of tillage and crop residue management on soil erosion. J. Soil Water Conserv. 1979, 34, 77–79. [Google Scholar]
  41. Larson, W.E.; Swan, J.B.; Pierce, F.J. Agronomic implications of using crop residues for energy. In Agriculture as A Producer and Consumer of Energy; Lockertz, W., Ed.; Westview Press for the American Association for the Advancement of Science: Boulder, CO, USA, 1982; ISBN-13 978-0865313811; ISBN-10 0865313814. [Google Scholar]
  42. Stout, B.A. Handbook of Energy for World Agric; Elsevier Science: New York, NY, USA, 1990. [Google Scholar]
  43. Lal, R. The role of residue management in sustainable agricultural systems. J. Sustain. Agric. 1995, 5, 51–78. [Google Scholar] [CrossRef]
  44. Kartha, S.; Larson, E.D. Bioenergy primer. In Modernized Biomass Energy for Sustainable Development; United Nations Development Programmer: New York, NY, USA, 2000. [Google Scholar]
  45. Lang, B. Estimating the Nutrient Value in Corn and Soybean Stover. In Iowa State University Extension Fact Sheet BL-112; Iowa State University: Ames, IA, USA, 2002. [Google Scholar]
  46. Pordesimo, L.O.; Edens, W.C.; Sokhansanj, S. Distribution of Aboveground Biomass in Corn Stover. Biomass Bioenergy 2004, 26, 337–343. [Google Scholar] [CrossRef]
  47. Lal, R. World crop residues production and implications of its use as a biofuel. Environ. Int. 2005, 31, 575–584. [Google Scholar] [CrossRef] [PubMed]
  48. Johnson, J.M.; Allmaras, R.R.; Reicosky, D.C. Estimating Source Carbon from Crop Residues, Roots and Rhizo deposits Using the National Grain-Yield Database. Agron. J. 2006, 98, 622–636. [Google Scholar] [CrossRef] [Green Version]
  49. Wortmann, C.S.; Klein, R.N.; Shafiro, C.A. Harvesting crop residues. In NebGuide University of Nebraska—Lincoln Extension; G1846; Institute of Agriculture and Natural Resources: Lincoln, NE, USA, 2012. [Google Scholar]
  50. Thompson, J.L.; Tyner, W.E. Corn stover for bioenergy production: Cost estimates and farmer supply response. Biomass Bioenergy 2014, 62, 166–173. [Google Scholar] [CrossRef]
  51. IRENA (International Renewable Energy Agency). Global Bioenergy Supply and Demand Projections. A Working Paper for Remap 2030. 2014. Available online: www.irena.org/remap (accessed on 15 January 2022).
  52. Aldana, H.; Lozano, F.J.; Acevedo, J. Evaluating the potential for producing energy from agricultural residues in Mexico using MILP optimization. Biomass Bioenergy 2014, 67, 372–389. [Google Scholar] [CrossRef]
  53. Caballero-Salinas, J.C.; Moreno-Reséndez, A.; Reyes-Carrillo, J.L.; García-Valdez, J.S.; López-Baez, W.; Jiménez-Trujillo, J.A. Competencia del uso del rastrojo de maíz en sistemas agropecuarios mixtos en Chiapas. Rev. Mex. De Cienc. Agropecu. 2017, 8, 91–104. [Google Scholar] [CrossRef] [Green Version]
  54. Tauro, R.; García, C.A.; Skutsch, M.; Masera, O. The potential for sustainable biomass pellets in Mexico: An analysis of energy potential, logistic costs and market demand. Renew. Sustain. Energy Rev. 2018, 81, 380–389. [Google Scholar] [CrossRef]
  55. Lozano-García, D.F.; Santibañez-Aguilar, J.E.; Lozano, F.J.; Flores-Tlacuahuac, A. GIS-based modeling of residual biomass availability for energy and production in Mexico. Renew. Sustain. Energy Rev. 2020, 120, 109610. [Google Scholar] [CrossRef]
  56. Molina-Guerrero, C.E.; Sanchez, A.; Vázquez-Nuñez, E. Energy potential of agricultural residues generated in Mexico and their use for butanol and electricity production under a biorefinery configuration. Environ. Sci. Pollut. Res. 2020, 27, 28607–28622. [Google Scholar] [CrossRef]
  57. Bautista-Herrera, A.; Ortiz-Arango, F.; Álvarez-García, J. Profitability Using Second-Generation Bioethanol in Gasoline Produced in Mexico. Energy 2021, 14, 2294. [Google Scholar] [CrossRef]
  58. English, A.; Tyner, W.E.; Sesmero, J.; Owens, P.; Muth, D. Environmental Impacts of Stover Removal in the Corn Belt. In Proceedings of the Agricultural & Applied Economics Association’s 2012 AAEA Annual Meeting, Seattle, WA, USA, 12–14 August 2012. [Google Scholar]
  59. Blanco-Canqui, H.; Lal, R. Crop residue removal impacts on soil productivity and environmental quality. Crit. Rev. Plant Sci. 2009, 28, 139–163. [Google Scholar] [CrossRef]
  60. Blanco-Canqui, H. Crop residue removal for bioenergy reduces soil carbon pools: How can we offset carbon losses? Bioenergy Res. 2013, 6, 358–371. [Google Scholar] [CrossRef]
  61. Dam, R.F.; Mehdi, B.B.; Burgess, M.S.E.; Madramootoo, C.A.; Mehuys, G.R.; Callum, I.R. Soil bulk density and crop yield under eleven consecutive years of corn with different tillage and residue practices in a sandy loam soil in central Canada. Soil Tillage Res. 2005, 84, 41–53. [Google Scholar] [CrossRef]
  62. Fernandez, F. What is the Nutrient Value of Corn Stover Removal? Bull. Univ. Ill. 2007, 23. Available online: http://bulletin.ipm.illinois.edu/article.php?id=860 (accessed on 10 March 2022).
  63. Coulter, J.A.; Nafziger, E.D. Continuous Corn Response to Residue Management and Nitrogen Fertilization. Agron. J. 2008, 100, 1774–1780. [Google Scholar] [CrossRef]
  64. DeJong-Hughes, J.; Coulter, J. Considerations for Corn Residue Harvest in Minnesota; University of Minnesota: Minneapolis, MN, USA, 2009; Available online: http://www.extension.umn.edu/distribution/cropsystems/M1243.html (accessed on 25 January 2022).
  65. USDA-NRCS (United States Department of Agricultural—Natural Resources Conservation Service). Carbon to Nitrogen Ratios in Cropping Systems; In Cooperation with North Dakota NRCS; USDA-NRCS East National Technology Support Center: Greensboro, NC, USA, 2011. [Google Scholar]
  66. Schechinger, T.M.; Hettenhaus, J. Corn Stover Harvesting: Grower, Custom Operator, and Processor Issues and Answers; ORNL/SUB-04-4500008274-01; Oak Ridge National Laboratory: Oak Ridge, TN, USA, 2004. [Google Scholar]
  67. Nielsen, R.L. Questions Relative to Harvesting and Storing Corn Stover; WP, AGRY-95-09; Department of Agronomy, Purdue University: West Lafayette, IN, USA, 1995. [Google Scholar]
  68. Petrolia, D.R. The Economics of Harvesting and Transporting Corn Stover for Conversion to Fuel Ethanol: A Case Study for Minnesota; Staff Paper P06-12; Department of Applied Economics, University of Minnesota: Minneapolis, MN, USA, 2006. [Google Scholar]
  69. Fixen, P. Potential Biofuels Influence on Nutrient Use and Removal in the US. Better Crops 2007, 91, 12–14. [Google Scholar]
  70. Karlen, D.L.; Kovar, J.L.; Birrell, S.J. Corn stover nutrient removal estimates for Central Iowa, USA. Sustainability 2015, 7, 8621. [Google Scholar] [CrossRef] [Green Version]
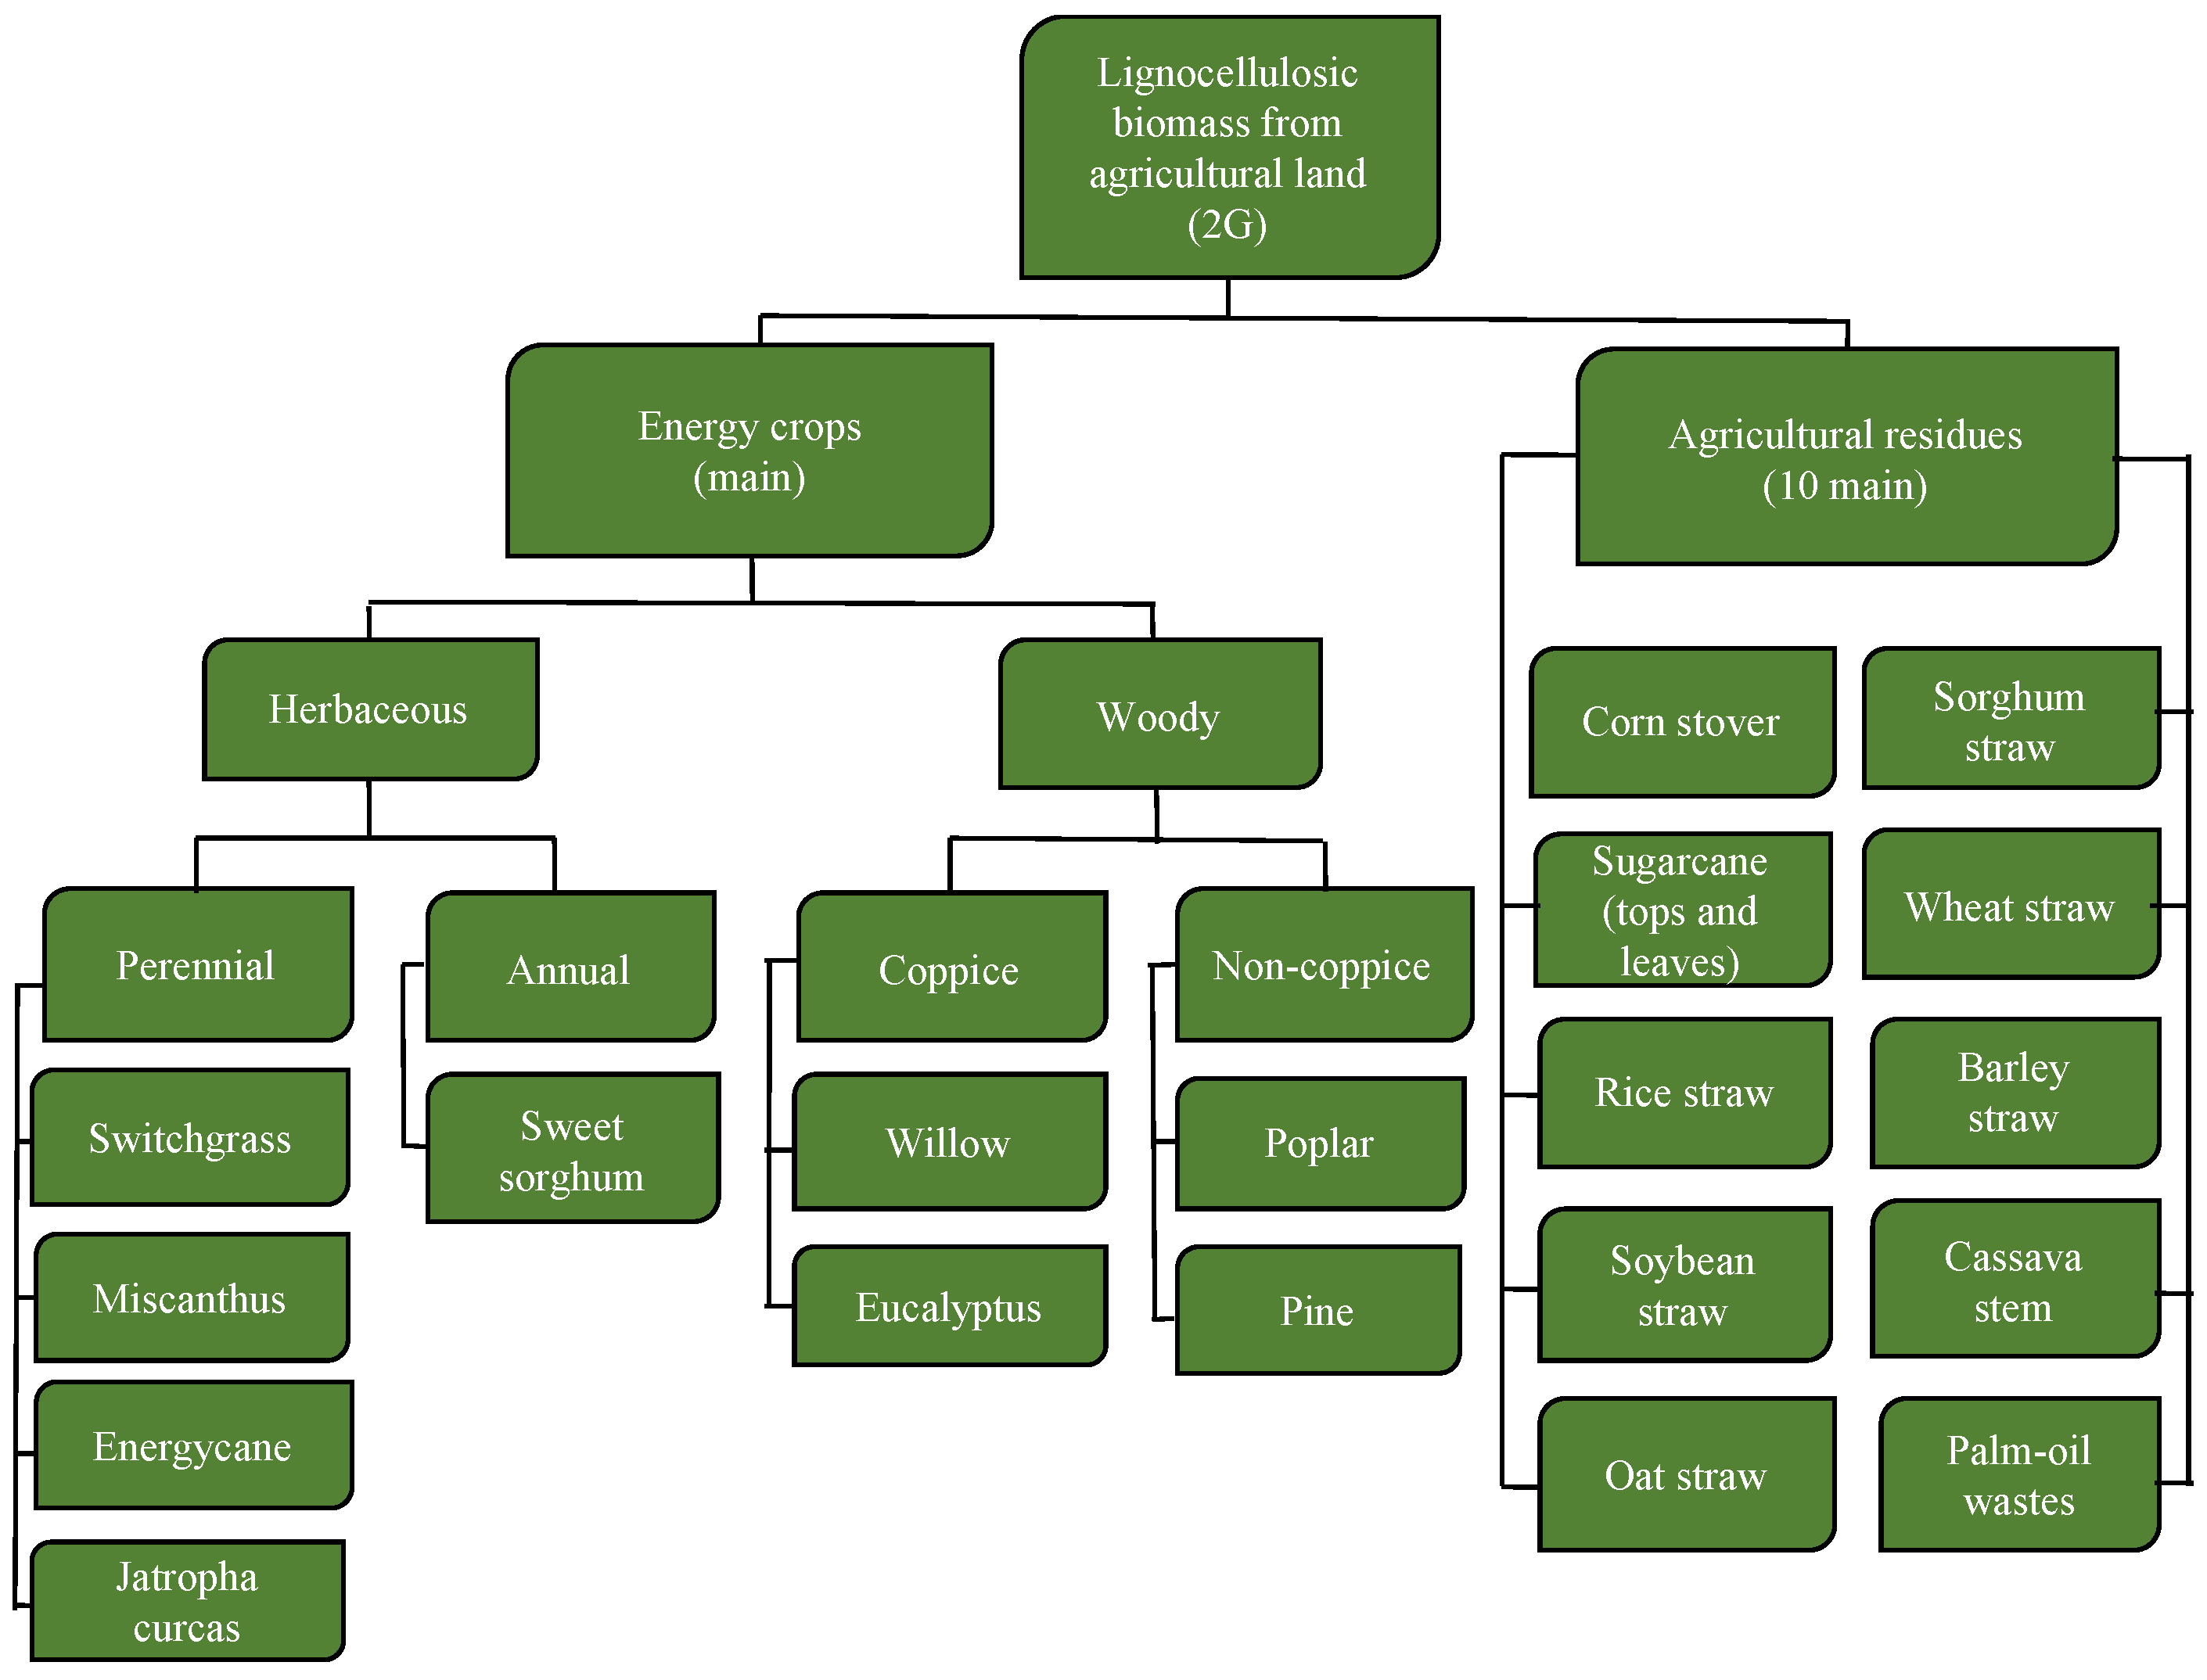
Figure 1. Classification of lignocellulosic biomass from agricultural land. Source: adapted from [9,10,11].
Energies 15 04480 g001
Figure 2. Agricultural residue logistics chain. It consists of 7 links with three minimum selling prices (MSPs) as output.
Energies 15 04480 g002
Figure 3. Cost structure of the agricultural residues chain: (a) link 1: management and investment; (b) link 2: harvest; (c) link 3: loading; (d) link 4a: transport (outsourced); (e) link 4b: transport (own); (f) link 5: unloading; (g) link 6: storage; (h) link 7: nutrients (replacement by stover collection); (i) logistic chain: all links added up. MSP: minimum selling price.
Energies 15 04480 g003
Figure 4. Costs per ton of corn stover, and sequentially added-up per link of the harvest chain.
Energies 15 04480 g004
Figure 5. Costs per bale of corn stover, and sequentially added-up per link of the harvest chain.
Energies 15 04480 g005
Table 1. Mexico’s agricultural regions, according to planted area and primary GDP.
RankingRegionPlanted Area (Irrigated Hectares, Annual Average 2016–2020)Share among Regions ConsideredPrimary GDP (Share, 2019)Main Crops (%)
1Sinaloa853,47620.1%8.0%corn (65%), bean (10%)
2Sonora479,91211.3%6.3%wheat (53%), corn (12%)
3Guanajuato431,90210.2%4.6%corn (31%), sorghum (21%)
4Chihuahua364,6798.6%6.5%corn (36%), cotton (29%)
5Tamaulipas341,4708.0%2.4%sorghum (63%), corn (28%)
6Michoacán255,8276.0%10.4%corn (50%), wheat (17%)
7Jalisco168,6044.0%13.3%fodder corn (27%), corn (25%)
8Zacatecas135,2333.2%2.2%corn (22%), dry chili (21%)
9Durango127,5233.0%3.0%fodder corn (34%), corn (23%)
10Puebla127,4043.0%3.5%corn (36%), ear of corn (13%)
11México124,1492.9%3.1%corn (63%), fodder oat (13%)
12Baja Ca.121,1352.9%2.8%wheat (38%), cotton (19%)
13Rest717,49716.9%34%
Total4,248,810100.0%100%
Source: own elaboration with data from [30,32].
Table 2. Geographic locations of irrigated corn in Mexico.
RankingRegionAnnual Production (ton, 2020)Individual ShareAccumulated Share
1Sinaloa6,204,81546%46%
2Guanajuato1,380,26010%56%
3Chihuahua1,226,8039%65%
4Michoacán930,6247%72%
5Sonora633,9715%77%
6Tamaulipas520,8074%81%
Rest2,668,82719%100%
Total13,566,107--
Source: own elaboration with data of [30].
Table 3. Harvest index (HI) and crop residue index (CRI) of corn stover.
Harvest Index (HI)Crop Residue Index (CRI)Applied onReference
0.401.50GlobalGupta et al., 1979 [40]
0.650.55GlobalLarson et al., 1982 [41]
0.650.55GlobalStout, 1990 [42]
0.401.50USALal, 1995 [43]
0.401.50GlobalKartha and Larson, 2000 [44]
0.501.00USALang, 2002 [45]
0.560.80USAPordesimo et al., 2004 [46]
0.401.50USALal, 2005 [47]
0.530.89USAJohnson et al., 2006 [48]
0.401.50MexicoValdez-Vazquez et al., 2010 [20]
0.510.98USAWortmann et al., 2012 [49]
0.461.20MexicoBorja-Bravo et al., 2013 [23]
0.501.00MexicoRios and Kaltschmitt, 2013 [21]
0.510.95USAThompson and Tyner, 2014 [50]
0.401.50118 CountriesIRENA, 2014 [51]
0.501.00MexicoAldana et al., 2014 [52]
0.481.10MexicoCaballero-Salinas et al., 2017 [53]
0.401.50MexicoTauro et al., 2018 [54]
0.560.80MexicoHernández et al., 2019 [27]
0.421.41MexicoHonorato-Salazar; Sadhukhan; 2020 [28]
0.550.83MexicoLozano-García et al., 2020 [55]
0.332.00MexicoMolina-Guerrero et al., 2020 [56]
0.550.82MexicoBautista-Herrera et al., 2021 [57]
0.481.15 Average
0.451.21MexicoThis investigation
Note: HI = harvested product/total above-ground biomass; CRI = (1/HI) − 1. SD of 0.08 (HI) and 0.37 (CRI). A CRI of 0.15 was estimated for cobs.
Table 4. Suggested additional nutrients by corn stover collected (Kg/ton).
Nitrogen (N)Phosphorus (P2O5)Potassium (K2O)Source
3.215.9Schechinger; Hettenhaus, 2004 [66]
6.82.711.3Lang, 2002 [45]
6.21.68.9Nielsen, 1995 [67]
2.815.0Petrolia, 2006 [68]
8.62.614.5Fixen, 2007 [69]
6.50.67.6Karlen et al., 2015 [70]
7.02.212.2Average
Note: The most widely used sources are anhydrous ammonia for nitrogen, monoammonium phosphates (MAP) for phosphorus, and potassium chloride (KCI) for potassium.
Table 5. Total costs of the corn stover logistic chain.
LinkTotal Costs
$USD/tonShare (%)$USD/baleShare (%)$USD/haShare (%)
1. Management and Investment$3.026%$1.516%$13.586%
2. Harvest$12.9127%$6.4527%$58.0927%
3. Loading$1.062%$0.532%$4.762%
4. Transport$9.5520%$4.7720%$42.9720%
5. Unloading$1.954%$0.984%$8.784%
6. Storage$2.676%$1.336%$12.006%
7. Nutrients$16.9935%$8.4935%$76.4335%
MCSSP 3$48.14100%$24.07100%$216.62100%
Table 6. Estimates of the three price options for agricultural residues in Mexico.
Corn Stover Prices for Cellulosic Ethanol (USD/ton)
MCSSP 1 (up to link 5)$28.49
MCSSP 2 (up to link 6)$31.15
MCSSP 3 (up to link 7)$48.14
Publisher’s Note: MDPI stays neutral with regard to jurisdictional claims in published maps and institutional affiliations.