1. Introduction
In a dual fuel engine, fuel with a high octane number, which in the case of our tests was natural gas (NG), is fed into the combustion chamber of the engine first, along with the air supplied to the cylinder. After reaching a sufficiently high pressure and temperature, resulting from the compression of the gas-air mixture, a second fuel is injected into the combustion chamber which has good self-ignition properties allowing it to initiate self-ignition of the injected fuel. In the presented research, the high cetane number autoignition initiating fuel was classic diesel fuel commonly used in single-fuel diesel engines. Such a combination is the most popular way of powering “dual-fuel” compression ignition (CI) engines due to the possibility of achieving a very high degree of replacement of diesel fuel by natural gas, the use of which is supported by the cost and ecological aspects and the uncomplicated modification of the engine installation [
1].
The degree of substitution in dual-fuel engines is defined as the ratio of the amount of high-octane fuel consumed to the total amount of fuel consumed by the engine. The diesel/CNG compressed natural gas power supply system used in the research determined the degree of mass replacement in this way. The ratio is expressed as the ratio of the amount of energy supplied to the engine in the form of high-octane fuel, in our case, CNG, to the total amount of energy contained in the fuel supplied to the single-fueled engine. In simple terms, it is also assumed to be the ratio of the amount of energy supplied to the engine in the form of high-octane fuel to the total amount of energy that is supplied at a given point of operation in the form of two fuels—the results in the case of both methods of calculation will be identical when the efficiency of the engine in both cases (mono-fuel and dual fuel power) does not change. This relationship can easily be calculated by relying only on the hourly fuel consumption based on the change in the consumption of diesel (or other high-cetane fuel) alone at the operating point where the substitution is measured and calculated. This can be done on the basis of Formula 1 below, without knowing the calorific value of the fuels used [
2]:
—hourly consumption of diesel fuel when running only on diesel oil,
—hourly diesel fuel consumption when running on CNG/diesel.
In the case of the controller that was used in our research, the degree of replacement was calculated from a relation based on the mass fuel consumption of the engine, in which the calorific ratio of one fuel to another was expressed by the coefficient set by the operator at the beginning of the tests. The value of the adopted ratio was diesel/CNG 1:1.1 [
2].
The degree of replacement of diesel fuel by natural gas (CNG) in a dual fuel engine depends on a number of factors, but the most important limitation that does not allow a high degree of replacement of diesel fuel by substitute fuel is the appearance of knock combustion and the expenditure of the CNG power supply installation. On the basis of research by many authors [
3,
4,
5], an approximate diagram based on [
6] has been developed, and is shown in
Figure 1 schematically showing the possibilities of substitution of diesel by natural gas in dual fuel engines according to [
7].
As part of the dual fuel supply, various fuels can be used, but the greatest number of advantages is characterized by compressed or liquefied natural gas. It is possible to co-burn diesel fuel in diesel autoignition engines together with a mixture of propane and butane gases, high-octane biofuels, or with gasoline. However, at the current level of technology in widespread use, such installations only achieve a partial, relatively small replacement of diesel fuel by these fuels. Diesel oil in classic installations of this type constitutes not less than half of the energy value of the fuel supplied for combustion. Depending on the source of information, it is possible to achieve a different replacement ratio with liquefied petroleum gas (LPG) fuel, but most often it does not exceed 30% [
8]. However, in the case of using natural gas combined with diesel oil, which is the main research goal of this work, it already allows for a significant reduction in the operating costs of the engine and ecological improvement. The exchange ratio of diesel with natural gas is usually much higher than in the case of gasoline, biofuels, LPG or alcohols, mainly due to the much higher resistance of methane to knock combustion and its higher calorific value [
9]. The same applies to the use of natural gas in liquid form, which has some additional advantages over its use in compressed form. These advantages relate to a large extent to the operation of the vehicle in which the installation of this type was placed, but also the possibility of direct injection of this fuel straight into the combustion chamber under high pressure. In the case of the gas combustion process, it may be more efficient if an appropriate fuel installation is used in which high gas pressure [
10] or the physical state in which it is located [
11] is used. The first installations of this type already exist in the world and are used both in motor vehicles [
12] and in marine engines [
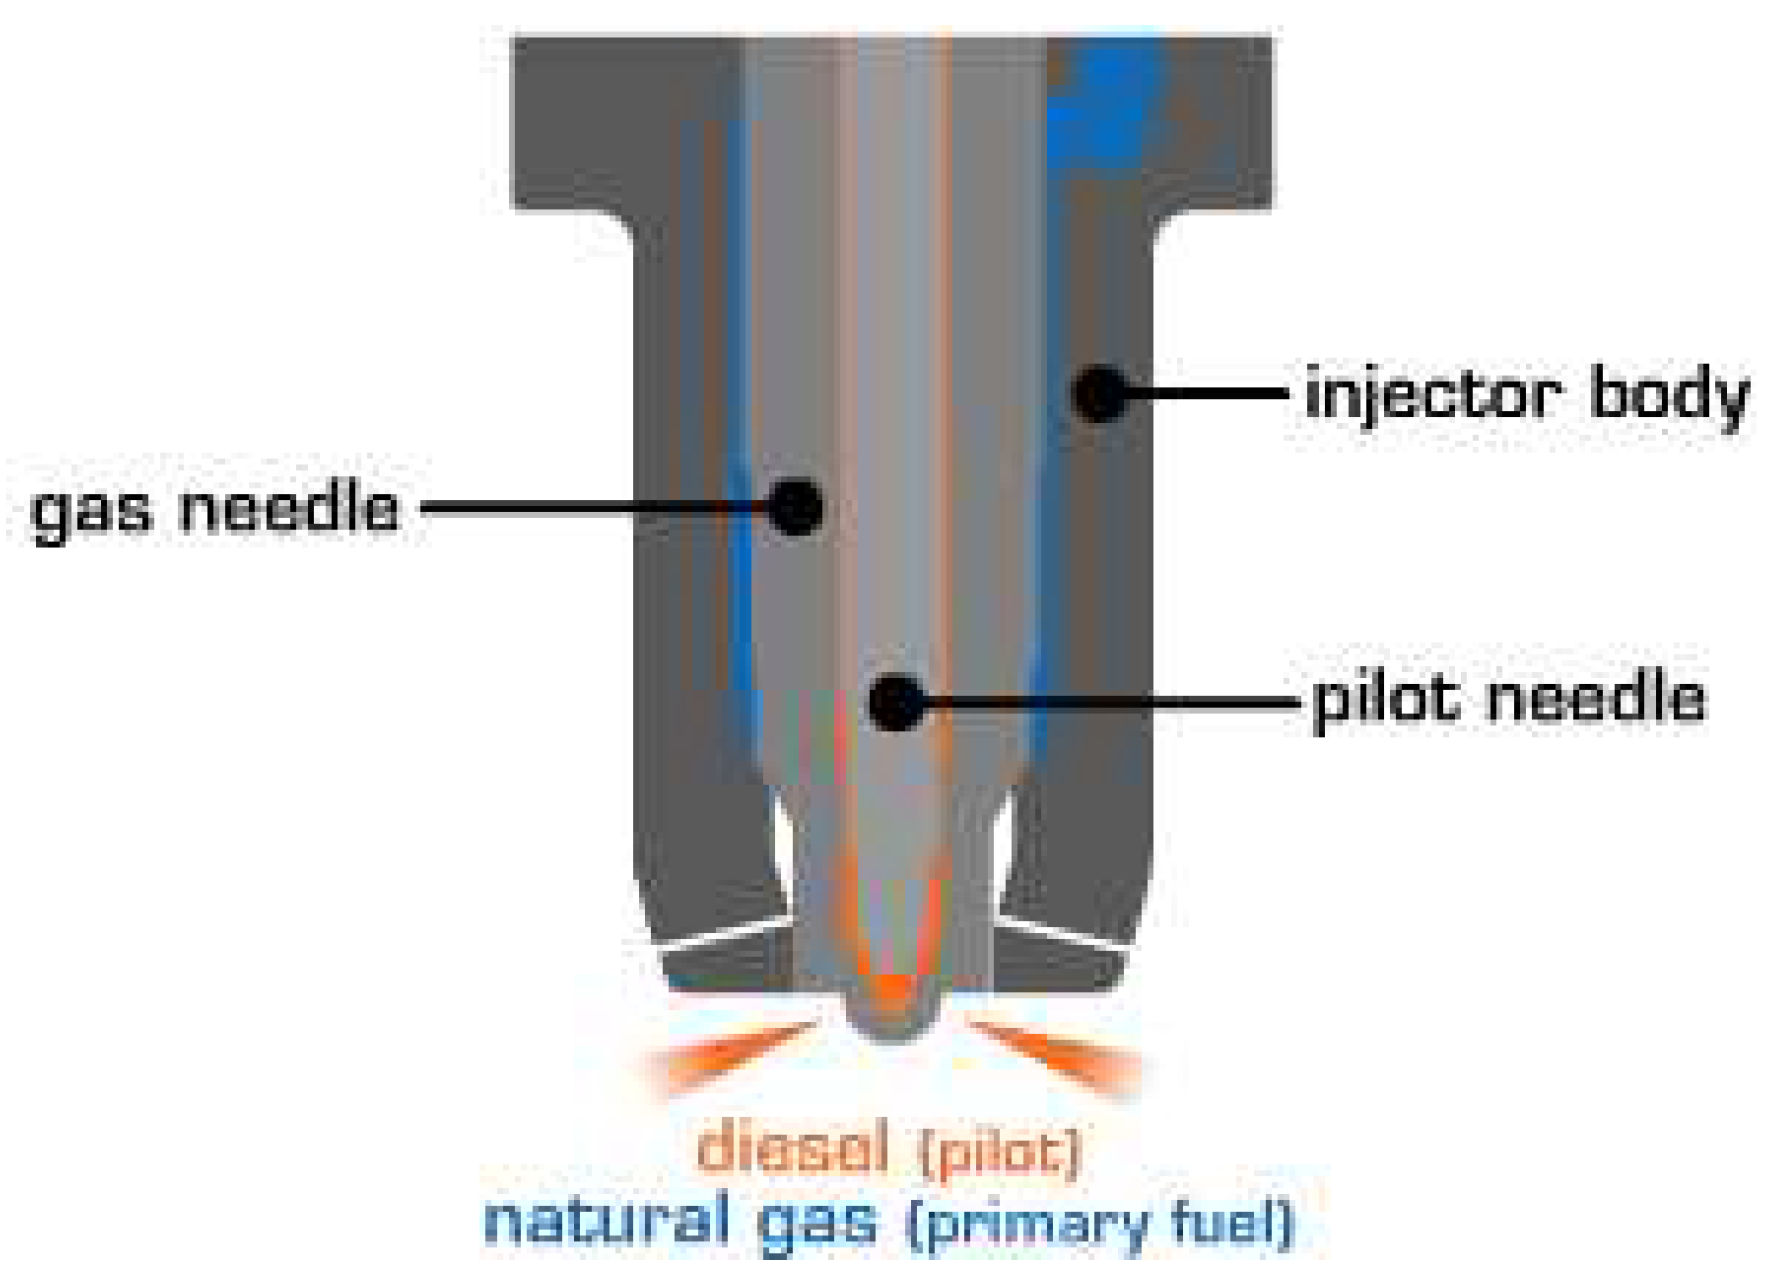
13]. Although they are not yet widely available solutions, intensive work is being carried out on their dissemination and further development. The biggest advantage of dual fuel engines is the combination of many advantages of CI and SI engines. There are a few ways to supply fuel to those engines and the two most important differ in the place of delivery of gaseous fuel [
14]. The specificity of dual fuel power supply with direct injection of both fuels by one injector is shown in the schematic drawing of the injector in
Figure 2.
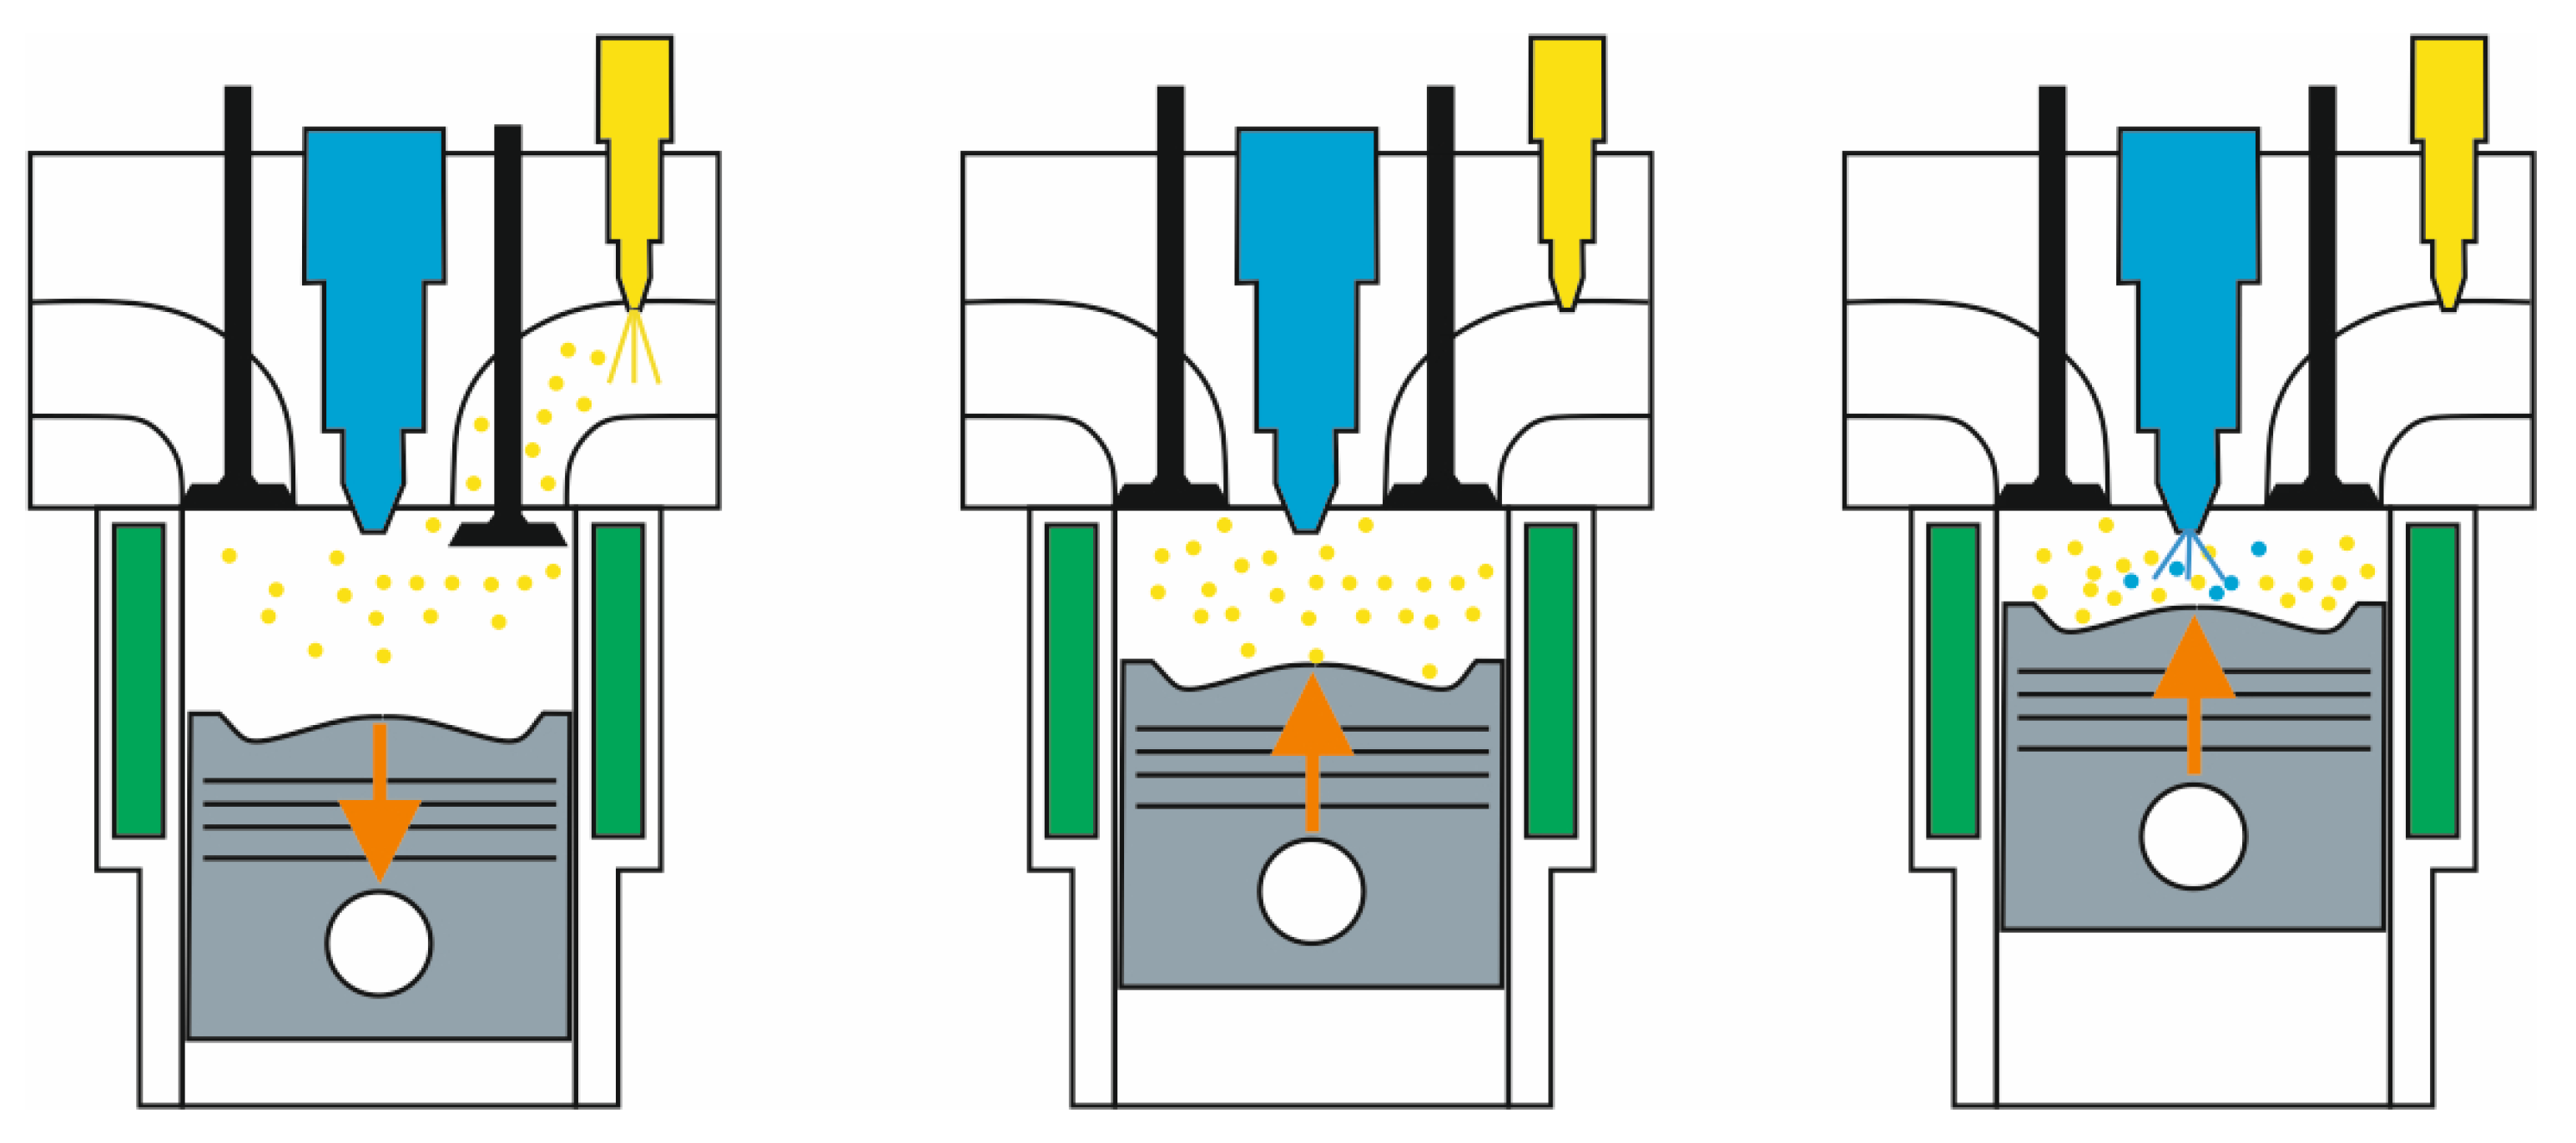
This type of injector is developed especially for dual fuel engines working in diesel/CNG mode. This type of fuel supply is still very rare. A much more popular type of fuel supply is indirect injection of CNG and direct injection of diesel fuel. That was the type of supply researchers used in their project. A schematic drawing of an engine at work with this type of fueling is shown in
Figure 3.
The type of fueling shown in the
Figure 3 is much more common, simpler and well-researched, and is a much more popular way to make a dual fuel engine from a diesel CI engine. In dual fuel engines, during operation the injected liquid fuel is dosed into the combustion chamber in the form of a pilot dose, initiating the ignition of the fuel already supplied to the combustion chamber under the effect of a steady increase in pressure resulting from self-ignition of the injected high-cetane fuel.
Figure 4 below shows a schematic view of the method of supply and ignition in a dual fuel engine powered by a mixture of CNG and diesel oil.
An engine fueled by dual fuel CNG and diesel oil requires, for standard work mode, only the already mentioned, pilot dose of diesel fuel to initiate the ignition. When using LPG as an additional fuel, it is necessary to use a greater amount of injected diesel fuel than in the case of natural gas, due to the insufficient resistance of the additional gaseous fuel to knocking combustion, which is dangerous due to the possibility of engine damage. Its presence determines the possibility of using fuel in the engine and the degree of replacement of the basic fuel, which is diesel fuel in a dual fuel CI engine. Highly loaded dual fuel engines operate under conditions that make it impossible to replace as much chemical energy contained in high-cetane number fuel, as is possible at low loads There is a lower ratio of replacement at such operating points due to the need to use more high-cetane number fuel with a higher energy density than gaseous fuels.
The sense of using natural gas in CI engines results not only from the physicochemical properties allowing its effective use in such engines, but also the ecological and economic impact that this fuel could have on the industry based on the traditional piston internal combustion (IC) engine. Along with the development of civilization and the increase in consumerism, the demand for the transport of goods using wheeled vehicles will increase, especially in increasingly crowded cities where people have to deal with the negative health effects caused by pollution from the growing number of trucks [
17,
18]. It is estimated that in Poland alone, about 50,000 people die every year due to poor air quality, or even twice as many taking into account the percentage of deaths in Europe caused by exposure to fine particulate matter (PM 1.0 and PM 2.5) resulting from the combustion of fossil fuels for populations aged >14 years [
19,
20]. The use of a low-emission alternative fuel instead of the coal and diesel fuel commonly used in Poland could contribute to avoiding these deaths, which is why research is currently placing so much emphasis on the use of natural gas to power thermal machines.
Public transport can offer a more rational use of energy [
21] as it reduces fuel consumption, exhaust emissions and vehicle noise [
22,
23,
24]. The concept of sustainable transport combines high-quality transport with care for the natural environment [
25]. Therefore, these vehicles should have a power source other than diesel or gasoline and reducing carbon dioxide (CO
2) emissions can help limit the development of global warming in the world.
An example of such activities may be the increasing restrictiveness of requirements for products created during the combustion of a fuel mixture. Their implementation means that, for example, even relatively new semi-trucks (5 years old) are classified as polluting and their use is charged with additional fees. This forces vehicle manufacturers to look for technical solutions that reduce the emission of harmful exhaust components. The obvious path of development seems to be the construction of trucks with hybrid or only electric drive. However, in this case, the range remains a limitation, which for an electric car of average payload (“N2”) is currently about 200 km, while for a tractor unit with a semi-trailer (“N3”) it is, according to available data, only 100 km [
26]. In addition, the price of an electric tractor unit in 2021 was five times the price of the same conventionally powered tractor unit (based on the example of DAF and Volvo cars). In addition, increasing the weight of the semi-truck as a result of the usage of batteries that are still very heavy, reduces the weight of the load that can be transported, and the charging process is time-consuming. Both of these factors have a very negative impact on the logistical costs of using such a vehicle [
27]. Therefore, a good direction of change is still the introduction of more environmentally friendly solutions into transport, mainly through the use of alternative and ecological fuels in relation to diesel, including natural gas in various forms: compressed natural gas and Liquid Natural Gas (LNG) and its ecologically produced varieties Renewable Natural Gas—RNG, BioCNG, or eCNG and natural gas enriched with hydrogen fuel—HCNG, or H2CNG. Many fuels can be used as high-cetane fuel, the properties of which do not differ significantly from those of diesel oil. Very promising are the possibilities of using, together with ecological gaseous fuels, also ecological, alternative fuels replacing diesel oil in this case, such as oil made of algae [
28], rice [
29], pongamia, palm, peanuts, mushrooms, jatrophy, coffee grounds, soybean, coconut, linseed, olives or even animal fat, which the authors described in detail in [
30]. Also, a gas used as a fuel corresponding to the properties of natural gas can be produced in many ways and has great potential as a clean alternative fuel for additional reduction of GHG emissions in the process of its combustion or production [
29]. Such a gas can be produced under the same conditions as bio-oil from many plant and animal products [
30] or waste [
31] and individual final products will differ mainly in the concentration of methane and other components of this fuel.
Combustion of natural gas, due to its different composition compared to diesel oil, with a lower proportion of carbon and a greater proportion of hydrogen, results in lower emissions of carbon dioxide, which is one of the main greenhouse gases emitted by human activity. In the short and medium term, natural gas may become the most important alternative fuel [
32]. Its large global resources increase the potential of this fuel as a green fuel used in transport. Many European countries have a well-developed infrastructure adapted for the reception and distribution of CNG and LNG. Natural gas can also be a relatively cheap fuel compared to diesel oil. In 2020, the average price of natural gas accounted for approx. 50% of the diesel oil price. The average cost of using natural gas to transport heavy goods vehicles is approx. 40% lower than that of diesel fuel [
33].
The properties of natural gas (in particular in the form of compressed CNG) in terms of the use of IC piston engines in transport or in utility vehicles, as well as the growing number of supply sources in individual European countries justify undertaking scientific, research and development works on the use of CNG to supply the IC engines of heavy-duty vehicles. This is in line with the energy policy of the European Union—Directive 2009/33/EC of 23 April 2009 on the promotion of ecologically clean and energy-efficient road transport vehicles. The presented work is an example of such activities and describes the effects of the application of an innovative concept of effective adaptation of an engine of a utility vehicle to a CNG supply.
2. Materials and Methods
The aim of the study was to experimentally determine the impact of the exchange ratio (diesel/CNG), defined by Equation (1), of the replacement fuel, which was CNG, to the base fuel, which was diesel oil, for an innovative non-factory two-fuel CNG/diesel fuel supply installation in a used tractor unit engine on the emissions of individual exhaust components: carbon dioxide (CO2), carbon monoxide (CO), nitric oxide (NO), nitrogen dioxide (NO2), methane (CH4), ethane (C2H6), non-methane hydrocarbons(NMHC), ammonia (NH3) and smoke in fixed operating states.
“The tests and calculations were carried out for the D13C460 EU5EEV (338 kW) engine, used in Volvo FH13 series tractor units. The mileage of the car, the unit of which was tested on an engine dynamometer and on which a non-factory diesel/CNG installation was adapted, was 790,500 km. The total operating time of the engine is 11,800 h, and the engine has used 229,100 L of diesel fuel since the beginning of its operation. The tested engine, according to the approval documents, met the requirements of the EURO V standard when it left the factory” wrote the authors in [
33]. As a part of our research, the engine operation points were determined on the basis of good engineering judgment and as equivalents of the operating points in which ISO 8178 [
34] tests are carried out. In many cases found in the literature, the research program is prepared with the use of certain algorithms [
28,
31,
35] however, the authors’ experience shows that this type of methodology is not fully effective in the areas in which the authors of this work operate. The research presented in the paper is an investigation of an innovative, high-pressure dual fFuel installation. The planned tests were divided into the following stages:
Determination of external and load characteristics of the D13C460 engine when supplying the basic fuel, which was diesel fuel, in order to assess its technical condition.
Installing a dual fuel supply system on the engine.
Carrying out research into the impact of the diesel/CNG replacement ratio in the range from 10% to the knocking limit at selected engine operating points—the condition for “tuning the CNG supply system” was to obtain the same useful power during supply (diesel/CNG) as during supply of the basic fuel, which was diesel oil.
On the basis of the obtained test results, the impact of the replacement factor (diesel/CNG) on the concentration of toxic exhaust gas components at selected test points was assessed.
The tests were carried out on a standard dynamometric stand. The engine was loaded with a Zöllner PS1-3812/AE water brake with a maximum braking power of 1250 kW. The torque generated by the motor was measured using a strain gauge. The rotational speed was measured by an impulse transducer in cooperation with a gear which was located on the collar of the dynamometer. Measurement of liquid fuel consumption was carried out with the use of a fuel scale by AVL, measuring at a frequency of 5 s, and the temperature of the cooling liquid was maintained in the range of 87–92 °C using an external heat exchanger. The smoke opacity was tested with an AVL 439 OPACIMETER, which operated on the principle of light absorption—measuring the extinction coefficient of the absorbed radiation. The composition of the exhaust gases was measured with the use of an AtmosFIRt analyzer, working on a hot sample of 180 °C, using the method of infrared spectroscopy using the Fourier transform (FTIR) method with an oxygen analyzer installed in the measuring chamber using the zirconium cell method. In the configuration used, the device allowed the measurement of the following components: CO2, CO, NO, NO2, CH4, C2H6, NMHC and NH3. The measurement results were automatically converted to normal conditions (101,325 Pa, 273.15 K = 0 °C). The spectral range of the analyzer was 485–8500 cm−1. The ambient conditions were determined using the ABB SensyMaster FMT430 air flow meter, which was also used to determine the amount of air sucked in by the engine.
The temperature of the exhaust gases was measured using a NiCr-NiAl thermocouple installed in the exhaust manifold with a measuring range from −200 °C to 1200 °C. Selected engine parameters, measured by standard sensors mounted on the engine, were read from the engine controller using a Texa Navigator diagnoscope. These were defined as:
The tests were carried out while keeping the thermal state of the engine approximately constant, controlled with the use of an air heat exchanger (cooling tower) and a cooling liquid circulation system. During the tests, the temperature of the cooling liquid and engine oil was within 81–96 °C.
Measurements of individual quantities were carried out under the specified engine operating conditions when the force on the brake and the engine rotational speed were constant for at least 1 min. During the measurements, a constant engine speed was automatically maintained (range n = constant water brake operation).
Measurements of fuel consumption (from which the value of hourly fuel consumption was obtained) were carried out for each measuring point during approx. 1 min. Measurement of other quantities (brake force, ambient temperature, ambient pressure, ambient relative humidity, exhaust temperature and smoke (light absorption coefficient), air consumption by the engine and exhaust gas analysis was carried out simultaneously after establishing the test conditions.
The following parameters of the engine operation and the engine’s intake system were measured directly:
engine torque, Mo [N·m]
engine speed, n [rpm],
hourly fuel consumption diesel oil, GeON [kg/h],
hourly fuel consumption CNG, GeCNG [kg/h],
hourly air consumption, Gp [kg/h],
temperature in individual engine systems T [°C],
smoke D [m−1],
Concentration of gaseous components in exhaust gases: CO2, CO, NO, NO2, CH4, C2H6, NMHC and NH3,
On the basis of the quantities measured in a direct way, the quantities measured indirectly were determined:
On the basis of the directly measured quantities, the values measured indirectly were determined:
The value of the useful power of the engine was determined on the basis of the value of the loading torque realized by the brake and was determined from the dependencies:
where:
n is rotational speed in rpm,
Ne is engine useful power in kW,
Mo is engine loading torque (rotational) read from the brake controller in Nm,
Kd1 is correction factor for normal conditions determined in accordance with the PN-ISO 15550: 2009 standard.
Determination of the engine power value and knowledge of the concentration of harmful exhaust components allowed us to determine the emissions of a given exhaust component at a specific point of engine operation. For all results, the uncertainties of the measurement results were calculated, taking into account the possibility of both systematic and random errors. Systematic errors of direct measurements were determined on the basis of the accuracy class of the measuring instruments or on the basis of an elementary division on a scale. Errors of the value determined indirectly (from mathematical dependencies) were calculated after determining the size of systematic error Δ
xi (where
i = 1, 2, 3, …,
k) values of measurements of quantities measured directly as the maximum error Δy from the general dependence in the form [
36]:
The values of systematic errors of the measured quantities are presented in
Table 1.
Control of the engine load, as well as its rotational speed, was carried out from the control and measurement cabin. In this cabin there is a cabinet on which instruments are mounted to control the brake load and to control the servo. In this cabinet there are also engine speed indicators, as well as an indicator for measuring the temperature of individual systems.
During the tests, the operation of the engine was constantly controlled by the use of the NAVIGATOR TXTs diagnostic interface with the IDC 5 TRUCK software. A diagram of the test bench is shown on a
Figure 5.
Tests and results of useful measurements of the engine have been reduced to normal conditions in accordance with PN-ISO 15550:2009—Reciprocating IC engines—Determination and method of measuring engine power—General requirements [
36], which recommends correcting the engine power according to ambient conditions by multiplying the value determined directly by the calculated correction factors.
Methodology for Determining the Effect of the CNG/ON Substitution Factor on Engine Performance
The beginning of the test was to determine the external characteristics and load characteristics of the D13C460 engine. The tests were carried out on a dynamometer station located in the Department of Engines and Operation Engineering of the Military University of Technology in Warsaw. For supplying the engine commercial diesel fuel was used. This diesel fuel was from one production batch and was used during all tests. As a result of these activities, measuring points were designated to carry out further work.
Then, an original gas supply system was installed on the engine, allowing us to bring two types of fuel to the combustion chambers—diesel and CNG. The installation consists of a gas supply rail mounted between the engine head and the intake manifold. Gas injectors were installed in the rail, 2 per cylinder and the working pressure of the CNG gas used was 0.8 MPa. The installation works on the principle of shortening the time of injection of the basic fuel, which was diesel oil in proportion to the set coefficient of replacement of diesel fuel by natural gas.
In the course of adaptation activities, the installation was subjected to an optimization process, in which the main criterion was to determine the optimal angle of advancement of CNG gas fuel injection for different rotational speeds and engine loads relative to the position of the crankshaft at which the piston TDC (top dead center) occurs.
Subsequently, for such an optimized installation, studies were carried out on the impact of the coefficient of replacement of mass diesel fuel by natural gas on smoke and exhaust gas composition. The test was carried out in selected engine operating states corresponding to the most commonly used engine operating conditions when performing a road transport task. In the individual operating states selected by our team, the ratio of diesel to natural gas exchange was changed in leaps and bounds, with a jump of 10%, starting from 10% of replacement, up to the knock combustion. At each point of the engine’s operation, the amount of gas supplied was corrected using the CNG controller in such a way that the power developed by the engine was the same as the engine power obtained when running on the basic fuel, which was diesel oil. The assumed conversion rate of diesel to natural gas was set using a computer controlling the operation of the CNG installation, and the obtained exchange rate was determined on the basis of changes in the hourly consumption of the basic fuel. The research was carried out until the exchange ratio was achieved at which point the signal level from the knock combustion measurement system exceeded the level of 2.
During the tests, commercial diesel from one production batch in accordance with en-590 was used, due to the fact that the normative document [
36] allows the use of a fuel similar to the reference fuel in a situation where the appropriate reference fuel is not available. The advantage of choosing this method of proceeding is to determine the actual values of the engine’s operating characteristics with fuel of a random composition (random petrol station). It was remembered to reduce the impact of fuel properties on the result of comparative tests as much as possible, so for all tests, diesel fuel from one delivery was used.
The measurements were made using the prepared research version of the CNG dosing controller in which the optimal individual control functions were determined and control maps were developed.
The results of the research were illustrated by comparing them in subsequent drawings to changes in the concentration of the components of individual gaseous components, i.e., smoke as a coefficient of extinction of absorbed radiation (Figure 10), CO and CO
2 (Figures 11 and 12), NO and NO
2 (Figures 13 and 14), and CH
4 (Figure 15). To facilitate the analysis process and to quantify the changes taking place, the results are also included in a relative way, comparing those obtained for diesel/CNG power supply with only On power supply (right side of drawings). The concentration of individual gaseous components and smoke opacity were determined directly at the exit of the engine, before the exhaust after-treatment systems, so as to eliminate the result of the exhaust gas neutralization systems. As part of the verification of the technical condition of the engine, the external characteristics of the Volvo D13C460 engine used in the Volvo FH13 car were measured, determined when it was powered by diesel, and presented and compared with the original characteristics as shown in
Figure 6.
Then, on the basis of the analysis of the course of useful (effective) power and torque of this engine, research engine operating states were developed in which the impact of the degree of diesel/CNG replacement on the concentration of exhaust gas components was assessed. The designated external characteristics indicate that the engine develops a maximum torque of about 2300 Nm in the speed range of 1000–1500 rpm, and a maximum value of useful power of about 338 kW (460 hp) in the speed range of 1400–1900 rpm. Above an engine speed of 1500 rpm, the torque decreases sharply and reaches a value of about 1700 Nm at a speed of about 1900 rpm, above which the useful power of the engine decreases. Analysis of the course of useful power and torque and the operating conditions of the vehicle from which the engine came showed that the range of economical, operational engine speed is approx. 1100–1500 rpm. In this range, the engine develops a constant (approximately) maximum torque, and at the same time increases (as the rotational speed increases) its useful power.
In order to influence the supply of the engine with different proportions of diesel/CNG to determine the optimal proportion of fuel supply with the CNG/diesel mixture (percentage replacement of diesel oil with compressed natural gas), a test program was developed taking into account the above-mentioned results of the analysis of the external characteristics of the engine powered by diesel fuel. The scope of research was limited to determining the effective parameters of the engine in the most economical operating speed range, 1100–1500 rpm. In this respect, the basic engine operating parameters were measured at the dynamometer for three speed values (1100 rpm, 1300 rpm, 1500 rpm) at a constant value of loading torque.
The tests were carried out:
at a constant engine speed of 1100 rpm for two load torque values—approx. 520 Nm (61 kW) and 1150 Nm (139 kW);
at a constant engine speed of 1300 rpm for two load torque values—approx. 480 Nm (67 kW) and 980 Nm (134 kW);
at a constant approximately variable engine speed of 1500 rpm for two load torque values—approx. 500 Nm (79 kW) and 1040 Nm (163 kW).
For each engine speed and the value of (loading) torque, tests were performed for different proportions of the diesel/CNG fuel supply—from diesel only (replacement rate 0%) to the size of the replacement, at which, under the given measurement conditions, the occurrence of detonation combustion was recorded by means of a sensor attached to the engine block.
3. Results
The graphs showing the results of the research were divided according to the measured parameter. Each of the graphs presents the results for all six operating states in which the engine was tested. In each of the engine operating states, the engine speed and load were strictly determined, while the degree of replacement of diesel fuel with natural gas was variable. The test results are presented in graphs. The value of the degree of replacement of diesel by CNG is expressed as the real value of replacement calculated on the basis of fuel consumption, which is visible in the diagrams in which the marked points are usually near the assumed value of the replacement ratio.
Figure 7,
Figure 8,
Figure 9,
Figure 10,
Figure 11,
Figure 12,
Figure 13,
Figure 14,
Figure 15,
Figure 16,
Figure 17 and
Figure 18 show the effect of the diesel/CNG replacement factor for six engine operating states, differing in speed and load, on the engine operating parameters or the concentration of individual exhaust gas components.
Figure 7 shows the effect of the diesel/CNG replacement factor for the six engine operating states, differing in speed and load, on the hourly consumption of the diesel base fuel. A linear decrease in hourly diesel fuel consumption is visible as a function of the replacement coefficient with Ge diesel = f(diesel/CNG) for the tested CNG power supply system of the Volvo D13C460 EURO V engine. The nature of the changes in fuel consumption are illustrated by the linear relationship between the consumption of the basic fuel with the designated replacement coefficient, which due to the compliance of the results with the theoretical assumptions indicates the high accuracy of the measurements made. A similar correlation can be observed for changes in hourly CNG consumption GeCNG = f(diesel/CNG) as shown in
Figure 8.
Figure 8.
Hourly CNG fuel consumption for individual engine operating points (rotation speed, torque) in the diesel/CNG replacement function.
Figure 8.
Hourly CNG fuel consumption for individual engine operating points (rotation speed, torque) in the diesel/CNG replacement function.
Differences in hourly CNG consumption for individual engine operating points are, of course, due to different values of power generated by the engine, but deviations from the linear nature of the graphs may have different backgrounds. A shape more parabolic than the linear graph showing the hourly fuel consumption may indicate, in the case of the tested engine loaded at 1100 rpm with a torque of ~0.5 kN·m, a systematic increase in the efficiency of the tested engine. The change in the efficiency with which the energy supplied to the engine was used also potentially had an impact on the results of fuel consumption in other measurements in which some nonlinear changes are clearly visible at individual stages of fuel exchange. The smallest increases in gaseous fuel consumption can be seen in the lower load points, where higher degrees of replacement have also been achieved than with a higher engine load. This is also correlated with the lower achieved temperature of the exhaust gases, which can be seen in the graphs shown in
Figure 9.
Figure 9.
Exhaust gas temperature for individual engine operating points (rotation speed, torque) as a diesel/CNG replacement function.
Figure 9.
Exhaust gas temperature for individual engine operating points (rotation speed, torque) as a diesel/CNG replacement function.
Figure 9 shows the effect of the diesel/CNG replacement factor for six engine operating states, differing in speed and load, on the exhaust gas temperature at the turbocharger output Tsp = f(diesel/CNG). A clear increase in exhaust gas temperature is visible with an increase in the diesel/CNG replacement coefficient of about 50–60 °C. This phenomenon is caused by a change in the way the fuel is burned and with a decrease in the stoichiometric lambda. Natural gas, due to its density, occupies a much larger space in the combustion chamber than diesel fuel, which leads to a decrease in the amount of energy ballast that is mainly nitrogen, which leads to a noticeable increase in the temperature of exhaust gases.
In the case of our application, in which the geometry of the combustion chamber was not modified for a dual fuel power supply, and the mixture of natural gas and air was not homogeneous, some of the unburned natural gas molecules could burn only in the exhaust system, which in some cases may result in a significant increase in the temperature of the exhaust gases. This is a very unfavorable phenomenon due to the possibility of increasing the emission of nitrogen oxides and increasing the heat load of the engine. It should be emphasized that these changes are the strongest in the low range, where differences in higher loaded engine working states between the 1100 rpm and 1500 rpm of speed causing an increase of about 60 °C between this curves. For the exchange rates between 20% 70% and higher engine loads at medium speeds, an increase in engine speed above 1300 rpm causes a decrease in exhaust gas temperature to 300 °C and a maximum temperature in this engine operation state increase of about 50 °C. A higher exhaust gas temperature at higher loads and a slightly lower one at higher speeds is natural due to the engine using more fuel at high loads and significantly higher flow through the engine at high speed, which is clearly visible in the diagram.
Seeing the values of the exhaust gas temperature achieved at higher engine loads, one can immediately see the association of these values with the achieved smoke in those engine operating states where these values (visible in
Figure 10) are clearly higher than in states in which the engine was loaded with less braking torque. This figure shows the dependence of smoke on the degree of replacement in six defined operating states.
Figure 10.
Smoke opacity for individual engine operating points (rotation speed, torque) in the diesel/CNG replacement function.
Figure 10.
Smoke opacity for individual engine operating points (rotation speed, torque) in the diesel/CNG replacement function.
Figure 10 shows a clear increase in smoke with an increase in the diesel/CNG replacement ratio of about 200–300% at different points, depending on the operating conditions. Smoke opacity at low engine load regardless of replacement is slightly higher than for smoke obtained for an engine sown exclusively with diesel fuel. In the case of engine operation at a higher load, the smoke increases many times and at some degrees of replacement significantly deviates from the trend, which is a critical case, and which will be additionally verified during subsequent tests of this engine. Significantly higher concentrations recorded for two engine operation states may result from high engine load at lower rpm, but comparing the absolute values of concentrations for individual engine operation states is not advisable without checking the emissions at these operating points. For low loads, only at small and high replacement values, did smoke increase, which will require more in-depth diagnostics in the future.
Unlike smoke and exhaust gas temperature, the dependence of carbon dioxide concentration as a replacement function is laid. Theoretically, carbon dioxide emissions should decrease as the rate of replacement of diesel by natural gas increases. The diagram shown in
Figure 11 shows a decrease in the value of carbon dioxide concentrations in the exhaust gas is visible and in most cases it takes on a close to linear character.
Figure 11.
Concentration of carbon dioxide in the exhaust gas for individual engine operating points (rotation speed, torque) as a function of replacing diesel/CNG.
Figure 11.
Concentration of carbon dioxide in the exhaust gas for individual engine operating points (rotation speed, torque) as a function of replacing diesel/CNG.
The strongest concentration drops occur at lower replacement values, then the level of carbon dioxide concentration in the exhaust gases begins to stabilize. There is a small visible decrease in carbon dioxide concentration with an increase in the diesel/CNG ratio, which reaches a maximum decrease of about 20–30% depending on the operating conditions. The reduction in the concentration of carbon dioxide is associated with a change in the elementary H/C ratio (hydrogen/carbon) as a result of replacing diesel fuel with a high carbon content, with a gaseous fuel, methane, which has a high hydrogen content. This phenomenon is accompanied by an increase in the water content of the exhaust gas [
37].
The linear relationship is no longer visible in the diagrams in
Figure 12 which shows the effect of the diesel/CNG replacement factor on the concentration of carbon monoxide in the exhaust gases.
Figure 12.
Concentration of carbon monoxide in the exhaust gas for individual engine operating points (rotation speed, torque) as a diesel/CNG replacement function.
Figure 12.
Concentration of carbon monoxide in the exhaust gas for individual engine operating points (rotation speed, torque) as a diesel/CNG replacement function.
Figure 12 shows a clear increase in the concentration of carbon monoxide with an increase in the degree of diesel/CNG replacement. The course of curves is difficult to associate between individual engine operating states, the mileage of the graphs clearly differ from each other. The CO content of diesel/CNG was up to 20 times higher in some dual fuel engine operating states than when powered solely by diesel and generally increases with an increase in the degree of diesel-CNG replacement. The most intense increase in CO concentration can be observed with small (up to 30%) replacement values. The CO content at an engine load of ~0.5 kN·m and at 1300 crankshaft revolutions per minute increases with an increase in CNG conversion to 60%. Above this level, it decreases to a value of about 150 ppm, but it is still 10 times higher than when the engine is powered solely by diesel. Possible decreases in the concentration of CO in the exhaust gases occur at the replacement level of 40–70%, but they are many times higher than when powered only by diesel.
The increasing share of CO in the exhaust gases, which increases with the increase in the degree of replacement, is correlated inversely with the NO content in the exhaust gases, which is consistent with theoretical assumptions [
38]. The concentration of nitric oxide in the exhaust gas is shown in
Figure 13.
Figure 13.
Concentration of nitric oxide in the exhaust gas for individual engine operating points (rotation speed, torque) as a diesel/CNG replacement function.
Figure 13.
Concentration of nitric oxide in the exhaust gas for individual engine operating points (rotation speed, torque) as a diesel/CNG replacement function.
The graph shows a decrease in the concentration of NO in the exhaust gases with an increase in the degree of replacement to a value of about 30% of the degree of replacement, while with a further increase in the degree of replacement, from a level of about 40%, the concentration of NO in the exhaust gas in some operating states increased. There is no clear correlation with the temperature of the exhaust gases, so the increases may result from the formation of local combustion areas with elevated temperatures. This is due to the failure to adapt the geometry of the combustion chamber to the needs resulting from the supply of natural gas to this engine. Decreases in NO concentration, on the other hand, most likely result from reduced availability of methane used by the methane supplied to the engine, because along with an increase in the degree of exchange, the value of the excess air coefficient decreases.
The reverse situation can be seen in the diagram shown in
Figure 14, showing the effect of the diesel/CNG replacement factor on the concentration of nitrogen dioxide in the exhaust gas.
Figure 14.
Concentration of nitrogen dioxide in the exhaust gases for individual engine operating points (rotation speed, torque) as a function of replacing diesel/CNG.
Figure 14.
Concentration of nitrogen dioxide in the exhaust gases for individual engine operating points (rotation speed, torque) as a function of replacing diesel/CNG.
Intensive growth with an initial small degree of replacement may indicate the formation of a larger frontal surface of the flame, which results in an intensification of the phenomenon of frontal (fast) NO
X formation, including NO
2. There is no correlation of such a clear increase in NO
2 concentration with the increased temperature of the exhaust gases, which, given the lack of this correlation also in the case of NO concentration, may indicate the widespread occurrence of a reduction reaction (2) in flame areas with low temperatures, the OH component is stable and can react with NO formed in areas with a higher temperature [
39].
It should be remembered, however, that the combustion temperatures that could occur locally are uneven, and at low temperatures a small concentration of hydrocarbons can accelerate the process of transition of nitric oxide to nitrogen dioxide. When the exhaust gas components forming the so-called NO
x are in chemical equilibrium with each other, then the amount of NO
2 reaches very low concentrations compared to NO [
40]. However, there is a clear increase in the concentration of NO
2 in the exhaust gas in the case of two engine operating states—at a load of ~0.5 kN·m and 1100 crankshaft revolutions per minute, and at a load of ~1.05 kN·m and 1500 revolutions per minute. The concentration increases most strongly from the initial low replacement to a value of about 20%, then for subsequent replacement values it stabilizes so that at values exceeding 60% of the replacement, it increases again. This trend does not occur in other engine operating states, in which the NO
2 concentration values after the initial increase stabilize and remain approximately constant in the remaining replacement values exceeding 15–20%. The linear course of these graphs indicates the stability of combustion for different degrees of replacement in these engine operating states, while the states in which a clear increase in NO
2 concentration is observed are also correlated with the increase in CO concentration visible in the previously presented
Figure 12 and with the increase in CH
4 shown in
Figure 15, illustrating the influence of the diesel/CNG on the methane concentration in the exhaust gases as shown below.
Figure 15.
Methane concentration in the exhaust gas for individual engine operating points (rotation speed, torque) as a function of replacing diesel/CNG.
Figure 15.
Methane concentration in the exhaust gas for individual engine operating points (rotation speed, torque) as a function of replacing diesel/CNG.
The graph shows a clearly higher concentration of CH
4 for those engine operating states for which higher concentrations of CO and NO
2 have also been recorded. This clearly indicates an increase in the phenomenon of incomplete combustion of hydrocarbons supplied to the engine, which is most likely due to the previously described incompatibility of the combustion chamber geometry to supply the gaseous fuel supplied to the engine. Incomplete combustion can occur in various engine operating states, because it depends to a large extent on the composition of the natural gas-air mixture in the combustion chamber. The formation of poorer and richer fuel zones results in part, from the degree of turbulence of the [
41] mixture, which, with a combustion chamber not adapted to such a mode of operation, may differ significantly in different engine operating conditions. Hence, in individual engine operating states, there may be intense increases in emissions of unburnt CH
4 which is difficult to explain by other reasons. The increasing emission of CH
4 results directly from the increase in the exchange ratio, i.e., the appearance in the combustion chamber of more methane that will not be fully burned [
42]. Its appearance in a high concentration has an impact on the formation of NO
2, which, according to the Fenimore mechanism, converts the nitrogen contained in the mixture into its oxides as a result of hydrocarbons present in the fuel [
43], which in the case of the correlation of their high concentration with high concentration of unburnt methane suggests an intense occurrence of this phenomenon. Another reason for the presence of methane in the exhaust gases is the failure to adjust the geometry of the camshaft to the change of method of fuel supply. A common rule is the use of “cylinder flushing” in turbocharged engines, i.e., part of the supercharged air in the final phase of the exhaust process gets, along with the exhaust gases, into the engine exhaust system. In this case, the inlet air to the engine contains methane, which causes an increase in its concentration in the exhaust gases.
In the case of a working state in which the engine was loaded with a braking torque of ~1.05 kN·m at a crankshaft speed of 1500 rpm, there was also a high concentration of ethane, as can be seen in
Figure 16, showing the influence of the diesel/CNG replacement coefficient on ethane concentration in the exhaust gases.
Figure 16.
Ethane concentration in the exhaust gases for individual engine operating points (rotation speed, torque) as a function of diesel/CNG replacement.
Figure 16.
Ethane concentration in the exhaust gases for individual engine operating points (rotation speed, torque) as a function of diesel/CNG replacement.
A clear decrease in ethane concentration is visible with an increase in the diesel/CNG replacement coefficient in all engine operating states. The values of decreases exceed 75%, which is mainly due to the reduction in the share of hydrocarbons from injected diesel fuel, whose energy share with the increase in fuel replacement is systematically decreasing.
However, the upward trend can be seen in the diagrams in
Figure 17, which shows the concentration of all hydrocarbon components excluding methane—NMHC (Non Methane Hydro Carbons)—depending on the degree of replacement, in which the points which are extremely different from the adjacent operating points clearly indicate incomplete combustion resulting from insufficient turbulence of the mixture in a given load state of the IC engine, which, as previously demonstrated, results from the inadequacy of the design of this engines combustion chamber for combustion of natural gas.
Figure 17.
NMHC concentration in the exhaust gases for individual engine operating points (rotation speed, torque) as a function of diesel/CNG replacement.
Figure 17.
NMHC concentration in the exhaust gases for individual engine operating points (rotation speed, torque) as a function of diesel/CNG replacement.
In general, the charts show an upward trend of NMHC concentrations with an increase in the degree of replacement of diesel by CNG. Despite the decrease in the amount of injected diesel fuel, the number of unburned hydrocarbons heavier than CH4 is increasing, which indicates an increase in the share of unburnt fuel in exhaust gases. This phenomenon suggests that the combustion chamber of the tested engine should be rebuilt in order to improve the possibility of using natural gas as an additional fuel in this engine.
On the other hand, a clear decrease in all concentration values with an increase in the degree of replacement is also visible for NH
3, which is visible in
Figure 18 showing the influence of the diesel/CNG replacement coefficient on the concentration of NH
3 in the exhaust gas at the output from the engine.
Figure 18.
Detonation status for individual engine operating points (rotation speed, torque) in the diesel/CNG replacement function.
Figure 18.
Detonation status for individual engine operating points (rotation speed, torque) in the diesel/CNG replacement function.
Clear decreases in the concentration of ammonia in the exhaust gases are an interesting phenomenon, because they are associated with the emissions of other harmful exhaust components already presented, and the phenomenon of direct NH3 emissions from the IC engine most strongly affects engines powered by LPG or CNG. In the case of a dual fuel engine, it is therefore interesting to look at the phenomenon of the formation of this harmful substance in the process of co-combustion of diesel fuel and natural gas.
NH
3 can be emitted from a piston engine every time it is operating on stoichiometric or close to stochiometric parameters of combustion. NH
3 emissions are mainly created by the engine NO emissions by reactions (5) and (6).
As the concentration of CO, NO and H
2 in the exhaust gas increases, the amount of NH
3 increases simultaneously. The mentioned substances are natural components of the exhaust gases, which determine the amount of NH3 produced. NO is formed when nitrogen-containing substances are involved in the combustion process (it can come from both air and fuel). CO is most strongly produced in rich fuel-air mixtures, where there is a small amount of oxygen for the fuel to be burned. H2 can be produced when fuel is burned under high pressure and in high temperatures, because under these conditions the chemical bonds that hold the hydrogen contained in the fuel break down. Other possibilities of obtaining hydrogen are water gas shift (7) or steam reforming (8) [
44].
Higher engine NO, CO, HC and H2 emissions could bring about higher NH3 emissions, but not all of these substances were measured in our research. It can be seen that the type of fuel used may have an influence on the amount of H2 produced in the combustion chamber according to reaction (8), so the level of replacement can influence it too.
Summing up, along with the enrichment of the air-fuel mixture, the conditions for the formation of NH
3 improve in general, but in our case, the high content of methane led to a reduction in its concentrations due to the reduction of the concentrations of substances generated mainly in the process of combustion of fuels with longer hydrocarbon chains [
45].
The authors of the article says that the main way to reduce NH3 emissions in SI engines is to reduce CO and NO emissions in the exhaust gas. A similar situation can be found in dual fuel engines using a large amount of gaseous fuel. The authors state that “in particular, this may be a significant problem in gaseous engines”. Variability in gaseous SI or CI dual fuel engines should be lower than that for gasoline engines.
In the case of our research, the concentration of NH
3 in the case of four engine operating states did not change significantly, while in the case of two others it decreased significantly. No concentrations in the exhaust gases were fairly stable, while CO increases were more intense, but in operating states where an intense decrease in NH
3 concentration was observed, it is difficult to find a correlation between their concentrations. On the basis of the theoretical assumptions cited, for a more thorough analysis it will be necessary to know the concentration of water and hydrogen in future tests. Reactions (9) and (10) between ammonia and nitrogen oxides inside the (inactive) SCR reactor may have affected the final emission of both of these substances, which also makes it impossible to clearly indicate the cause of such intense changes in NH3 concentration in some engine operating states [
39].
Summary of the Results
Summarizing the obtained test results and dividing them into individual engine operating states, the following analysis of the obtained results can be carried out:
Smoke opacity, regardless of the CNG content, is similar to the smoke obtained for an engine sewn exclusively with diesel fuel. Only with a 20% replacement, the smoke is approximately 3027 times greater than the average smoke value for the remaining CNG substitution factor, which will require more in-depth diagnostics in the future. The CO content of diesel/CNG is up to 20 times higher than that of diesel-only and generally increases as the degree of replacement of diesel oil by CNG increases. The content of NO, NOx and ammonia NH3 decreases with increasing degree of substitution, despite the increase in exhaust gas temperature. When increasing the CNG content, the share of methane CH4 and ethane C2H6 in the exhaust gases increases.
For these test conditions, it was not possible to achieve stability, without detonating engine operation with diesel replacement by CNG above 50%. Smoke opacity, regardless of the CNG content, is similar to the smoke obtained for an engine supplied exclusively with diesel fuel. Only with a replacement of 15% is the smoke opacity 10 times greater than the average smoke value for the remaining CNG diesel replacement values, which is a critical case, and which will be further verified in subsequent tests of this engine. As the CNG content increases, the share of CO increases. The content of NO decreases and NO2 increases as the conversion rate increases. With a replacement rate of 50%, the NO2 content increases significantly compared to the nitrogen oxide content when powered solely by diesel. This is despite the decrease in exhaust gas temperature in this range of engine operation. When increasing the CNG content, the share of methane CH4 (up to five times higher than when powered only by diesel) and ethane C2H6 (three times compared to diesel-only) increases in the exhaust gases.
For these test conditions, it was possible to obtain stable, stemless operation of the motor with the replacement of diesel by CNG even at the level of 85%. Smoke opacity regardless of the CNG content is very small and similar. It ranges from 0.01 to 0.05 m−1. The CO content increases as CNG conversion increases up to 60%. Above this level, it decreases (to a value of approx. 150 ppm), but it is still 10 times higher than when the engine is powered only by diesel. An increase in the degree of conversion causes a decrease in both the amount of NO and NOx. The proportion of ammonia NH3 decreases with increasing degree of conversion (up to 60%), and then increases slightly. With an increase in the share of CNG, the content of CH4 is systematically increasing. A similar relationship was observed for ethane (C2H6) to 50%, and then above 80%. The share of CH4 increases from 10 ppm (when powered only by diesel) to 130 ppm for 85% CNG conversions.
For these test conditions, it was possible to obtain stable, stemless operation of the motor with the replacement of diesel by CNG up to 70%. The smoke with diesel is 0.04 m−1. With a 15% share of CNG, it increases to a value of about 0.13 m−1, and then generally decreases. The CO content increases as CNG conversion increases. At 40–70% share, CNG is 9 times higher than when powered solely by diesel. An increase in the conversion rate to 40% causes a decrease in the amount of NO. At higher conversion rates, NO increases. With a conversion of 70%, the proportion of nitrogen oxides is greater than when powered solely by diesel. With an increase in the share of CNG, the content of both methane CH4 and ethane C2H6 is systematically increasing. A similar relationship was observed for C2H6.
For these test conditions, it was possible to obtain stable, smooth operation of the motor with the replacement of diesel by CNG up to 80%. The smoke is very small and is 0.01 to 0.04 m−1. As the CNG content increases, the CO2 content decreases, while the share of CO increases. The share of both NO and NOx decreases with increasing CNG conversion rate. When increasing the share of CNG, the share of methane CH4 and propane C2H6 increases.
For these test conditions, it was possible to obtain stable, stemless operation of the motor with the replacement of diesel by CNG only up to 60%. Smoke opacity increases in the conversion rate range of 0–30% from 0.015 m−1 (for diesel only) to 0.05 m−1 for a conversion rate of 15–30%. With a further increase in the share of CNG, the smoke decreases to 0.035 m−1 with the largest share of CNG. The share of CO increases with the increase in the degree of CNG conversion (up to 30%). Above this value, the share of CO is approximately constant. In this respect, it is 20 times larger than when the engine is powered solely by diesel. As the CNG content increases, there is a tendency to reduce the proportion of both NO, NOX and NH3. At the same time, for the degree of CNG conversion above 50%, the share of nitrogen oxides NOX increases rapidly).
The aggregate graphs clearly show the twin trends occurring for the same degrees of diesel fuel replacement by CNG at individual engine operating points. On the XY diagrams, a clear deviation from the trend of the NO2 value can be seen at an engine load of 0.5 at 1500 rpm. This is also visible for CH4 and CO emissions, where also for a rotational speed of 1300 rpm the CO concentration value was higher than at other operating points. At this engine speed, regardless of the load, significantly higher smoke was recorded than at other operating points.
Based on the analysis of the obtained test results, the conversion values (share) of CNG in the fuel dose were determined, which allowed the minimum lowest smoke k min, emissions CO, NO, NO
2, CH
4, NH
3 and C
2H
6 for the considered operating parameters of the Volvo FH13 engine to be obtained—these values are summarized in
Table 2.


