Article

Investigation of an Intensified Thermo-Chemical Experimental Set-Up for Hydrogen Production from Biomass: Gasification Process Integrated to a Portable Purification System—Part II

1
Italian National Agency for New Technologies, Energy and Sustainable Economic Development, Lungotevere Thaon di Revel, 76, 00196 Rome, Italy
2
Unit of Process Engineering, Department of Engineering, University “Campus Bio-Medico” di Roma, Via Álvaro Del Portillo 21, 00128 Rome, Italy
3
Department of Engineering Science, Marconi University, 00193 Rome, Italy
4
Department of Chemistry and Processes for Energy, Environment and Health, University of Strasbourg, 25 rue Becquerel, CEDEX 2, 67087 Strasbourg, France
5
HyGear, Westervoortsedijk 73, 6827 AV Arnhem, The Netherlands
6
Pall GmbH, Zur Flügelau 70, D-74564 Crailsheim, Germany
7
Department of Industrial Engineering, University of L’Aquila, Monteluco di Roio, 67100 L’Aquila, Italy
*
Authors to whom correspondence should be addressed.
Energies 2022, 15(13), 4580; https://doi.org/10.3390/en15134580
Submission received: 8 May 2022 / Revised: 17 June 2022 / Accepted: 22 June 2022 / Published: 23 June 2022
(This article belongs to the Special Issue Advances in Biomass Waste Gasification)

Abstract

:
Biomass gasification is a versatile thermochemical process that can be used for direct energy applications and the production of advanced liquid and gaseous energy carriers. In the present work, the results are presented concerning the H2 production at a high purity grade from biomass feedstocks via steam/oxygen gasification. The data demonstrating such a process chain were collected at an innovative gasification prototype plant coupled to a portable purification system (PPS). The overall integration was designed for gas conditioning and purification to hydrogen. By using almond shells as the biomass feedstock, from a product gas with an average and stable composition of 40%-v H2, 21%-v CO, 35%-v CO2, 2.5%-v CH4, the PPS unit provided a hydrogen stream, with a final concentration of 99.99%-v and a gas yield of 66.4%.

1. Introduction

In this historical period, the struggles against global warming and climate change united to the necessity for energy security and national independency pointed out the importance of finding out a trustworthy alternative to fossil fuels. Biomass is the largest source of renewable energy and it is ranked in the fourth place among the energy sources, after oil, coal and natural gas; moreover, residual biomass, e.g., from agro-industrial to municipal wastes, is inherently inexpensive [1,2,3]. These are the reasons why biomass waste is actually considered to be the fuel of renewable origin most suitable to replace the fossil fuels.
In the last decade, the improvement of advanced thermo-chemical technologies has also encouraged the traditional utilizations of biomass waste in distributed power generation systems. Nevertheless, appropriate small-scale energy systems must be developed and optimized, to effectively convert the low-density energy of biomass fuels into heat and electricity production [2,4,5]. Researchers point to the biomass gasification as one of the most advantageous thermo-chemical processes, due to its capacity to maintain a high-rate fuel gas production, along with lower investment costs [6,7]. This process is promoted at high temperatures, typically 750–1000 °C or higher, depending on the specific technology of use [8,9,10], by processing the biomass feedstock with an oxidizing agent (oxygen, air, steam or a mix of them). The process leads to the production of a fuel gas commonly called syngas, or product gas, consisting of hydrogen, carbon monoxide, carbon dioxide, methane and steam, along with several unwanted by-products [11]. Syngas is considered to be of good quality when it has a low content of nitrogen, a low extent of contaminants, high heating values (LHV) and, depending on the final application, a high content of hydrogen [12,13]. Several studies show that the fluidized-bed reactors are the most indicated for the operation of a gasification process. In fact, due to the possibility of providing good mixing and gas-solid contact between the gasifying agent and the fuel to be processed, it ensures high reaction rates and conversion efficiencies [14,15]. Moreover, compared to other designs, the fluidized-bed reactors have a greater flexibility with respect to the characteristics of the matrices to be processed and to the range of scalability. All of this together results in a greater versatility of the gasification technology, based on fluidized bed reactors with respect to the end uses.
The composition of syngas is affected by several factors, including the physical and chemical characteristics of the biomass feedstocks, operating conditions (e.g., temperature and feeding rates), gasifying medium, gasifier design, addition of catalysts and/or sorbents. [8,9,16,17,18,19]. Through composition conditioning and purification of syngas it is possible to produce high purity hydrogen (higher than 99%-v grade). In view of the climate targets expected by 2030 and 2050, this gas is gaining more and more interest, with applications in multiple sectors [20,21]. Hydrogen is, in fact, a very promising energy vector: it is a “clean” fuel; it can meet all of the energy demands; and it can be utilized in several applications, such as solid oxide fuel cells, internal combustion engines and gas turbines for power/CHP production, as well as for the production of substances, such as methanol and ammonia, which are commodities of high interest in the chemical/biofuel market. Finally, hydrogen can be used in the so-called «hard to abate» sectors.
The first approach to achieve a high level of hydrogen in the final composition of the syngas is to use steam and oxygen as the gasifying agents [6]. Then, the purification of the syngas can be carried out inside the gasifier by means of cracking and steam reforming of low and high molecular weight hydrocarbons, with the benefits of thermal integrations and high tar and light hydrocarbons’ conversion [22,23].
The authors, in a previous paper entitled “Investigation of an Intensified Thermo-Chemical Experimental Set-Up for Hydrogen Production from Biomass: Gasification Process Performance-Part I” [24], showed the good results obtained in an intensified gasifier with the UNIQUE concept [25], which combines the benefit of the process of steam/oxygen gasification with that of a hot gas-cleaning process, integrated into a single and compact fluidized-bed reactor. With the aim of producing hydrogen from the biomass feedstocks through gasification, experimental campaigns were carried out on a prototype intensified gasification plant coupled to an integrated portable purification system (PPS). The PPS was designed for gas cleaning and conditioning, for hydrogen separation and production at a fuel cell vehicle grade (FCV), i.e., grade 4, 99.99%-v of H2. In the previous paper, quoted above, the authors only reported the gasification element. The experimental activity was conducted at a 1 MWth gasification pilot plant and the tests were carried out at 0.25–0.28 Equivalence Ratio (ER), 0.4–0.5 Steam/Biomass (S/B), and 780–850 °C gasification temperature. The biomass feedstock selected was almond shells, a residual biomass ready for reactor feeding, as well as being characterized by low humidity, high density, low ash content, high calorific value and low costs [26]; feeding rates of about 120 and 150 kgdry/h were preliminarily adopted in order to also evaluate the performance of the gasification reactor after the hardware modifications were implemented to integrate the filtration system into the gasifier freeboard. The collected data showed that the filtration system ensured a dust removal efficiency higher than 99%-wt. The dry syngas final composition was made up of 27–33%v H2, 23–29%v CO, 31–36%v CO2, 9–11%v CH4; the gas yield calculated was 1.2 Nm3dry/kg. A LHV of 10.3–10.9 MJ/Nm3dry and a cold gas efficiency (CGE) up to 75% were estimated.
Starting from the results achieved in [24], in the current work the authors want to present the results of the PPS operation, with the achievement of 99.99%-v of H2. This research also includes a whole process simulation, developed via the Chemical Engineering commercial software Aspen Plus.

2. Materials and Methods

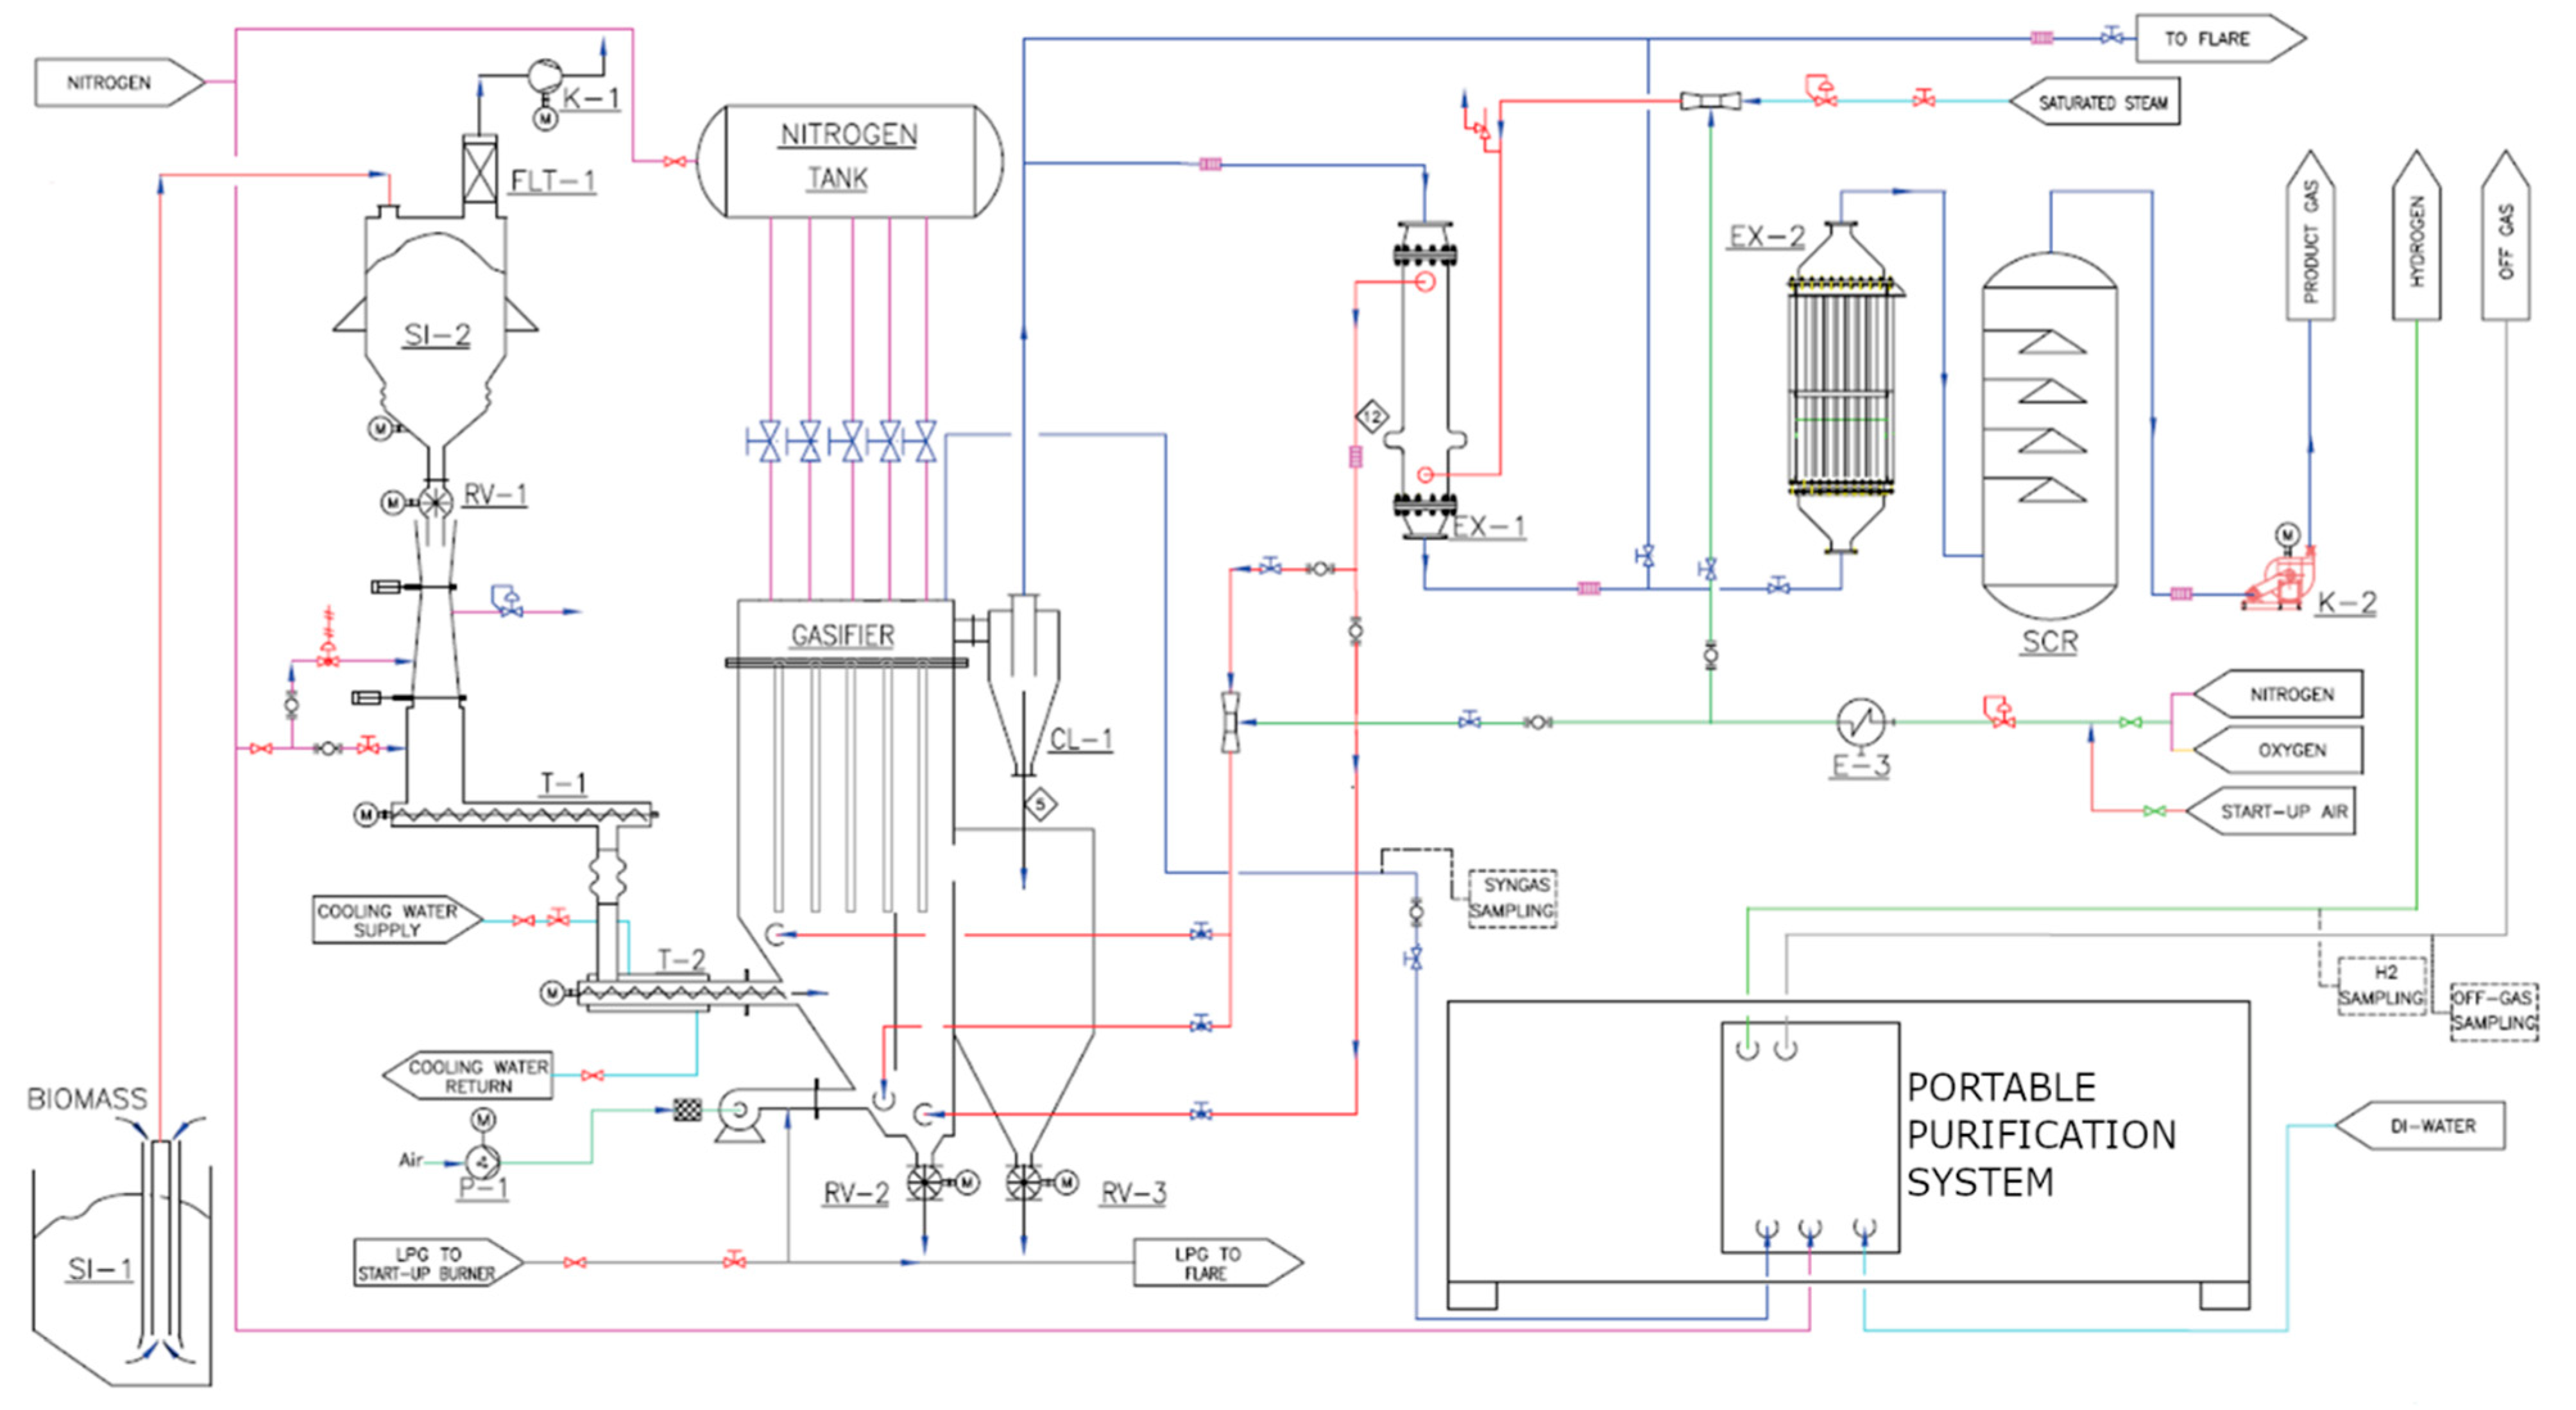
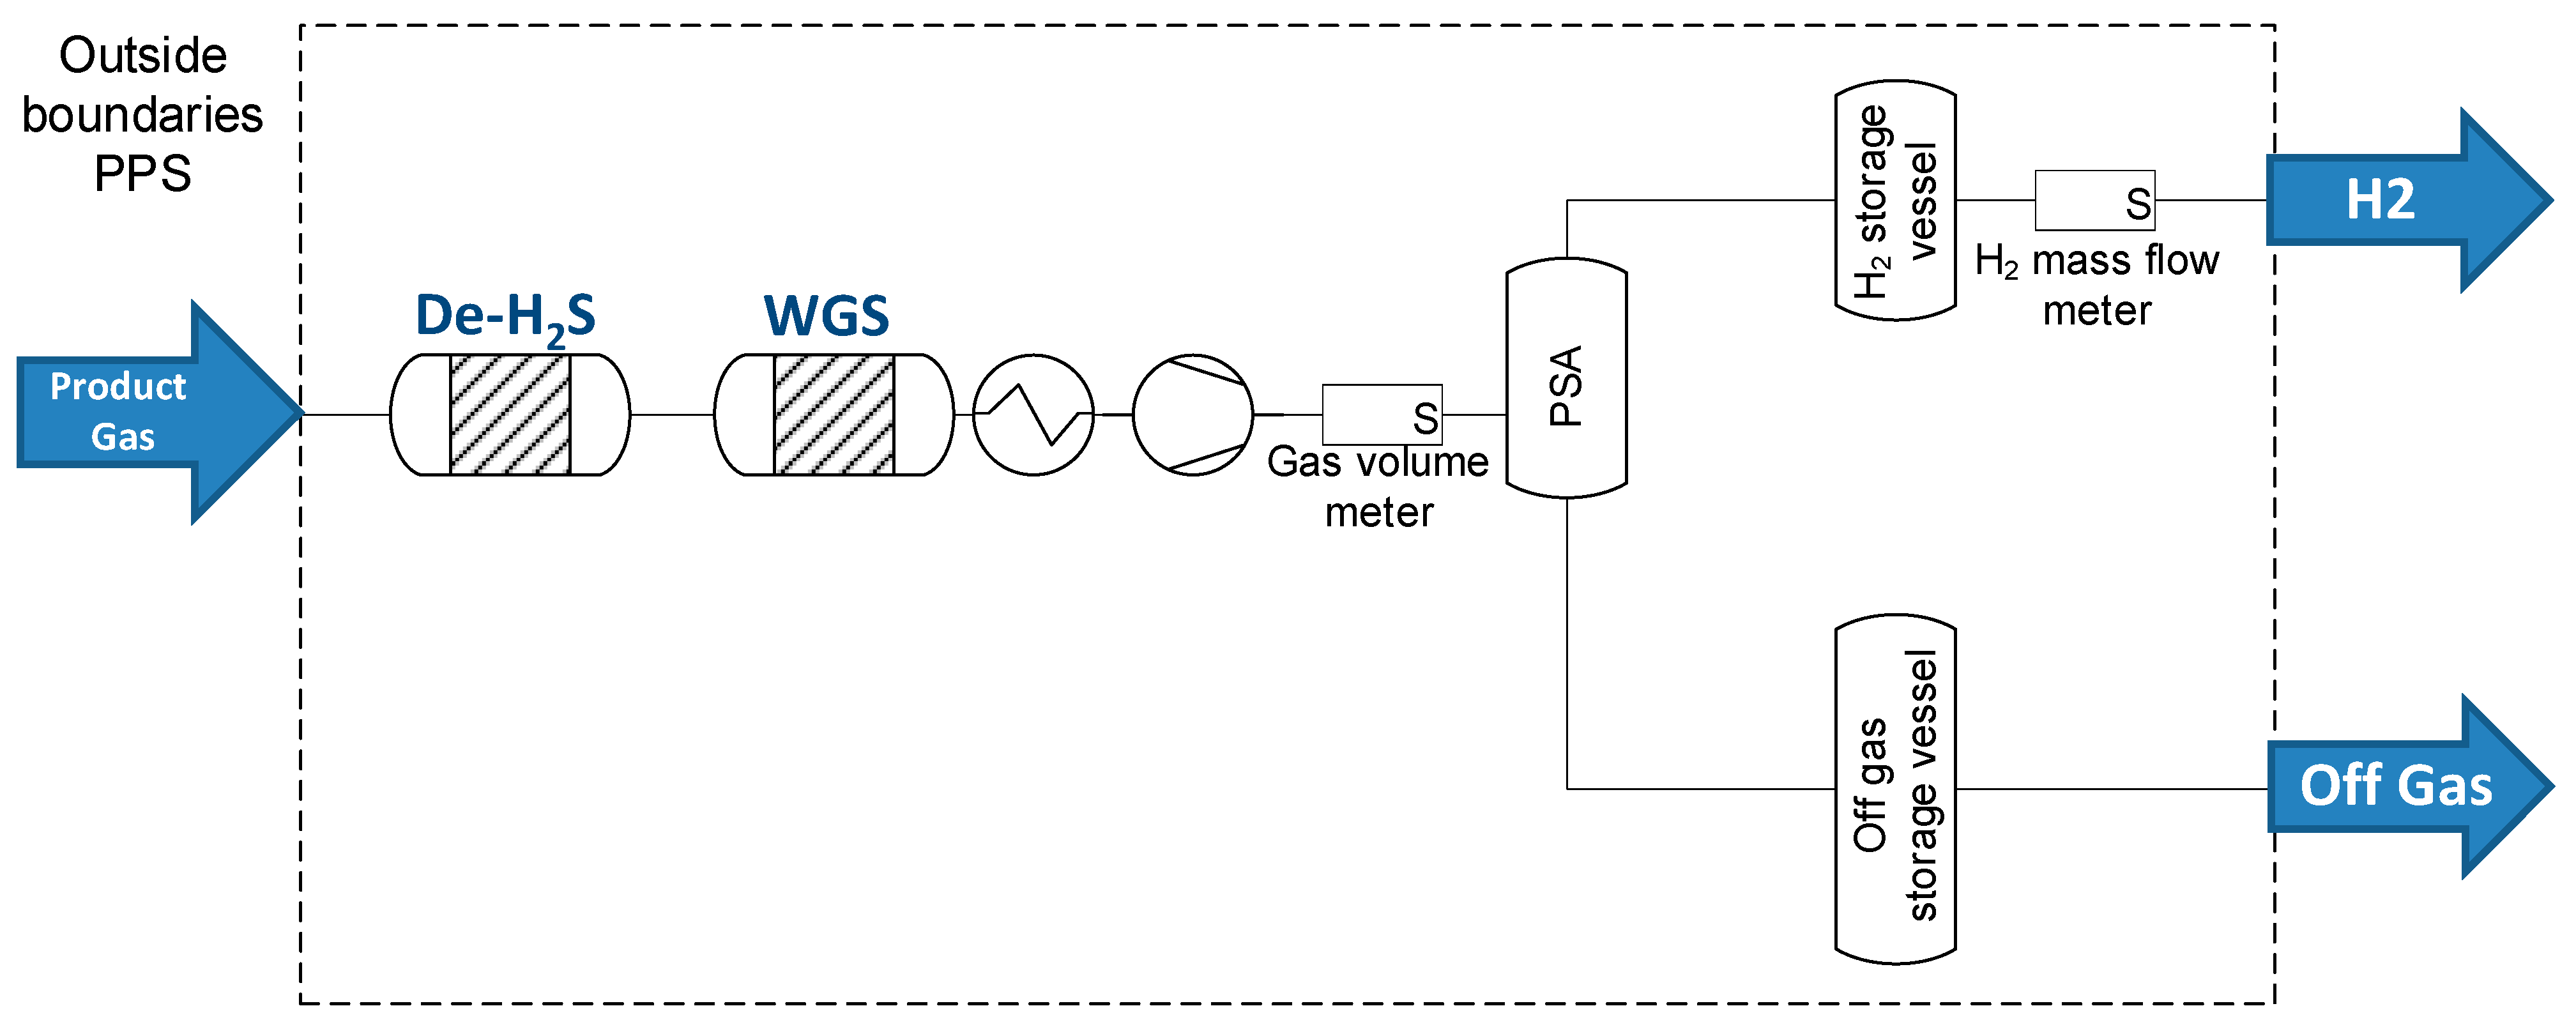
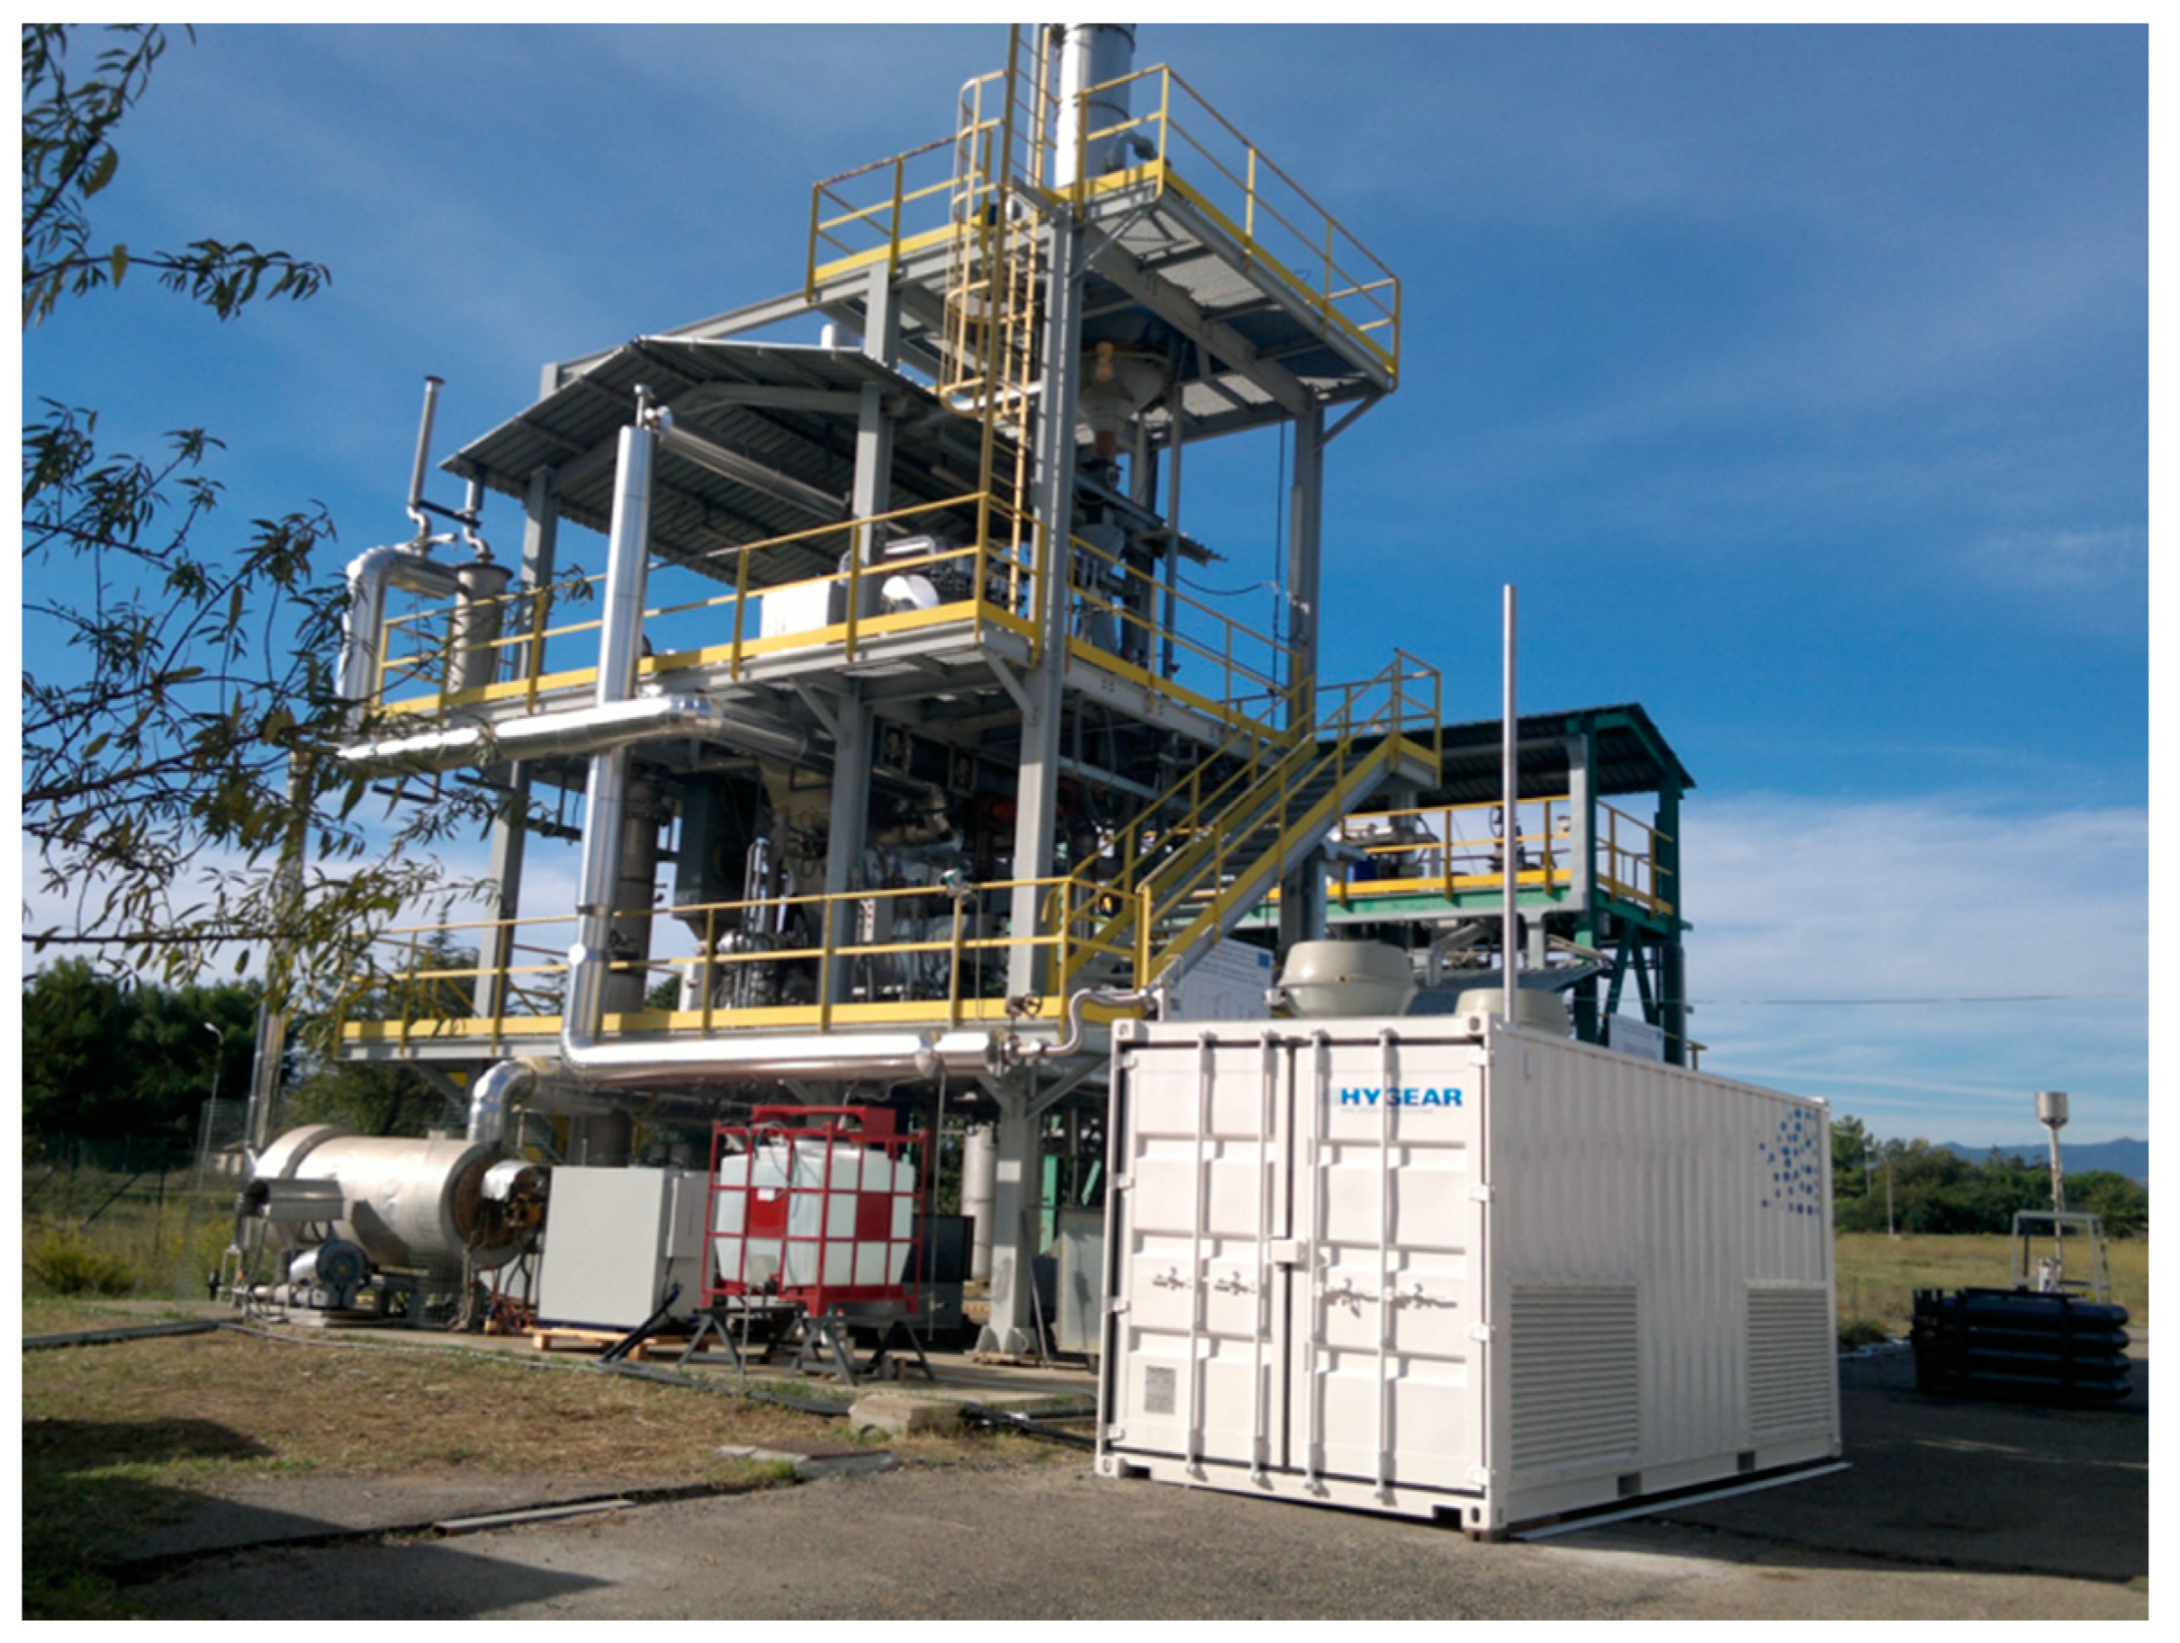
2.1. Experimental Set-Up

The process of biomass gasification was carried out at a 1000 kWth pilot plant located at the ENEA Research Centre of Trisaia (Rotondella), Southern Italy. The plant is based on a bubbling fluidized bed reactor designed in its final configuration to host a bundle of sixty, high temperature, ceramic filter candles for in-vessel gas filtration. The candles were arranged in 5 clusters of 12 elements each and, to keep the cleaning efficiency of such a filtration system, the dust cake growing on the candle surface was removed by pulsing of N2; the pulses were activated based on feedback from the pressure drop at the candles. A more detailed description of such a specific reactor configuration is presented in [24]. With the aim of producing FCV-H2, the gasification plant was coupled with a portable (containerized) integrated system designed for gas conditioning and subsequent purification. In Figure 1, a scheme of the integrated pilot plant is presented.
To evaluate the performance of the plant during its experimental operation, key process parameters, such as flow rate, pressure and temperature, were monitored continuously. Simultaneously, online and offline samplings were carried out on the product gas at the gasifier and at the PPS unit, to complete its characterization in terms of composition and contaminants’ loads.
Regarding the portable purification system (PPS), the unit was equipped with a reactor for water–gas shift (WGS), based on catalytic Cu-impregnated foams, and pressure swing adsorption (PSA) modules for H2 recovery and purification. To preserve the catalytic reactor from a poisoning effect from the hydrogen sulfide (H2S), the inorganic gaseous contaminant evaluated as the most critical, the produced gaseous stream was sent to a sorbent guard bed (De-H2S) before entering the water–gas shift (WGS) reactor. Extra water vapor was added to the product gas upstream from the WGS reactor to increase the hydrogen production. Downstream from the WGS reactor, the gas was cooled and a commercial syngas compressor was used to compress the product gas up to six bar g, to allow for the proper operation of the pressure swing adsorber. The composition and flow of both the hydrogen-produced gas and the off gas could be quantified to allow for a proper balance. Figure 2 shows a schematic view of the PPS.
In Table 1 and Table 2, an overview of the specification for the measuring devices of the main process parameters at the gasification plant and the portable purification system is presented.
The process of biomass gasification was carried out using a steam/O2 mixture as a gasification agent, rather than air, to avoid any diluting effect on the product gas and, thus, for it to handle only the net stream arising from the particular biomass undergoing conversion. Air, however, was fed to the reactor in the preliminary heating stage. Specifically, the temperature of around 600 °C was achieved by combustion of LPG and, subsequently, of the biomass until 800–850 °C, when the operating conditions were switched to gasification to start the related tests. More details about this preliminary producer can be found elsewhere [27].
As emphasized in Figure 1, of the whole produced gaseous flux, a stream corresponding to two-fifths was sent to the PPS. In fact, the unit was designed for demonstration purposes and was therefore sized to handle a small flow rate.
In Figure 3, a picture of the integrated prototype plant is presented.
In a typical experimental run of the biomass gasification, starting from room temperature, the plant was heated up by combustion to speed up the startup step. Specifically, from room temperature up to 500–600 °C the reactor was heated by feeding biochar to the 1000 kWth reactor, then it was heated up to 800 °C by feeding almond shells. Next, the operating conditions were switched to the specific gasification operating conditions. The approach of starting to supply the biomass feedstock when the reactor temperature was already relatively high was adopted to avoid the risks of clogging the gas filtration system and the piping downstream of the gasifier, as a consequence of the possible condensation of organic compounds during the transient phases. It is, in fact, known that, even under nominal burning conditions, condensable organic vapors are unavoidably produced, namely, the lower the combustion temperature, the higher the amount of condensable compounds produced. Due to the size of the plant, overall, the achievement of the stable gasification conditions required around 5–6 h.
The pre-conditioning procedures of the PPS were conducted at the same time to prepare the unit for its operation with real gas. During the heating up of the gasifier both the De-H2S sorbent and the WGS catalyst were heated up by recirculating inert gas over an electrical heater, to prevent water and tar condensation on the guard bed and WGS catalyst as a result of a cold start-up. The interconnecting piping between the gasifier and PPS was heated up by electrical tracing (to prevent tar condensation during the cold start-up) and the gasifier output stream. During the heating up of the PPS this gas was sent to a flare, thus bypassing the PPS. After reaching the proper operational temperatures of both the De-H2S sorbent and the WGS catalyst (approx. 300 °C), the interface valve between the gasifier and PPS could be opened and the product gas was sent to the PPS.
The integrated experimental campaign, i.e., the continuous operation of both the gasification section and PPS unit, was then started when the product gas had a stable, dry gas composition, based on the data from the online chromatographic analysis. The product gas was monitored online by a µGC-TCD system from Agilent Technologies (see [24] for details).
To avoid leaks of the product gas through the feeding screws, the biomass feedstock was supplied to the gasifier under a slight nitrogen stream. The gas analysis concordantly revealed its presence; the content was typically lower than 10%v.
To improve the characteristics of the produced gas in terms of permanent gases’ composition and the organic contaminants’ load, two of the five clusters were filled with commercial Ni-containing pellets (NiO 8.5%wt, quadralobe-shaped pellets) for the gas composition upgrading. Each candle was filled with about 1.4–1.5 kg of catalyst pellets. A zoomed view of some of the filled candles before closing the reactor top cover is presented in Figure 4.
Provided in a non-active form, the catalyst was intended to be activated in situ under the action of the wet, reducing product gas, in accordance with the technical specification of the product.

2.2. Gasification Test Campaigns

The experimental campaigns focused on in this work refer to a two biomass feeding rate. The tests were carried out at 0.22–0.25 equivalence ratio (ER), 0.5–0.7 steam/biomass ratio (S/B), and using Magnolithe GmbH (Hart bei Graz, Austria) [28] sand as the fluidized-bed inventory. This material was adopted because of its known characteristic of superior resistance to attrition under fluidized conditions and its property as a primary catalyst able to promote in situ tar-reforming reactions [29,30]. In Table 3, the most representative conditions adopted at the gasifier are presented; a summary of the main physical and chemical characteristics of almond shells, the biomass feedstock adopted, is instead given in Table 4.
In addition to the ultimate and proximate analysis, to assess in advance the occurrence of problems with the bed material agglomeration, which could in turn bring problems to the smooth and continuous plant operation, a study on the thermal behavior of the ash produced by almond shells was also included. The evaluation was carried out in accordance with the technical specification CEN/TS 15370-1:2006, a protocol specifically developed by CEN (Comité Européen de Normalization) for studying the softening and melting behaviors at high temperatures of ash from solid fuels. The measurements were carried out using a Heating Microscopes Misura® HSML Mod. 1400-3002 by Expert System Solutions. Four key temperatures were then acquired, as follows: the “shrinkage starting temperature” (SST); the “deformation temperature” (DT); the “hemisphere temperature” (HT); and the “flow temperature” (FT).
To complete the measurements, a homogeneous sample of ash from the representative samples of almond shells was prepared by combustion, in accordance with the UNI EN 14,775 protocol. The thermal behavior study was then performed at a defined heating rate in a controlled atmosphere; the test specimen made from the ash was heated and continuously observed, exploring a temperature range between 500 and 1400 °C.
In Table 5, a summary of the four characteristic temperatures is presented, along with corresponding images of the ash specimen.
Based on these data, the plant operating conditions were monitored to avoid temperature peaks across the reactor as well as to prevent prolonged overshoots above the shrinkage starting temperature (SST).

2.3. Simulation Model of the Integrated Plant

The simulation approach adopted in the present work is based on the model previously developed in [21]. The flow sheet is shown in Figure 5. The block DECOMP is a yield reactor which converts the biomass input according to the proximate and ultimate analysis (shown in Table 2). The block RSTOIC is a stoichiometric reactor which simulates the formation of hydrogen sulfide, ammonia and hydrogen chloride (the nitrogen, chlorine and sulfur that are in the biomass feedstock are known to produce mainly hydrogen sulfide, ammonia and hydrogen chloride and a fractional conversion of 1 is in line with experimental results) [31,32]. The block SEP is a separator which splits the stream S2 into: VOLATILE; CHAR; and INORG, which are made up of the volatile parts, char and inorganic compounds (hydrogen sulfide, ammonia and hydrogen chloride), respectively. The VOLATILE stream is then divided into the sub-streams: VOL, which goes to the gasifier GASIF after mixing with the gasifying agents, and H2, which occurs in the simulation of tar production in the TARPROD block, that is a yield reactor. The gasifier model is an auto-thermal fluidized-bed reactor and it has been simulated according to Gibbs free energy minimization and with the quasi-equilibrium approach. The bed material of the gasifier is simulated as sand. The reactions considered in the gasification process are listed in Table 6. In Figure 5, the streams STEAM, OXYG and AIR are the gasifying agents steam, oxygen and air, respectively, and they are all shown in the flow sheet since the model is able to work with all of the combinations of the oxidizing agents [33]; the mass flow of the stream that was not used was set to zero. Then, stream S6 is the final wet output of the gasifier. CANDLE is a stoichiometric reactor which simulates the ceramic filter candles at the freeboard of the gasifier. The stream, DRYSING, is the final dry output of the gasifier, since the block H2OREMOV is a dryer which removes all of the water. H2SADSOR, which is an equilibrium reactor, simulates the stage of hydrogen sulfide removal. The sorbent simulated is zinc oxide. The WGS unit is simulated as an equilibrium reactor while the PSA unit is simulated as a separator, considering a separation efficiency for hydrogen of 70% and gas inlet pressure of six bar. Pressurization was achieved with a compressor, before the PSA unit. A description of the ASPEN Plus flowsheet unit operation is reported in Table 7.

3. Results and Discussions

3.1. Process Performances

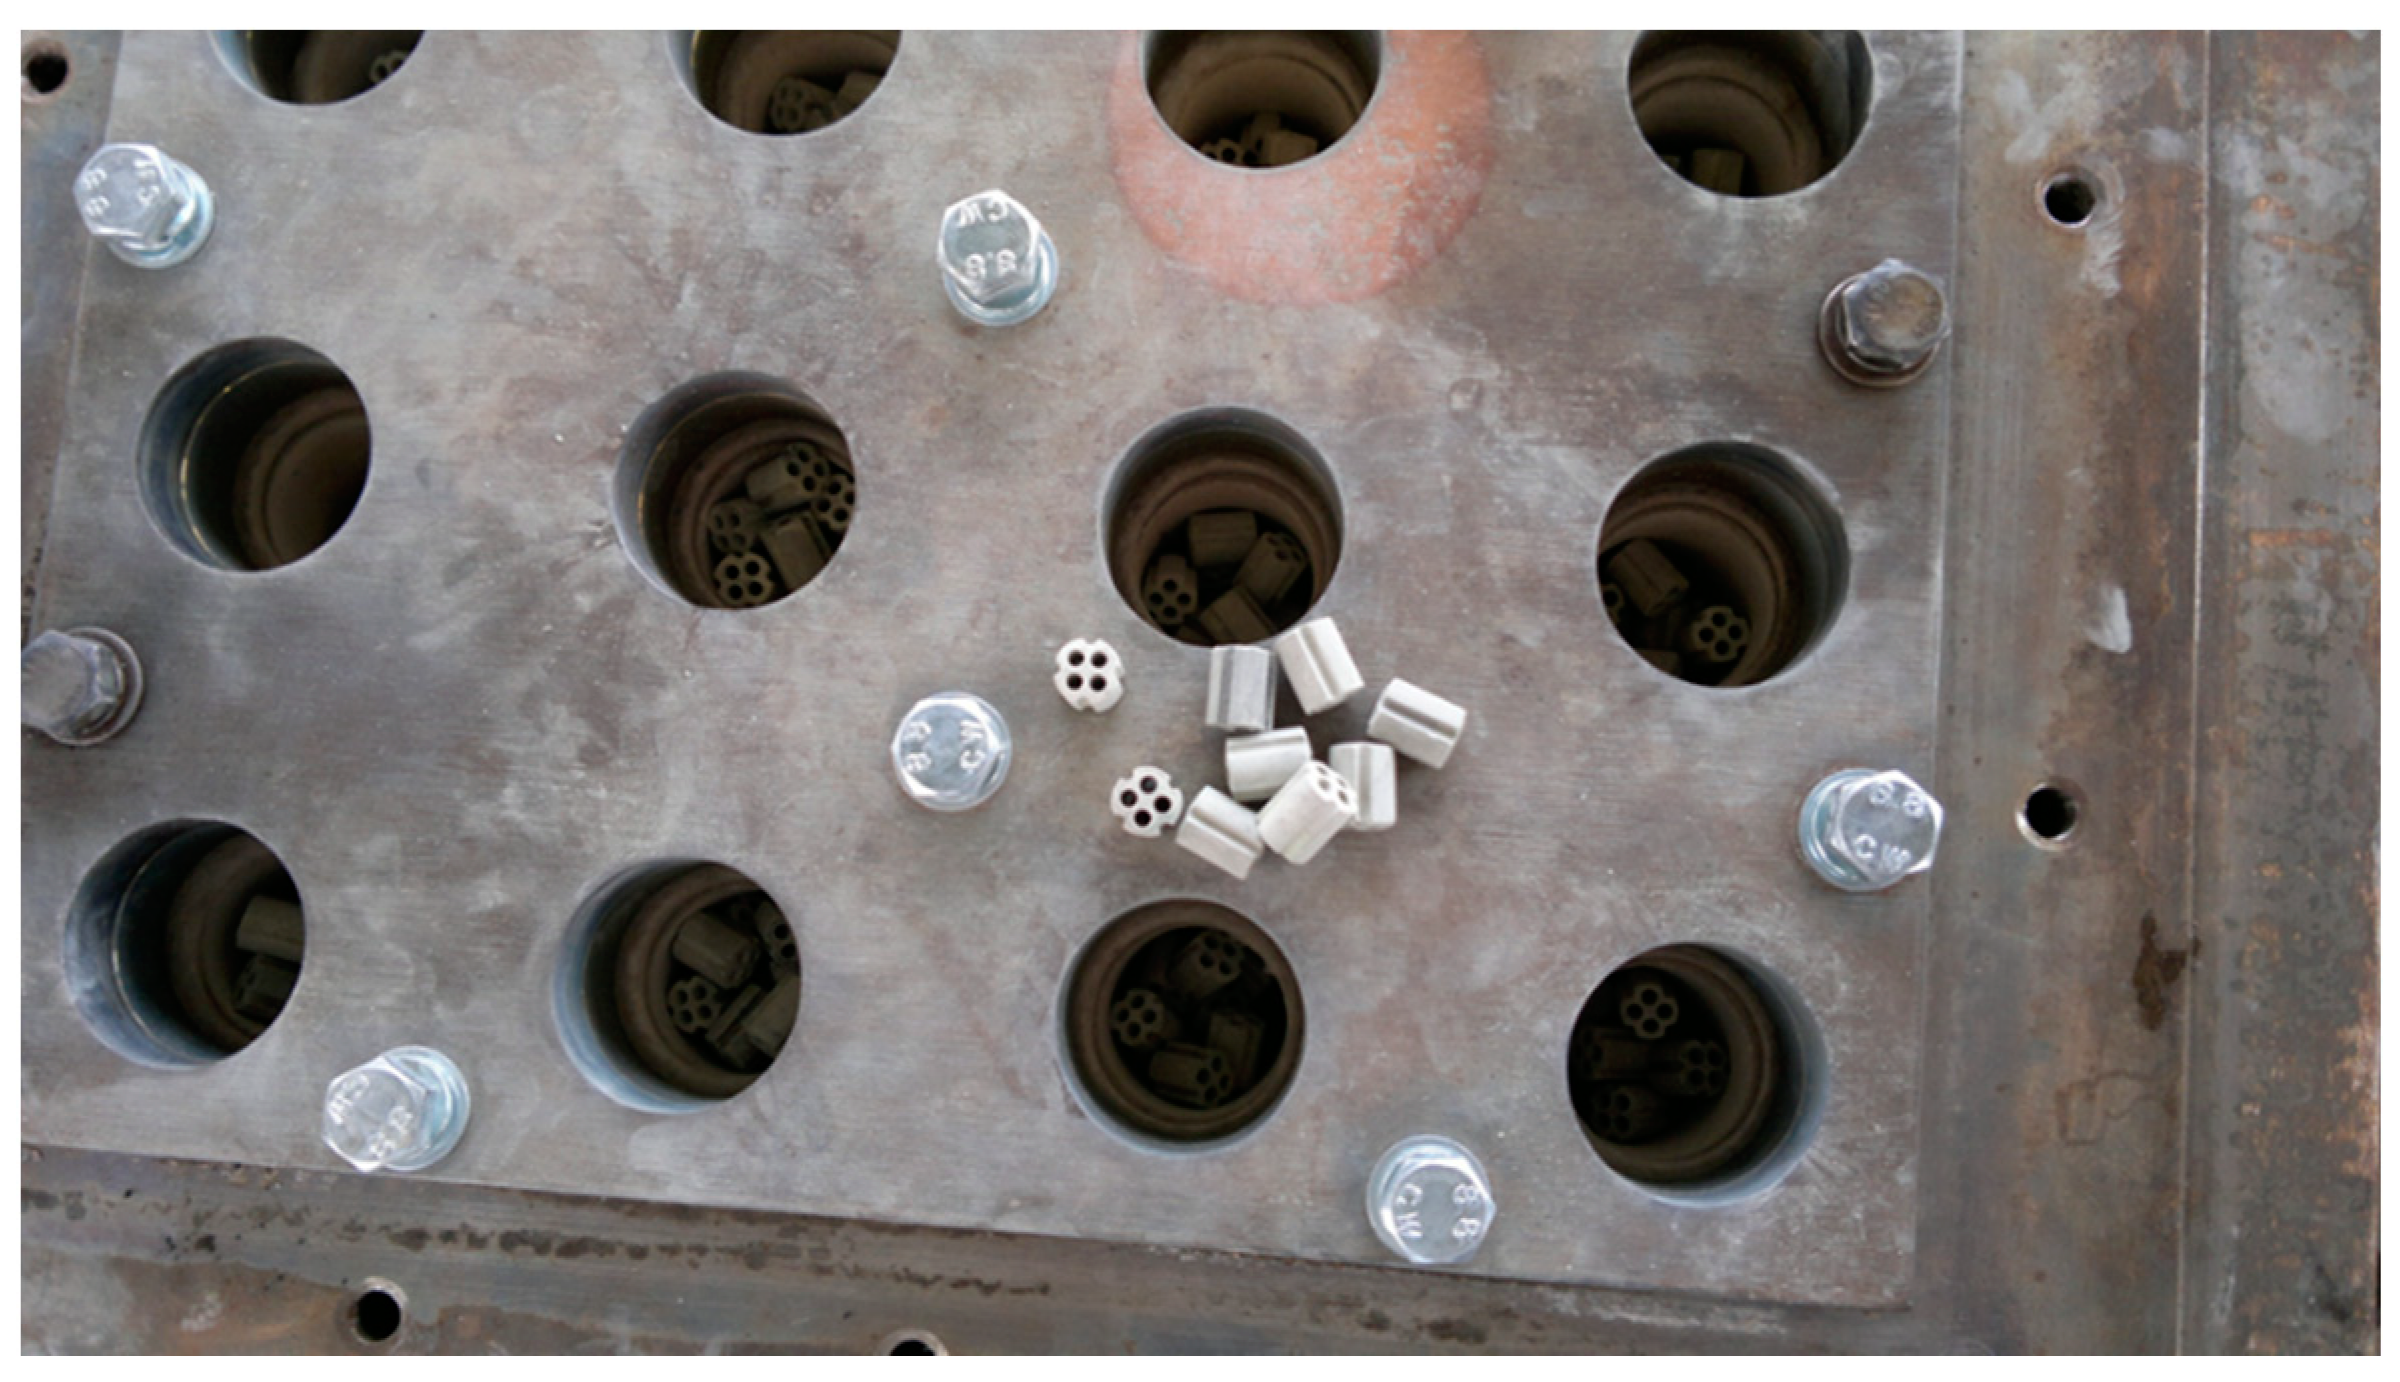
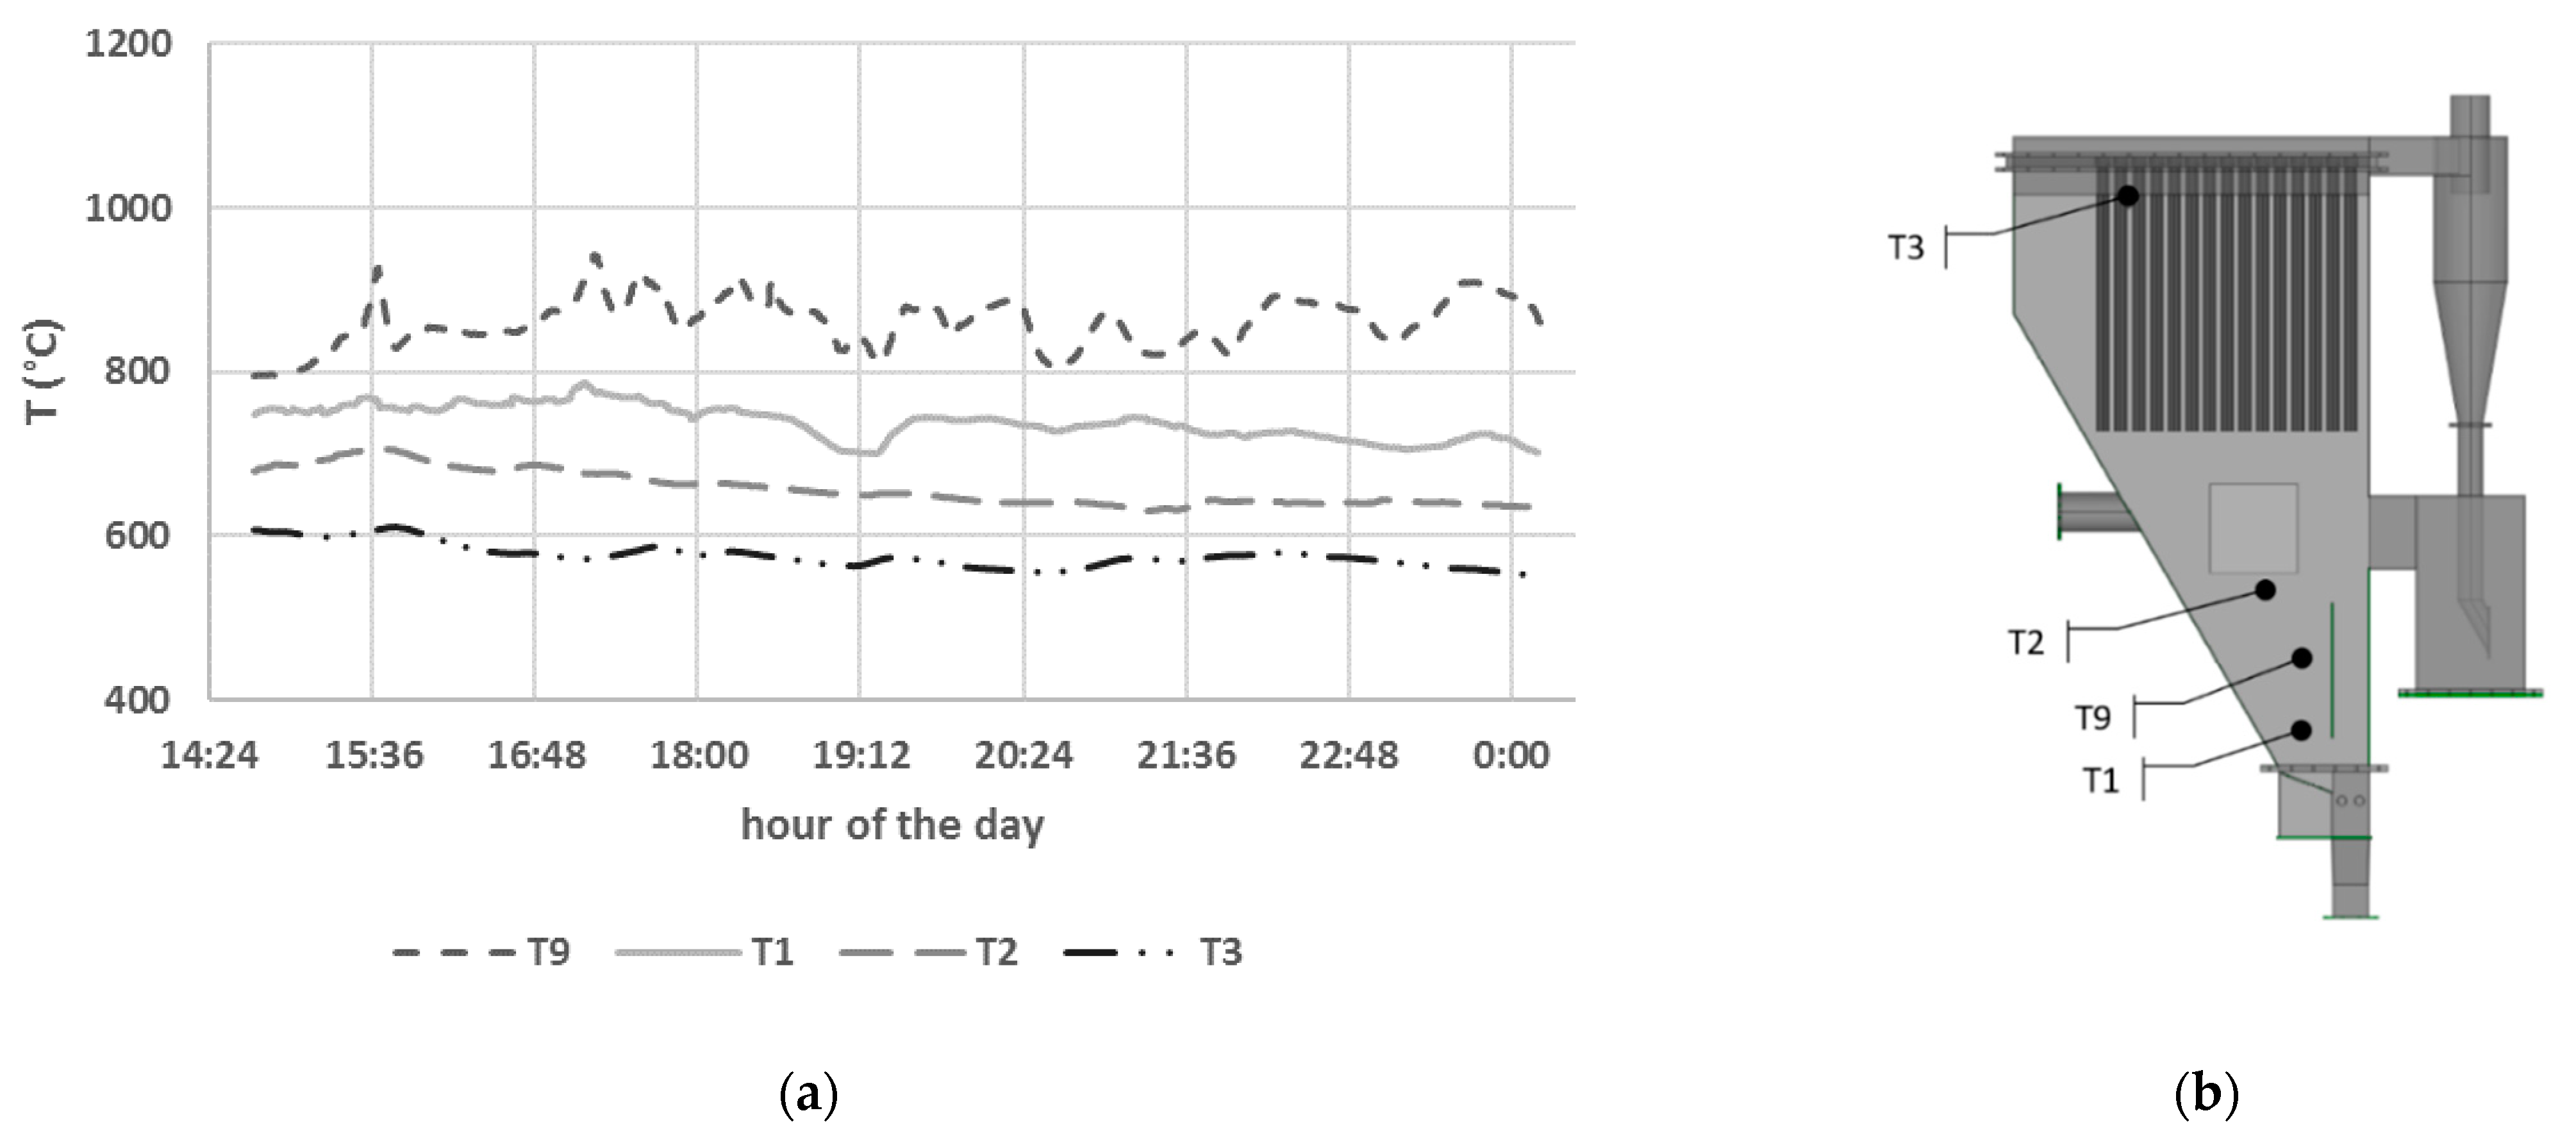
3.1.1. Biomass Gasification Tests with Catalytic Ceramic Candles

The gasification campaign to evaluate the effect of using Ni-pellets catalyst housed in the filter candles was carried out in the operating conditions summarized in Table 3.
Both of the product gas lines from the gasification reactor, i.e., the one coming from the clusters containing the catalyst and designed to feed the PPS unit and the other addressed to the flare, were monitored online via µGC-TCD system.
Figure 6 shows a comparison between the average dry gas composition observed at the operating conditions corresponding to Test I, after achievement of the gasification process stabilization (i.e., reactor temperature, ER and S/B), and its operation over several hours. The data of the dry compositions, relevant to the two gaseous streams produced at the condition II over time, are presented in Figure 7. In this latter campaign, having run the biomass gasification at a lower biomass feeding rate, the resulting plant conditions were more stable; moreover, the feedstock supply to the gasifier was carried out without auxiliary nitrogen to the feeding system, therefore no N2 was detected in the product gas.
The comparison of the dry gas composition data indicated, in both of the test campaigns carried out under the conditions of Test I and Test II, no significant difference between the two gaseous streams. This result was not what was hoped for; however, it was explained in relation to the effective activation of the loaded amount of the catalyst pellets.
Figure 8 shows the trend of temperature profiles along the gasifier, monitored with thermocouples placed in the four most relevant reactor areas, during the gasification campaign carried out under the Test II conditions.
As shown, the temperature in the upper part of the gasifier, i.e., next to the ceramic catalytic candles (T3 in accordance with Figure 8b), at stable conditions ranged around the value of 600 °C. According to the catalyst provider, the proper temperature is required to be over 750 °C. Therefore, the discrepancy between the temperature for the proper pellets’ operation and the temperature achieved in the gasification campaign support the hypothesis that the pellets in the candles were not well activated, because the actual process conditions were not consistent with those from the technical specification.

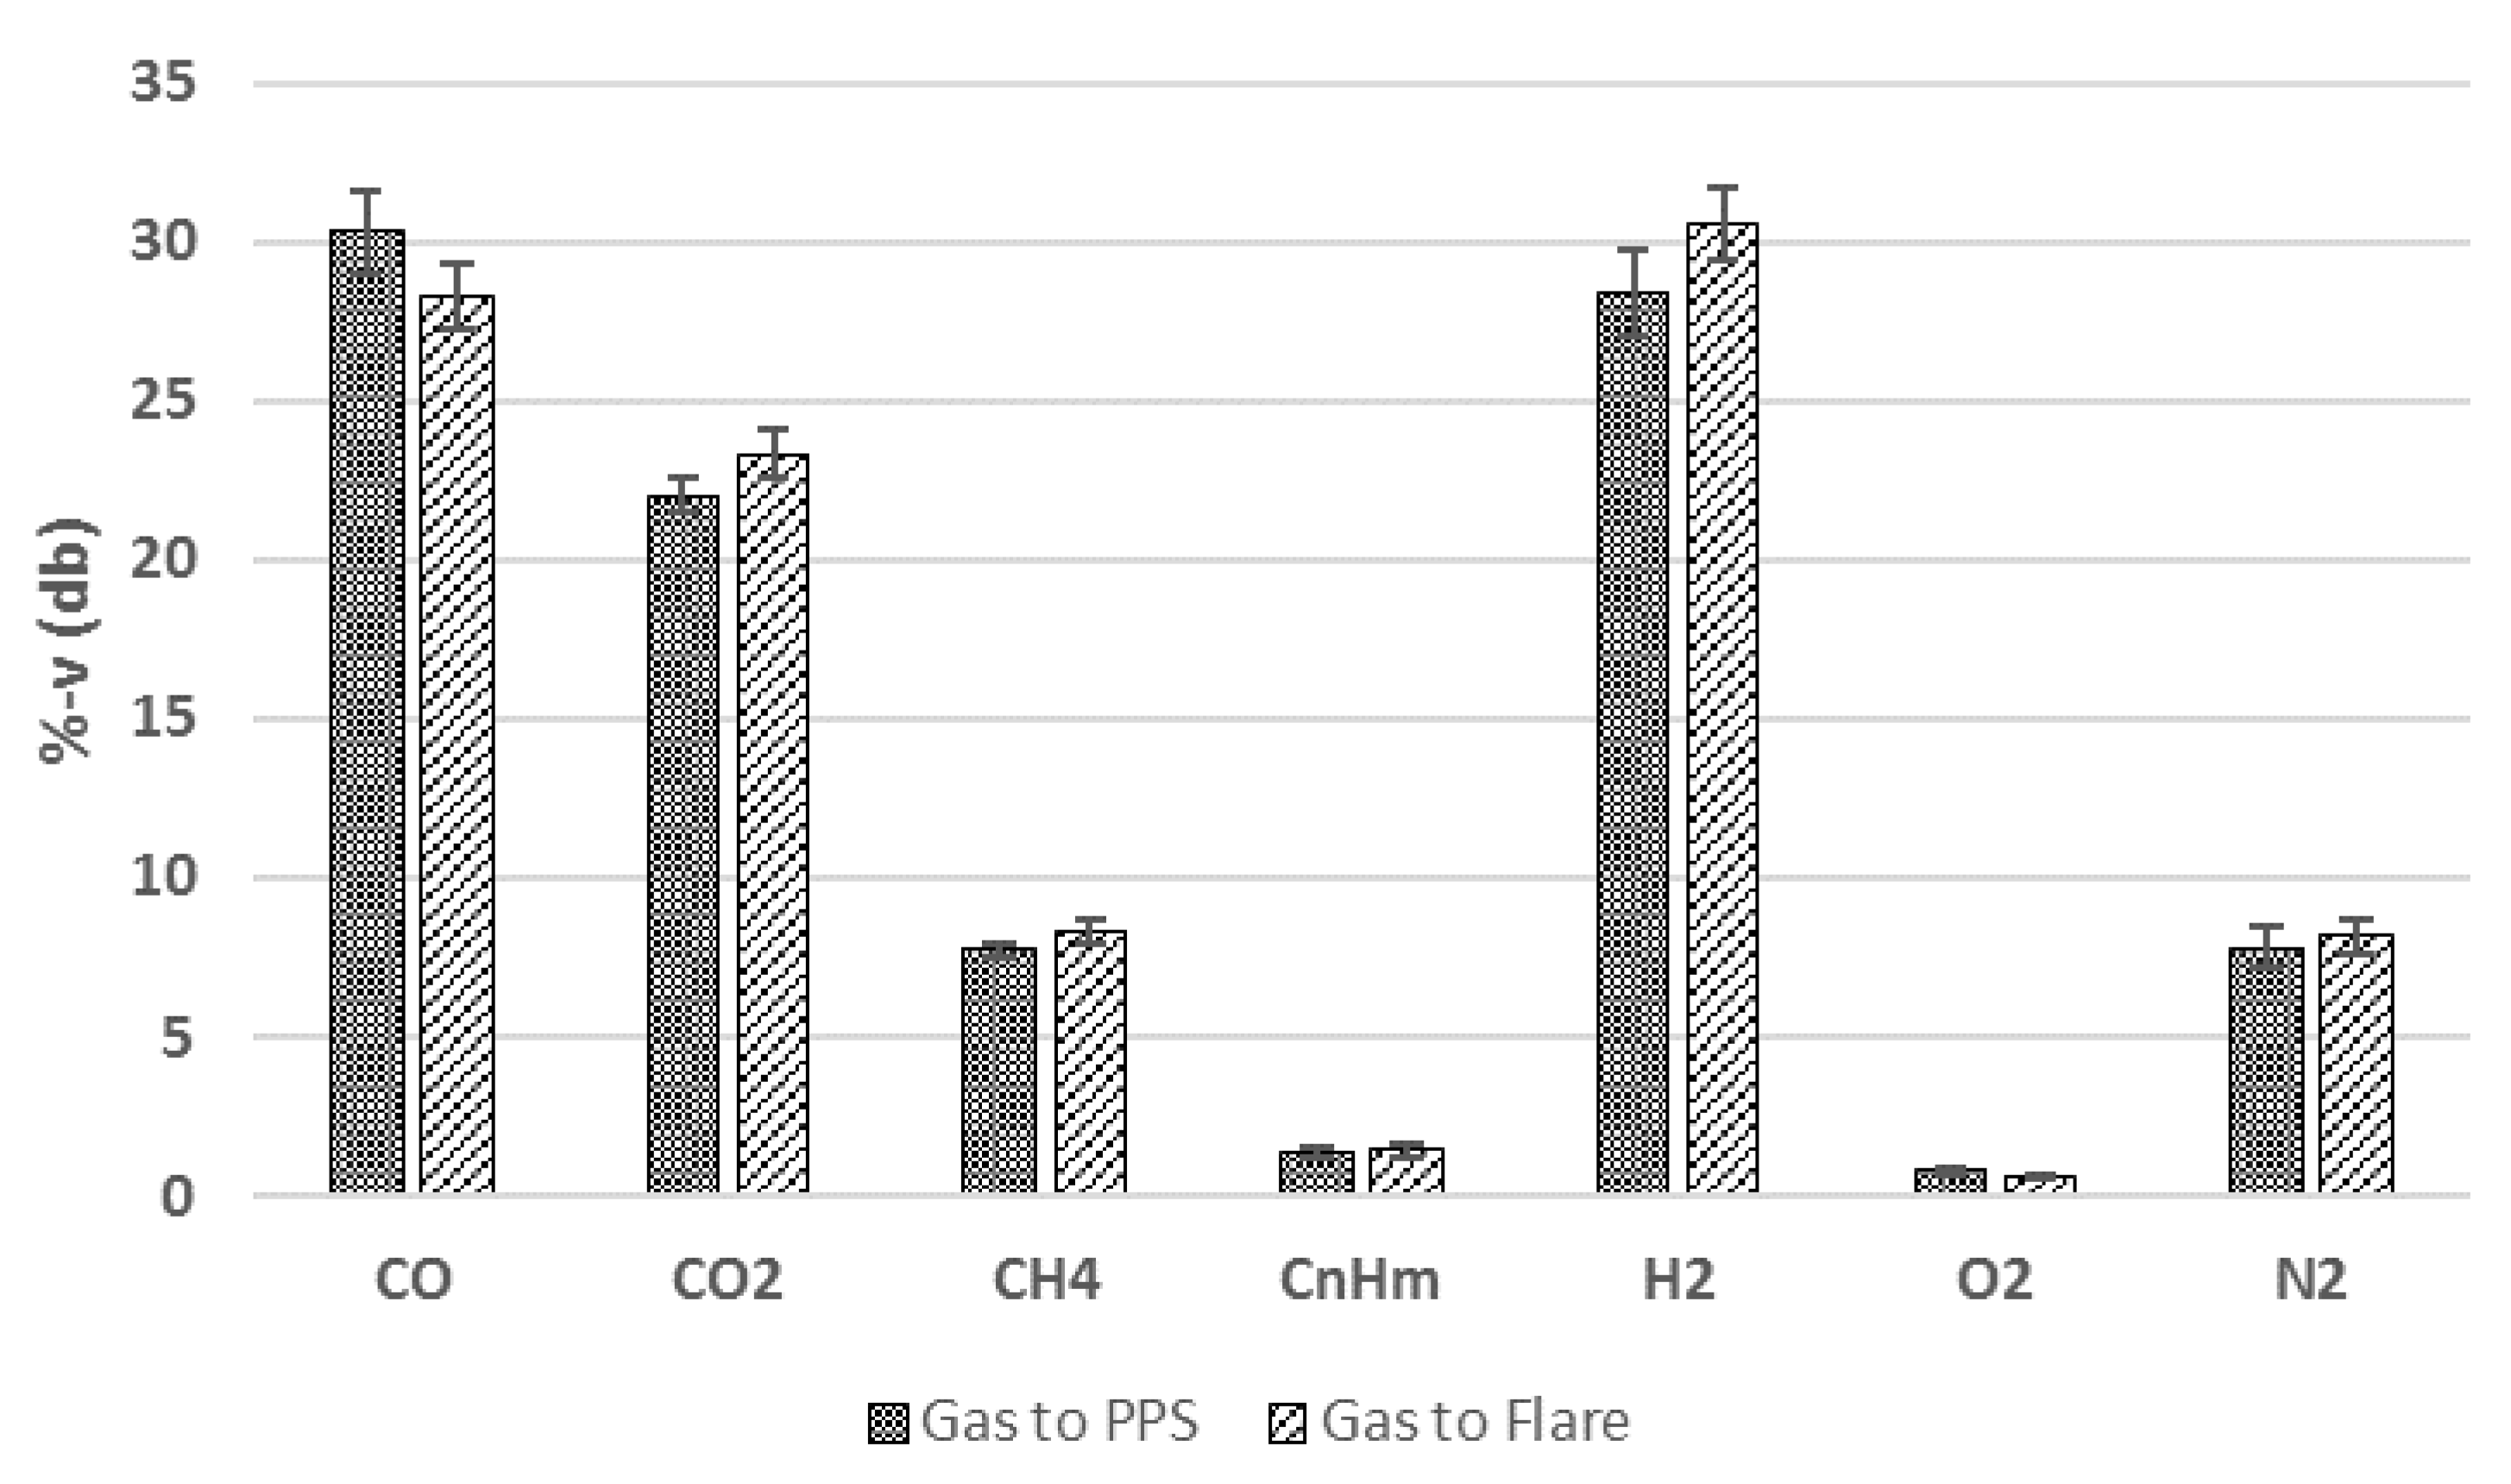
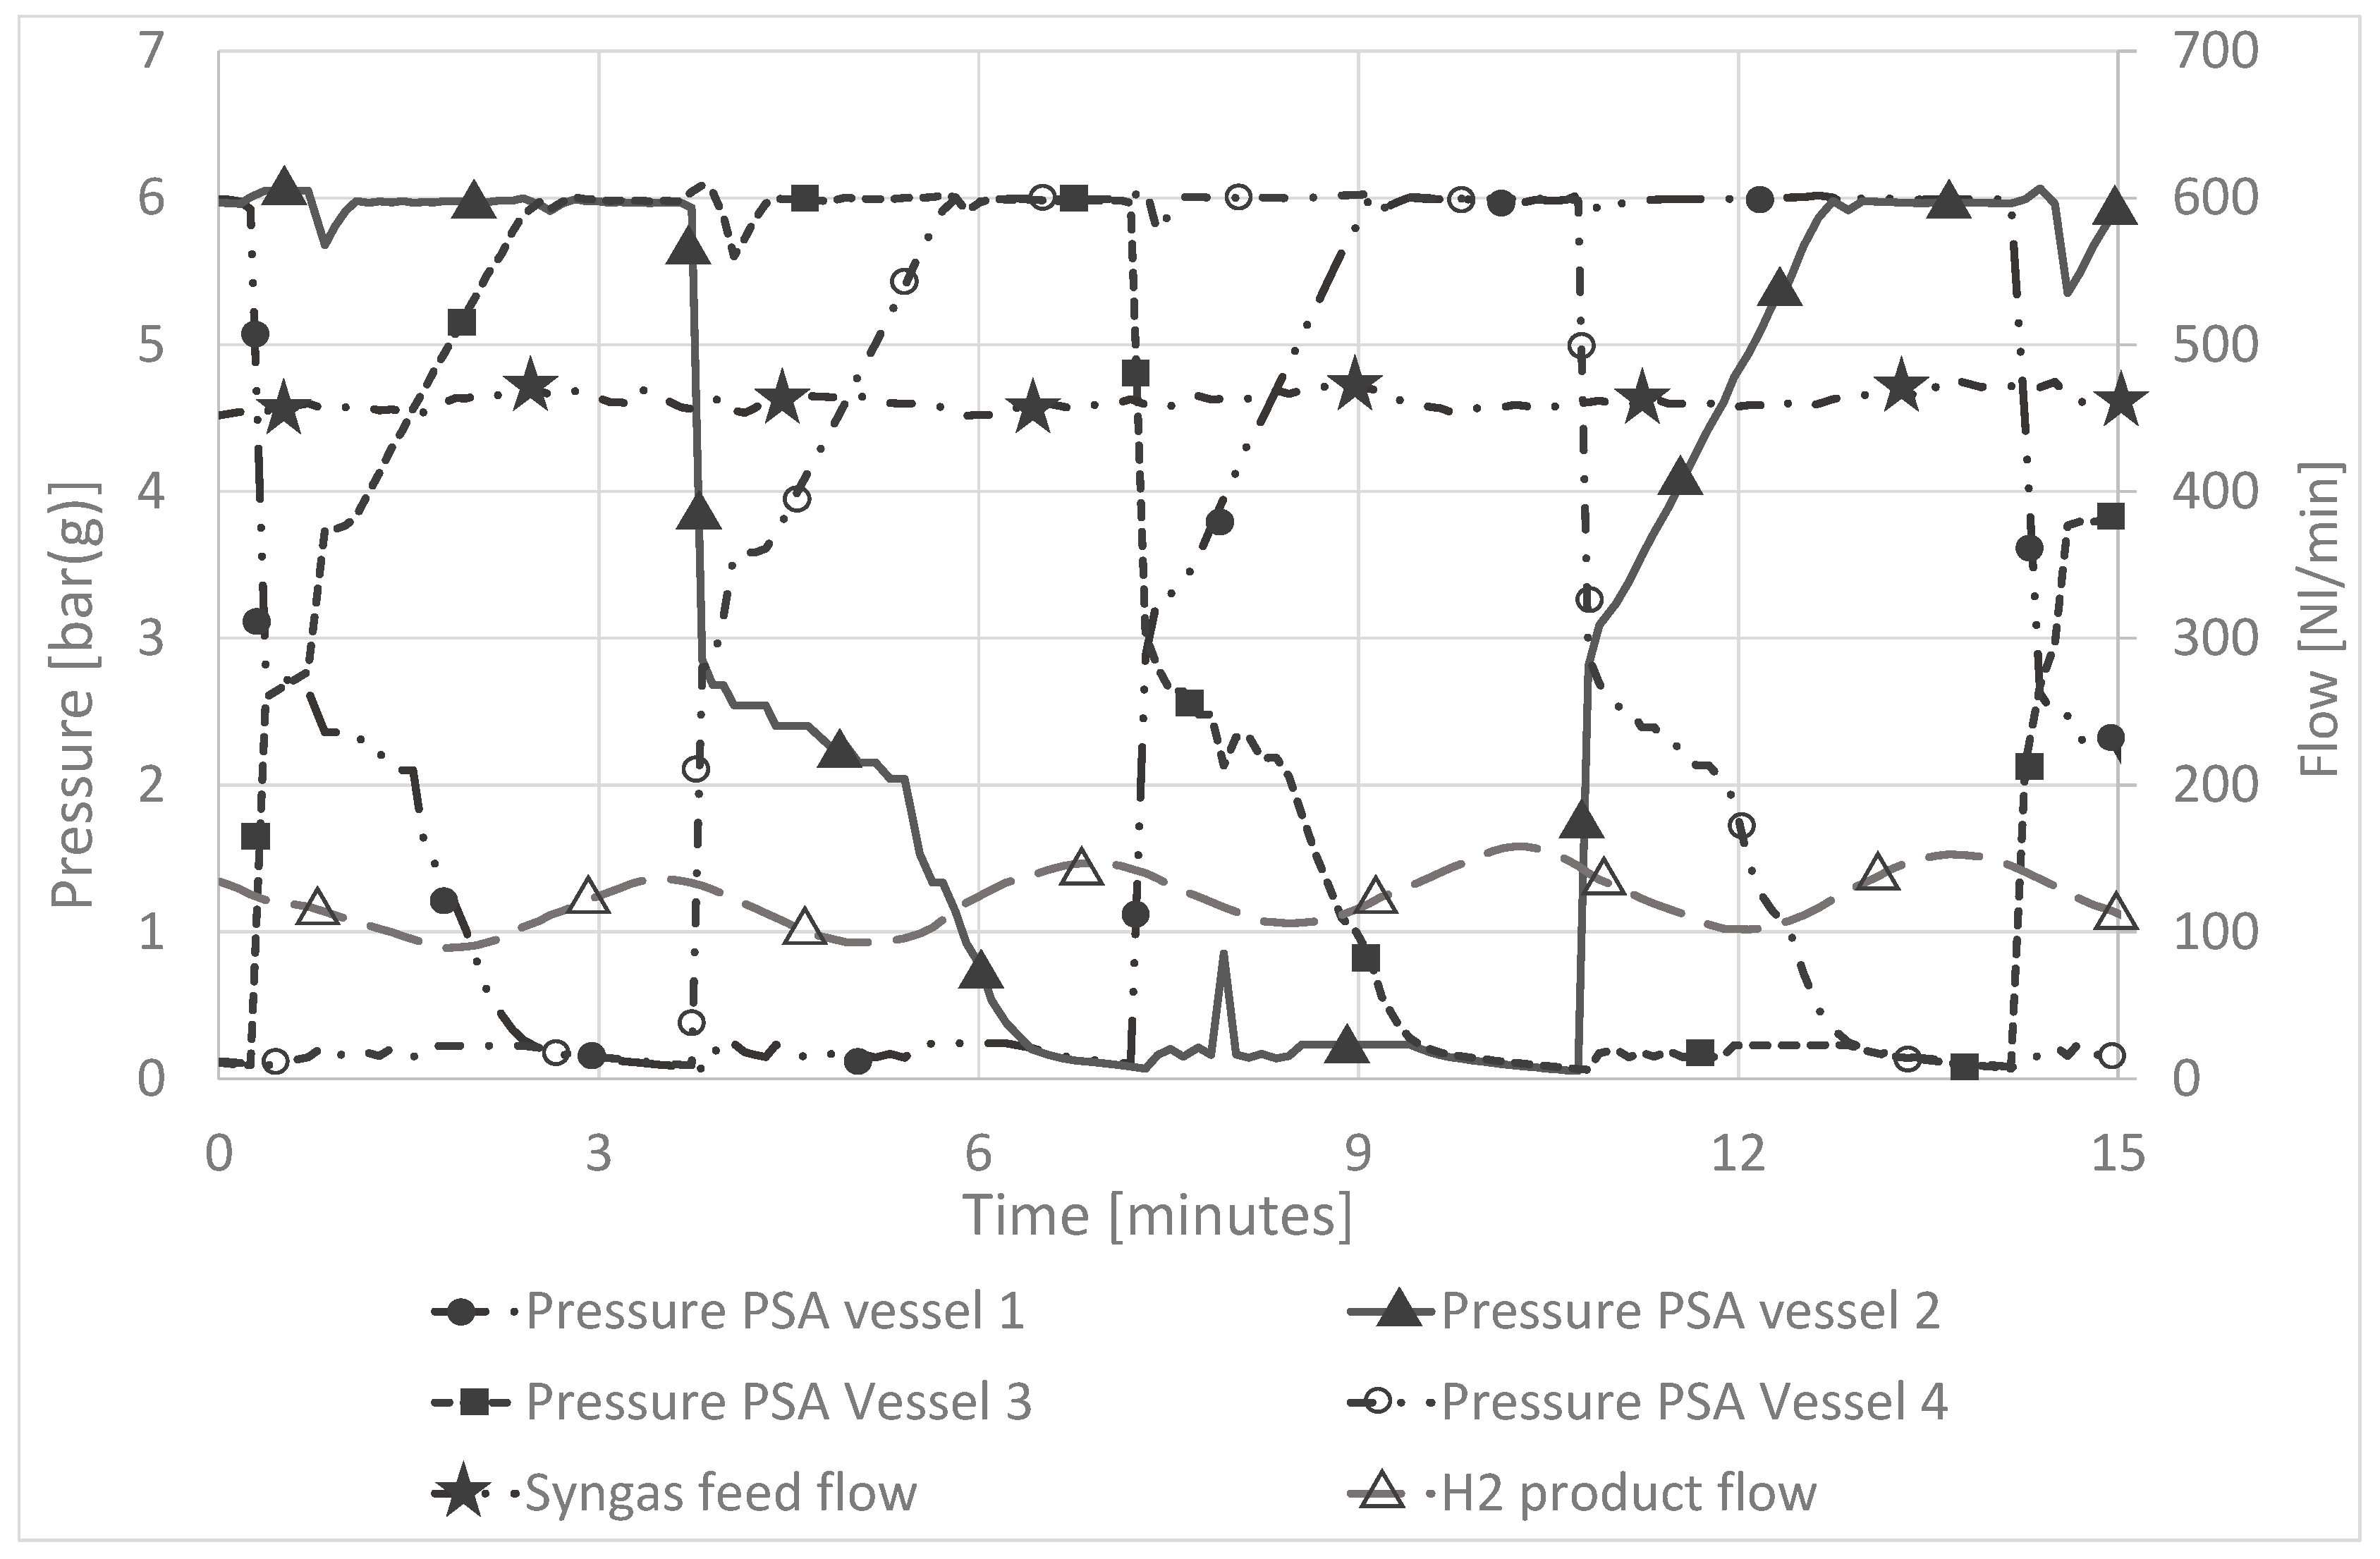
3.1.2. Operation of the PPS Unit with Real Product Gas from Biomass Gasification

Since the dry composition of the produced gas at the gasifier remained stable during the ultimate experimental campaigns, to evaluate the performance of the portable purification system (PPS) toward the H2 production at FCV grade, the designated stream from the catalytic candles was send to the PPS. During this experimental campaign, tests at two different PSA settings, hereafter referred to as «Condition 1» and «Condition 2», were carried out by changing the section operation cycle time. «Condition 1» was set so as to achieve the goal of producing a H2 stream at the highest purity grade, consistent with the application in fuel cell vehicles (i.e., 4.0 H2 quality). During «Condition 2», the PSA was operated at an increased cycle time to allow for an increased H2 yield, eventually to the detriment of its purity grade. The assessments were carried out based on a gas flow rate of 470 NL/min (dry basis) to the PPS. This flow rate was set by partializing the syngas stream addressed to the PPS through a control valve. This latter was back-adjusted from the system unit controller to allow for its smooth and stable operation. The excess gas stream was sent to a flare for disposal via combustion.
The PSA pressure profiles during the cycles relevant to «Condition 1» runs are shown in Figure 9, by way of illustration. In the figure, the syngas feeding rate (blue line) and the H2 flow (green line) produced are also included. Clearly, it can be observed that the pressures of the adsorber vessels cycle between 6 bar g and 0 bar g, i.e., adsorption and desorption, respectively.
At «Condition 1», the operation of the unit was characterized by an operation of more than four adsorption cycles (thus, more than one full PSA cycle) within an interval of 15 min. The feed flow allowed the production of an average of 101 Nl H2/min, as deduced from the sine wave of the H2-produced flow. The gas chromatography measurements showed that the H2 purity was higher than 99.99%-v.
At «Condition 2», an average of 125 Nl H2/min was produced, thus confirming the expected increase in the H2 yield. Obviously, at these PSA conditions, the number of cycles in the 15-min reference interval was less than four.
By way of example, in Figure 10, the dry gas compositions of the two main gas streams exiting the PSA, i.e., H2 and off gas, are presented.
The gas measurements of the hydrogen stream, produced under the second conditions, showed that the H2 purity was still higher than 99.99%-v, i.e., 4.0 H2 quality.

3.1.3. Simulation vs. Experimental Results

The simulation was carried out considering 1 MWth as the input and setting 800 °C during the gasification process, keeping as S/B and ER the average of the experimental inputs listed in Table 3 for test I and test II, respectively.
The syngas composition before entering the PPS is shown in Table 8, for test I and test II, and it was evaluated against the experimental results.
The comparison between the results coming from the simulation and experimentation presents values in pretty good agreement. The increasing hydrogen concentration, both in the simulation and experimental results, due to the increasing of the S/B ratio, is due to the water–gas reaction, which is more favorable thanks to the higher extent of the steam. However, the data from the simulative model are higher since the thermodynamic model overestimates these values. Regarding the methane, the variation in under- or overproduction in simulative modelling is an ordinary issue, due to neglecting the tar formation in the equilibrium models [32]. Concerning the concentration of the carbon monoxide and carbon dioxide, that are lower and higher, respectively, in the experimental results rather than in the simulation results, this is due to the temperature effect. In fact, the temperature was kept fixed at 800 °C in the simulation, but in the experimental test it actually fluttered. The variation of temperature was higher with respect to the variation of S/B, such that the temperature had the main influence. So, in the simulation results, the CO concentration increased due to the endothermic reactions R2 (water–gas) and R5 (steam methane reforming), and the CO2 concentration decreased depending on reaction R4 (water–gas shift), which is exothermic.
At the exit of the WGS block, the concentration of hydrogen is 51%. The PSA unit, which is simulated to operate at 60 °C and six bar with a separation efficiency for hydrogen of 70%, allows the achievement of a hydrogen recovery ratio of 48%, calculated as the ratio of hydrogen obtained out of PSA with respect to the biomass input.

4. Conclusions

An integrated prototype facility based on an intensified gasification process and a portable purification system (PPS) for gas conditioning and separation was operated to prove the possibility of producing H2 at FC vehicle grade from biomass feedstocks under relevant conditions.
The tests were carried out by operating the plant under steam/oxygen conditions and with the PPS unit in line. The experimental campaigns were successful; thus, proving the possibility of operating the integrated system in stable conditions, also in the presence of the innovative system for gas filtration to take place directly into the reactor freeboard. It was not possible, however, to evaluate the benefits of the presence of the Ni-containing pellets for gas upgrading. This is probably due to the deviation of the operating conditions achieved for the pellet-filled candles from the technical specifications required by the product. As for the specific objective of H2 production, overall, the collected results showed that it is possible to successfully integrate a low-pressure biomass gasifier, producing low H2 concentration syngas, with a commercially available PSA system. Based on the flow rate and composition of the gas addressed to the PPS, the experimental data indicated that a 66.4% hydrogen yield at 4.0 H2 quality (99.99%-v) could be achieved with the system.
A simulative model of the plant was developed by means of the Aspen Plus software. The results coming from the simulation were validated against the experimental data, showing that the values were in pretty good agreement, even if the data from the simulative model were higher since the thermodynamic model overestimates these values.
The production of an off-gas fuel highlights the possibility for overall process improvements. In this sense, two major approaches can be envisaged. That is, an adjustment of the process favoring maximum hydrogen yield or, alternatively, the use of such fuel for power production, to be used directly at the plant or for grid feeding. Evaluations of such scenarios require a specific study that was beyond the scope of this paper. This investigation will be the subject of a future work.

Author Contributions

Conceptualization, methodology, writing—original draft, writing—review & editing and supervision: D.B.; Conceptualization, methodology, investigation, data curation and validation: G.C. (Giuseppe Canneto), Investigation, data curation, formal analysis and validation: F.N. Investigation, data curation, resources and validation: A.V. Methodology, investigation, data curation and formal analysis: E.F. and C.F. Investigation, data curation and resources: M.G. Investigation, data curation, formal analysis and validation: A.L. Methodology, investigation, data curation and supervision: G.C. (Giacinto Cornacchia). Methodology and supervision: G.B. Methodology, software, formal analysis, writing—original draft, writing—review & editing: V.M. Conceptualization, methodology, writing—review & editing and supervision: E.B. Conceptualization and supervision: C.C. Conceptualization, methodology, writing—review & editing and supervision: M.R. Investigation, data curation, formal analysis and supervision: T.O. Conceptualization and supervision: S.H. and P.U.F. All authors have read and agreed to the published version of the manuscript.

Funding

This research was funded by the Fuel Cells and Hydrogen Joint Undertaking and Horizon 2020 programmes under grant agreements 299732 and 815284, respectively.

Institutional Review Board Statement

Not applicable.

Informed Consent Statement

Not applicable.

Data Availability Statement

All data are reported in the paper.

Conflicts of Interest

The authors declare no conflict of interest.

Nomenclature

CHPCombined Heat and Power
DTDeformation Temperature
EREquivalence Ratio
FTFlow Temperature
HTHemisphere Temperature
HHVHigher Heating Value
LHVLower Heating Value
PSAPressure Swing Adsorption
PPSPortable Purification System
S/BSteam to Biomass ratio
SSTShrinkage Starting Temperature
WGSWater Gas Shift

References

  1. Pala, L.P.R.; Wang, Q.; Kolb, G.; Hessel, V. Steam gasification of biomass with subsequent syngas adjustment using shift reaction for syngas production: An Aspen Plus model. Renew. Energy 2017, 101, 484–492. [Google Scholar] [CrossRef]
  2. Bocci, E.; Sisinni, M.; Moneti, M.; Vecchione, L.; Di Carlo, A.; Villarini, M. State of Art of Small Scale Biomass Gasification Power Systems: A Review of the Different Typologies. Energy Procedia 2014, 45, 247–256. [Google Scholar] [CrossRef] [Green Version]
  3. Thapa, S.; Bhoi, P.R.; Kumar, A.; Huhnke, R.L. Effects of syngas cooling and biomass filter medium on tar removal. Energies 2017, 10, 349. [Google Scholar] [CrossRef] [Green Version]
  4. Orecchini, F.; Bocci, E. Biomass to hydrogen for the realization of closed cycles of energy resources. Energy 2007, 32, 1006–1011. [Google Scholar] [CrossRef]
  5. Bocci, E.; Carlo, A.D.; Marcelo, D. Power plant perspectives for sugarcane mills. Energy 2009, 34, 689–698. [Google Scholar] [CrossRef]
  6. Marcantonio, V.; De Falco, M.; Capocelli, M.; Bocci, E.; Colantoni, A.; Villarini, M. Process analysis of hydrogen production from biomass gasification in fluidized bed reactor with different separation systems. Int. J. Hydrogen Energy 2019, 44, 10350–10360. [Google Scholar] [CrossRef]
  7. Li, X.T.; Grace, J.R.; Lim, C.J.; Watkinson, A.P.; Chen, H.P.; Kim, J.R. Biomass gasification in a circulating fluidized bed. Biomass Bioenergy 2004, 26, 171–193. [Google Scholar] [CrossRef]
  8. Basu, P. Biomass Gasification and Pyrolysis: Practical Design and Theory; Academic Press: Cambridge, MA, USA, 2010. [Google Scholar]
  9. Iversen, H.L.; Gøbel, B. Update on gas cleaning technologies. In Handbook Biomass Gasification; Biomass Technology Group: Enschede, The Netherlands, 2005. [Google Scholar]
  10. Reed, T.B. Principles and Technology of Biomass Gasification. Adv. Sol. Energy Annu. Rev. Res. Dev. 1985, 2, 125–174. [Google Scholar] [CrossRef]
  11. Qi, T.; Lei, T.; Yan, B.; Chen, G.; Li, Z.; Fatehi, H.; Wang ZBai, X.-S. Biomass steam gasification in bubbling fluidized bed for higher-H2 syngas: CFD simulation with coarse grain model. Int. J. Hydrogen Energy 2019, 44, 6448–6460. [Google Scholar] [CrossRef]
  12. Fremaux, S.; Beheshti, S.-M.; Ghassemi, H.; Shahsavan-Markadeh, R. An experimental study on hydrogen-rich gas production via steam gasification of biomass in a research-scale fluidized bed. Energy Convers. Manag. 2015, 91, 427–432. [Google Scholar] [CrossRef]
  13. Thao, N.T.N.L.; Chiang, K.-Y.; Wan, H.-P.; Hung, W.-C.; Liu, C.-F. Enhanced trace pollutants removal efficiency and hydrogen production in rice straw gasification using hot gas cleaning system. Int. J. Hydrogen Energy 2019, 44, 3363–3372. [Google Scholar] [CrossRef]
  14. Puig-Arnavat, M.; Bruno, J.C.; Coronas, A. Review and analysis of biomass gasification models. Renew. Sustain. Energy Rev. 2010, 14, 2841–2851. [Google Scholar] [CrossRef]
  15. An, H.; Song, T.; Shen, L.; Qin, C.; Yin, J.; Feng, B. Coal gasification with in situ CO2 capture by the synthetic CaO sorbent in a 1 kWth dual fluidised-bed reactor. Int. J. Hydrogen Energy 2012, 37, 14195–14204. [Google Scholar] [CrossRef]
  16. Klass, D.L. Energy Consumption, Reserves, Depletion, and Environmental Issues. In Biomass for Renewable Energy, Fuels, and Chemicals; Elsevier: Amsterdam, The Netherlands, 1998; pp. 1–27. [Google Scholar] [CrossRef]
  17. Sikarwar, V.S.; Zhao, M.; Clough, P.; Yao, J.; Zhong, X.; Memon, M.Z.; Shah, N.; Anthony, E.J.; Fennell, P.S. An overview of advances in biomass gasification. Energy Environ. Sci. 2016, 9, 2939–2977. [Google Scholar] [CrossRef] [Green Version]
  18. Farzad, S.; Mandegari, M.A.; Görgens, J.F. A critical review on biomass gasification, co-gasification, and their environmental assessments. Biofuel Res. J. 2016, 3, 483–495. [Google Scholar] [CrossRef]
  19. Rauch, R.; Hrbek, J.; Hofbauer, H. Biomass gasification for synthesis gas production and applications of the syngas. Wiley Interdiscip. Rev. Energy Environ. 2014, 3, 343–362. [Google Scholar] [CrossRef]
  20. Available online: https://ec.europa.eu/energy/sites/ener/files/hydrogen_strategy.pdf (accessed on 7 May 2022).
  21. Available online: https://ec.europa.eu/energy/topics/energy-system-integration/hydrogen_en (accessed on 27 May 2022).
  22. Caballero, M.A.; Corella, J.; Aznar, M.P.; Gil, J. Biomass gasification with air in fluidized bed. Hot gas cleanup with selected commercial and full-size nickel-based catalysts. Ind. Eng. Chem. Res. 2000, 39, 1143–1154. [Google Scholar] [CrossRef]
  23. Zhang, R.; Wang, Y.; Brown, R.C. Steam reforming of tar compounds over Ni/olivine catalysts doped with CeO2. Energy Convers. Manag. 2007, 48, 68–77. [Google Scholar] [CrossRef]
  24. Barisano, D.; Canneto, G.; Nanna, F.; Villone, A.; Fanelli, E.; Freda, C.; Grieco, M.; Cornacchia, G.; Braccio, G.; Marcantonio, V.; et al. Investigation of an Intensified Thermo-Chemical Experimental Set-Up for Hydrogen Production from Biomass: Gasification Process Performance—Part I. Process 2021, 9, 1104. [Google Scholar] [CrossRef]
  25. UNIQUE Cooperation Research Project, Contract N.211517 7FP. n.d.
  26. Bocci, E.; Di Carlo, A.; McPhail, S.J.; Gallucci, K.; Foscolo, P.U.; Moneti, M.; Villarini, M.; Carlini, M. Biomass to fuel cells state of the art: A review of the most innovative technology solutions. Int. J. Hydrogen Energy 2014, 39, 21876–21895. [Google Scholar] [CrossRef]
  27. Barisano, D.; Canneto, G.; Nanna, F.; Alvino, E.; Pinto, G.; Villone, A.; Carnevale, M.; Valerio, V.; Battafarano, A.; Braccio, G. Steam/oxygen biomass gasification at pilot scale in an internally circulating bubbling fluidized bed reactor. Fuel Process. Technol. 2016, 141, 74–81. [Google Scholar] [CrossRef]
  28. Available online: http://www.magnolithe.at/ (accessed on 7 May 2022).
  29. Fredriksson, H.O.A.; Lancee, R.J.; Thüne, P.C.; Veringa, H.J.; Niemantsverdriet, J.W.H. Olivine as tar removal catalyst in biomass gasification: Catalyst dynamics under model conditions. Appl. Catal. B Environ. 2013, 130, 168–177. [Google Scholar] [CrossRef]
  30. Lancee, R.J. Characterization and Reactivity of Olivine and Model Catalysts for Biomass Gasification. Ph.D. Thesis, Technische Universiteit Eindhoven, Eindhoven, The Netherlands, 2014. [Google Scholar] [CrossRef]
  31. Marcantonio, V.; Müller, M.; Bocci, E. A review of hot gas cleaning techniques for hydrogen chloride removal from biomass-derived syngas. Energies 2021, 14, 6519. [Google Scholar] [CrossRef]
  32. Marcantonio, V.; Bocci, E.; Ouweltjes, J.P.; Del Zotto, L.; Monarca, D. Evaluation of sorbents for high temperature removal of tars, hydrogen sulphide, hydrogen chloride and ammonia from biomass-derived syngas by using Aspen Plus. Int. J. Hydrogen Energy 2020, 45, 6651–6662. [Google Scholar] [CrossRef]
  33. Marcantonio, V.; Bocci, E.; Monarca, D. Development of a chemical quasi-equilibrium model of biomass waste gasification in a fluidized-bed reactor by using Aspen plus. Energies 2019, 13, 53. [Google Scholar] [CrossRef] [Green Version]
Figure 1. Schematic view of the 1 MWth gasification pilot plant coupled with the portable purification system (PPS).
Energies 15 04580 g001
Figure 2. Schematic view of the Portable Purification System.
Energies 15 04580 g002
Figure 3. Gasifier coupled with the containerized PPS.
Energies 15 04580 g003
Figure 4. Detail of ceramic candles filled with quadralobe-shaped pellets of commercial Ni-catalyst for simultaneous product gas filtration and composition upgrading.
Energies 15 04580 g004
Figure 5. Flow sheet of the model.
Energies 15 04580 g005
Figure 6. Comparison of average dry composition relevant to the gas streams exiting the catalytic and non-catalytic ceramic filter clusters. Gasification conditions according to Test I (refer to Table 1).
Energies 15 04580 g006
Figure 7. Comparison between the dry composition of the gaseous stream at the inlet of the PPS and addressed at the flare. Gasification conditions according to Test II (refer to Table 3).
Energies 15 04580 g007
Figure 8. Temperature profiles inside the gasification reactor: (a) trends during the Test II gasification campaign; (b) position of thermocouples for measurement along the gasifier (T1 and T9 temperatures inside the bed inventory, T2 freeboard area close to the fluidized bed material, T3 temperature near the top of the ceramic candles).
Energies 15 04580 g008
Figure 9. Representative PSA cycles at «Condition 1»: feed and produced gas flows can be recognized.
Energies 15 04580 g009
Figure 10. Gas chromatographic analysis of the main gaseous streams at the portable purification system (PPS): (a) stream at the exit of the PSA section (H2 at 99.99%-v); (b) dry gas composition of the product gas to the PPS inlet; (c) dry gas composition of the off gas from the PSA.
Energies 15 04580 g010
Table 1. Characteristics of the measuring process parameters adopted at the gasification plant.
Detection ToolRangeAccuracyStandard
TemperatureThermocouples K Types
Model Transmitter:
WT531 and WT532 Honeywell
0 to 1200 °CClass 2 precisionANSI MC 96.1,
IEC 60584-1, Class 2
PressurePressure Transmitter Honeywell
Models WG511
Type 316 Stainless Steel Base and Diaphragm
0 ÷ 3 bar±0.1% of full scale-
Mass FlowCalibrated Flanges
Model Transmitter:
WD520 and WD521 Honeywell
-2% of full-scaleISO 5167:2003 and
ASME MFC-14M-1995
Table 2. Characteristics of the measuring process parameters adopted at the portable purification system.
Detection ToolRangeAccuracyStandard
TemperatureThermocouples0 to 350 °CClass 2 precisionIEC 60584-1, Class 2
TC Type K
PressurePressure Transmitter
Danfoss
Model MBS 4701
Silicon based pressure transducer
Full scale = 10 bar≤±1%-
Mass Flow FeedVolume flow gas meter
Dresser
C-RM-G16
Rotary gas meter
MAX volumetric flow = 25 m3/h±2%ISO 5167:2003 and
ASME MFC-14M-1995
Mass Flow ProductMass Flow meter
Bürkert
2712 (156 262)
Thermal Mass Flow Controller
Full scale = 500 SL/min±0.3% full scale
Table 3. Overview of process operating conditions in the gasification campaign at the plan facility coupled to the PPS.
Operating ParameterTest ITest II
Feeding rate (kgar/h) a175135
Steam/Biomass (S/B) b0.5–0.60.65–0.7
Equivalence Ratio (ER) b0.24–0.250.22–0.25
a: ar: as received; humidity content: 10–12%wt; b: during the tests S/B and ER were adjusted in order to control the temperature inside the reactor.
Table 4. Physical and chemical characteristics of almond shells.
Bulk Density a (kg/m3)Humidity a (%wt)Chip Size Range (cm)
450 ± 3011 ± 22–3
Proximate Analysis a (%wt., dry basis)
AshVolatile MatterFixed Carbon b
1.23 ± 0.0680.6 ± 1.718.2 ± 1.8
Ultimate Analysis a (%wt., dry basis)
CHNO bClS
47.9 ± 0.76.3 ± 0.30.32 ± 0.0244.3 ± 1.10.012 ± 0.0020.015 ± 0.002
Heating values a (kJ/kgdry)
HHVLHV c
19,510 ± 8018,140 ± 140
a: each measurement was conducted in triplicate and the mean value was used as representative data; b: calculated as complement to 100; c: LHV(kJ/kg) = HHV(kJ/kg) − 212.2(kJ/kg) × H(%-wt.) − 0.8(kJ/kg) × (O(%-wt.) + N(%-wt.)).
Table 5. Characteristic temperatures for the ash-melting behavior of almond shells (CEN/TS 15370-1:2006).
Temperature (°C)SSTDTHTFT
915 ± 51000 ± 101180 ± 101210 ± 10
Table 6. Gasification reactions [6].
ReactionReaction NameHeat of ReactionReaction Number
Heterogeneous reaction
C + 0.5 O2 → COChar partial combustion(−111 MJ kmol−1)(R1)
C + H2O ↔ CO + H2Water–gas(+172 MJ kmol−1)(R2)
Homogeneous reactions
H2 + 0.5 O2 → H2OH2 partial combustion(−283 MJ kmol−1)(R3)
CO + H2O ↔ CO2 + H2Water–gas shift(−41 MJ kmol−1)(R4)
CH4 + H2O → CO + 3H2Steam-methane reforming(+206 MJ kmol−1)(R5)
Table 7. Description of ASPEN Plus flowsheet unit operation presented in Figure 5.
ASPEN Plus NameBlock IDDescription
RYIELDDECOMPYield reactor—converts the non-conventional stream “BIOMASS” into its conventional components
RSTOICRSTOICRStoic reactor—simulates the production of NH3 and H2S
CANDLERStoic reactor—simulates the catalyst filter reaction
TARPRODRStoic reactor—simulates the production of toluene and benzene
SEPSEPSeparator—separates the biomass into three streams: VOLATILE; CHAR; and INORG
SEPSEPH2Separator—separates 25% of hydrogen to produce tar
H2OREMOVSeparator—simulates a dryer which removes all the water
PSASeparator—simulates PSA process and extracts pure hydrogen with 70% efficiency
MIXERMIXMixer—mixes oxidizing fluid with VOL stream, that represents combustible fluid
MIX2Mixer—mixes the gas from gasifier with INORG and TAR streams
MIX3Mixer—mixes the stream S3 and H2
FSPLITSPLITSplitter—splits char unreacted (UNREACT), char to gasifier (TOGASIF) and char which occurs in tar production (S3)
GASIFGibbs free energy reactor—simulates drying, pyrolysis, partial oxidation and gasification and restricts chemical equilibrium of the specified reactions to set the syngas composition by specifying a temperature approach for individual reactions
REQUILH2SADSORREquil reactor—simulates the reaction of ZnO sorbent with H2S
WGSREquil reactor—simulates water gas shift reaction
COMPRESSORCOMPRCompressor—raises gas pressure upstream of PSA
Table 8. Experimental results vs. simulative results before entering the PPS unit.
Experimental ResultsSimulation Results
Test ITest IITest ITest II
S/B0.5–0.60.65–0.70.550.68
ER0.24–0.250.22–0.250.2450.235
H2 (%v, dry)283930.142.1
CO (%v, dry)302232.223.7
CO2 (%v, dry)223520.831.1
CH4 (%v, dry)735.41.9
Publisher’s Note: MDPI stays neutral with regard to jurisdictional claims in published maps and institutional affiliations.

