
Numerical Simulations for Indirect and Direct Cooling of 54 V LiFePO4 Battery Pack


Abstract
:1. Introduction
2. Modeling Method
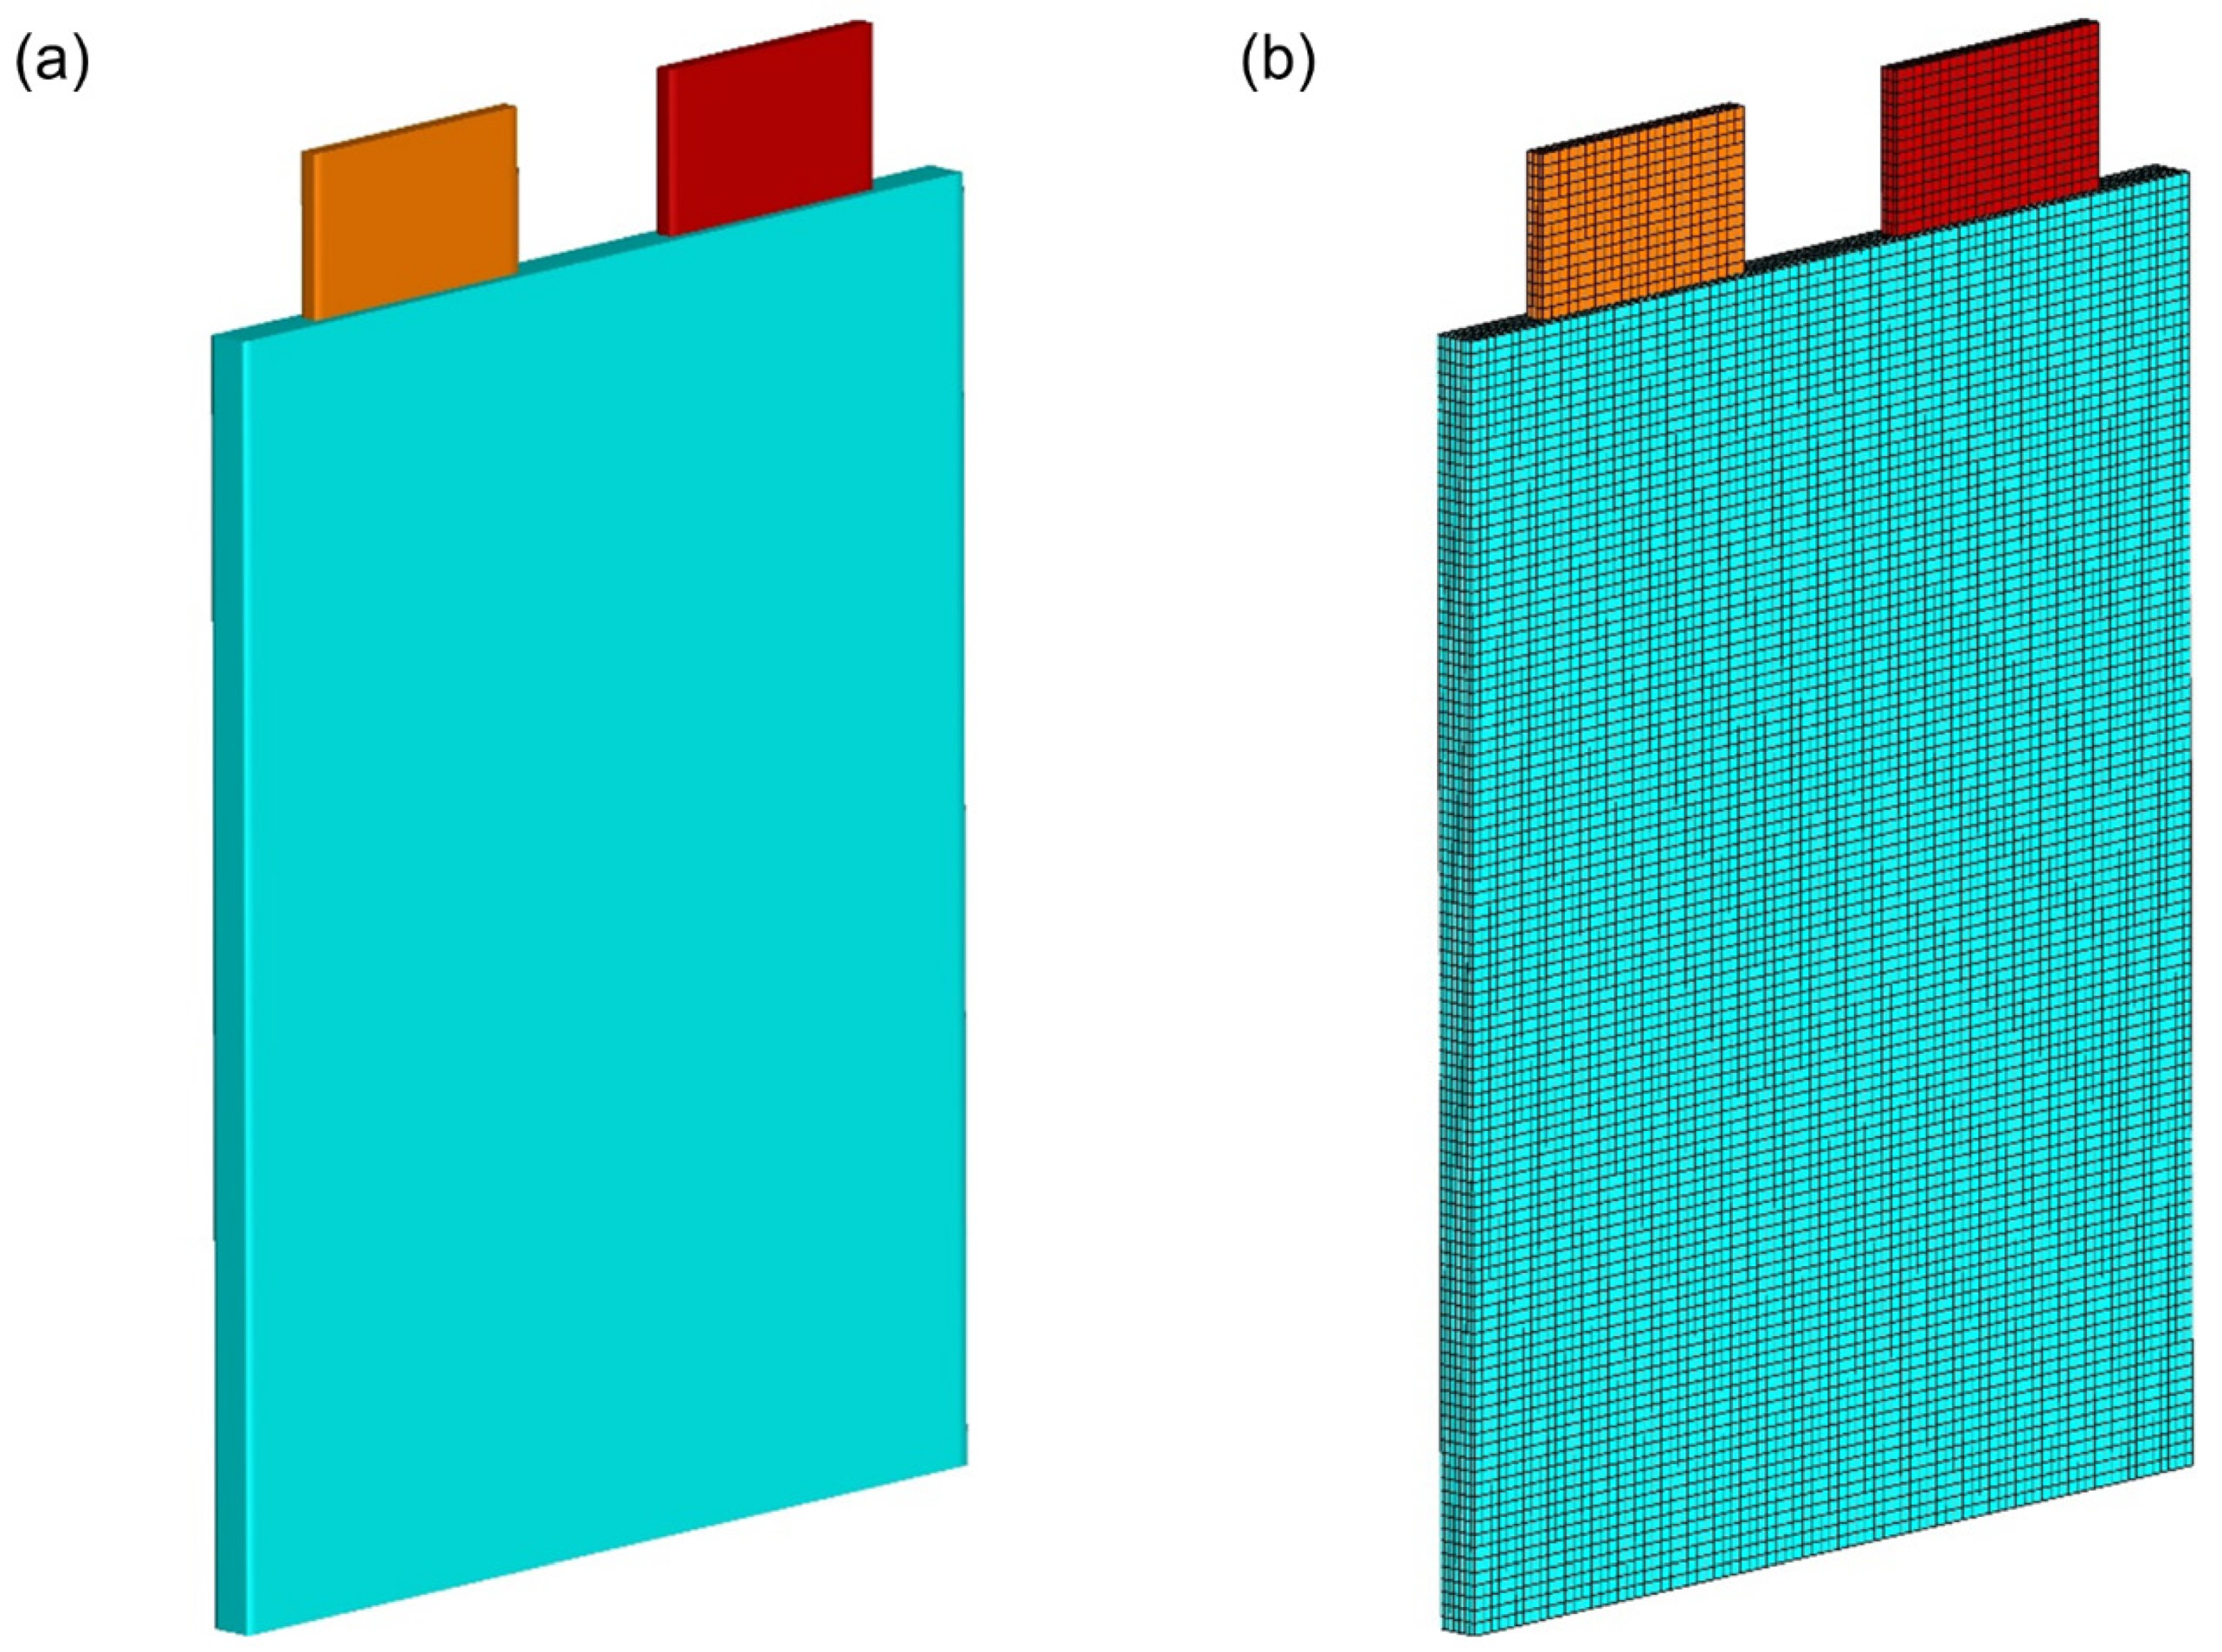
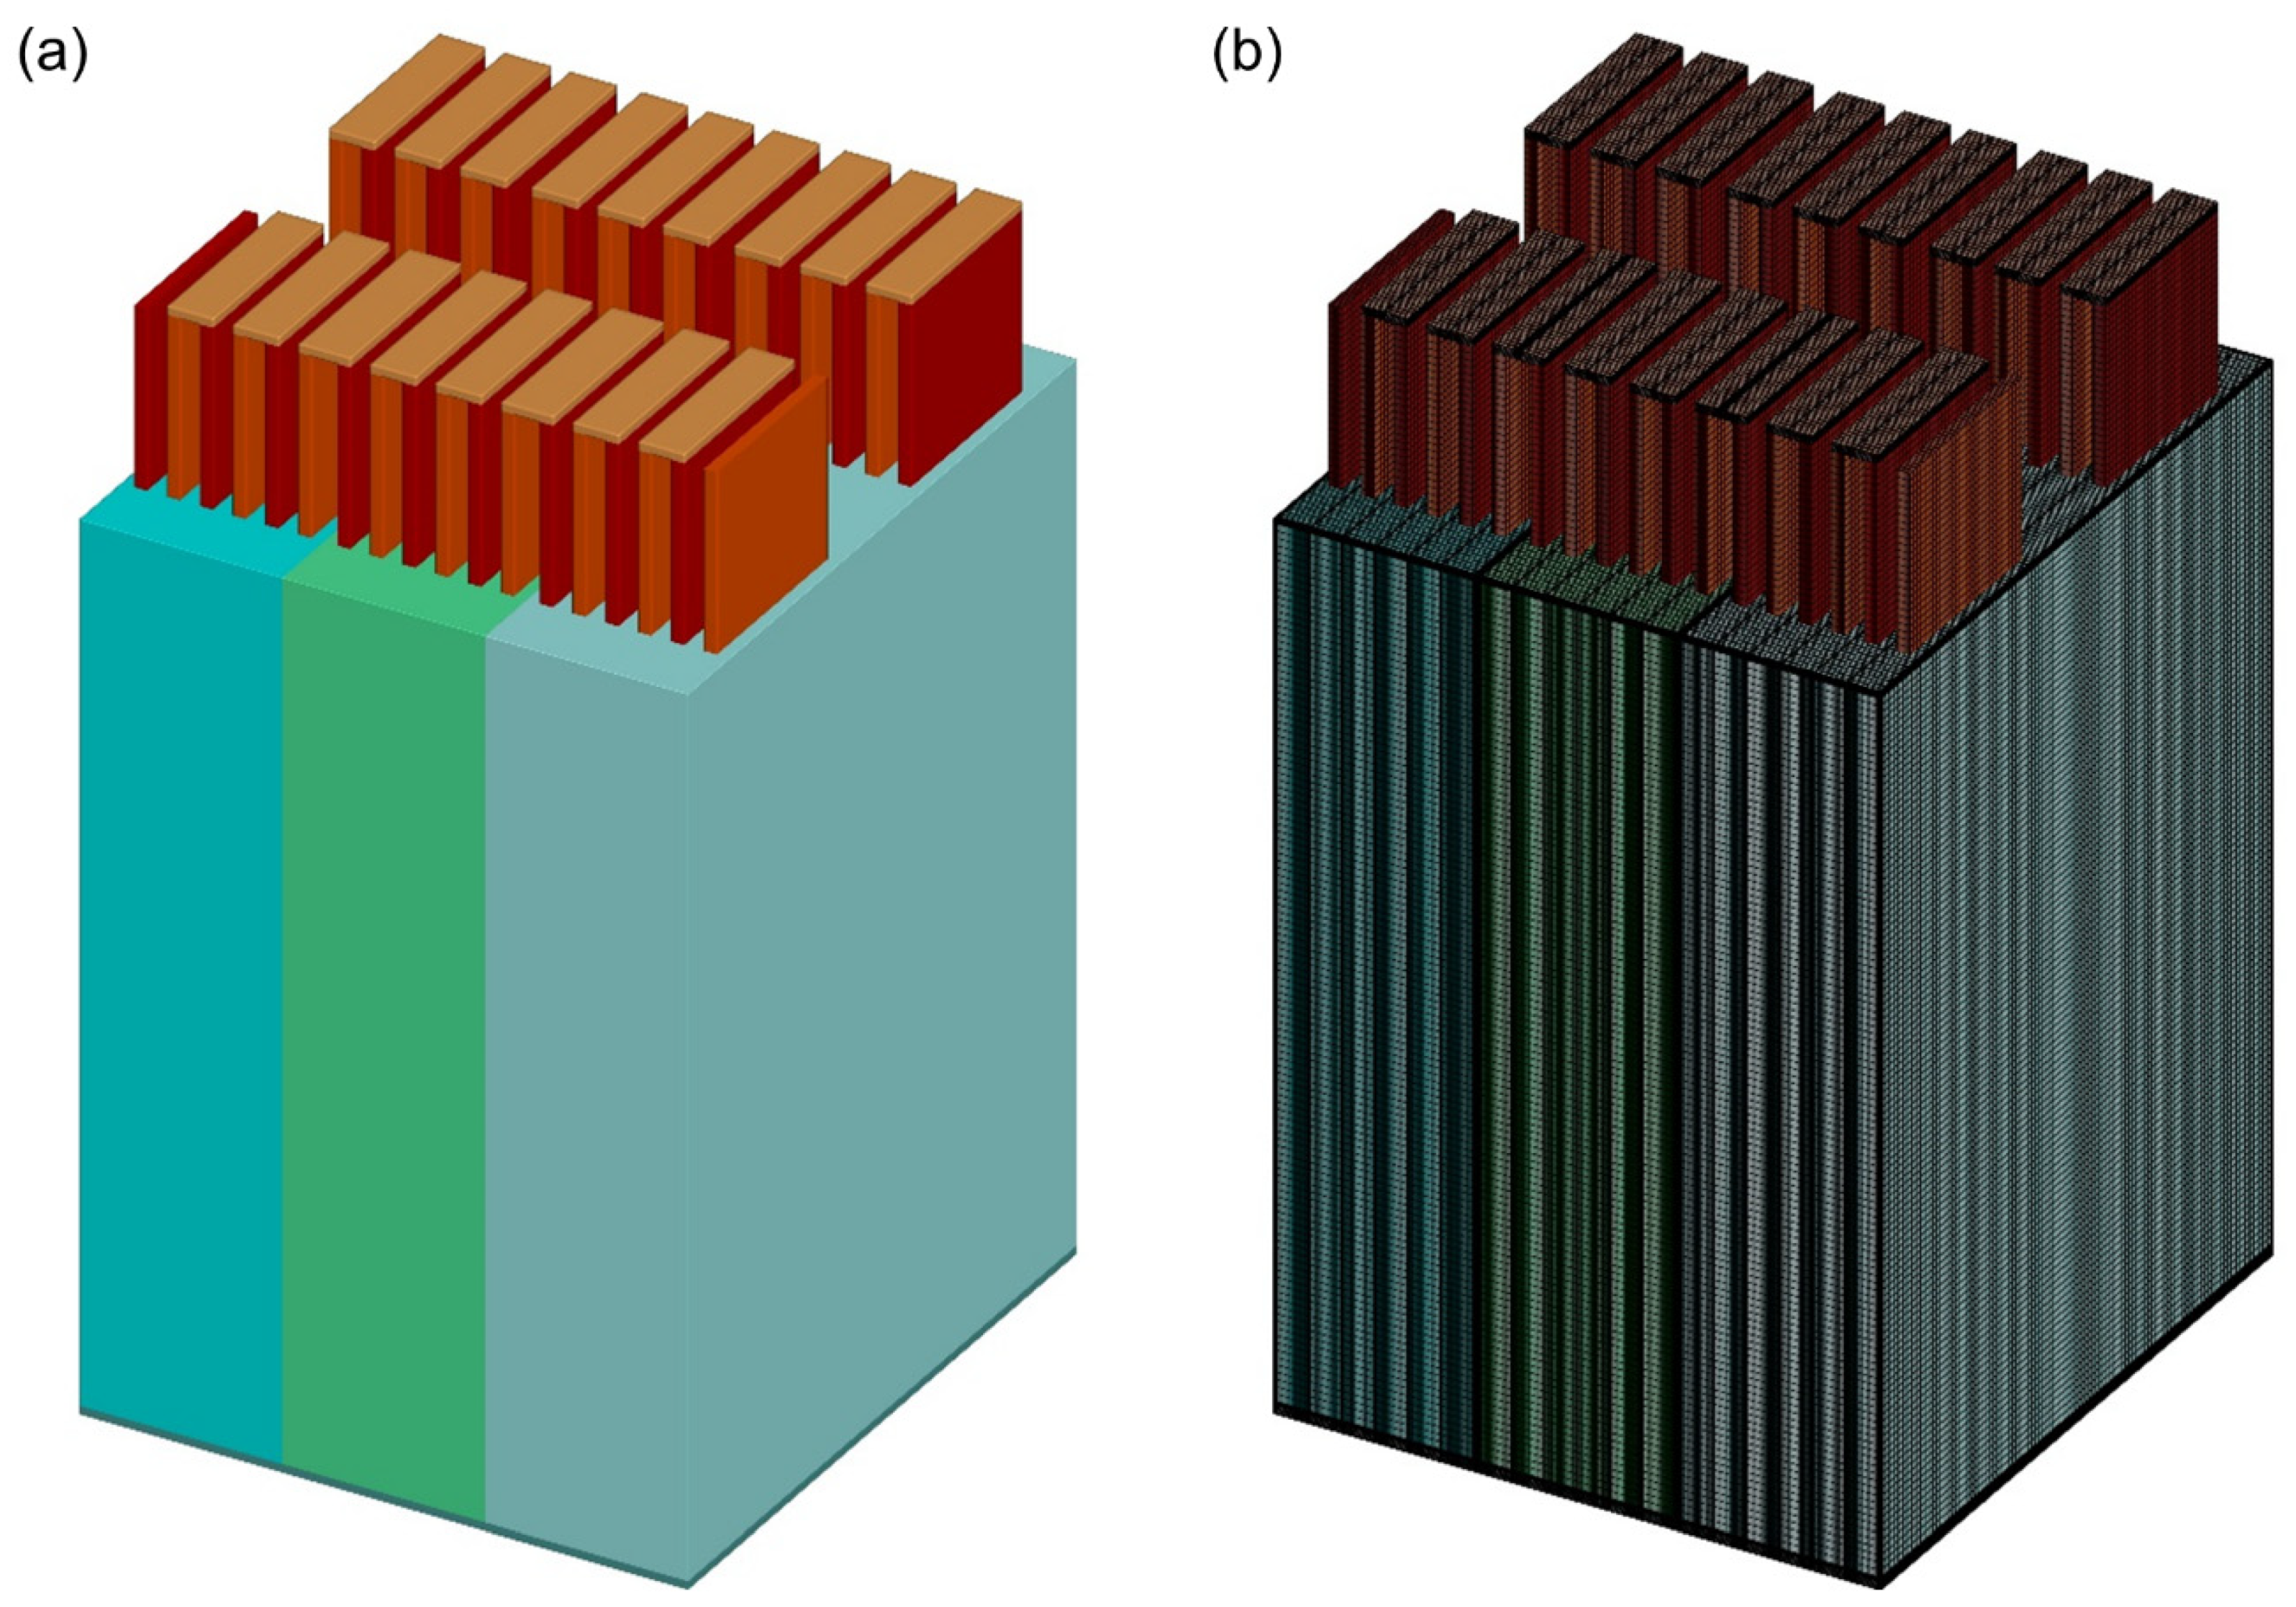
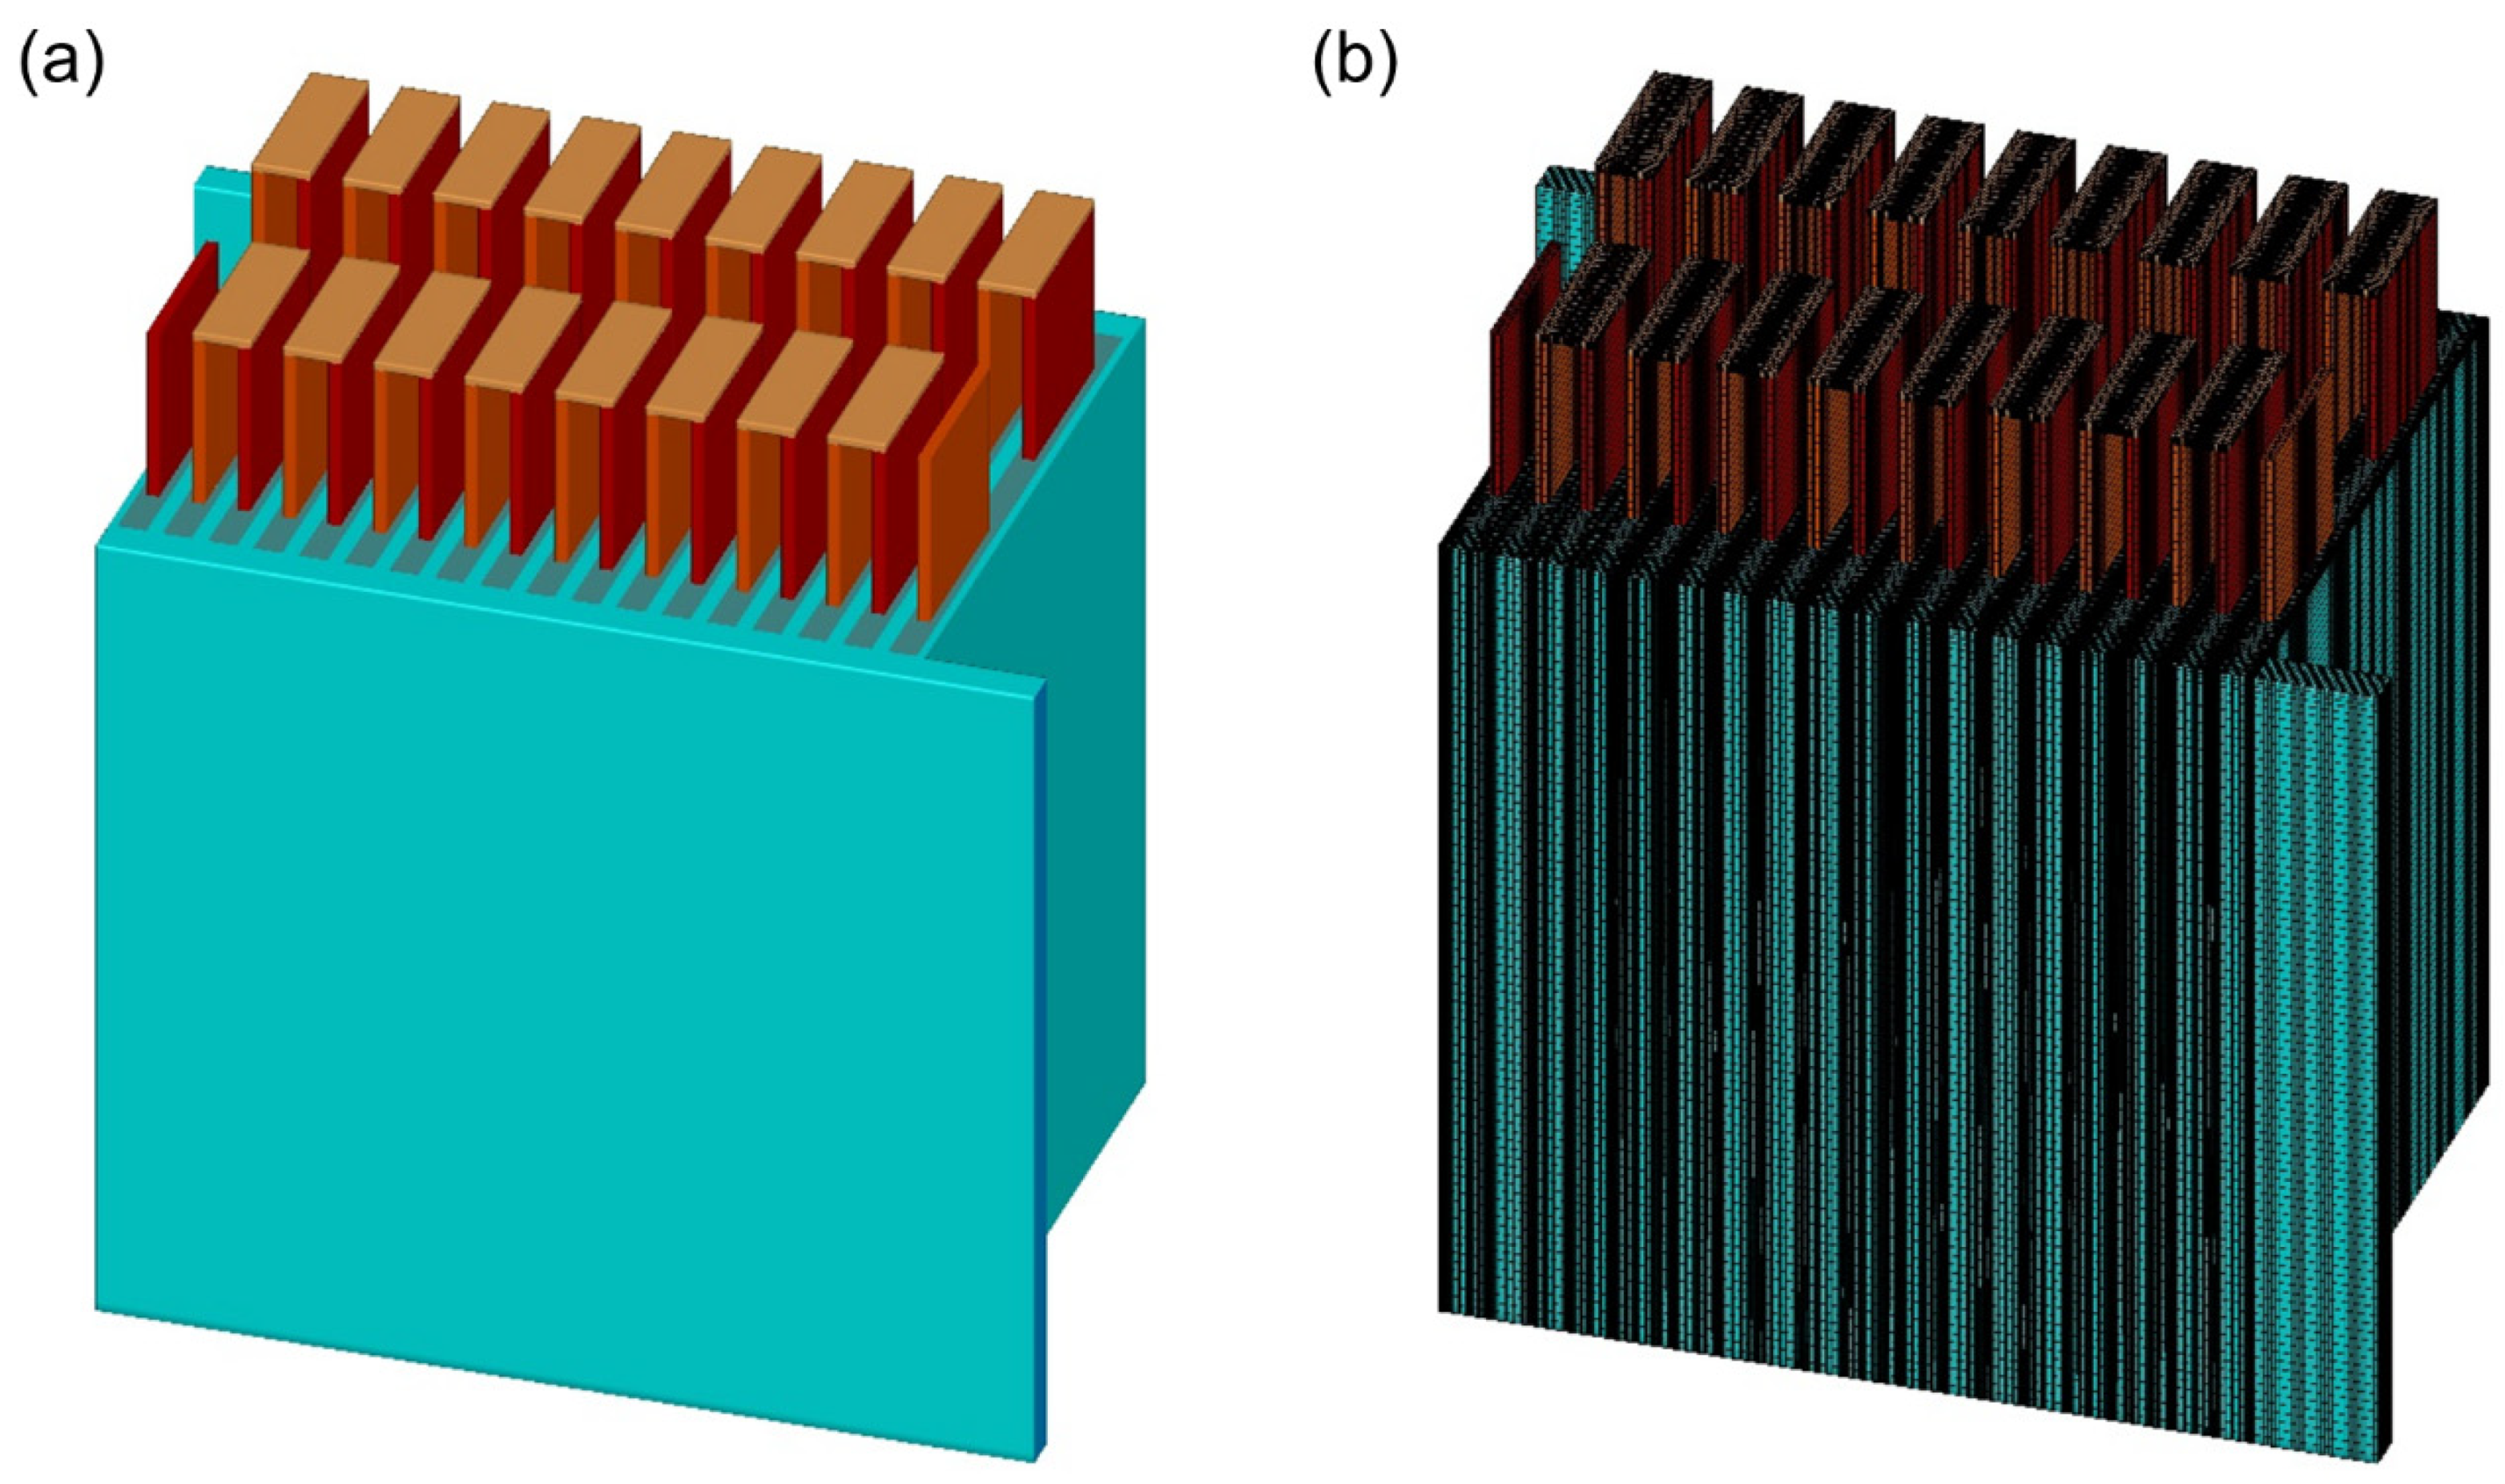
2.1. Model Building
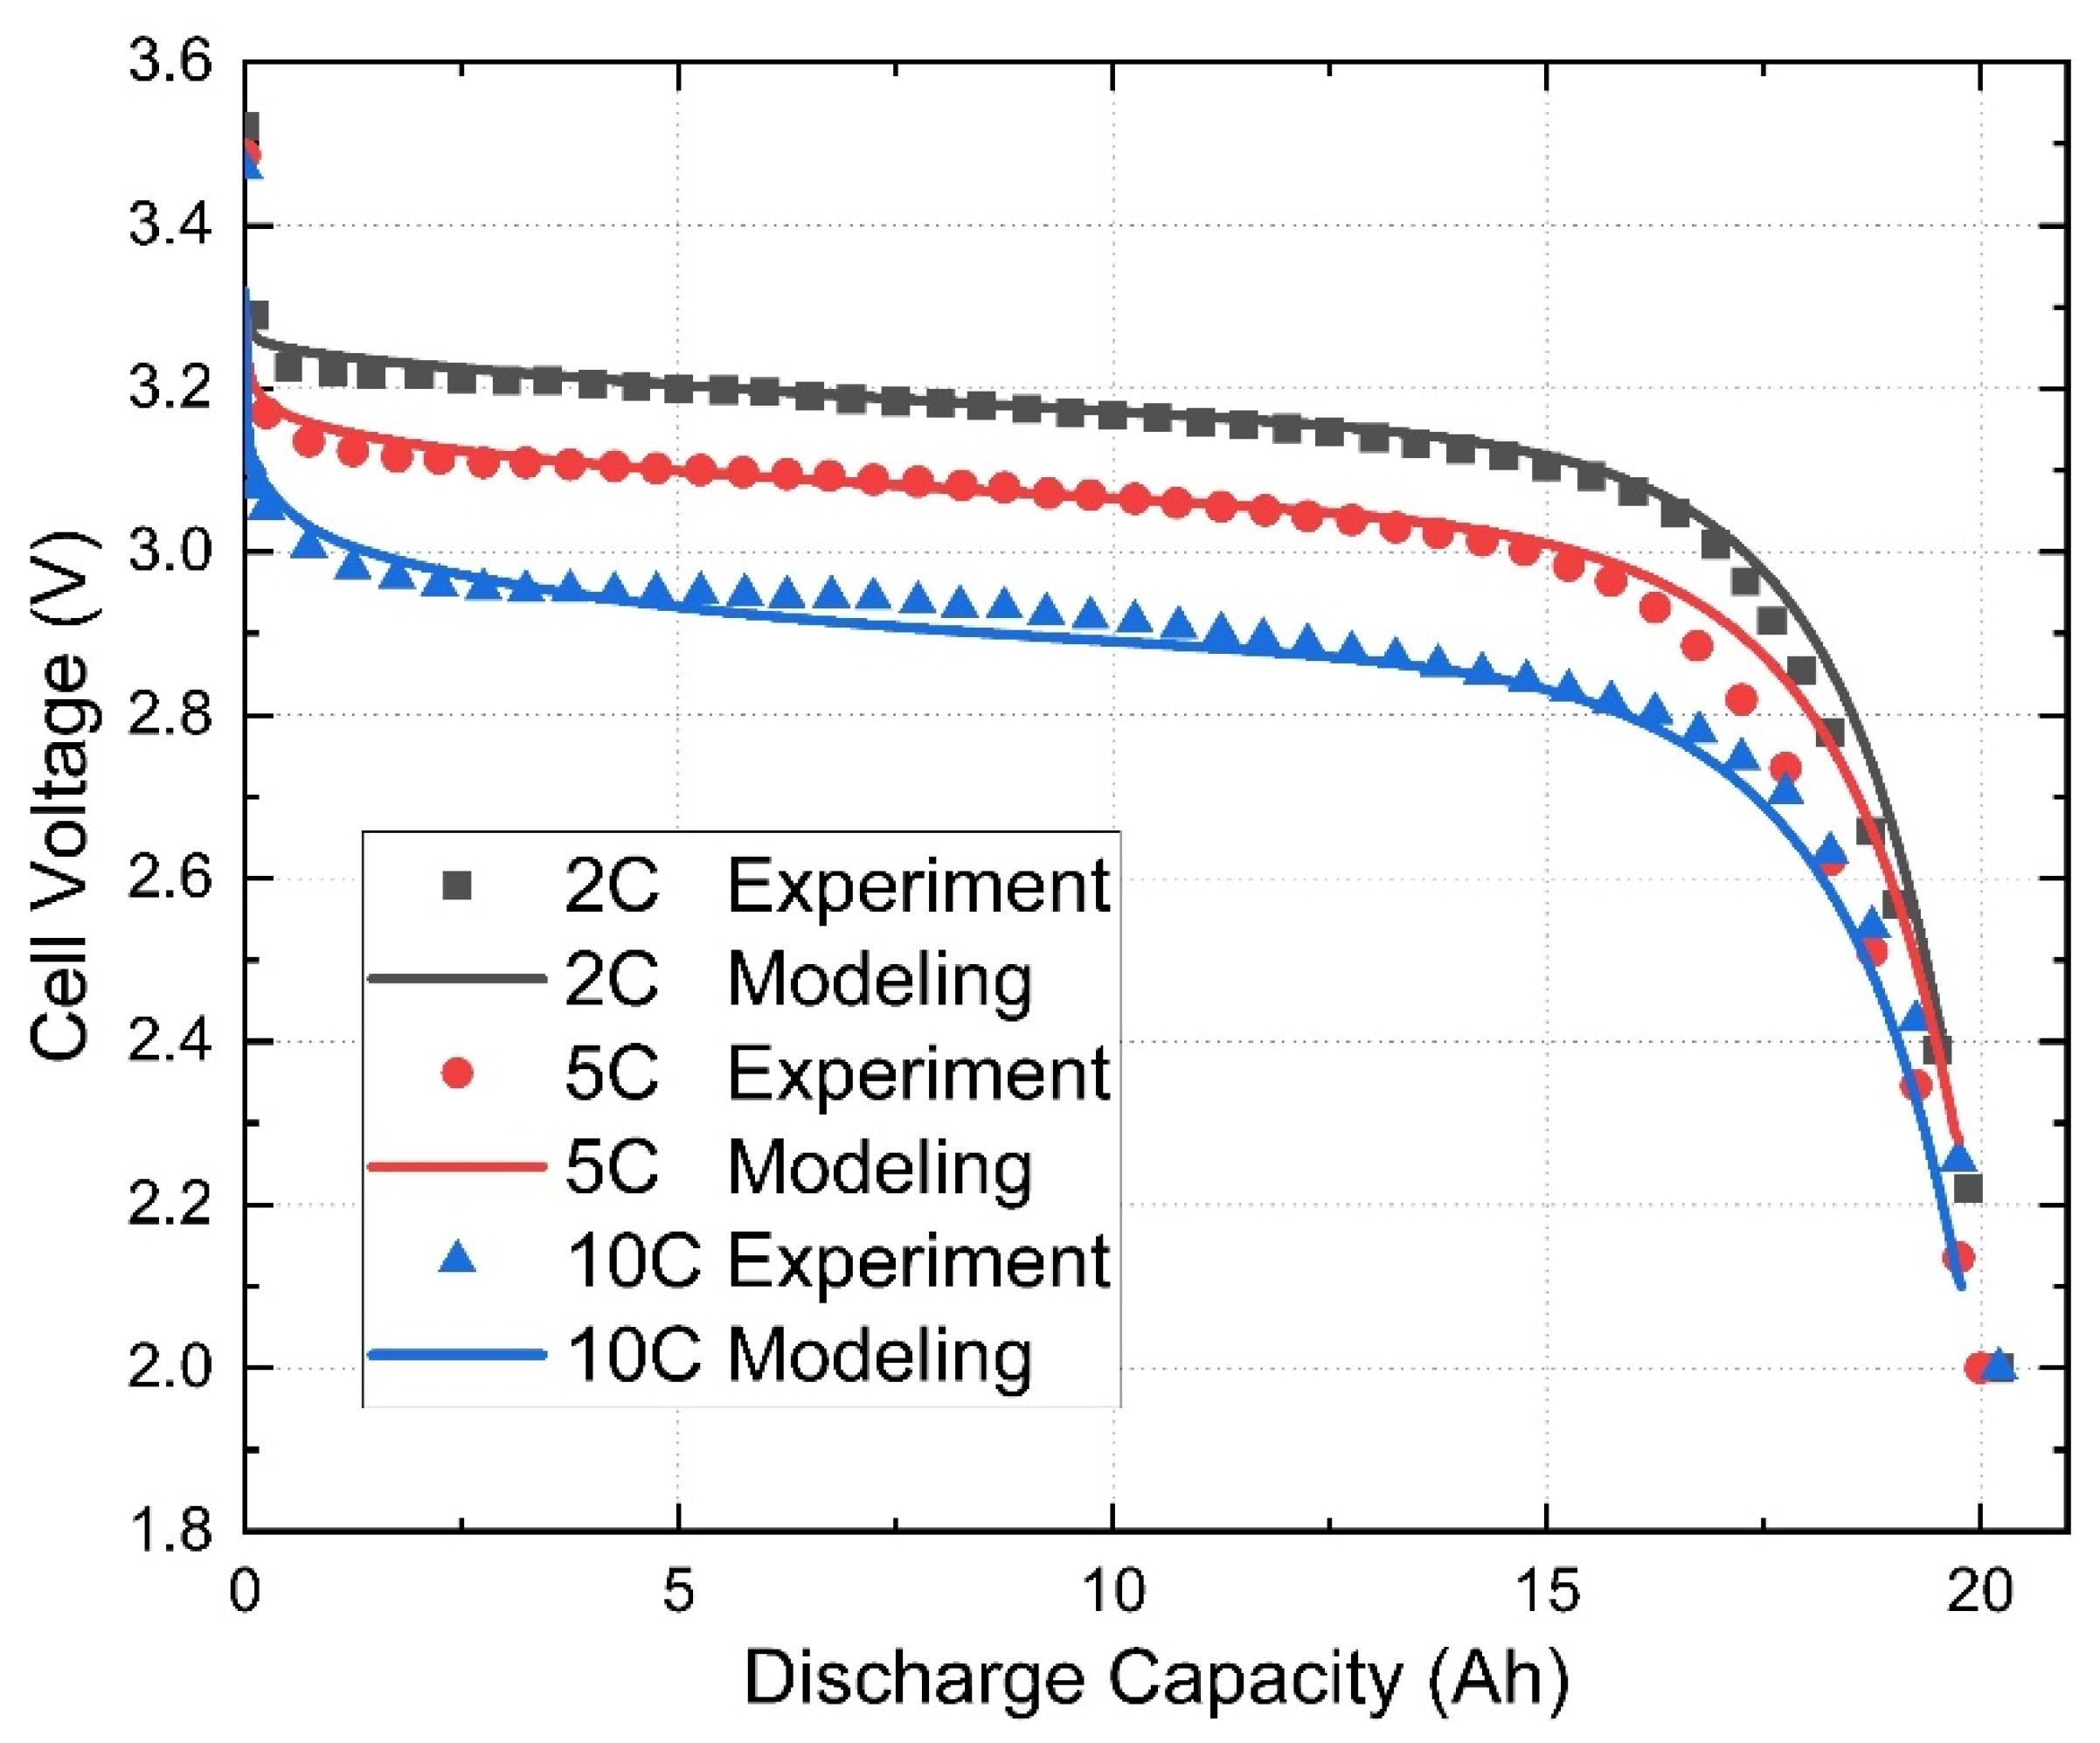
2.2. Multi-Scale Modeling Principle and Equivalent Circuit Model
3. Results and Discussions
3.1. Cooling of 54 V Battery Pack under Indirect Cooling
3.2. 54 V Battery Pack Discharging at High Rate under Single-Phase Direct Cooling
3.2.1. 54 V Battery Pack Discharging at High Rate under Air Cooling
3.2.2. 54 V Battery Pack Discharging at High Rate under Fluorinated Liquid Single-Phase Cooling
3.3. 54 V Battery Pack Discharging at High Rate under Fluorinated Fluid Two-Phase Cooling
4. Conclusions
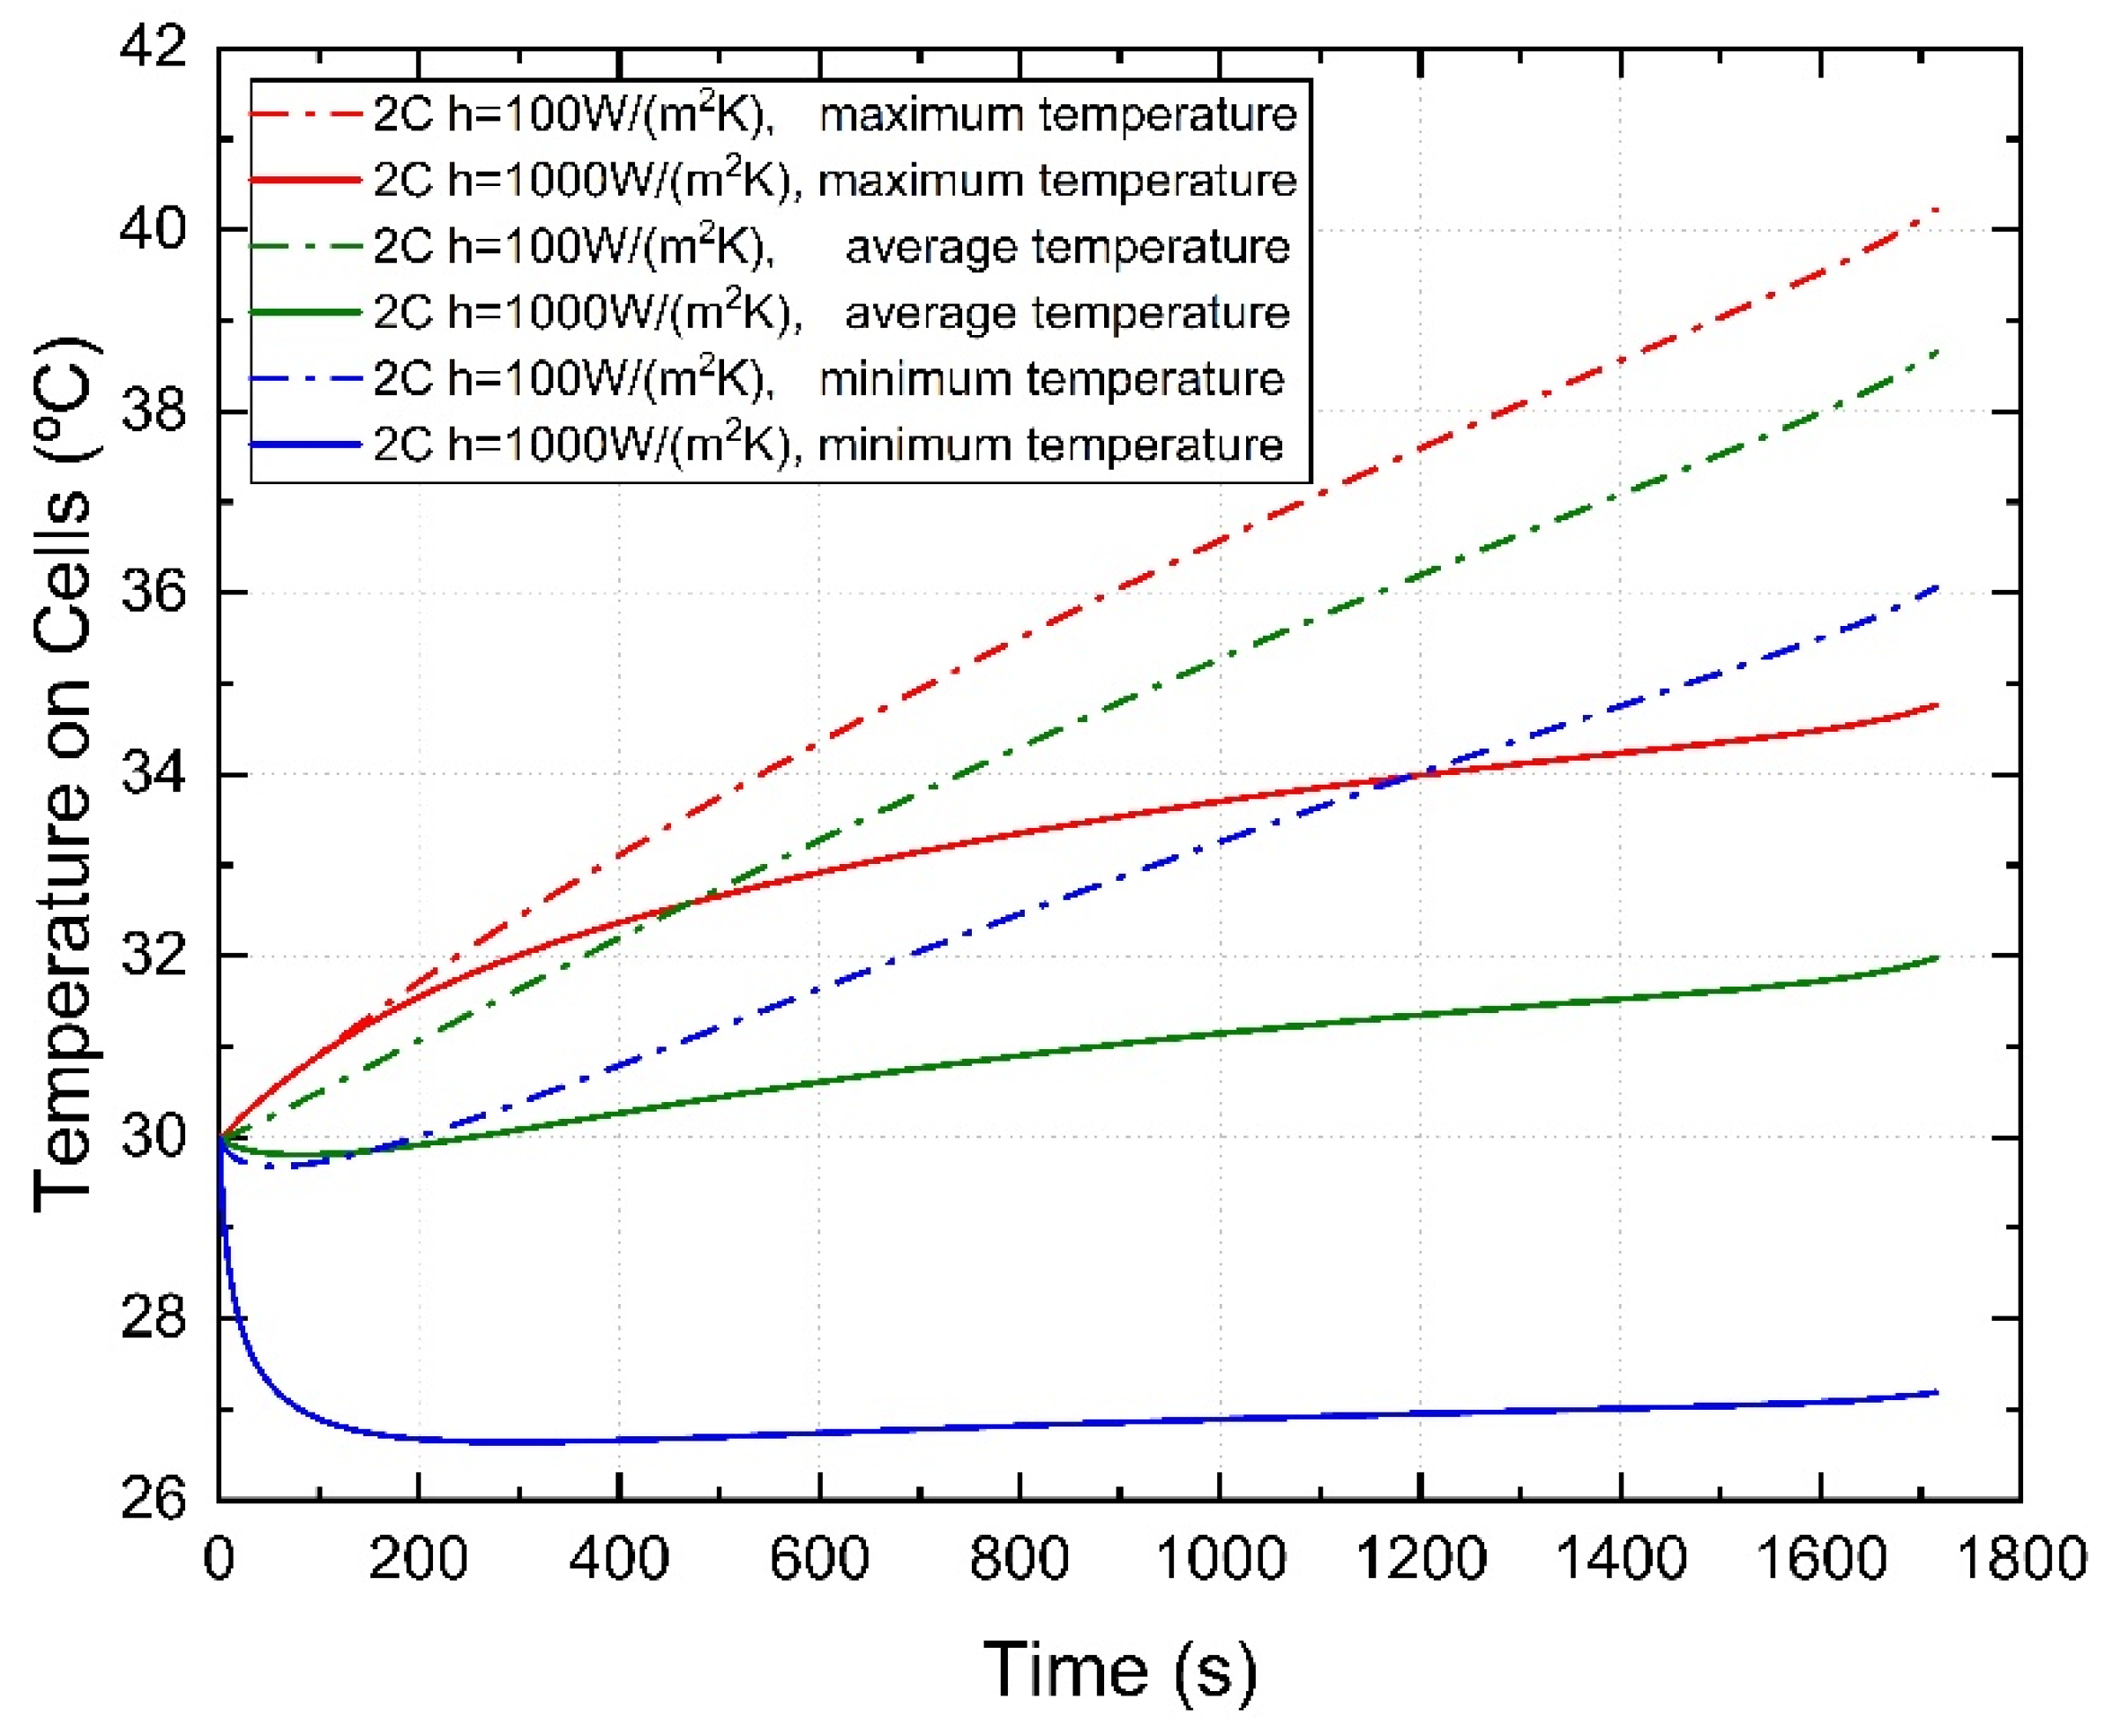
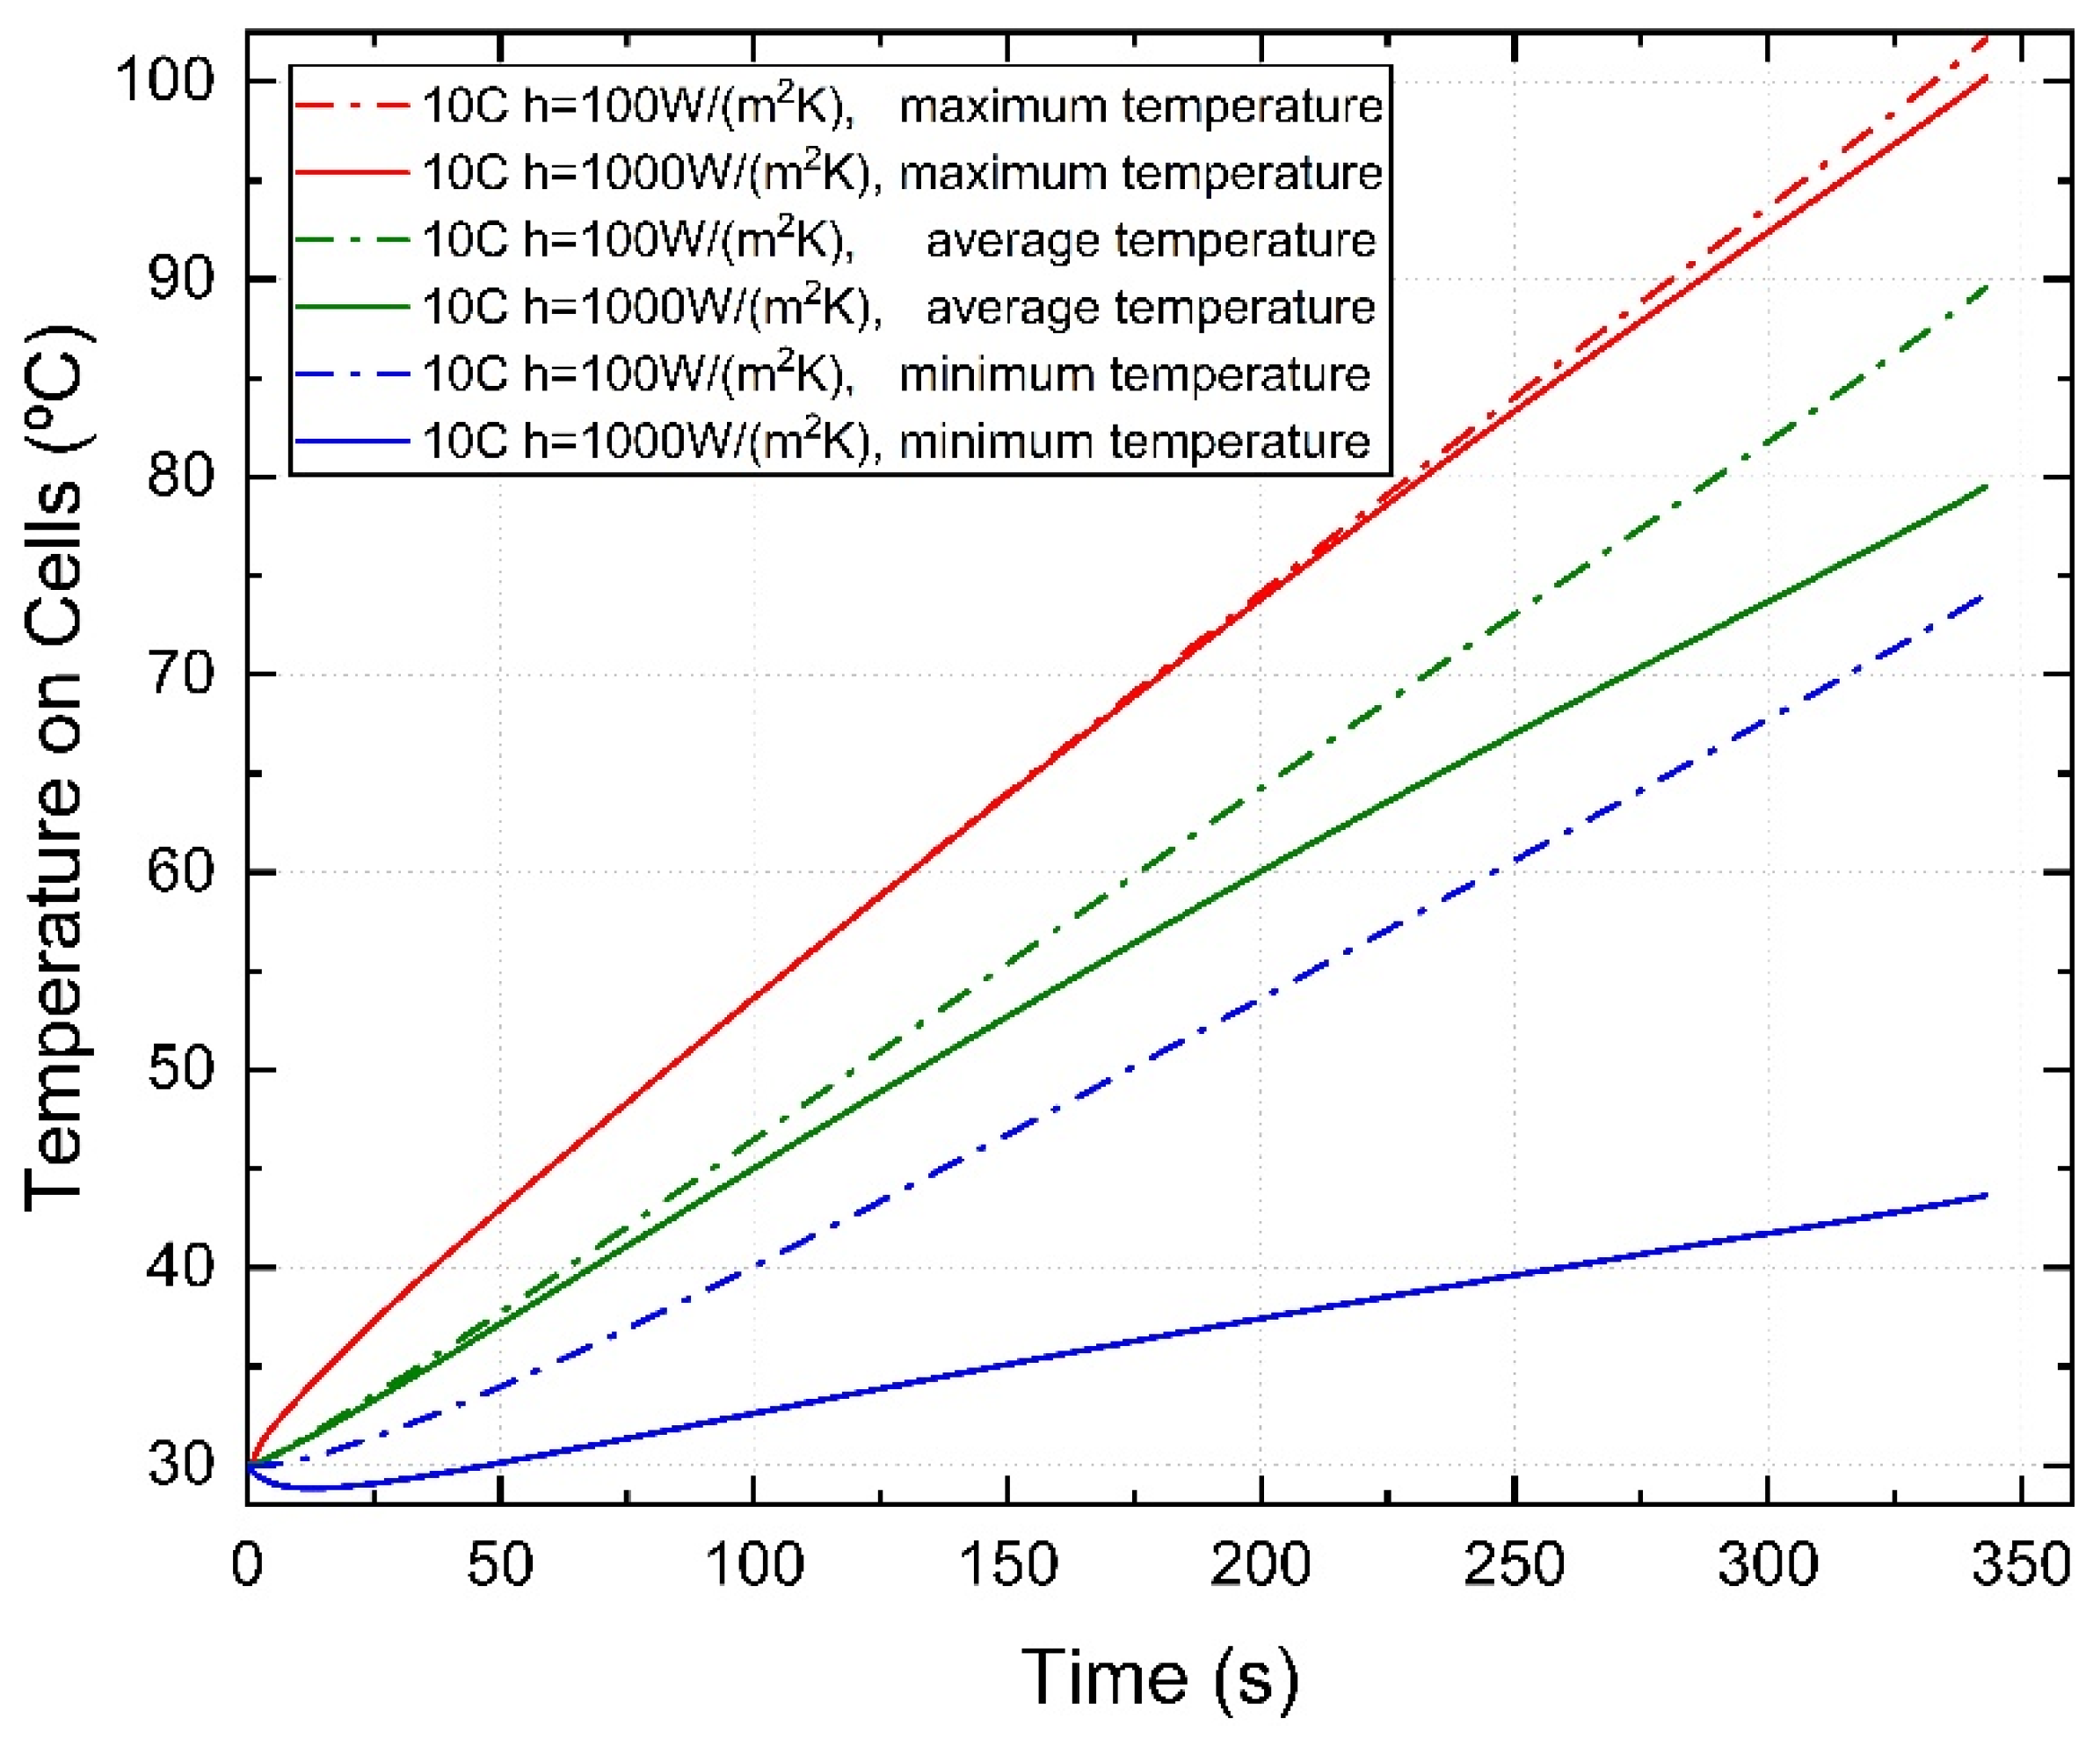
- It is found that under a 2C discharging condition, the maximum temperature of the battery pack can be controlled below 40 °C and the maximum temperature difference can be controlled within 8 °C with indirect cooling, which can achieve the cooling of the battery pack very well. However, when the discharging rate is 10C, the maximum temperature of the battery pack with indirect cooling can exceed 100 °C, and the maximum temperature difference can reach 28 °C. Due to the low thermal conductivity of the battery and the short discharging time at a 10C rate, even enhancing the cooling performance by significantly increasing the heat transfer intensity of the indirect cooling will have little effect. Therefore, it is difficult to cool the battery pack effectively with indirect cooling under the 10C discharging condition.
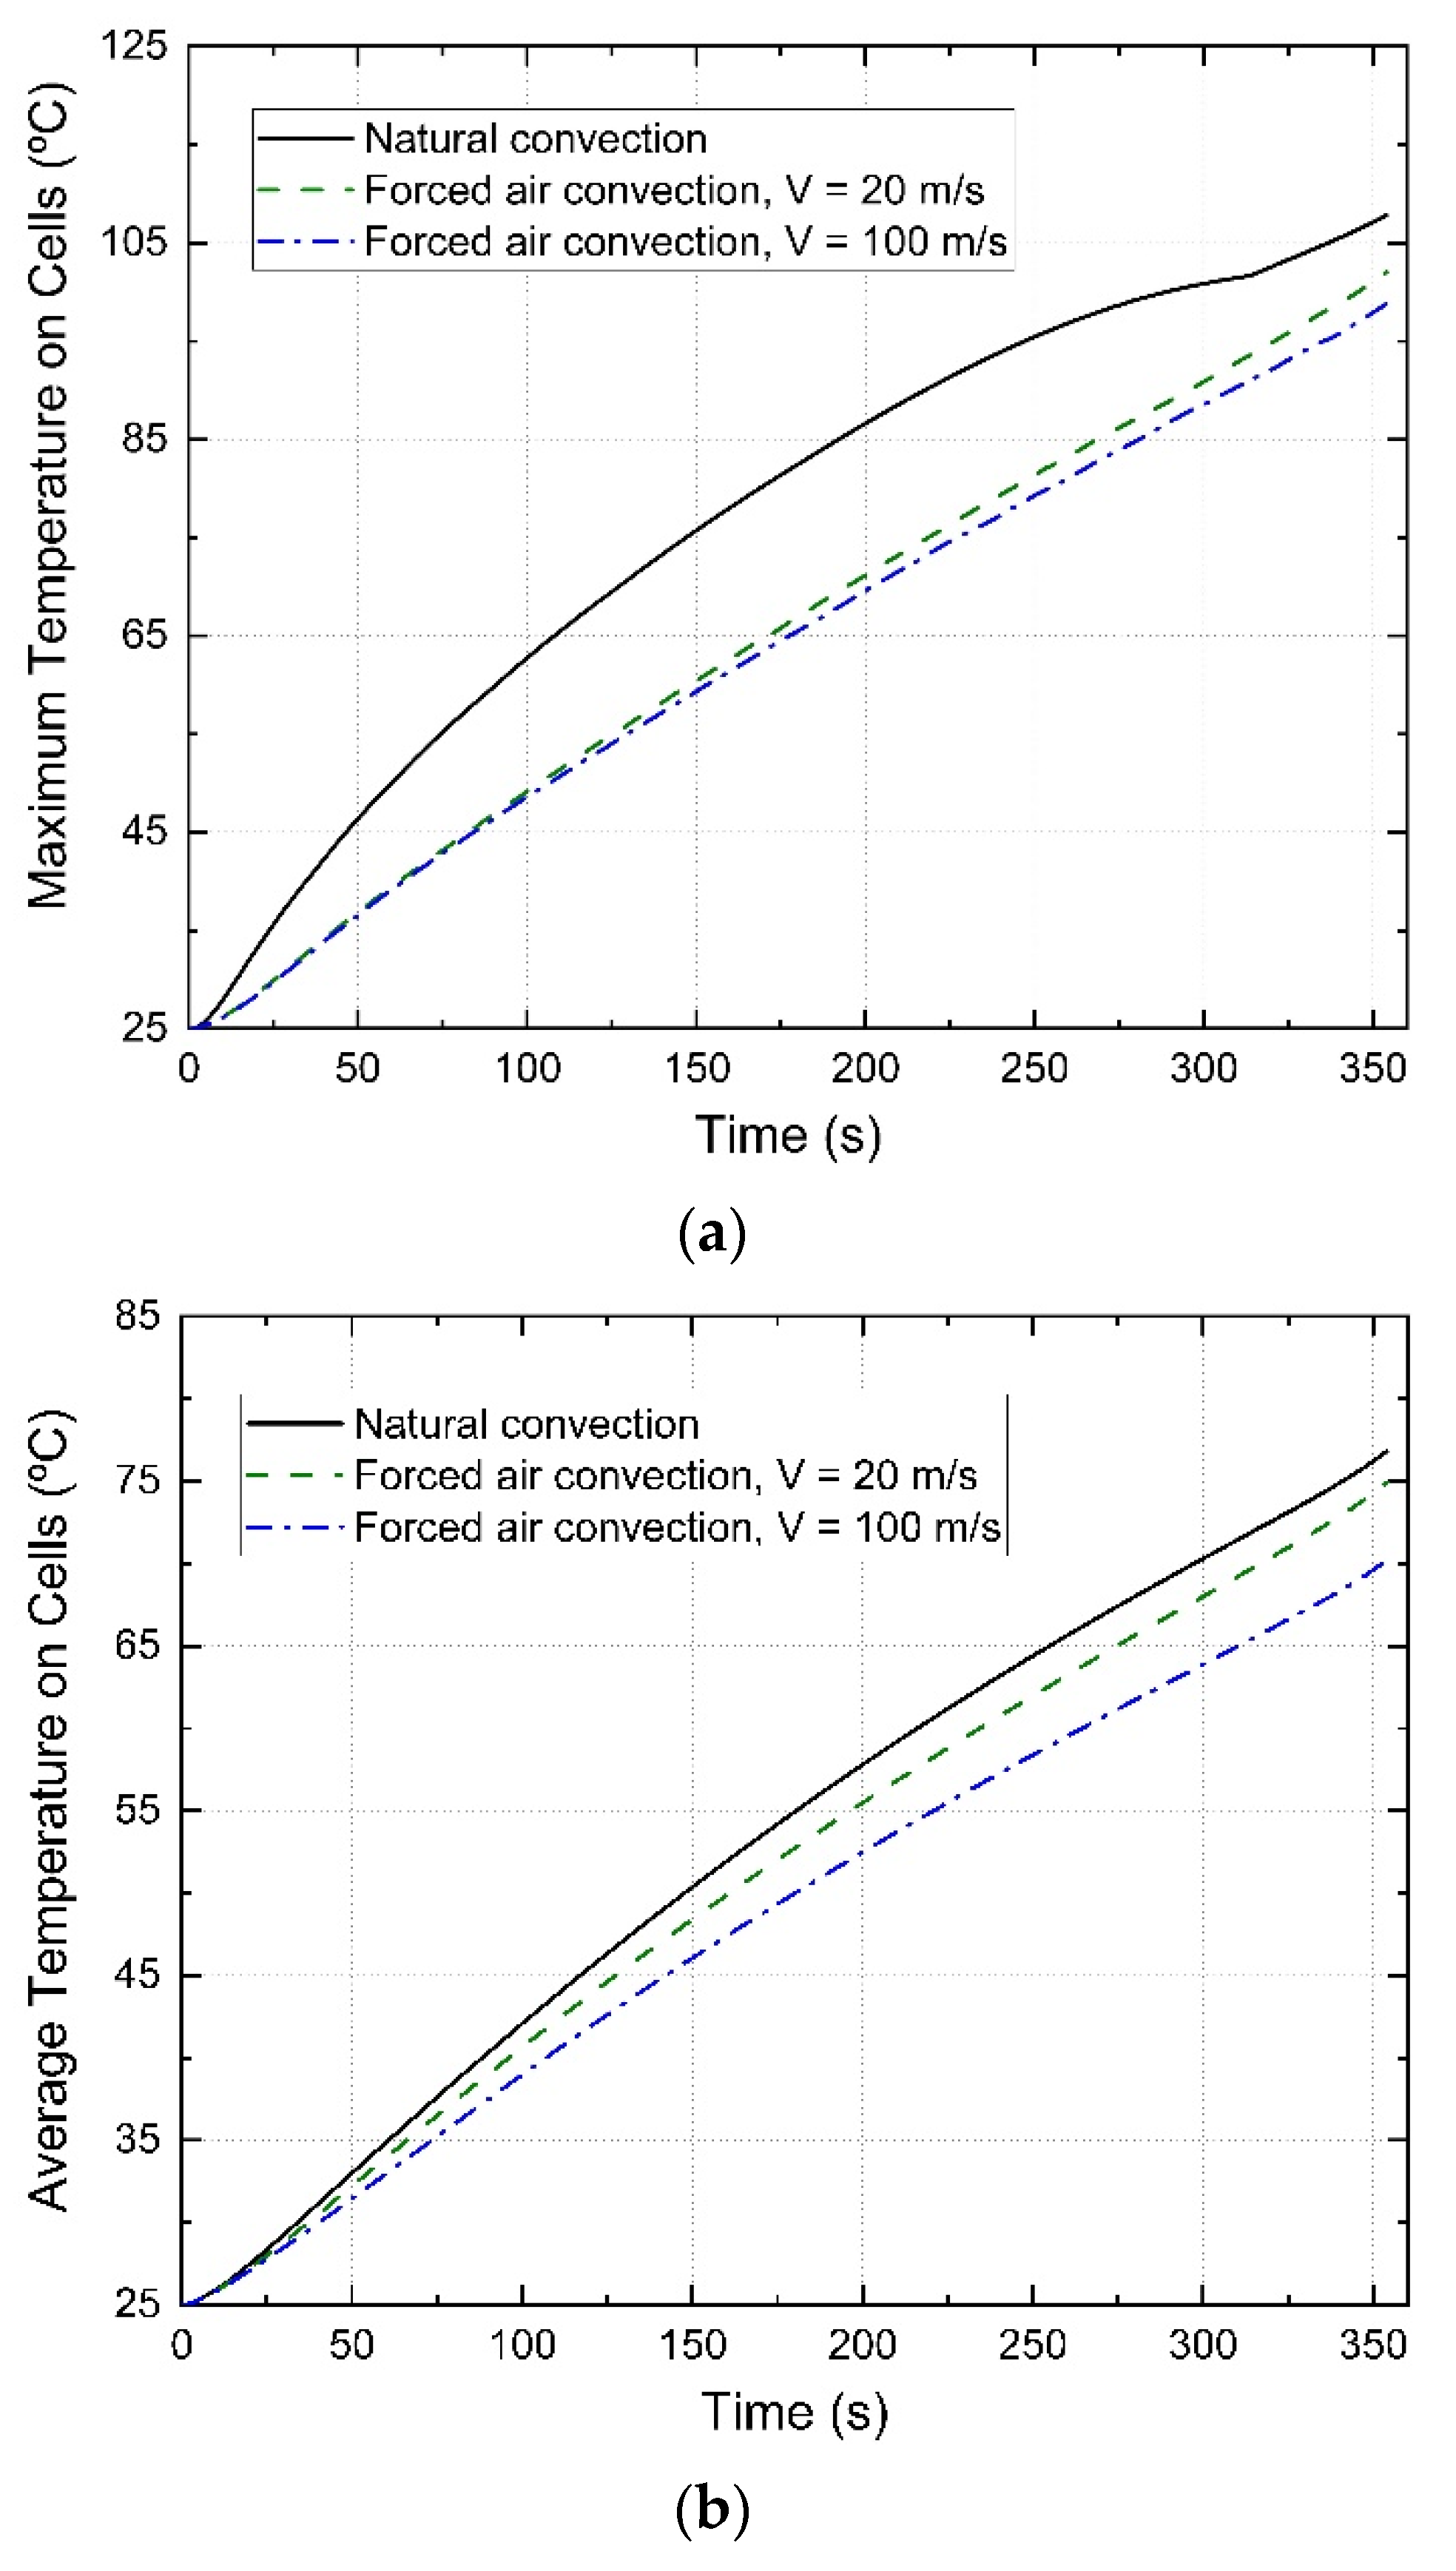
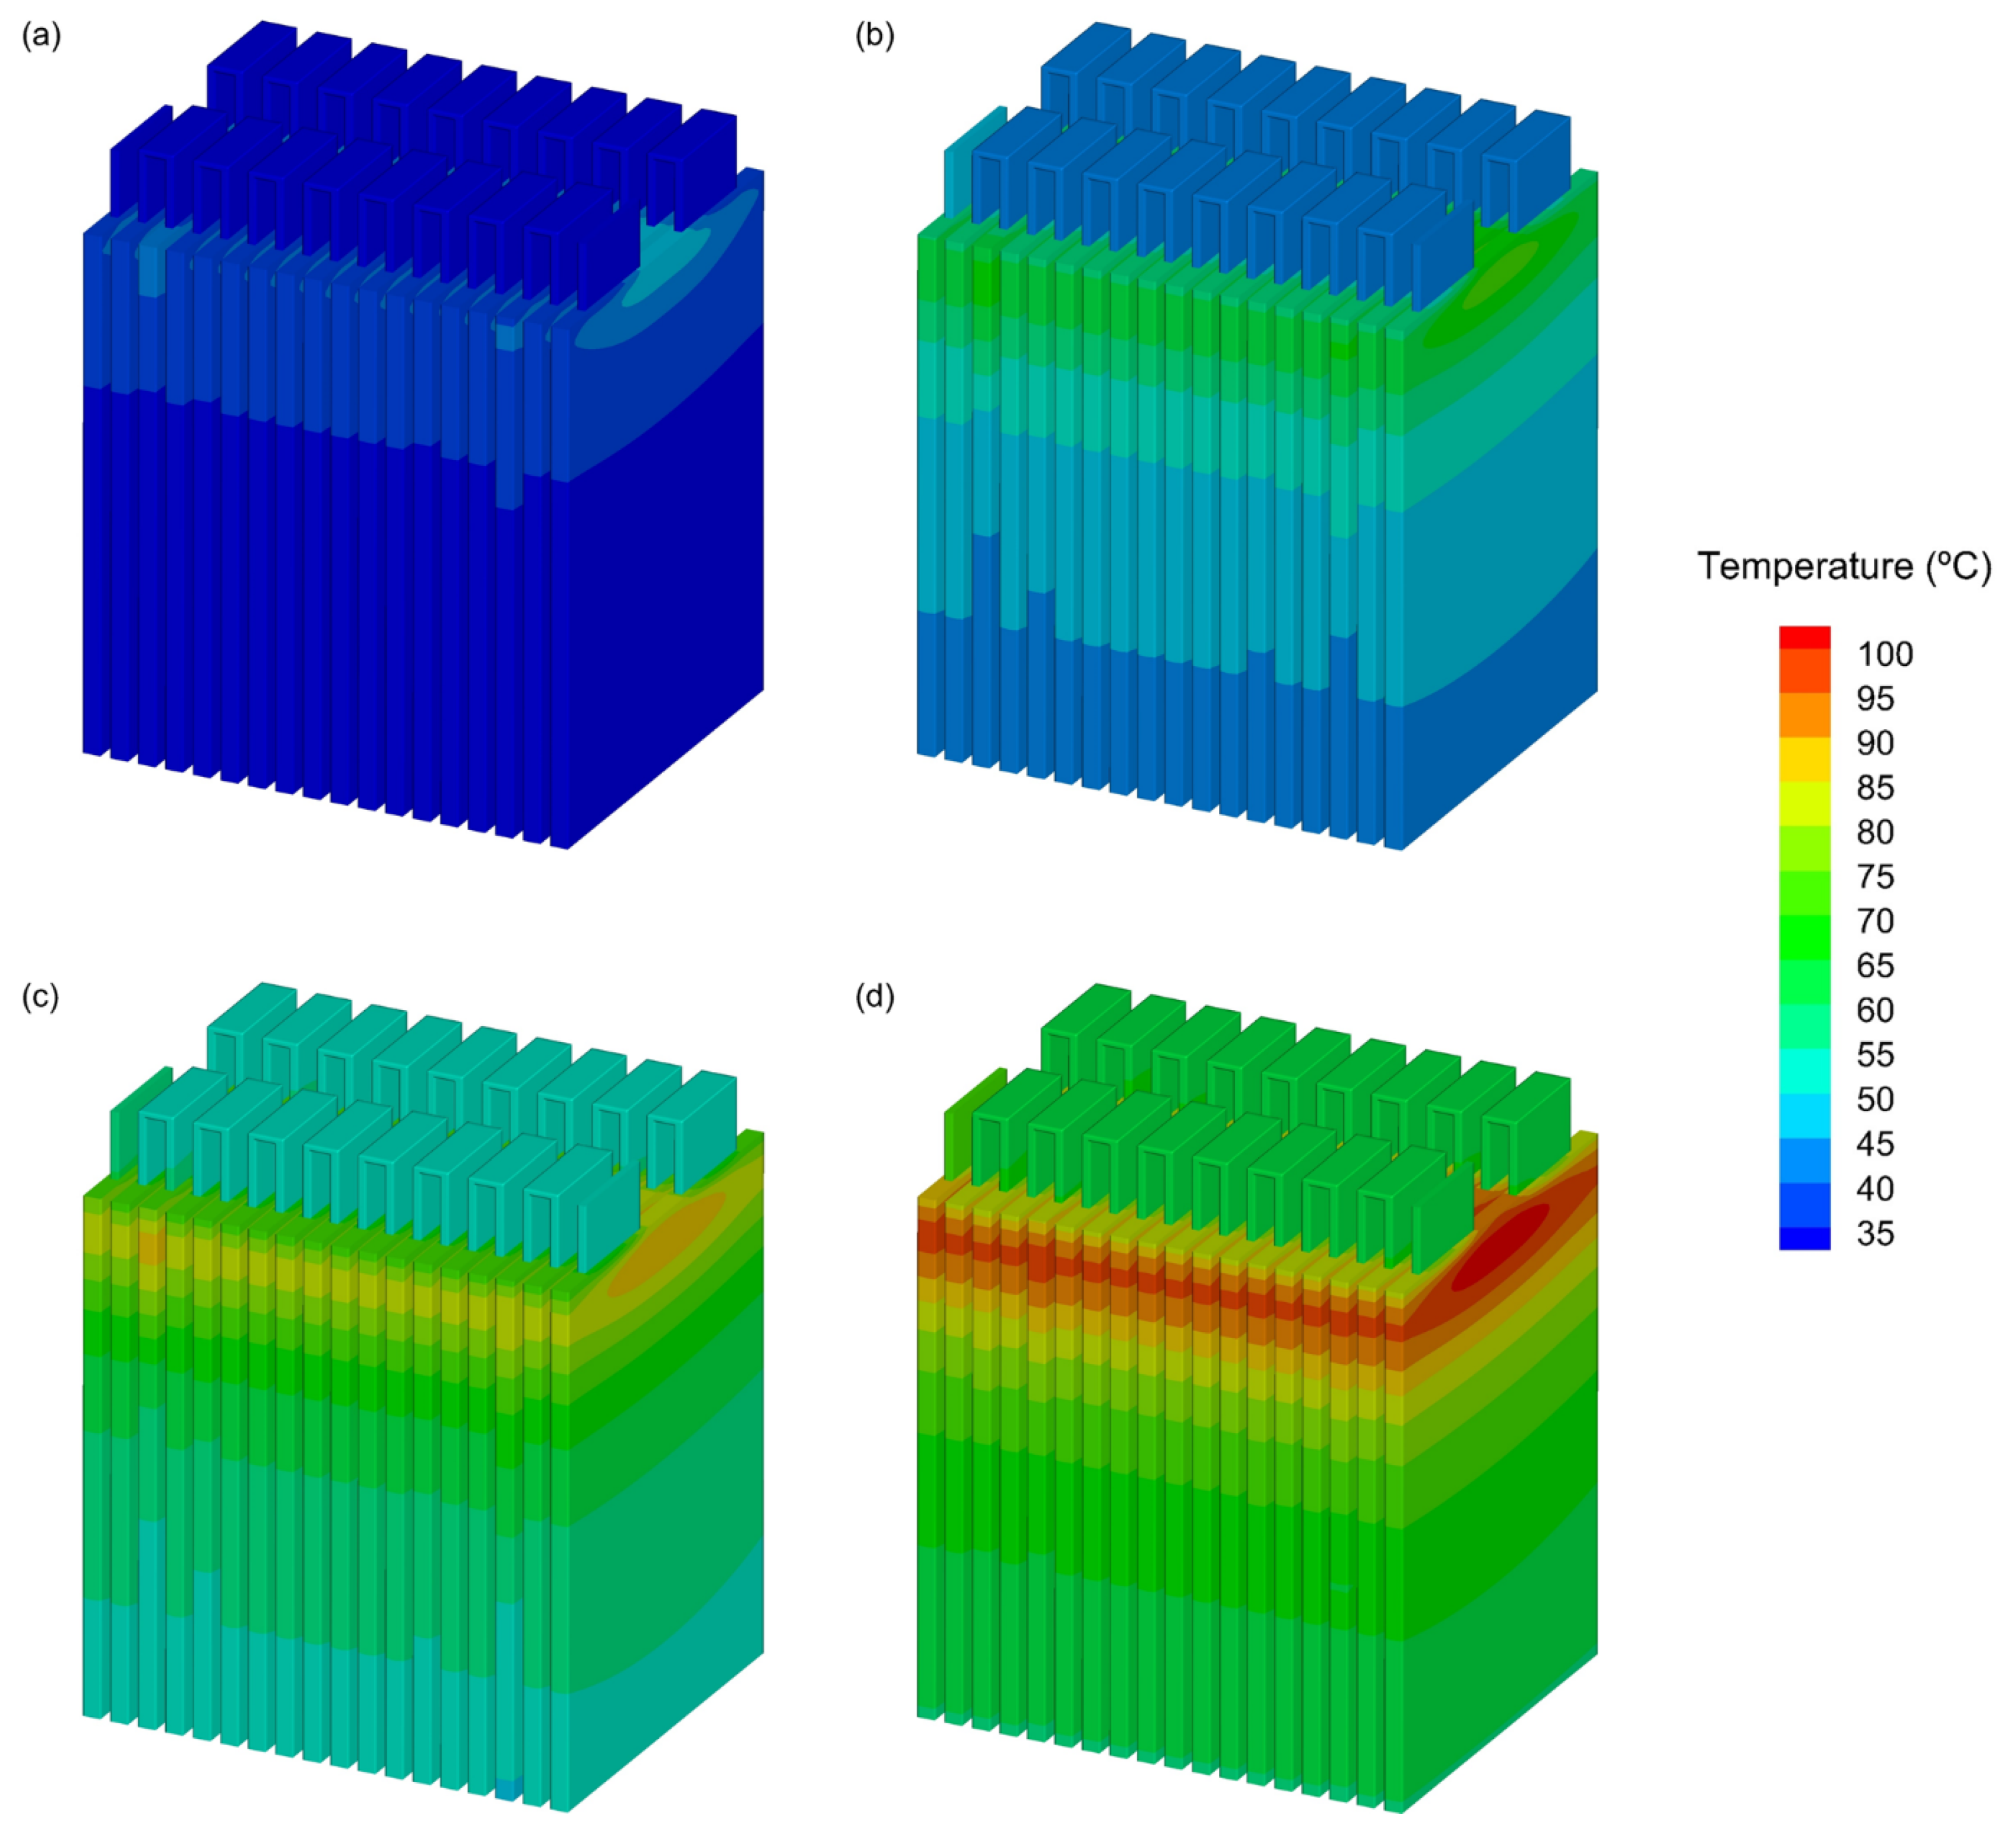
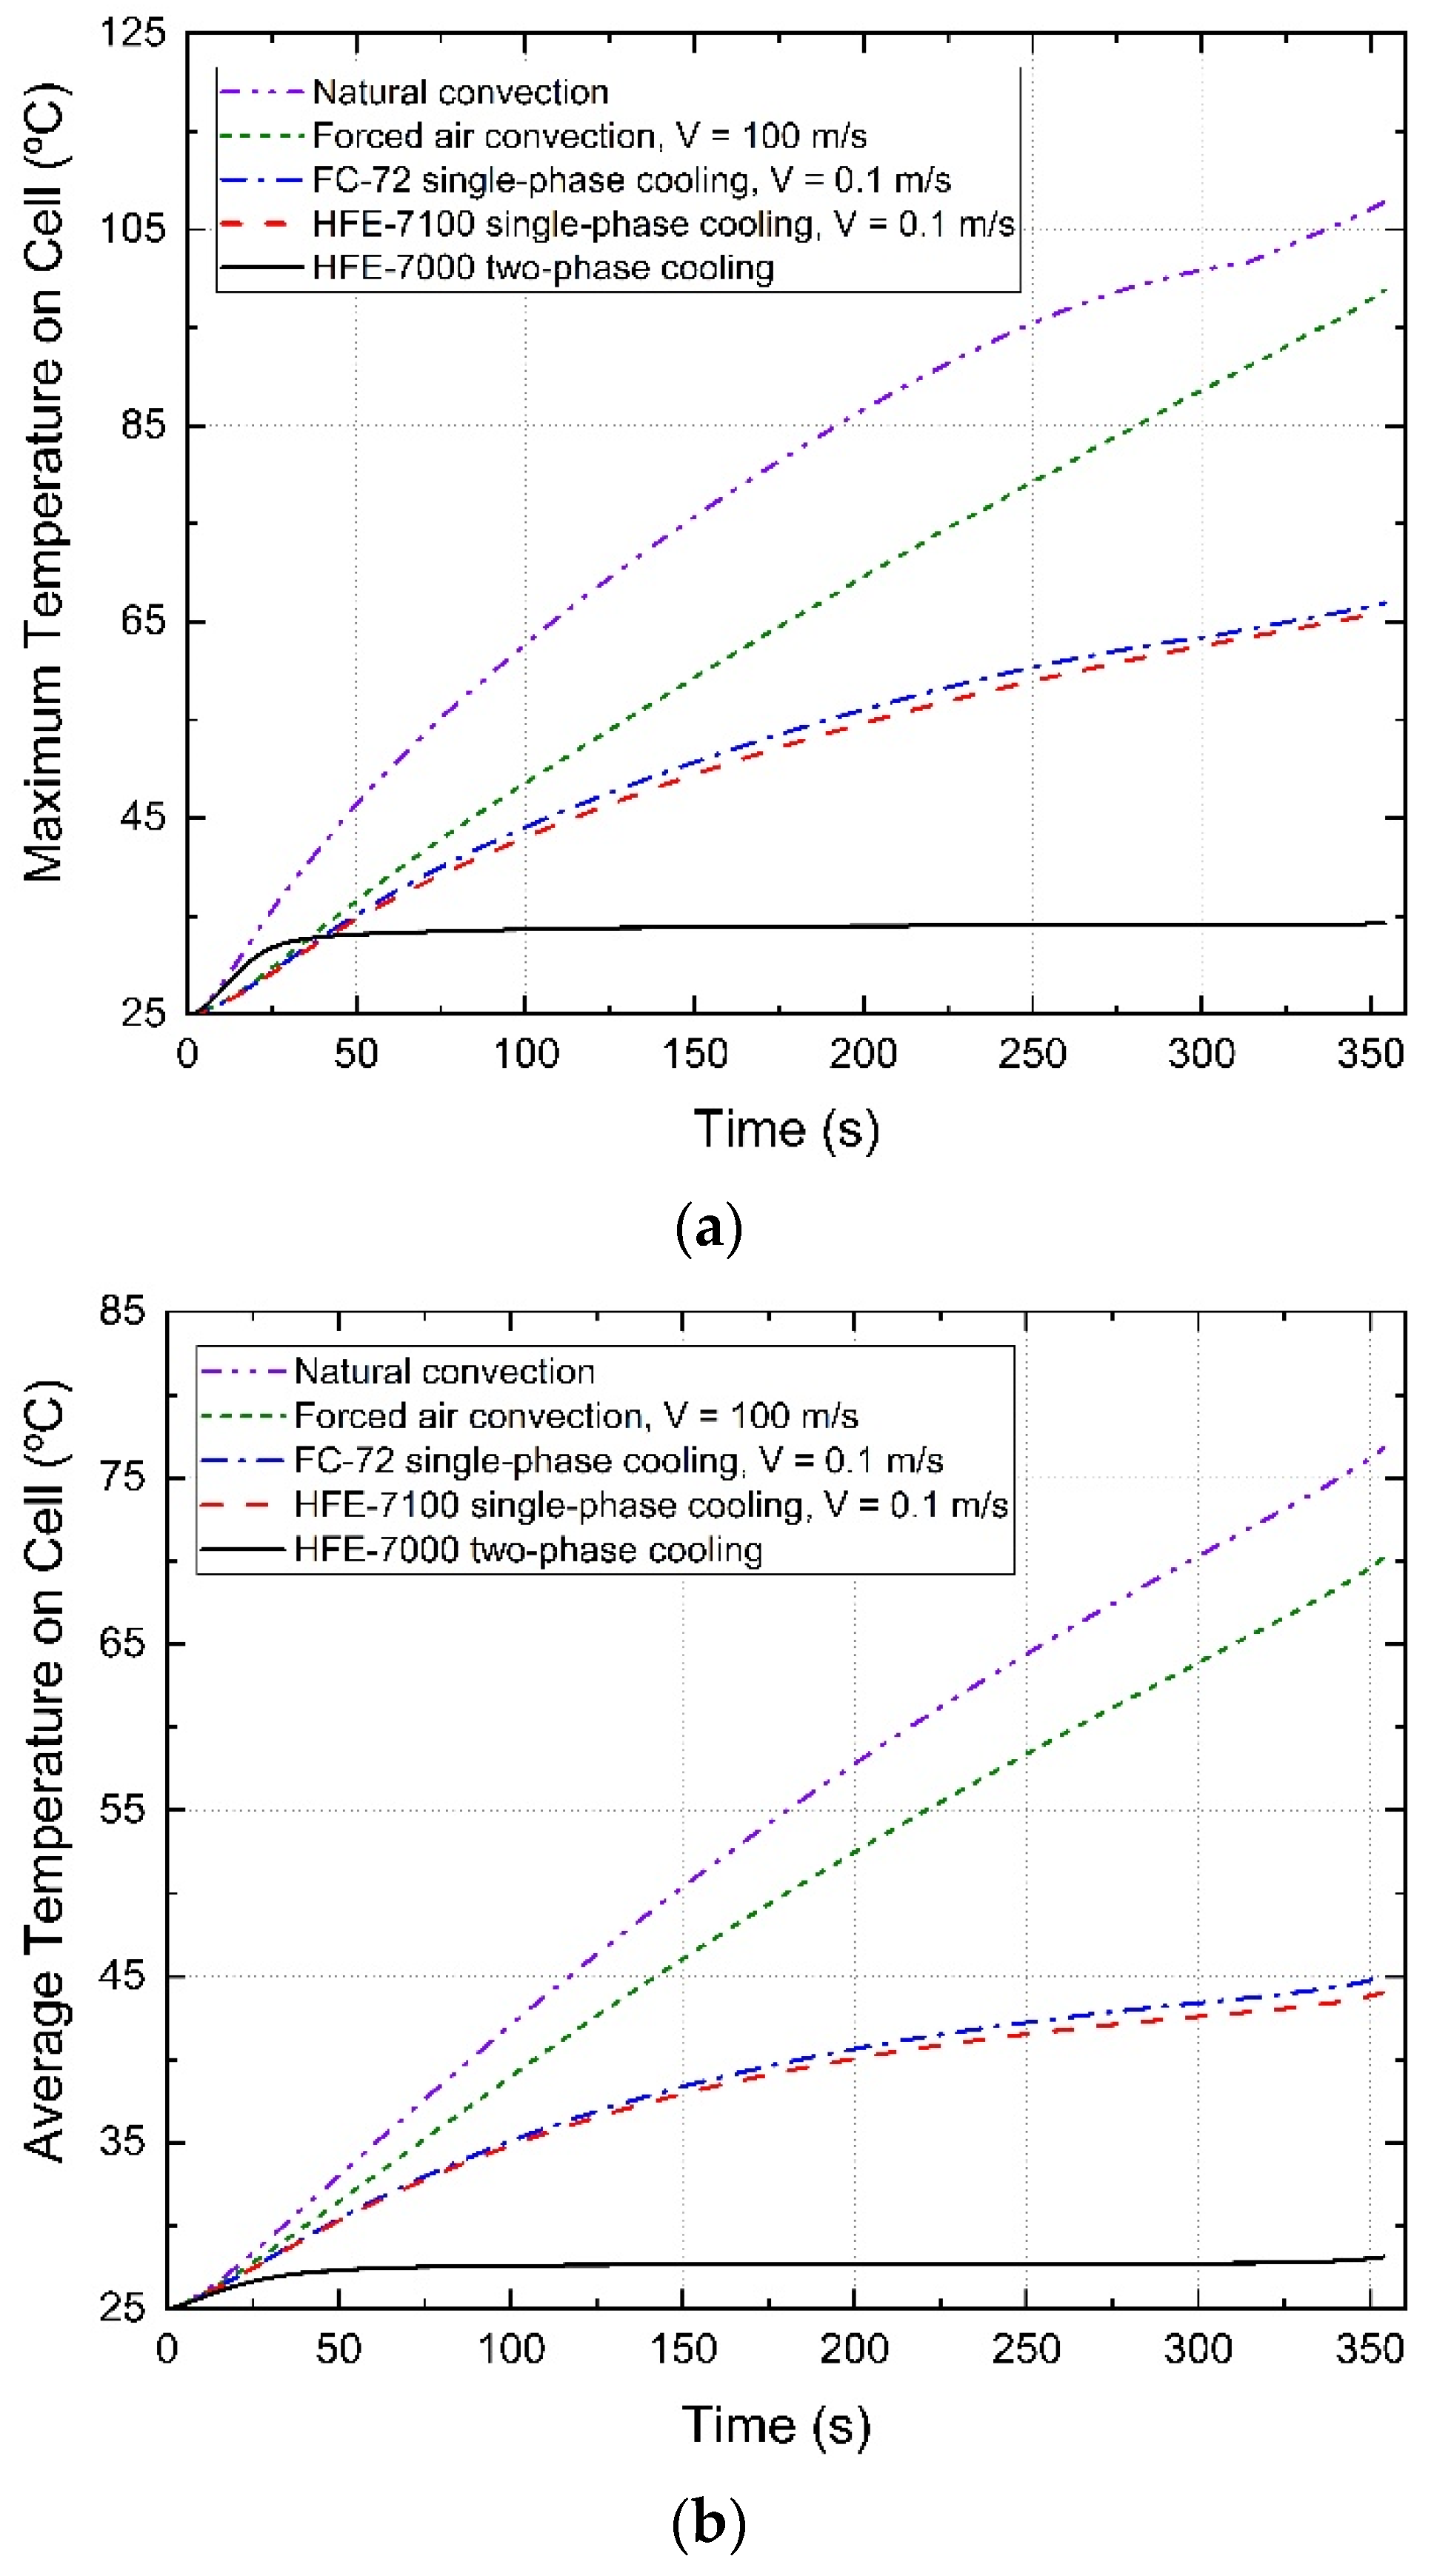
- For direct cooling, when natural convection of air is used as the cooling method of the battery pack, the maximum temperature of the battery pack can rise to 105 °C and the average temperature is above 75 °C under the 10C discharging condition. Natural convection also makes it difficult to meet the cooling requirement of the battery pack under the 10C discharging condition. In the same situation, the cooling effect of forced air convection is better than that of natural convection. When the inlet flow velocity is 100 m/s, the average temperature of the battery pack is 70 °C. The pressure drop between the inlet and outlet is 12,024.39 Pa, and the power required is 2065 W. Although the air forced convection cooling is somewhat effective, the pump work consumed is larger and the cooling effect obtained is not very satisfactory.
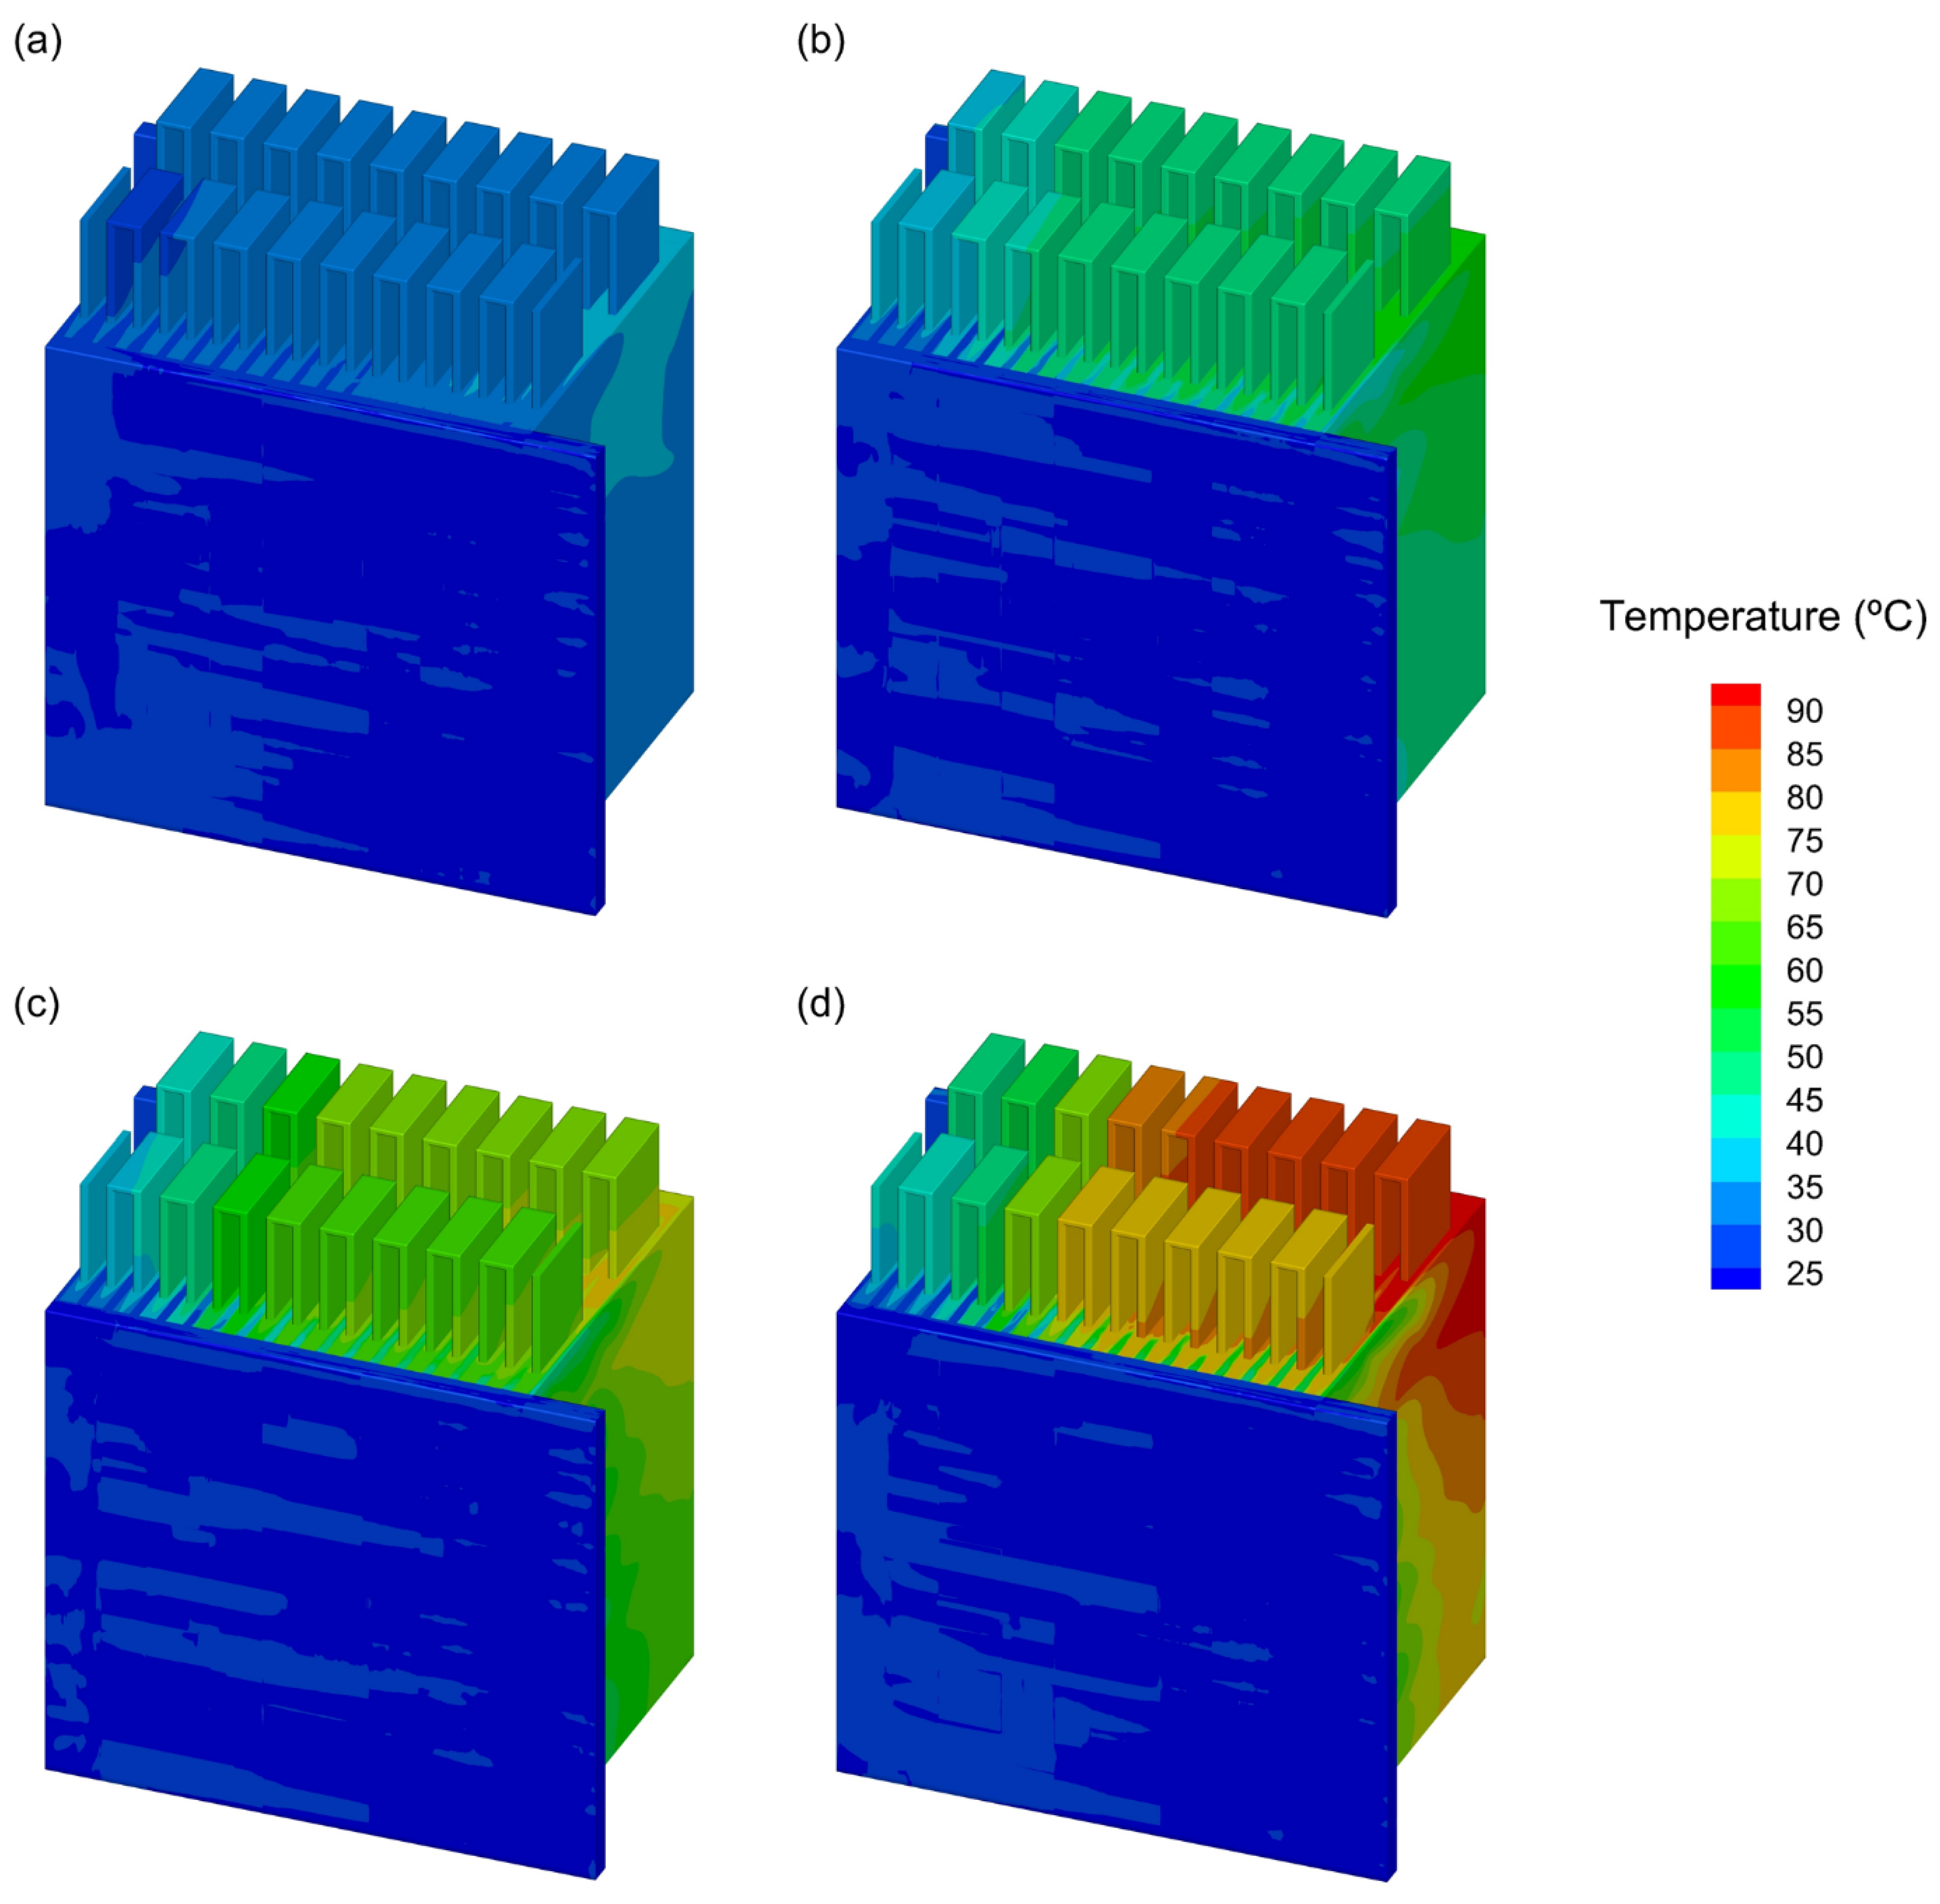
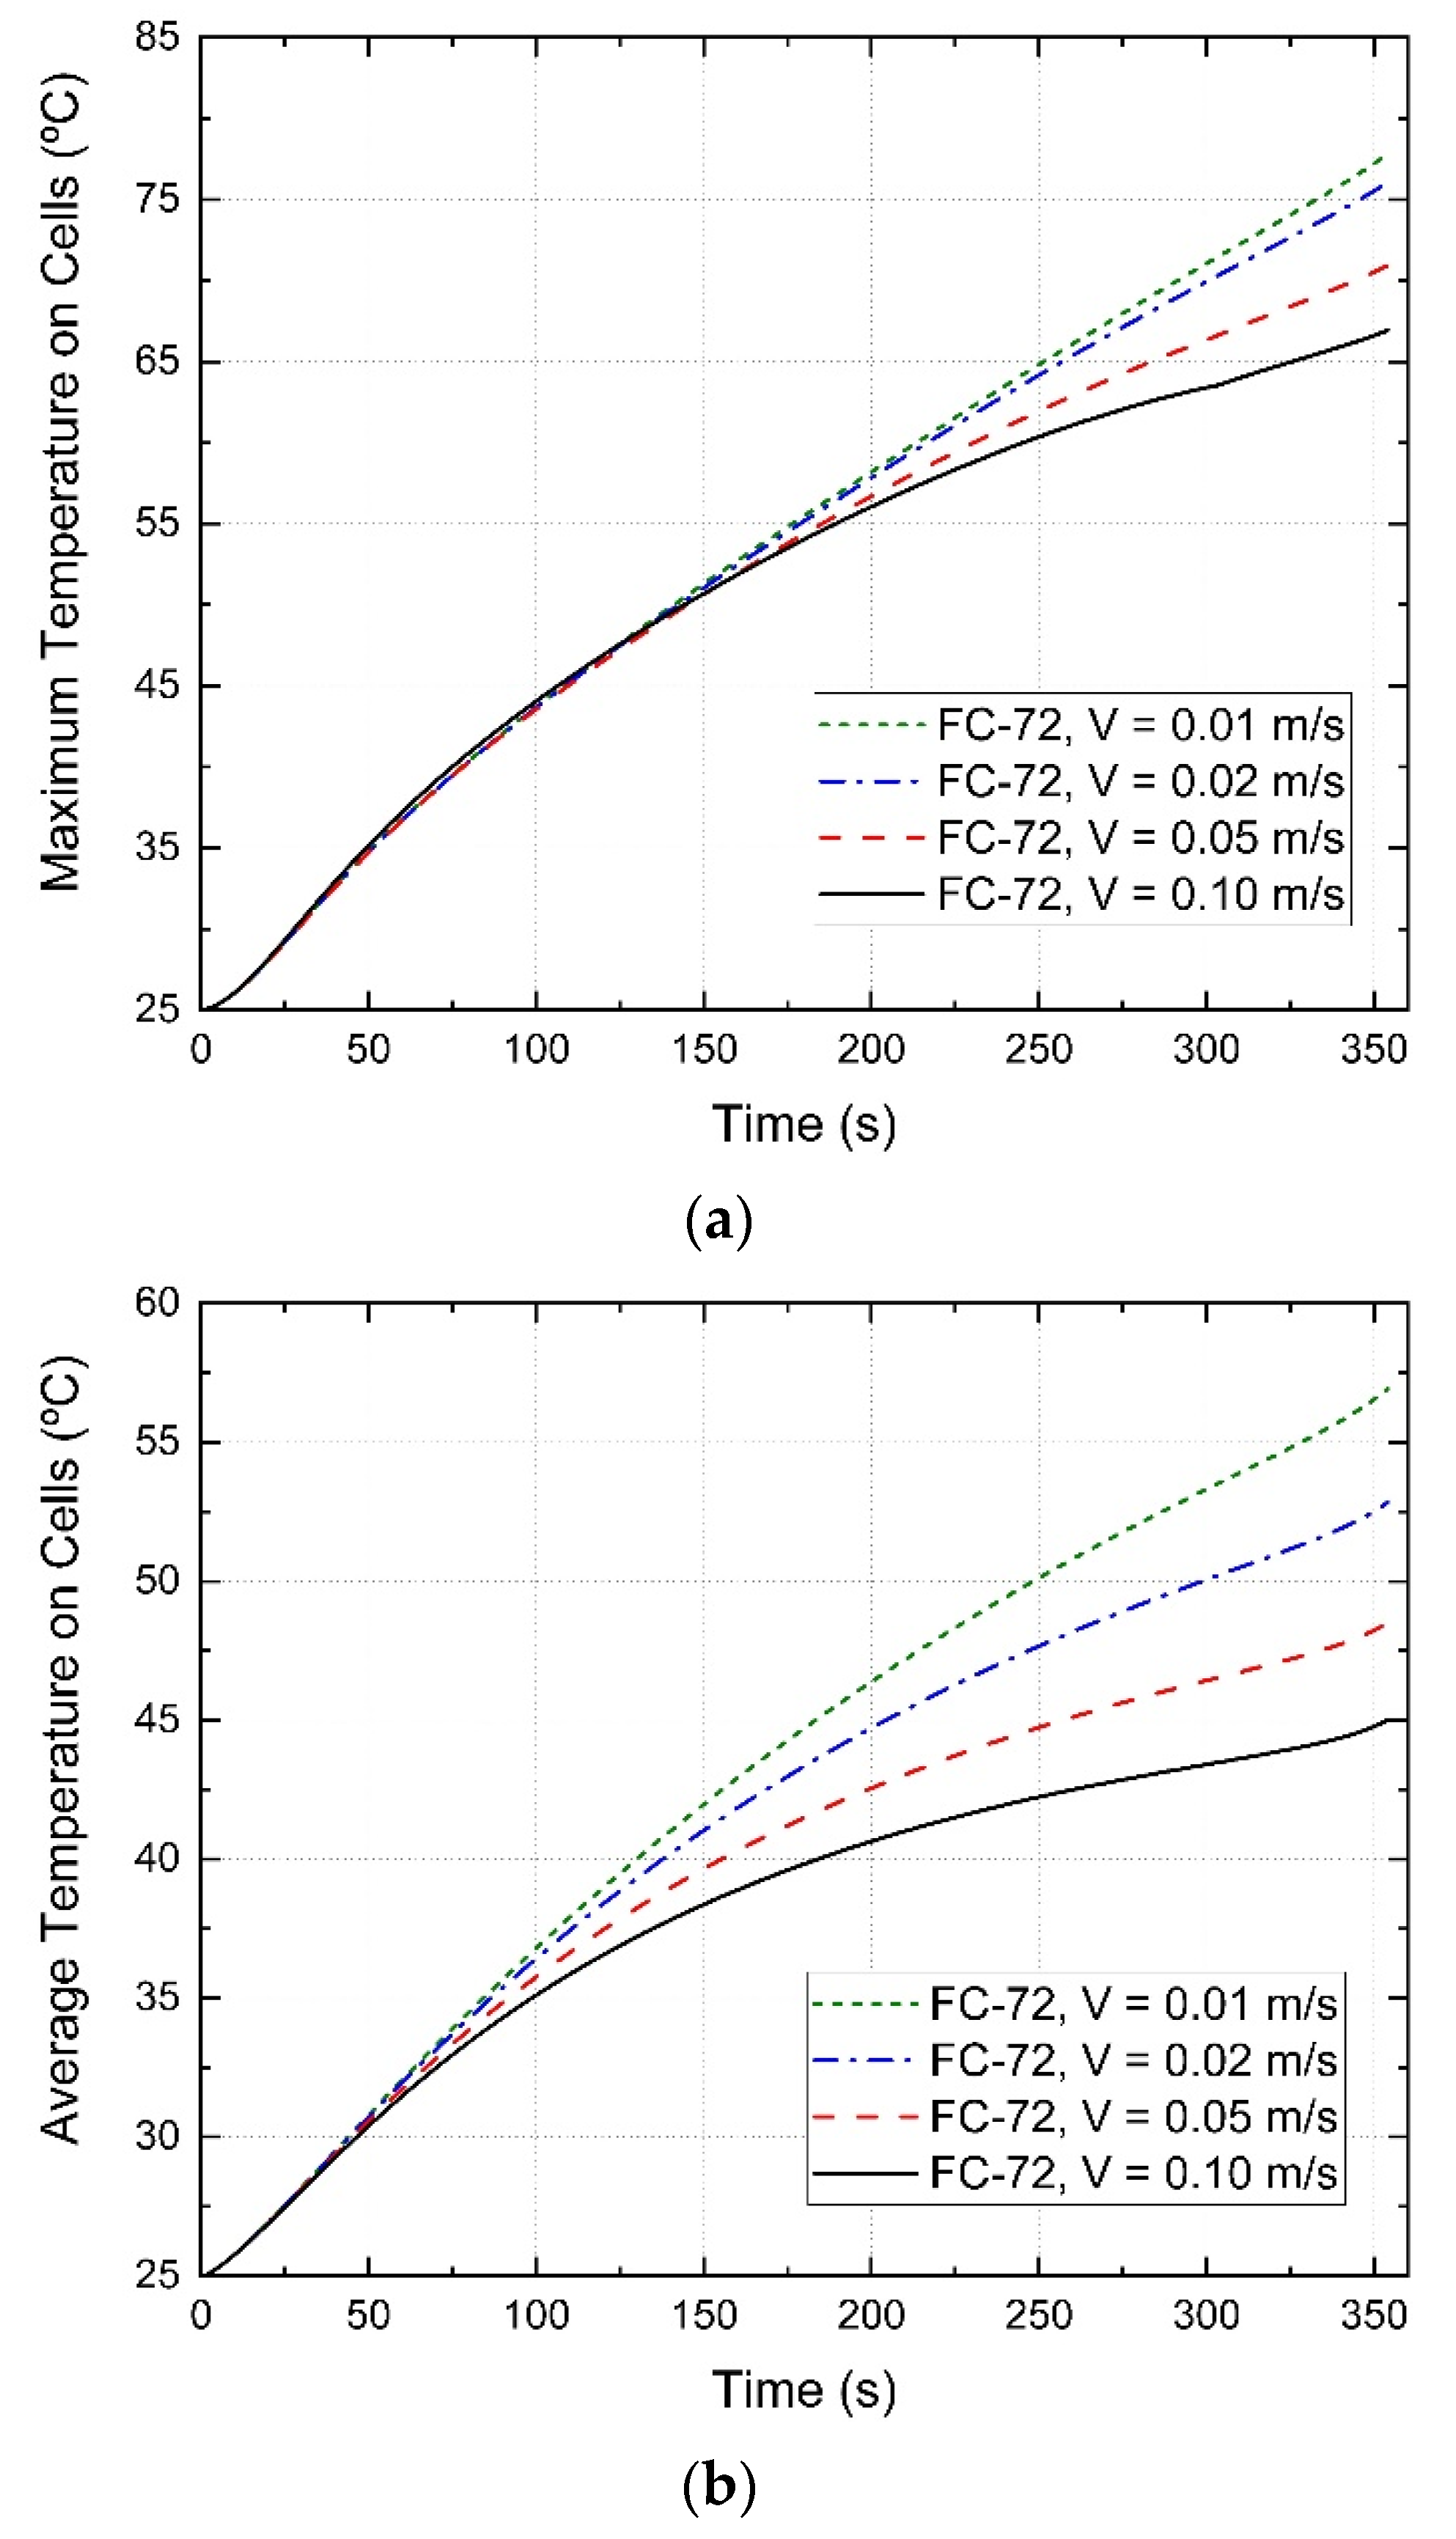
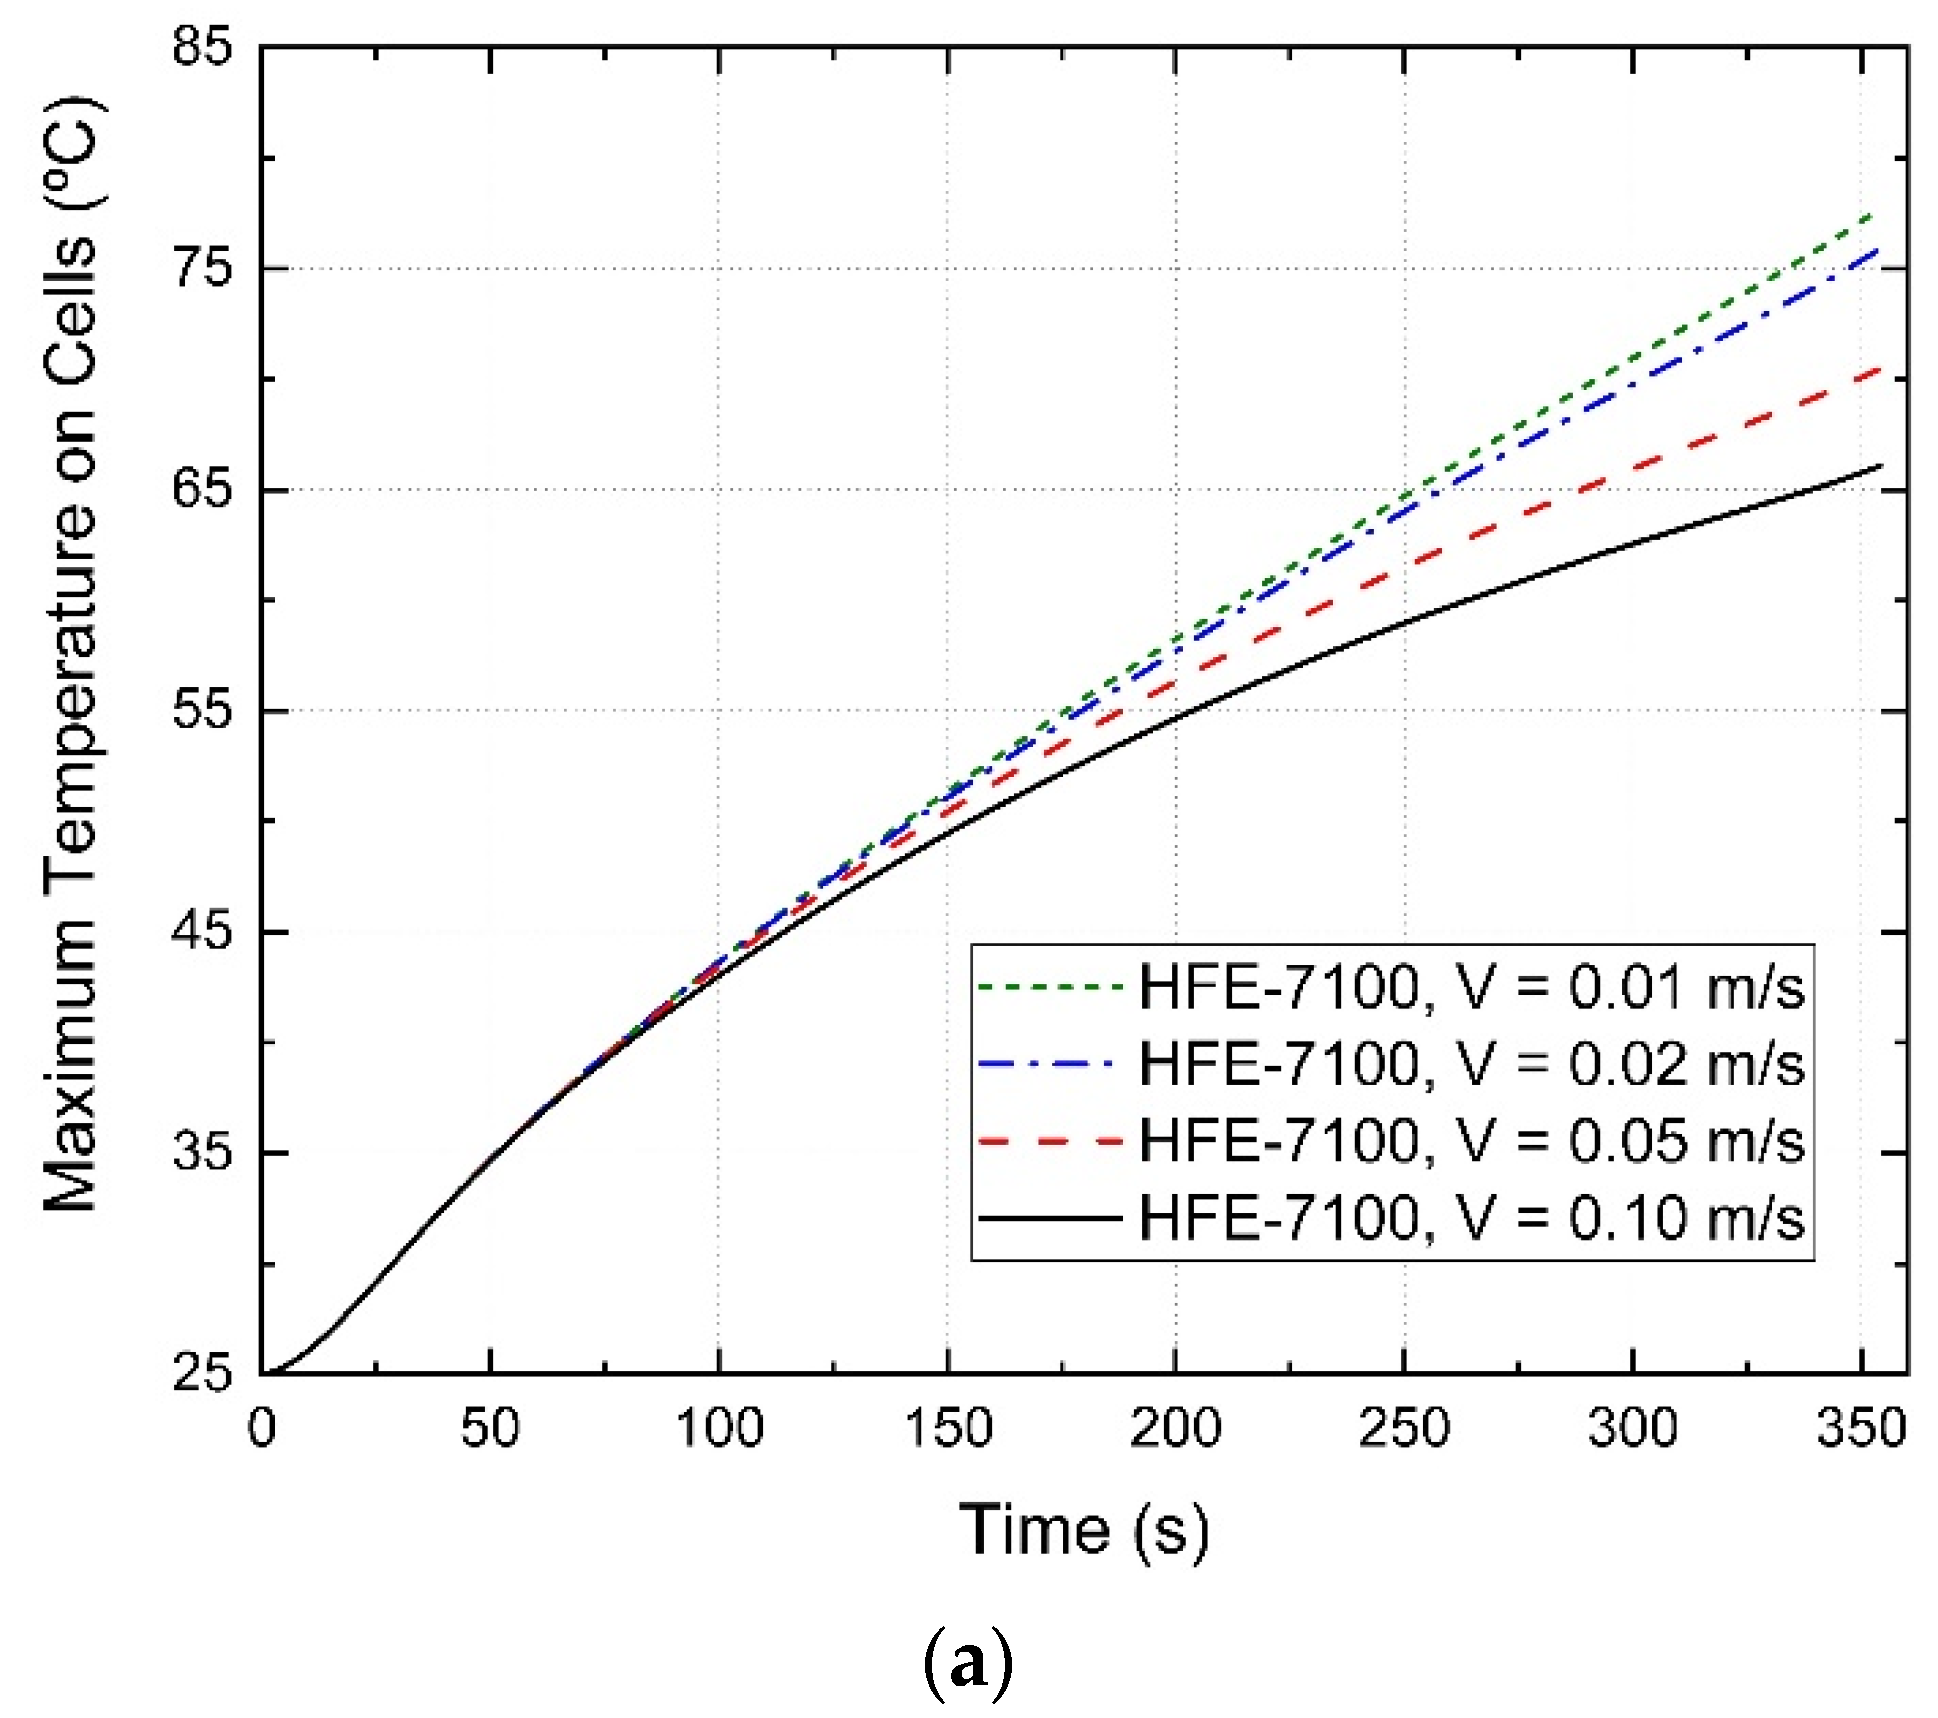
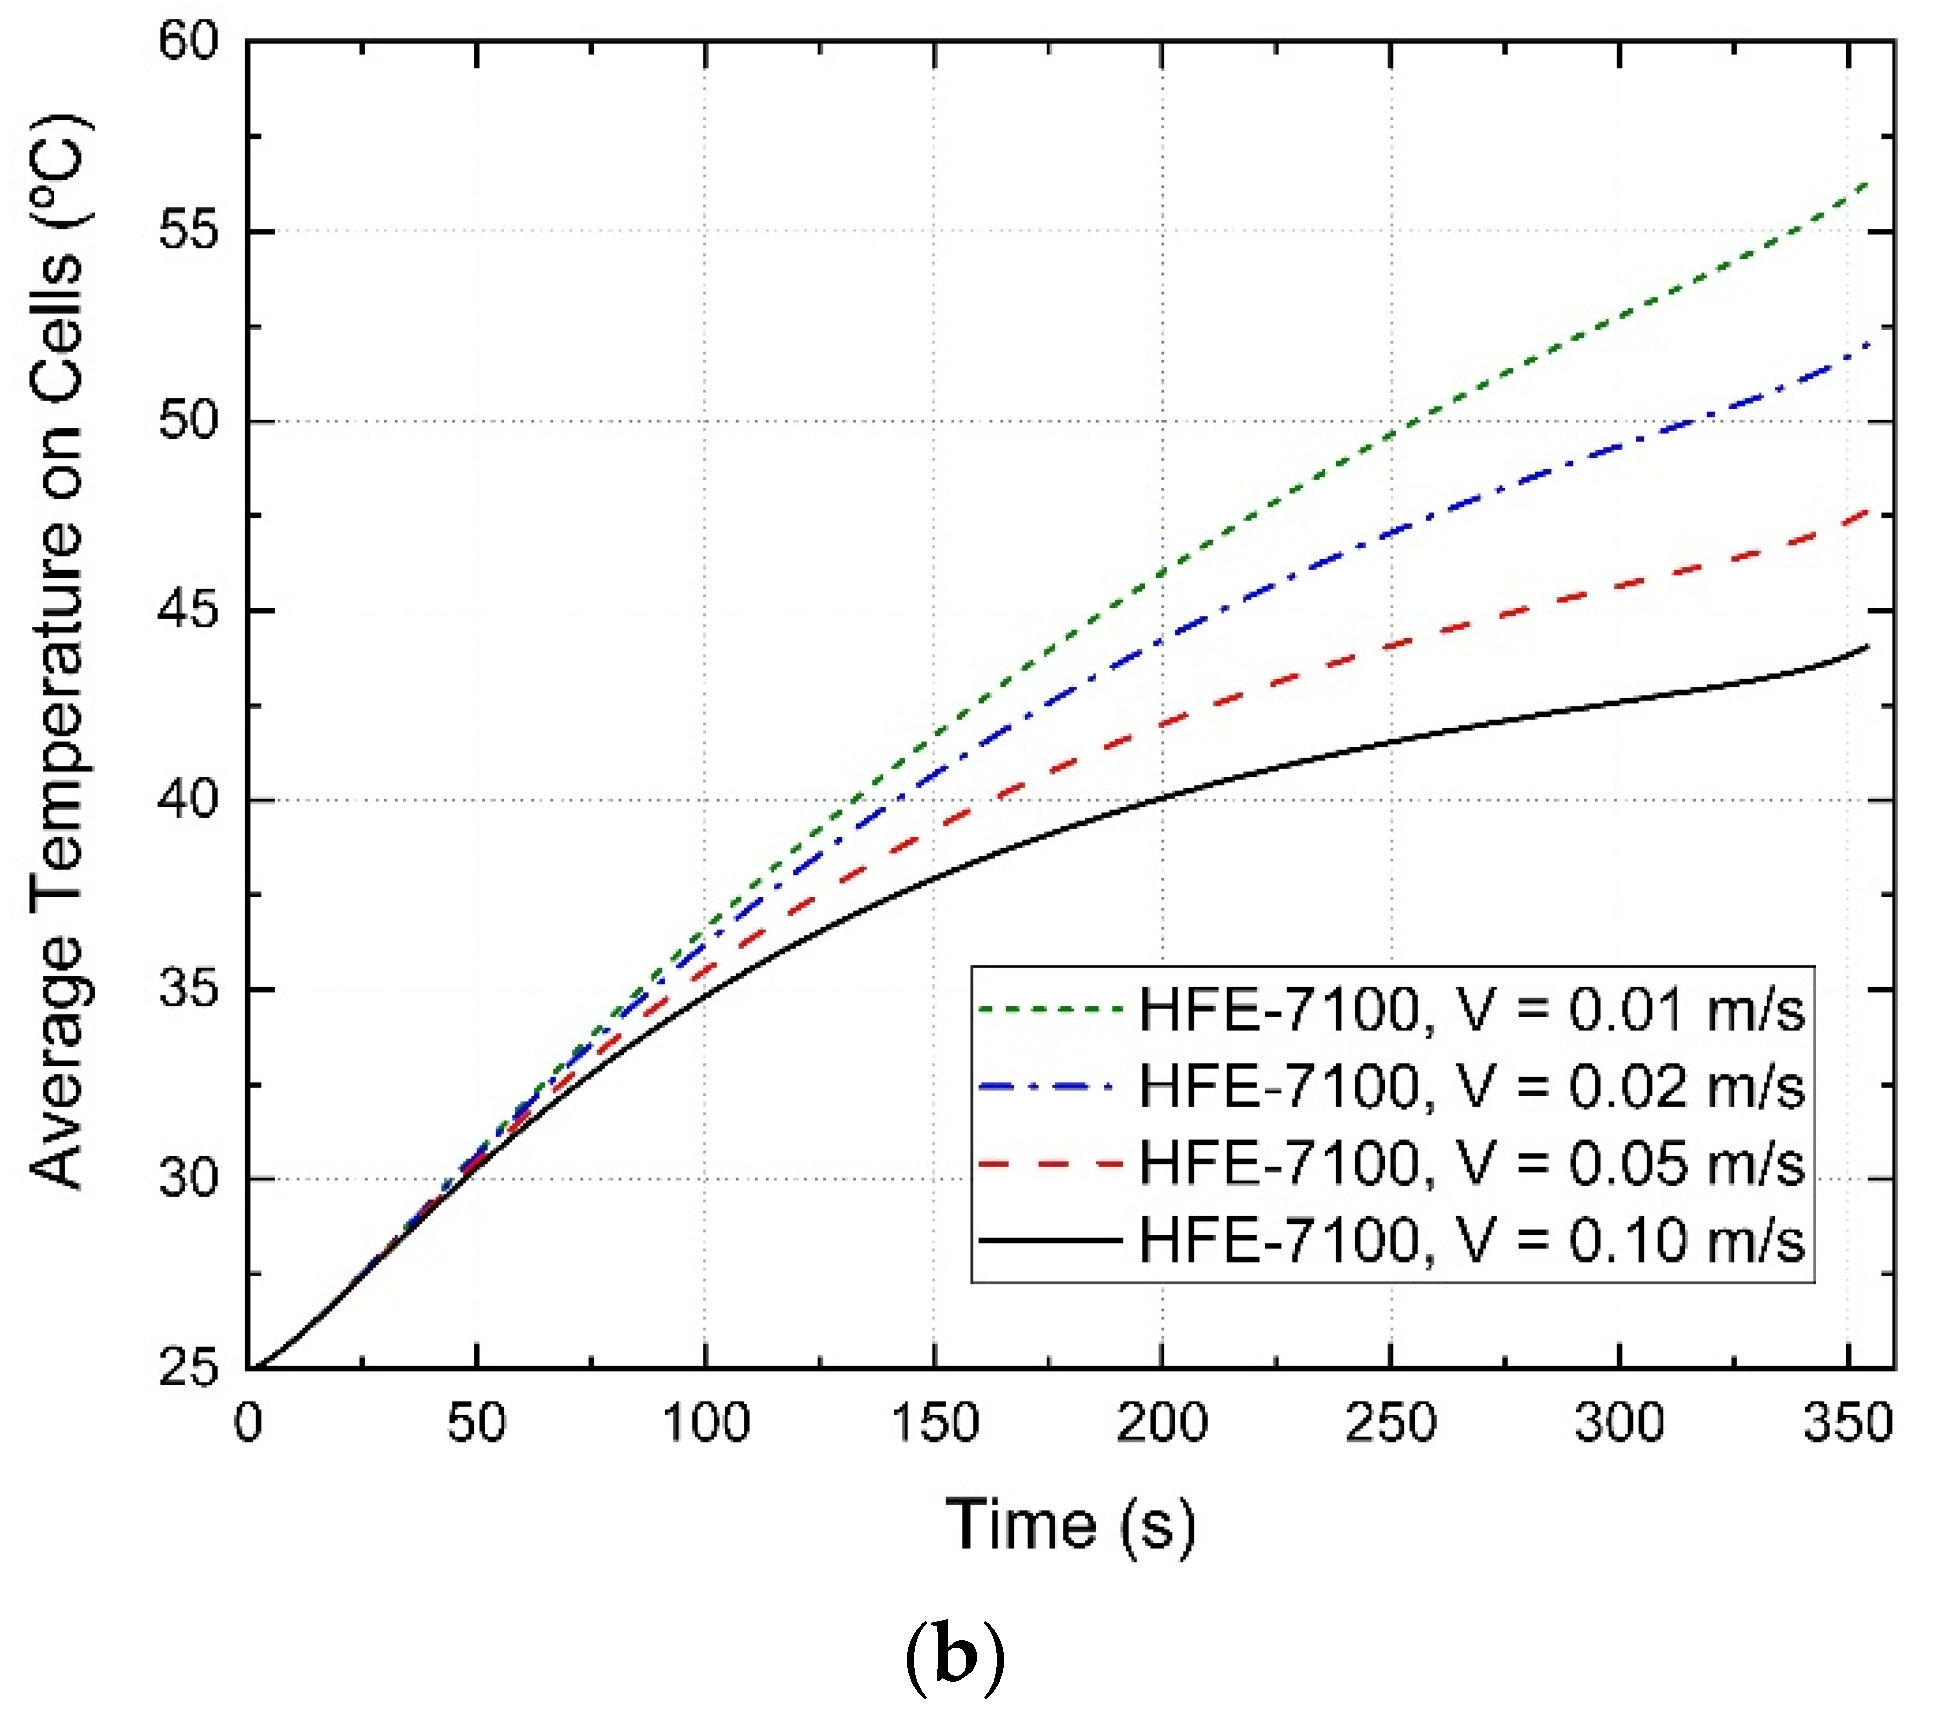
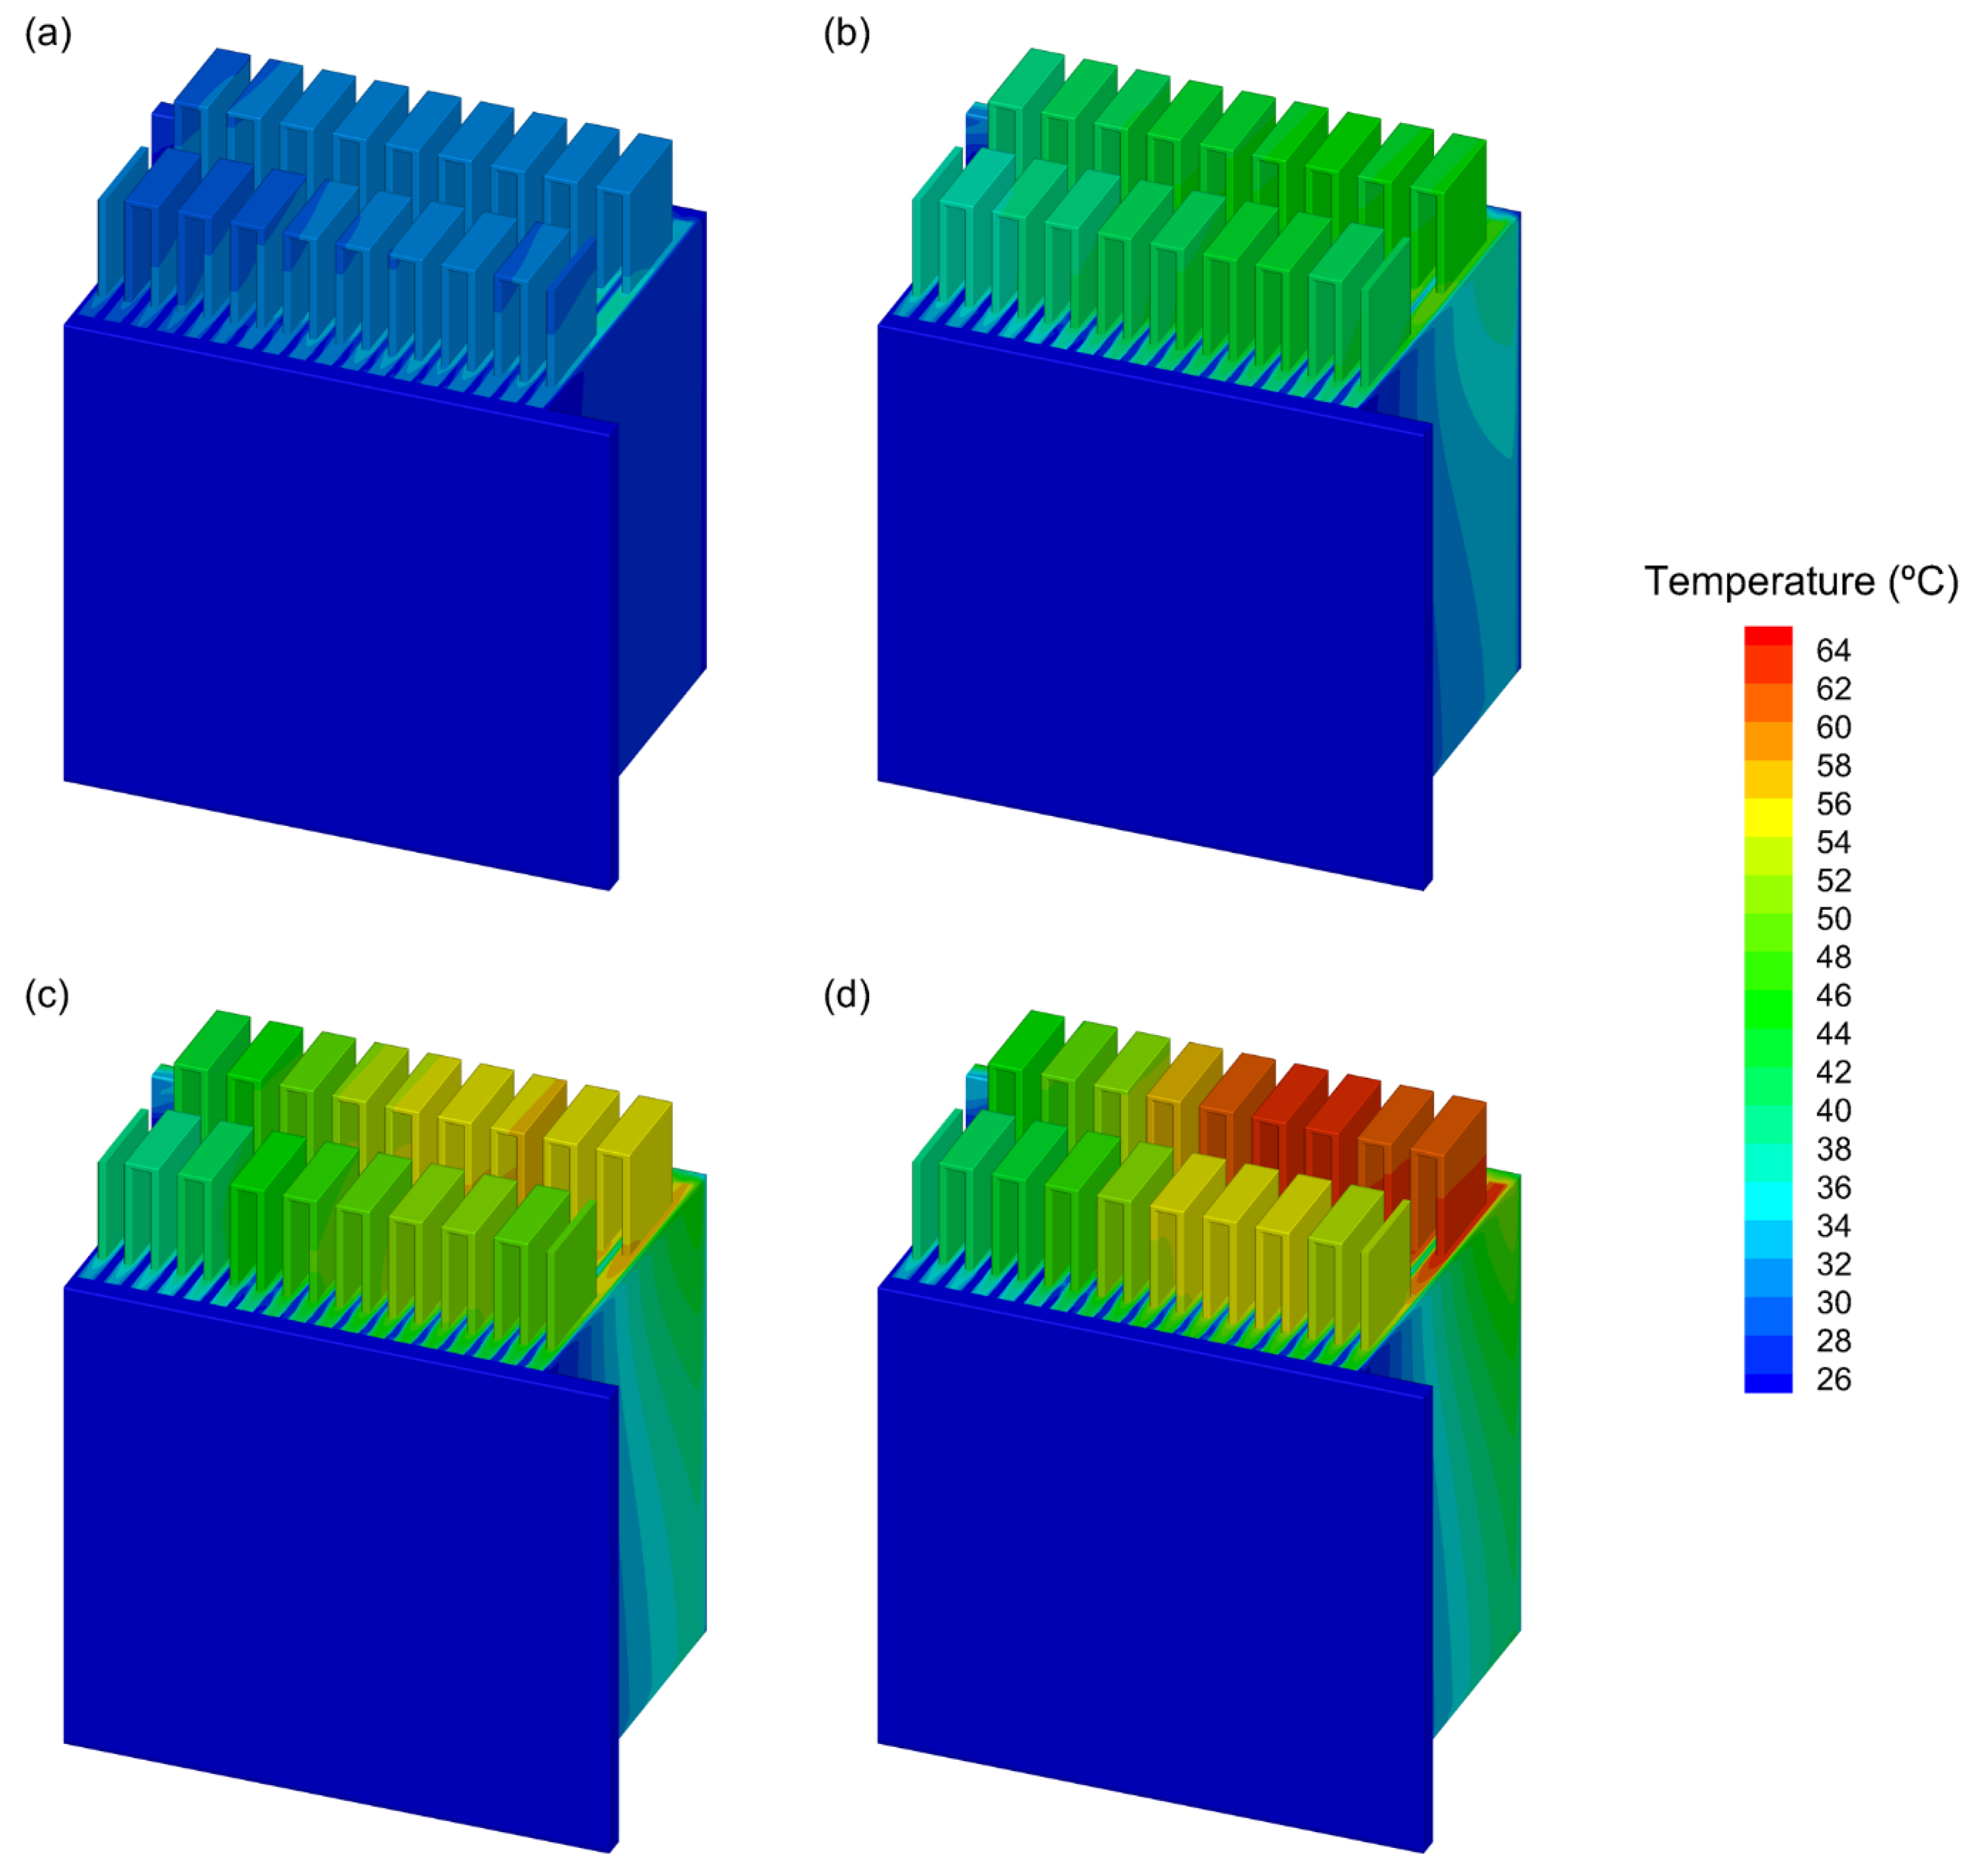
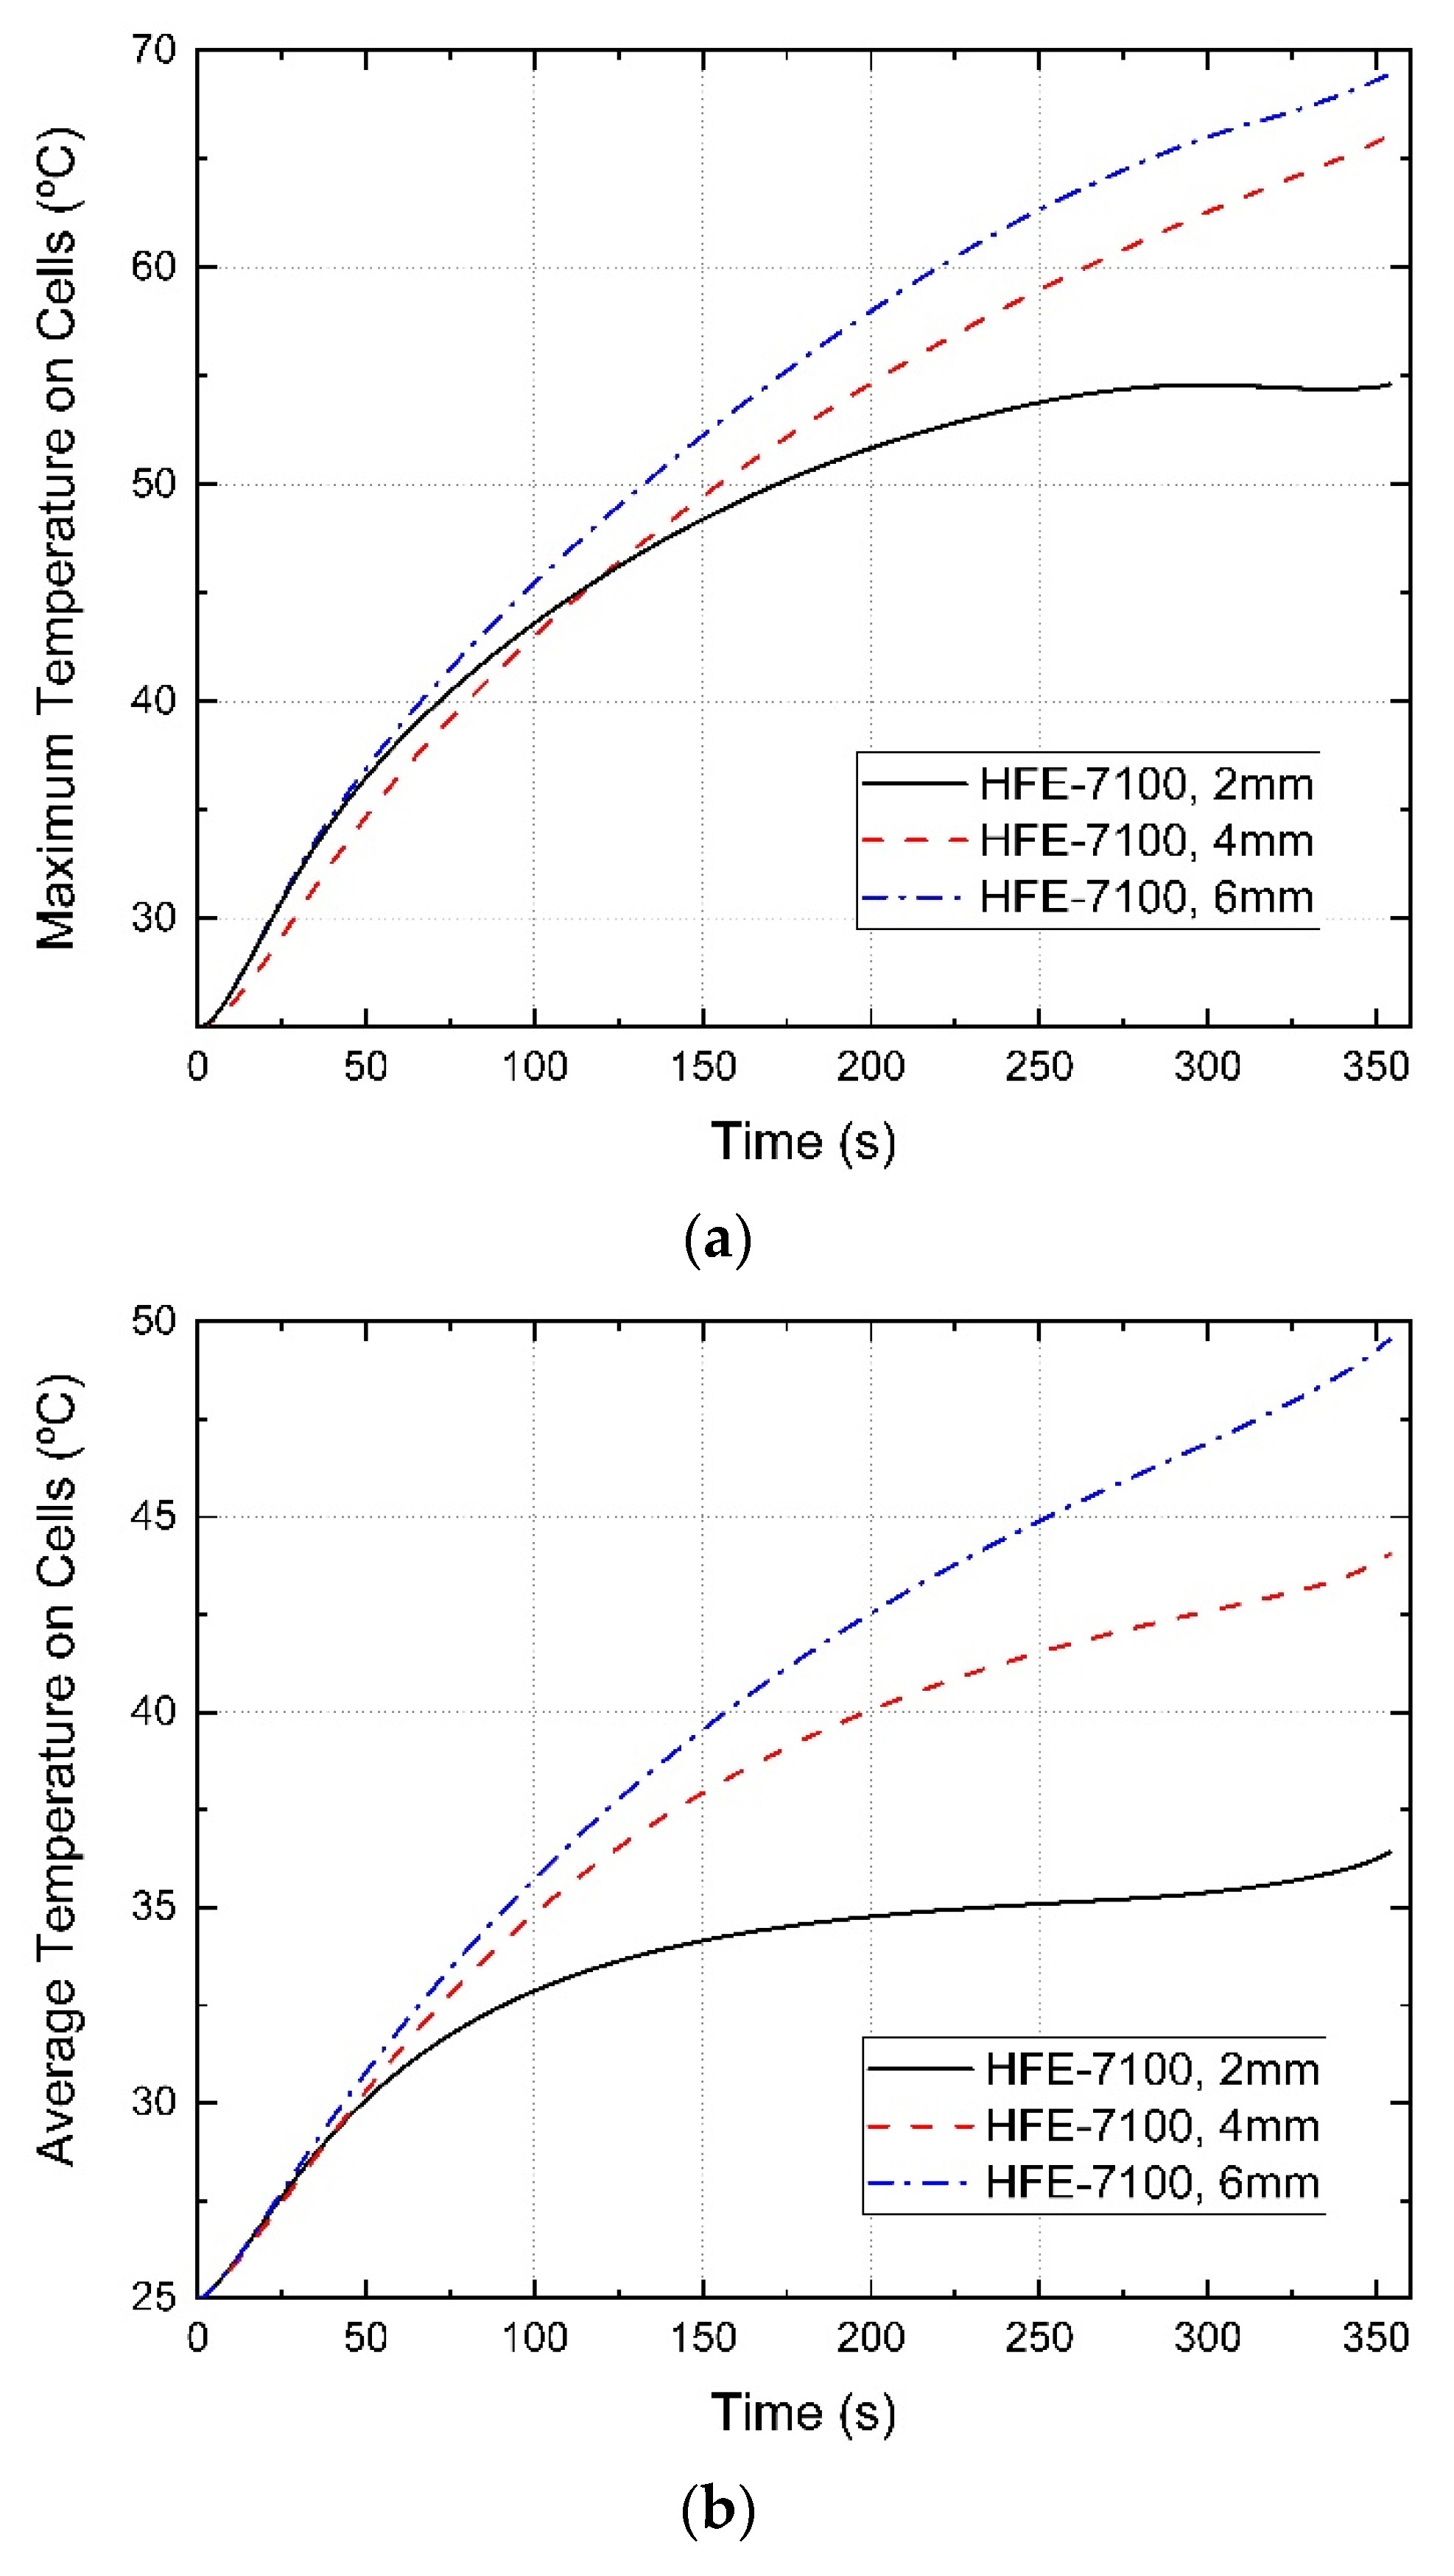
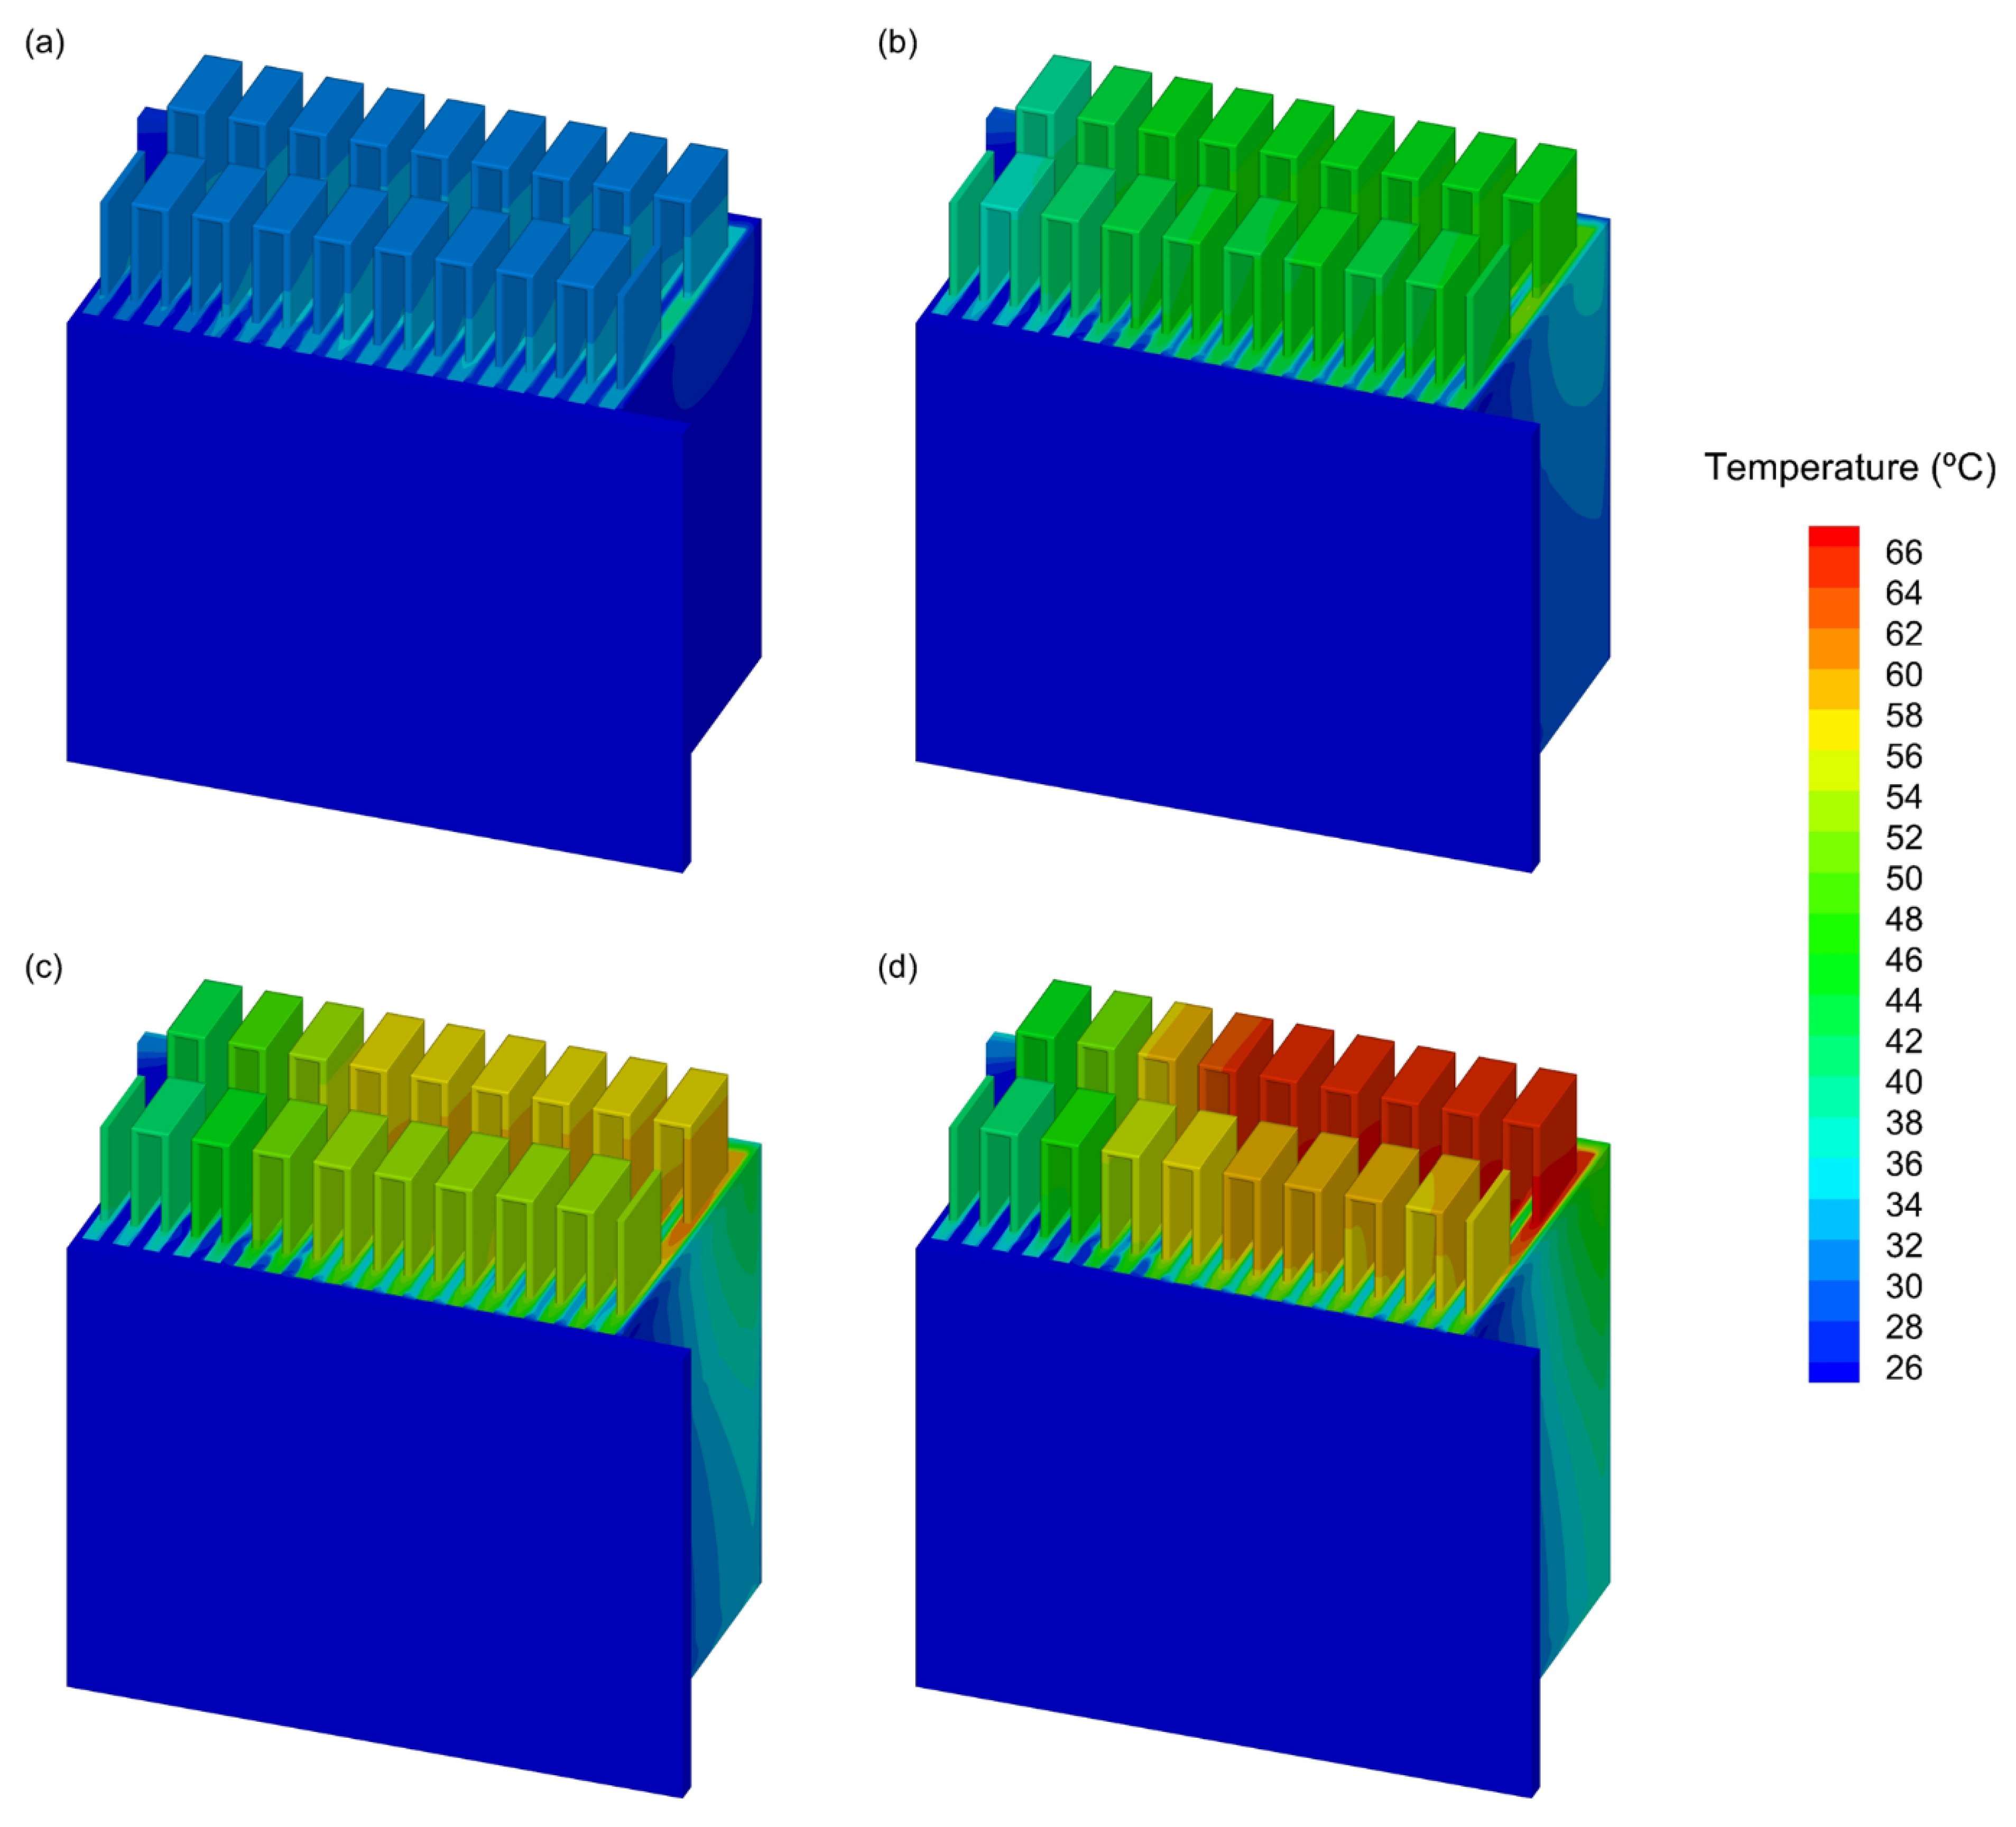
- When fluorinated fluid single-phase forced convection is selected as the cooling method for the battery pack under a 10C discharging rate, the maximum temperature of the battery pack can be controlled up to 65 °C, and the average temperature can be controlled up to about 45 °C. The pressure drop between the inlet and outlet is about 20 Pa, and the power required is of small magnitude. In addition, when two different fluorinated fluids, FC-72 and HFE-7100, are used as the coolant for single-phase direct cooling, the difference in cooling effect is very small. The fluorinated fluid single-phase forced convection cooling has a significant advantage over air forced convection cooling. Further, the influences of flow velocity and cell spacing on the cooling effect were investigated for fluorinated fluid single-phase forced convection. The study found that increasing the flow velocity could lower the temperature of the battery pack to a certain extent and improve the temperature uniformity of the battery pack. For the same flow velocity, reducing the cell spacing in the battery pack can achieve a better cooling effect.
- Finally, a preliminary numerical simulation study on a new cooling method, fluorinated liquid immersion cooling, is made. It is found that it can help to reduce the average temperature and maximum temperature of the battery, and can control the maximum temperature of the battery pack below 35 °C under a 10C discharging rate, and also can effectively reduce the temperature difference in the battery pack. This is a promising cooling method for lithium-ion battery cooling.
Author Contributions
Funding
Conflicts of Interest
References
- Pavlović, T.; Mirjanic, D.; Mitic, I.R.; Stankovic, A.M. The impact of electric cars use on the environment. In International Conference “New Technologies, Development and Applications”; Springer: Cham, Switzerland, 2019; pp. 541–548. [Google Scholar]
- Verma, S.; Mishra, S.; Gaur, A.; Chowdhury, S.; Mohapatra, S.; Dwivedi, G.; Verma, P. A comprehensive review on energy storage in hybrid electric vehicle. J. Traffic Transp. Eng. 2021, 8, 621–637. [Google Scholar] [CrossRef]
- Li, X.; Wang, Z.; Zhang, L. Co-estimation of capacity and state-of-charge for lithium-ion batteries in electric vehicles. Energy 2019, 174, 33–44. [Google Scholar] [CrossRef]
- Akhtar, M.S.; Bui, P.T.M.; Li, Z.; Yang, O.; Paul, B.J.; Kim, S.; Kim, J.; Rai, A.K. Impact of porous Mn3O4 nanostructures on the performance of rechargeable lithium ion battery: Excellent capacity and cyclability. Solid State Ion. 2019, 336, 31–38. [Google Scholar] [CrossRef]
- Takami, N.; Ise, K.; Harada, Y.; Iwasaki, T.; Kishi, T.; Hoshina, K. High-energy, fast-charging, long-life lithium-ion batteries using TiNb2O7 anodes for automotive applications. J. Power Sources 2018, 396, 429–436. [Google Scholar] [CrossRef]
- Zhu, W.H.; Zhu, Y.; Tatarchuk, B.J. Self-discharge characteristics and performance degradation of Ni-MH batteries for storage applications. Int. J. Hydrogen Energy 2014, 39, 19789–19798. [Google Scholar] [CrossRef]
- Pesaran, A.A. Battery thermal models for hybrid vehicle simulations. J. Power Sources 2002, 110, 377–382. [Google Scholar] [CrossRef]
- Sasaki, T.; Ukyo, Y.; Novak, P. Memory effect in a lithium-ion battery. Nat. Mater. 2013, 12, 569–575. [Google Scholar] [CrossRef]
- Zeng, X.; Li, M.; Abd El-Hady, D.; Alshitari, W.; Al-Bogami, A.S.; Lu, J.; Amine, K. Commercialization of Lithium Battery Technologies for Electric Vehicles. Adv. Energy Mater. 2019, 9, 1900161. [Google Scholar] [CrossRef]
- Su, L.; Zhang, J.; Wang, C.; Zhang, Y.; Li, Z.; Song, Y.; Jin, T.; Ma, Z. Identifying main factors of capacity fading in lithium ion cells using orthogonal design of experiments. Appl. Energy 2016, 163, 201–210. [Google Scholar] [CrossRef]
- Bandhauer, T.M.; Garimella, S.; Fuller, T.F. A Critical Review of Thermal Issues in Lithium-Ion Batteries. J. Electrochem. Soc. 2011, 158, R1–R25. [Google Scholar] [CrossRef]
- Vayrynen, A.; Salminen, J. Lithium ion battery production. J. Chem. Thermodyn. 2012, 46, 80–85. [Google Scholar] [CrossRef]
- Motloch, C.G.; Christophersen, J.P.; Belt, J.R.; Wright, R.B.; Hunt, G.L.; Sutula, R.A.; Duong, T.; Tartamella, T.J.; Haskins, H.J.; Miller, T.J. High-power battery testing procedures and analytical methodologies for HEV’s. SAE Trans. 2002, 111, 797–802. [Google Scholar]
- Zhang, J.; Su, L.; Li, Z.; Sun, Y.; Wu, N. The evolution of lithium-ion cell thermal safety with aging examined in a battery testing calorimeter. Batteries 2016, 2, 12. [Google Scholar] [CrossRef] [Green Version]
- Wang, Q.; Ping, P.; Zhao, X.; Chu, G.; Sun, J.; Chen, C. Thermal runaway caused fire and explosion of lithium ion battery. J. Power Sources 2012, 208, 210–224. [Google Scholar] [CrossRef]
- Sun, J.; Li, J.; Zhou, T.; Yang, K.; Wei, S.; Tang, N.; Dang, N.; Li, H.; Qiu, X.; Chen, L. Toxicity, a serious concern of thermal runaway from commercial Li-ion battery. Nano Energy 2016, 27, 313–319. [Google Scholar] [CrossRef]
- Kim, J.; Oh, J.; Lee, H. Review on battery thermal management system for electric vehicles. Appl. Therm. Eng. 2019, 149, 192–212. [Google Scholar] [CrossRef]
- Liu, H.; Wei, Z.; He, W.; Zhao, J. Thermal issues about Li-ion batteries and recent progress in battery thermal management systems: A review. Energy Convers. Manag. 2017, 150, 304–330. [Google Scholar] [CrossRef]
- Lu, M.; Zhang, X.; Ji, J.; Xu, X.; Zhang, Y. Research progress on power battery cooling technology for electric vehicles. J. Energy Storage 2020, 27, 101155. [Google Scholar] [CrossRef]
- Chen, K.; Wu, W.; Yuan, F.; Chen, L.; Wang, S. Cooling efficiency improvement of air-cooled battery thermal management system through designing the flow pattern. Energy 2019, 167, 781–790. [Google Scholar] [CrossRef]
- Park, H. A design of air flow configuration for cooling lithium ion battery in hybrid electric vehicles. J. Power Sources 2013, 239, 30–36. [Google Scholar] [CrossRef]
- Liu, Y.; Zhang, J. Design a J-type air-based battery thermal management system through surrogate-based optimization. Appl. Energy 2019, 252, 113426. [Google Scholar] [CrossRef]
- Wang, J.; Lu, S.; Wang, Y.; Li, C.; Wang, K. Effect analysis on thermal behavior enhancement of lithium-ion battery pack with different cooling structures. J. Energy Storage 2020, 32, 101800. [Google Scholar] [CrossRef]
- Shang, Z.; Qi, H.; Liu, X.; Ouyang, C.; Wang, Y. Structural optimization of lithium-ion battery for improving thermal performance based on a liquid cooling system. Int. J. Heat Mass Transf. 2019, 130, 33–41. [Google Scholar] [CrossRef]
- E, J.; Han, D.; Qiu, A.; Zhu, H.; Deng, Y.; Chen, J.; Zhao, X.; Zuo, W.; Wang, H.; Chen, J.; et al. Orthogonal experimental design of liquid-cooling structure on the cooling effect of a liquid-cooled battery thermal management system. Appl. Therm. Eng. 2018, 132, 508–520. [Google Scholar] [CrossRef]
- Wu, W.; Wang, S.; Wu, W.; Chen, K.; Hong, S.; Lai, Y. A critical review of battery thermal performance and liquid based battery thermal management. Energy Convers. Manag. 2019, 182, 262–281. [Google Scholar] [CrossRef]
- Li, Y.; Zhou, Z.; Wu, W. Three-dimensional thermal modeling of Li-ion battery cell and 50 V Li-ion battery pack cooled by mini-channel cold plate. Appl. Therm. Eng. 2019, 147, 829–840. [Google Scholar] [CrossRef]
- Qian, Z.; Li, Y.; Rao, Z. Thermal performance of lithium-ion battery thermal management system by using mini-channel cooling. Energy Convers. Manag. 2016, 126, 622–631. [Google Scholar] [CrossRef]
- Park, S.; Jang, D.S.; Lee, D.; Hong, S.H.; Kim, Y. Simulation on cooling performance characteristics of a refrigerant-cooled active thermal management system for lithium ion batteries. Int. J. Heat Mass Transf. 2019, 135, 131–141. [Google Scholar] [CrossRef]
- An, Z.; Jia, L.; Li, X.; Ding, Y. Experimental investigation on lithium-ion battery thermal management based on flow boiling in mini-channel. Appl. Therm. Eng. 2017, 117, 534–543. [Google Scholar] [CrossRef]
- van Gils, R.W.; Danilov, D.; Notten, P.H.L.; Speetjens, M.F.M.; Nijmeijer, H. Battery thermal management by boiling heat-transfer. Energy Convers. Manag. 2014, 79, 9–17. [Google Scholar] [CrossRef]
- Wang, Y.; Wu, J. Thermal performance predictions for an HFE-7000 direct flow boiling cooled battery thermal management system for electric vehicles. Energy Convers. Manag. 2020, 207, 112569. [Google Scholar] [CrossRef]
- Rao, Z.; Wang, Q.; Huang, C. Investigation of the thermal performance of phase change material/mini-channel coupled battery thermal management system. Appl. Energy 2016, 164, 659–669. [Google Scholar] [CrossRef]
- Zou, D.; Ma, X.; Liu, X.; Zheng, P.; Hu, Y. Thermal performance enhancement of composite phase change materials (PCM) using graphene and carbon nanotubes as additives for the potential application in lithium-ion power battery. Int. J. Heat Mass Transf. 2018, 120, 33–41. [Google Scholar] [CrossRef]
- Rao, Z.; Wang, S.; Wu, M.; Lin, Z.; Li, F. Experimental investigation on thermal management of electric vehicle battery with heat pipe. Energy Convers. Manag. 2013, 65, 92–97. [Google Scholar] [CrossRef]
- Li, X.; Zhong, Z.; Luo, J.; Wang, Z.; Yuan, W.; Zhang, G.; Yang, C.; Yang, C. Experimental Investigation on a Thermoelectric Cooler for Thermal Management of a Lithium-Ion Battery Module. Int. J. Photoenergy 2019, 2019, 3725364. [Google Scholar] [CrossRef] [Green Version]
- Mousavi, G.S.M.; Nikdel, M. Various battery models for various simulation studies and applications. Renew. Sustain. Energy Rev. 2014, 32, 477–485. [Google Scholar] [CrossRef]
- Chen, M.; Rincon-Mora, G. Accurate electrical battery model capable of predicting, runtime and I-V performance. IEEE Trans. Energy Conver. 2006, 21, 504–511. [Google Scholar] [CrossRef]
- Kwon, K.H.; Shin, C.B.; Kang, T.H.; Kim, C.S. A two-dimensional modeling of a lithium-polymer battery. J. Power Sources 2006, 163, 151–157. [Google Scholar] [CrossRef]
- Doyle, M.; Fuller, T.F.; Newman, J. Modeling of Galvanostatic Charge and Discharge of the Lithium Polymer Insertion Cell. J. Electrochem. Soc. 1993, 140, 1526–1533. [Google Scholar] [CrossRef]
- Jiang, Z.Y.; Qu, Z.G. Lithium-ion battery thermal management using heat pipe and phase change material during discharge-charge cycle: A comprehensive numerical study. Appl. Energy 2019, 242, 378–392. [Google Scholar] [CrossRef]
- Sun, H.; Wang, X.; Tossan, B.; Dixon, R. Three-dimensional thermal modeling of a lithium-ion battery pack. J. Power Sources 2012, 206, 349–356. [Google Scholar] [CrossRef]
- Basu, S.; Hariharan, K.S.; Kolake, S.M.; Song, T.; Sohn, D.K.; Yeo, T. Coupled electrochemical thermal modelling of a novel Li-ion battery pack thermal management system. Appl. Energy 2016, 181, 1–13. [Google Scholar] [CrossRef]
- Li, Q.; Yang, C.; Santhanagopalan, S.; Smith, K.; Lamb, J.; Steele, L.A.; Torres-Castro, L. Numerical investigation of thermal runaway mitigation through a passive thermal management system. J. Power Sources 2019, 429, 80–88. [Google Scholar] [CrossRef]
- Patil, M.S.; Seo, J.H.; Lee, M.Y. A novel dielectric fluid immersion cooling technology for Li-ion battery thermal management. Energy Convers. Manag. 2021, 229, 113715. [Google Scholar] [CrossRef]
- Taheri, P.; Bahrami, M. Temperature rise in prismatic polymer lithium-ion batteries: An analytic approach. SAE Int. 2012, 5, 164–176. [Google Scholar] [CrossRef] [Green Version]
- El-Genk, M.S.; Bostanci, H. Saturation boiling of HFE-7100 from a copper surface, simulating a microelectronic chip. Int. J. Heat Mass Transf. 2003, 46, 1841–1854. [Google Scholar] [CrossRef]
- ANSYS, Inc. Ansys Fluent 18.0 Advanced Add-on Module Guide Documentation; ANSYS, Inc.: Canonsburg, PA, USA, 2017. [Google Scholar]
- A123 Systems. Battery Pack Design Validation and Assembly Guide Using A123 Systems AMP20M1HD-A Nanophosphate Cells; A123 Systems: Hangzhou, China, 2014; p. 22. [Google Scholar]
- Bernardi, D.; Pawlikowski, E.; Newman, J. A general energy balance for battery systems. J. Electrochem. Soc. 1985, 132, 5–12. [Google Scholar] [CrossRef] [Green Version]
- Ghiaasiaan, S.M. Convective Heat and Mass Transfer; CRC Press: Boca Raton, FL, USA, 2018. [Google Scholar]


| Parameters | Values |
|---|---|
| Cell length | 205.5 mm |
| Cell width | 156.0 mm |
| Cell thickness | 7.1 mm |
| Nominal voltage | 3.3 V |
| Nominal capacity | 20 Ah |
| Materials | ||||
|---|---|---|---|---|
| Cell domain | 1871.7 | 678 | - | - |
| Aluminum | 2719 | 871 | 202.4 | - |
| Cooper | 8978 | 381 | 387.6 | - |
| Air | 1.225 | 1006.43 | 0.0242 | 1.79 × 10⁻⁵ |
| FC-72 | 1602.2 | 1101 | 0.054 | 4.33 × 10⁻⁴ |
| HFE-7100 | 1370.2 | 1255 | 0.062 | 3.7 × 10⁻⁴ |
| Method | 0.01 m/s | 0.02 m/s | 0.05 m/s | 0.1 m/s |
|---|---|---|---|---|
| FC-72 | 0.33 Pa | 1.03 Pa | 5.47 Pa | 20.76 Pa |
| HFE-7100 | 0.28 Pa | 0.88 Pa | 4.68 Pa | 17.85 Pa |
| Method | 0.01 m/s | 0.02 m/s | 0.05 m/s | 0.1 m/s |
|---|---|---|---|---|
| FC-72 | 45.43 °C | 37.72 °C | 30.67 °C | 27.80 °C |
| HFE-7100 | 46.23 °C | 38.24 °C | 30.90 °C | 27.88 °C |
| Cell Spacing | 2 mm | 4 mm | 6 mm |
|---|---|---|---|
| Pressure difference (Pa) | 18.07 | 17.85 | 15.80 |
| Average fluid outlet temperature (°C) | 28.21 | 27.88 | 27.80 |
Publisher’s Note: MDPI stays neutral with regard to jurisdictional claims in published maps and institutional affiliations. |
© 2022 by the authors. Licensee MDPI, Basel, Switzerland. This article is an open access article distributed under the terms and conditions of the Creative Commons Attribution (CC BY) license (https://creativecommons.org/licenses/by/4.0/).
Share and Cite
Li, Y.; Zhou, Z.; Su, L.; Bai, M.; Gao, L.; Li, Y.; Liu, X.; Li, Y.; Song, Y. Numerical Simulations for Indirect and Direct Cooling of 54 V LiFePO4 Battery Pack. Energies 2022, 15, 4581. https://doi.org/10.3390/en15134581
Li Y, Zhou Z, Su L, Bai M, Gao L, Li Y, Liu X, Li Y, Song Y. Numerical Simulations for Indirect and Direct Cooling of 54 V LiFePO4 Battery Pack. Energies. 2022; 15(13):4581. https://doi.org/10.3390/en15134581
Chicago/Turabian StyleLi, Yulong, Zhifu Zhou, Laisuo Su, Minli Bai, Linsong Gao, Yang Li, Xuanyu Liu, Yubai Li, and Yongchen Song. 2022. "Numerical Simulations for Indirect and Direct Cooling of 54 V LiFePO4 Battery Pack" Energies 15, no. 13: 4581. https://doi.org/10.3390/en15134581
APA StyleLi, Y., Zhou, Z., Su, L., Bai, M., Gao, L., Li, Y., Liu, X., Li, Y., & Song, Y. (2022). Numerical Simulations for Indirect and Direct Cooling of 54 V LiFePO4 Battery Pack. Energies, 15(13), 4581. https://doi.org/10.3390/en15134581