Article

Solar Energy Resources and Photovoltaic Power Potential of an Underutilised Region: A Case of Alice, South Africa

by
Ochuko Kelvin Overen
* and
Edson Leroy Meyer
Fort Hare Institute of Technology, University of Fort Hare, Private Bag X1314, Alice 5700, Eastern Cape, South Africa
*
Author to whom correspondence should be addressed.
Energies 2022, 15(13), 4646; https://doi.org/10.3390/en15134646
Submission received: 2 March 2022 / Revised: 1 April 2022 / Accepted: 11 April 2022 / Published: 24 June 2022

Abstract

:
Despite South Africa’s international recognition in solar energy investments, the country is struggling to meet its growing energy needs. In recent years, national blackouts and load shedding have been a recurring experience in the country. The high cost of electrification and the overstrained national grid have left several rural communities without access to electricity. This study aims to explore the solar energy resources and performance of a 3.8 kWp stand-alone residential photovoltaic (PV) power system in one of the underutilised regions in South Africa. The study mainly uses ground measured solar radiation data to evaluate the solar resources of Alice and compare them with those in other parts of the world with mega solar PV projects. The components of solar radiation considered are global horizontal irradiance (GHI), direct normal irradiance (DNI), and diffuse horizontal irradiance (DHI). The average total daily GHI, DNI, and DHI of Alice were 4.98, 5.74, and 1.44 kWh/m2. Clear sky conditions were found to occur on 233 days in the monitoring year, resulting in an average total daily GHI of 6.13 kWh/m2, DNI of 6.73 kWh/m2 and DHI of 0.17 kWh/m2. The findings indicated that Alice possesses abundant solar resources for PV and concentrated solar power generation, and is comparable to other regions internationally.

1. Introduction

Globally, solar photovoltaic (PV) is the fastest growing and most adopted renewable energy technology. In 2018, an increase in renewable power capacity outpaced net installed fossil fuel and nuclear power combined, growing by approximately 2.4 TW. Solar PV represented 55% of the total installed renewable capacity, followed by wind and hydro, which accounted for 28% and 11%, respectively [1]. The United Nations Environmental Programme (UNEP) noted that the addition of 638 GW of solar PV power capacity at the end of 2010–2019 was a remarkable achievement for the growth of the technology [2]. Over the same period, the programme identified China as the biggest investor in renewable energy among the top 20 markets, investing USD 758 billion between 2010 and the first half of 2019. Along with China, Japan, the United States, the United Kingdom and Germany, with USD 356, USD 202, USD 179, and USD 122 billion, respectively, are the top five investors. South Africa occupies the 17th position, having invested USD 20 billion [2]. Three years later, investment in renewable energy continues to grow due to technological advancement and reduced cost of deployment and installation of solar PV and wind power plants [3]. Investment in renewable energy dominated new power generation in 2020/201, and it is expected to account for 70% of the USD 530 billion spent on all new generation capacity in 2021/2022 [3]. China still leads global renewable energy investment, followed by the United States, Europe, and India.
Despite the advancement and recognition of solar PV, adoption of the technology, mostly at a utility-scale, is limited to specific regions. Stegmann [4] listed geotechnical conditions, environmental conditions, site topography, grid condition, local legislation, local expertise and specific local requirements as some of the challenges faced in the design of solar PV plants and the global adoption of the technology. Said et al. [5] highlighted the fact that the environmental conditions influencing solar PV performance include solar radiation, air temperature, relative humidity, wind speed, and direction. Solar radiation and air temperature were set out as the most influencing factors. Fountoukis et al. [5] investigated the effect of dust on the daily energy yield loss of a solar PV system to establish the potential of the technology in arid environments. Daily PV energy production data, solar radiation, and atmospheric particulate matter over a year at the Solar Test Facility in Doha, Qatar, were continuously monitored and used in the study. Based on the combined prediction of global horizontal irradiance and the dust deposit rate in Qatar, the authors [5] suggested that floating solar PV systems in a hot desert climate would be beneficial to energy yield due to the reduction of soiling.
From the above studies, it may be concluded that solar resources are the most influential factor in determining the potential of solar energy technologies in a given region. Solar resources are comprised of direct or beam normal irradiance (DNI), diffuse horizontal irradiance (DHI) and global horizontal irradiance (GHI). In terms of solar radiation observations, DNI is the solar radiation that reaches the surface of the earth without attenuation, and is measured at a normal plane to the sun’s disk. The scattered solar radiation from the atmosphere to a horizontal plane on the earth’s surface is called DHI, while the component reflected in the atmosphere is called albedo. When observed on a horizontal plane, the sum of DNI and DHI at the surface of the earth without albedo is referred to as global horizontal irradiance (GHI) [6]. On a tilted surface, it is referred to as global tilted irradiance (GTI) [7].
Satellite-based datasets/web-based applications such as National Solar Radiation Database (NSRD) [8], SolarGIS [9], Global Solar Atlas 2.0 (GSA) [10], and Solcast [11] have adopted one or two solar components to predict the solar resources of a particular location. According to Ernst and Gooday [12], Solcast uses measured GHI and decomposition models to determine the DNI and DHI of a location. SolarGIS [7] uses satellite-based DNI and GHI to compute the DHI and GTI. Both tools are paid subscription web-based applications that use the solar resources of a location, pre-set by the users, to forecast short- and long-term PV energy production for rooftop and utility-scale solar applications. On the other hand, GSA is a free, web-based solar energy resource application that offers similar services and data as SolarGIS and Solcast. GSA is funded by the Energy Sector Management Assistance Program (ESMAP) and operated by SolarGIS on behalf of the World Bank Group. Concerning solar applications, DNI is very important for forecasting solar thermal concentrated systems such as concentrated photovoltaic (CPV) and concentrated solar power (CSP). Performance and energy output predictions of flat plate collectors and solar PV applications mainly require DHI and GHI in the absence of GTI [13,14].
Besides the use of satellite-based solar resources to determine solar PV potential, continuous on-site solar measurements and corresponding PV energy output are often discussed among researchers. In the Saharan region, Necaibia et al. [15] evaluated the technical feasibility of a 2.5 kWp solar PV system for a stand-alone power generation. The authors adopted an on-site continuous research approach that consisted of electrical and meteorological data acquisition systems for continuous observations of the solar PV system and local weather conditions. Typical solar PV system performance parameters such as final yield, module efficiency, AC energy output, DC energy output, array yield, reference yield and performance ratio were employed in their research. The authors [15] found an average of 4.88 kWh/kWp/day per annum and a 74% performance ratio for the solar PV system in the region. In Slovenia, Seme et al. [16] adopted similar parameters to assess the performance of 3326 solar PV systems. The authors [16] found that the final yield and capacity utilisation factor were up to 1038 kWh/kWp and 12%, while the performance ratio was 69%.
Despite the abundant year-round solar energy resources in South Africa, very few utility-scale solar PV plants are operational in the country, and those that are present are limited to certain regions. A GSA map of South Africa showing the total annual GHI and installed solar PV (SPV) per province is presented in Figure 1a,b, respectively [10].
As shown on the map, the country experiences an average total irradiation of 2025 kWh/m2 per annum, equivalent to 5.56 kWh/m2/day. The average irradiation difference among the provinces is 114 kWh/m2, i.e., an average daily difference of 0.30 kWh/m2. The Northern Cape (NC) province has the highest solar radiation of 2282 kWh/m2, while KwaZulu Natal (KZN), with 1786 kWh/m2, experiences the least. Given the deteriorating condition of coal-fired power plants, the need to increase energy access, and the will to reduce greenhouse gas emissions in South Africa, the government has partnered with international agencies and global leaders in the transition to clean and sustainable energy to avert the country’s energy crisis. Figure 1b shows a graph of the South African Department of Energy (DoE) commissioned Independent Power Producers (IPP) Solar PV projects in 2017 [17] and the average total daily GHI of the various provinces in South Africa. As shown, solar PV projects are irregularly deployed in South Africa, as the technology distribution does not directly correspond with solar resource availability in the provinces. For example, the North West (NW) province experienced the second-highest GHI with 5.96 kWh/m2/day, but only had one operational solar PV project. This is not comparable with the Western Cape (WC), which had the second-highest operational solar PV projects but experienced the third-lowest daily solar radiation. A similar pattern can be observed in provinces such as the Freestate (FS) and Gauteng, with average daily irradiance of 0.40 and 0.16 kWh/m2 higher than that of the WC province, although the number of solar PV projects in both provinces is 50% less than that of the WC.
Communities in South Africa such as Dangershoek (−30°37′45″, 27°47′03″) and Nomlengane (−30°37′40″, 27°49′05″), with annual solar irradiation comparable to that of Tibet in China or Arizona in the USA, lack connectivity to the national grid and access to electricity. Like other natural resources such as coal and crude oil, solar energy provides job opportunities, community development, and basic amenities. These are some of the benefits that can be achieved across the country by more evenly distributing solar PV projects among various provinces. Besides clean and sustainable energy supply, solar energy can be structured to indirectly provide service delivery, particularly in impoverished rural communities with low-investment returns. Therefore, the need to evaluate the solar resource and PV power generation potential of the underutilised regions in the country is crucial if we are to achieve clean energy generation and sustainable rural development. The findings of this study could also attract local and foreign solar PV investors to the region considered in this study. Therefore, this study aims to assess the solar resources and PV power potential of one of the underutilised regions in South Africa.

2. Parameters for PV System Evaluation

Performance evaluation parameters for solar PV systems, as outlined in the IEA 61724 standard [18], are covered in this section. Array yield is referred to as the period in which the PV system operates at its nominal power (PVp,rated) to generate array DC energy (EDC), which is given as [19]
γ a = E D C P V P , r a t e d   ( kWh / kWp )
Final yield is the total AC energy (EAC) generation over a specified period compared to the rated power of the installed PV modules, which is given as [20]
γ f = E A C P V P , r a t e d   ( kWh / kWp )  
Both parameters can be deduced over days, months and years [21]. In addition, the ratio of the total global horizontal irradiation (Ht) to the PV reference irradiance (Go) at Standard Test Conditions (STC) is known as the reference yield (γr), and is expressed as [22]
γ r = H t G o   ( kWh / m 2 / kW / m 2 )  
where Go is equal to 1 kW/m2 [23], H t is the number of peak sun hours and defines the available solar resources for the PV system. Hence γ r values vary with regions, season and PV array orientation. The ratio of Equations (2) and (3) is known as performance ratio (PRAC), and it is calculated by
P R A C = γ f γ r
where PRAC is performance ratio based on AC energy, in this case, the inverter energy output. Although PRAC is dimensionless mathematically, it is often expressed in percentage (%) among researchers [24]. According to Marion et al. [18], PRAC is usually determined over a month or year period; weekly or daily PRAC values are useful for diagnosing component failures in PV systems. PRDC, which is based on the generated DC energy before the inverter, can be computed by substituting γ f with γ a in Equation (4). Furthermore, the PV module ( η P V ) and inverter ( η i n v ) efficiencies which were both considered as the PV system efficiency in this study, can be respectively determined by [25]
η P V = E D C H t × A × 100   ( % )
and
η i n v = E A C E D C × 100   ( % )
where A is the total surface area of the installed PV modules (m2), excluding the frames.
From the demand-side, capacity utilisation factor (CUF) is another parameter used in evaluating PV system performance. CUF is the actual energy output divided by the theoretical maximum energy output of the PV system. This is usually calculated over a yearly period, and is given as [26]
C U F = E A C , y e a r ( 365 d a y × 24 h o u r s ) × P V P , r a t e d = γ f , y e a r 8760 × 100   ( % )

3. A Brief Description of the Town of Alice

The town of Alice is geographically located at 32.8° S and 26.8° E at an altitude of 540 m above sea-level. Alice is a commercial hub for over 20 rural communities. Most households in the communities rely on the government social grants and monthly 50 kWh free basic electricity. Thus, the operation of a utility-scale solar PV system has become significant not only for environmental sustainability but also to ease the economic pressure on the government in terms of achieving its free basic rural electrification initiative [27].
In terms of weather conditions, the town falls under zone 2 in South Africa, i.e., with temperate interior climate [28]. The total annual global horizontal irradiation in Alice is illustrated in Figure 2 [10].
According to the climate classification and existing study, an average dry-bulb air temperature of 29.0 °C is experienced in the summer and 15 °C in the winter. The average annual wind in the town is 2.5 m/s with no sandstorms or snowfall. Rainfall occurs during the summer while winters are relatively dry [29,30]. According to the Koppen-Geiger classification, Alice experiences a BSh Arid, Steppe, and Hot Arid climate, which is categorised by a precipitation and temperature greater than 5 (precipitation threshold) Pth and +18 °C per annum [31,32], respectively. Although Alice is not among the regions with the most solar radiation in South Africa, the town experiences an annual total global horizontal irradiation of 1771.1 kWh/m2, i.e., approximately 4.85 kWh/m2 per day, according to GSA [10].
The Integrated Virtual Environment (IES) application (version 2021) was used to create a sun path diagram for Alice, as shown in Figure 3. A sun path diagram is used to illustrate the seasonal daily traverse of the sun across the sky in a given location relative to a building or solar power generation plant. Sun path diagrams are therefore useful to architects in designing and planning the construction of passive solar spacing and daylighting. Solar power plant project developers also utilise sun path diagrams to determine the optimal orientation and elevation of fixed mounted solar PV systems. In Figure 3, 1 January to 31 December was selected to simulate the annual sun path in Alice; 21 June and December are the winter and summer solstices, respectively, while 21 March and September are the equinoxes. A shorter daytime is observed in Alice during the winter solstice, as the sun rises at 07h00 due northeast (61.70°) and sets at 17h00 due northwest (298.28°). A longer day is experienced during the summer solstice, as the sun rises at 05h00 due southeast (118.28°) and sets at 19h00 due southwest (241.70°).
The solar exposure in Alice for a typical rooftop solar PV system was simulated and expressed in monthly solar irradiation in an imaginary grid of 1 m2, as presented in Figure 4. In other words, Figure 4 visualises the solar irradiation on the roof of a house in a 1 m2 grid. It indicates the area of the roof with optimal monthly solar radiation. For example, the south-facing side of the roof has a low solar exposure throughout the year and, thus, a relatively low solar irradiation and potential for solar PV power generation. However, the roof’s north-facing side experienced a higher solar exposure and resultant solar irradiation all year round. On the north-facing side, between November and February, which represents the peak summer season, the average solar irradiation was approximately 180.00 kWh/m2, equivalent to 6 kWh/m2/day. The peak winter season average solar irradiation from June to August was approximately 15.00 kWh/m2, i.e., equivalent to 4 kWh/m2/day. As such, north-facing solar PV systems will have an optimum yield in Alice.

4. Research Materials and Method

4.1. The Solar PV System

The case study solar PV system is this research is a rooftop solar PV system at the SolarWatt Park in the University of Fort Hare, Alice Campus, Eastern Cape Province in South Africa, as shown in Figure 5.
The site was considered to be suitable for a solar PV system due to the absence of sun blocking features such as trees, high-rising buildings, mountains, and electric poles. In addition, the rooftop solar PV system is north facing with a tilt angle of 20°. It should be indicated that the adopted tilt angle is not the optimum angle for solar PV system performance in the region, but was used due to the local building regulations and design constraints. Based on the GSA [10] solar PV system design assessment of the region, the PV array tilt angle is 13° lesser than the tilt angle for optimum solar PV system performance. Further, the PV array consisted of 20 sets of 190 W HIP-190N1-BO-02 PV modules, which amounted to 3.8 kWp. A technical synopsis of the PV modules is presented in Table 1 [33].
In addition to the PV modules, the solar PV system comprises a charge controller (FLEX Max 80), inverter (Multiplus 48/5 kVA) and battery bank (eight sets of 6 V M-Solar 3MIL 25S). A schematic of the various components of the solar PV system is presented in Figure 6.
The FLEX Max80 charge controller employed a Maximum Power Point Tracking (MPPT) algorithm as its principle of operation to charge the batteries and power the house load. Typically, MPPT charge controllers adopt four fundamental operation modes to ensure long-term optimum performance of the batteries, namely: boost, equalise, float, and sleep modes. The inverter is equipped with a battery monitoring (BWV-6025) device which provides high-resolution battery voltage and charge/discharge current measurements. The state of charge of the battery is calculated using Peukert’s formula. Peukert’s theory expresses the battery’s capacity in terms of its discharge rate. In other words, an increase in the discharge rate decreases the battery’s capacity. Peukert’s formula is expressed in time, i.e., the duration it would take the battery to power the load. It is also presented in the ampere discharge rate. The BMV-6025 battery monitoring device adopted in this research lacked a data logging capability. However, the inverter used the monitored parameters for the precision protection of the battery [34]. Table 2 and Table 3 contain summaries of the technical specifications of the charge controller and inverter, respectively [34,35].
Additionally, the solar PV system battery bank consisted of eight sets of series-connected batteries. As per the rating of the batteries, the battery bank could deliver 900 Ah with a cell voltage above 1.85 V over 100 h of discharge at a constant room temperature of approximately 25 °C [36].

4.2. Solar and Ambient Air Temperature Monitoring Systems

In this study, a solar monitoring system consisting of a Kipp & Zonen SOLYS Gear Drive (SGD) sun tracker and radiometers was set up in SolarWatt Park to continuously observe the GHI, DNI, and DHI. The SGD also monitors downward longwave irradiance, although analysis of this parameter is outside the scope of this study. A shielded HMP 60 temperature and relative humidity probe was used to measure the ambient air temperature. Photos of the SGD sun tracker with the installed radiometers and shielded HMP 60 temperature and relative humidity probe are shown in Figure 7.
The SGD sun tracker is designed to offset the diurnal and seasonal movement of the earth [37], thereby continually pointing the payload toward the sun. An optical sun sensor aids this payload behaviour by identifying the area in the sky with maximum solar intensity and directing the payload to that region. In addition to sun sensors, the tracker uses the geographic coordinate and local time obtained by an integrated GPS antenna to track the daily movement of the sun. A detailed description of the operation and technical specifications of the SGD sun tracker can be found in [38,39]. The pyrheliometer used to measure the DNI is continually pointed towards the sun during the day due to the movement of the payload, while the two pyranometers located on the top mounting plate move about their axes.
The shaded pyranometer located at the extreme right of the top mounting plate was used to measure diffuse solar radiation. Thus, the shading balls attached to the payload were designed to cast shadows on the shaded pyrgeometer and pyranometer. Therefore, the radiometers were constantly shielded from direct solar radiation as the shading balls moved with the payload. The unshaded pyranometer in the middle of the top mounting plate measured the GHI. The radiometers (CHP1 and CMP 11) in Figure 5 used a sensing element called a thermopile. The optical and electrical specifications of the radiometers considered in this study are summarised in Table 4 [40,41].
The response time in Table 4 refers to the delay before the radiometer responded to incident radiation. The given response time is when a particular radiometer can deliver 95% of its measurement following a step-change in irradiance. In addition, precautions such as the use of a sun shield and horizontal levelling of both pyranometers, as well as the SGD sun tracker, with the aid of the adjustable feet and a bubble level, were taken into consideration to ensure accurate measurements [6]. Other case studies involving the use of the SGD sun tracker for solar resource observations in various parts of the world are listed in [42].
As noted in Figure 7b, only the shielded HMP 60 temperature and relative humidity probe was considered in this research. Relative humidity data are outside the scope of the study. The temperature and relative humidity probe is housed in a white shield, as shown in Figure 7b. The shield prevents solar radiation from influencing the measured air temperature by reflecting the sun rays and allowing the free flow of air through the louvres. The measurement range of the probe is −14.0 °C to 16.0 °C with an accuracy of ±0.6 °C. In addition to the radiometers and the temperature and relative humidity probe, three sets of surface type K thermocouples were used to measure the back of the solar PV module temperatures. The back of the modules was divided into three imaginary vertical layers for measurements. The module temperature used to analyse the PV module performance was the average temperature of all three layers [43].

4.3. Data Acquisition System

The electrical parameters and solar radiation in Alice were measured on-site continuously. Thus, data acquisition systems for the electrical measurement of the PV system and solar resources observation were set up, as presented in Figure 8a,b.
An 80 A shunt resistor with 50 mV drop voltage was used to measure the PV modules and batteries currents. Since the current across the shunt resistor is proportional to the drop voltage, a DT80 dataTaker was used to log the measured current based on a defined voltage to current multiplier. The voltages of the PV modules and batteries were scaled down from 30 VDC to 30 mV by a voltage scaling device, as shown in Figure 8a, for direct measurement by the DT80 dataTaker. Although at a full-scale open circuit, the voltages of the PV modules and batteries were 120 V and 60 V, respectively. Therefore, both voltages were stepped-down with an 80 kΩ potential divider network before the voltage scaling device. Also, a three-phase Schneider IEM 3155 energy meter was used to monitor the inverter output voltage, power and energy. A Campbell Scientific CR1000 datalogger and AM16/32 multiplier were used for the solar resources and ambient air temperature observations [44].

5. Results and Discussions

5.1. Assessment of Solar Resources

In addition to the on-site solar monitoring system, solar radiation data from the Southern Africa University Radiometric Network (SAURAN) was considered. SAURAN is an inter-university initiative that involves installing and operating ground-based solar weather stations in different regions in Southern Africa. Solar radiation parameters monitored at the stations are GHI, DNI, and DHI [45]. A SAURAN station in Alice, which was less than 5 km from the on-site solar monitoring system, was used in this study. SAURAN data were applied in the study to provide comparative verification of the on-site measured data. The on-site measured and SAURAN GHI, DNI and DHI data and resultant monthly irradiation of Alice over a year are presented in Figure 9.
A total of 17,520 data entries were obtained from both stations over a year with 30 min logging intervals. From the on-site station, 0.86%, amounting to 150 data entries, were missing for all parameters. This amount does not include a system malfunction, as shown in Figure 7, which impeded the SGD from tracking the sun, resulting in irregular DNI and DHI data obtained in January. The total amount of lost data increased to 1628, i.e., 9.3% of the entire data collected, while the SAURAN data suffered from only two missing data entries, i.e., less than 1%. A statistical description of the on-site measurement is presented in Table 5.
The Root Mean Square Error (RMSE) and Mean Absolute Error (MAE) statistics tools were used to compare and verify the on-site measurements. Both tools are expressed as
R M S E = 1 N i = 1 N α o n s i t e α S A U R A N 2
and
M A E = i = 1 N α o n s i t e α S A U R A N N
In the context of this study, on-site measurements were considered as predicted variables ( α o n s i t e ), while SAURAN measurements represent the actual values ( α S A U R A N ). The number of data entries, N, was 17,520 (N). As shown in Table 4, a fairly low RMSE and MAE were obtained between the two measurements for all parameters, considering that GHI, DNI, and DHI were as high as 1317, 1047 and 633.5 W/m2, respectively. However, the RMSE and MAE for DNI were approximately twice those of GHI and DHI. This resulted from the high level of accuracy and sensitivity of the DNI observations. The horizontal balancing and stability of the sun tracker have an immense impact on the DNI compared to the other parameters. Further, seasonal variation was more evident in GHI compared to DNI and DHI. This can be attributed to the method of observation given in Section 1. As a result, the range was higher for GHI.
The average total GHI in the winter season was 103.71 kWh/m2, while in the summer season it was 167.24 kWh/m2, where June to August was considered the winter season and September to May the summer season [46]. SolarGIS data was found to be closer to the values in Table 5 than the deduced values from Figure 9, with a difference of 0.14, 0.42 and 0.13 kWh/m2 for GHI, DNI and DHI, respectively. Like the mean daily irradiation in Table 5, SolarGIS daily irradiation was calculated from annual forecast irradiation without considering seasonal variation and periodic cloudy covers. Thus, the daily total GHI from Figure 9 was computed for the winter and summer seasons and grouped into 0.99 kWh/m2 width classes to distinguish between clear and cloudy sky days. GHI was selected as the determinant parameter, since it is related to DNI and DHI. Figure 10 and Figure 11 show the respective summer and winter average days GHI, DNI, and DHI in the various classes.
As shown in Figure 10, the total daily GHI ranged from 0.37 to 9 kWh/m2. Based on the daily irradiance distribution in each class, days with peak irradiance <500 W/m2, i.e., approximately half of the solar constant (1367 W/m2) value, were considered cloudy sky days. However, clear sky days were characterised by maximum irradiance ≥500 W/m2. Therefore, classes with a total daily GHI between 0 and 2.99 kWh/m2 indicated cloudy skies, while 3 to 9.99 kWh/m2 indicated clear sky days. The GHI, DNI, and DHI distribution pattern in each class given in Figure 10 supports the above assumptions and classification, as the GHI and DHI were approximately equal on cloudy sky days with a relatively lower DNI. A reverse scenario was observed on clear sky days: as the DHI decreased, GHI and DNI increased. These findings align with the solar radiation components theory [6], as explained in Section 1. Also, as presented in Table 6, the values of the parameters justify the classification of both days.
In Figure 10, the bars represent the number of days on which a particular class occurred in the year. For example, the total daily GHI class of 0–0.99 kWh/m2 occurred twice, in September and October. This represents only 0.7% of the entire days of the summer season. The average GHI, DNI, DHI distribution on both days constitute the respective solar irradiance profiles given in the class. Similarly, the class with the highest total daily GHI of 9–9.99 kWh/m2 occurred 14 days in the season, with 50% of the days occurring in January. Classes 4–4.99 and 6–6.99 kWh/m2 were the most dominant, with each class representing 15% of the total summer days. Moreover, class 4–4.99 kWh/m2 was mostly observed in April, making up half of the days in the month, while 6–6.99 kWh/m2 was experienced on 12 days in September.
The winter season profiles presented in Figure 11 reveal very similar attributes to the summer season profiles but a shorter total daily GHI range of 0.39 to 5 kWh/m2. Similarly, days with total daily GHI between 0–2.99 kWh/m2 were considered cloudy sky days, as their peak irradiance was below 500 W/m2, while total daily GHI in clear sky days ranged from 3 to 5.99 kWh/m2. In the winter season, class 3–3.99 kWh/m2 was by far the most common, representing 57% of the entire number of days in the season. This was followed by class 2–2.99 kWh/m2, which only occurred on 14 days in the season, i.e., approximately 15%. The maximum daily total GHI class of 5–5.99 kWh/m2 occurred on five days in August only, while class 0–0.99 kWh/m2 was observed a day in each of the three winter months. A summary of the winter season solar radiation on cloudy and clear sky days is given in Table 7.
Comparing Table 6 and Table 7 as well as Figure 10 and Figure 11, DNI was higher than GHI, specifically, on clear sky days. This can be attributed to the pyranometer orientation and pyrheliometer operation (see Section 4.2) concerning the daily seasonal movement of the sun in the sky. At midday in the southern hemisphere, the sun is low on the horizon in the winter season and high in the sky during summer. Since the pyrheliometer is constantly pointed towards the sun disc, the seasonal daily transverse of the sun in the sky has a minimum impact on the observed DNI. This was not the case for the GHI, which was monitored by a horizontally stationed pyranometer on a plane. The pyranometer receives less irradiance in the winter due to increased air mass (AM) as the sun angle reduces [47]. Additionally, the mean DNI in the winter season was found to be higher than that of summer. According to Ziuku et al. [48], similar findings indicated that the seasonal DNI difference could be attributed to the cold, dry winter clear sky conditions and the cloudy, rainy summer season, which are typically experienced in Southern Africa. Figure 10 and Figure 11, as well as Table 6 and Table 7, do not provide details of the frequencies of occurrence for DNI and DHI. Thus, 
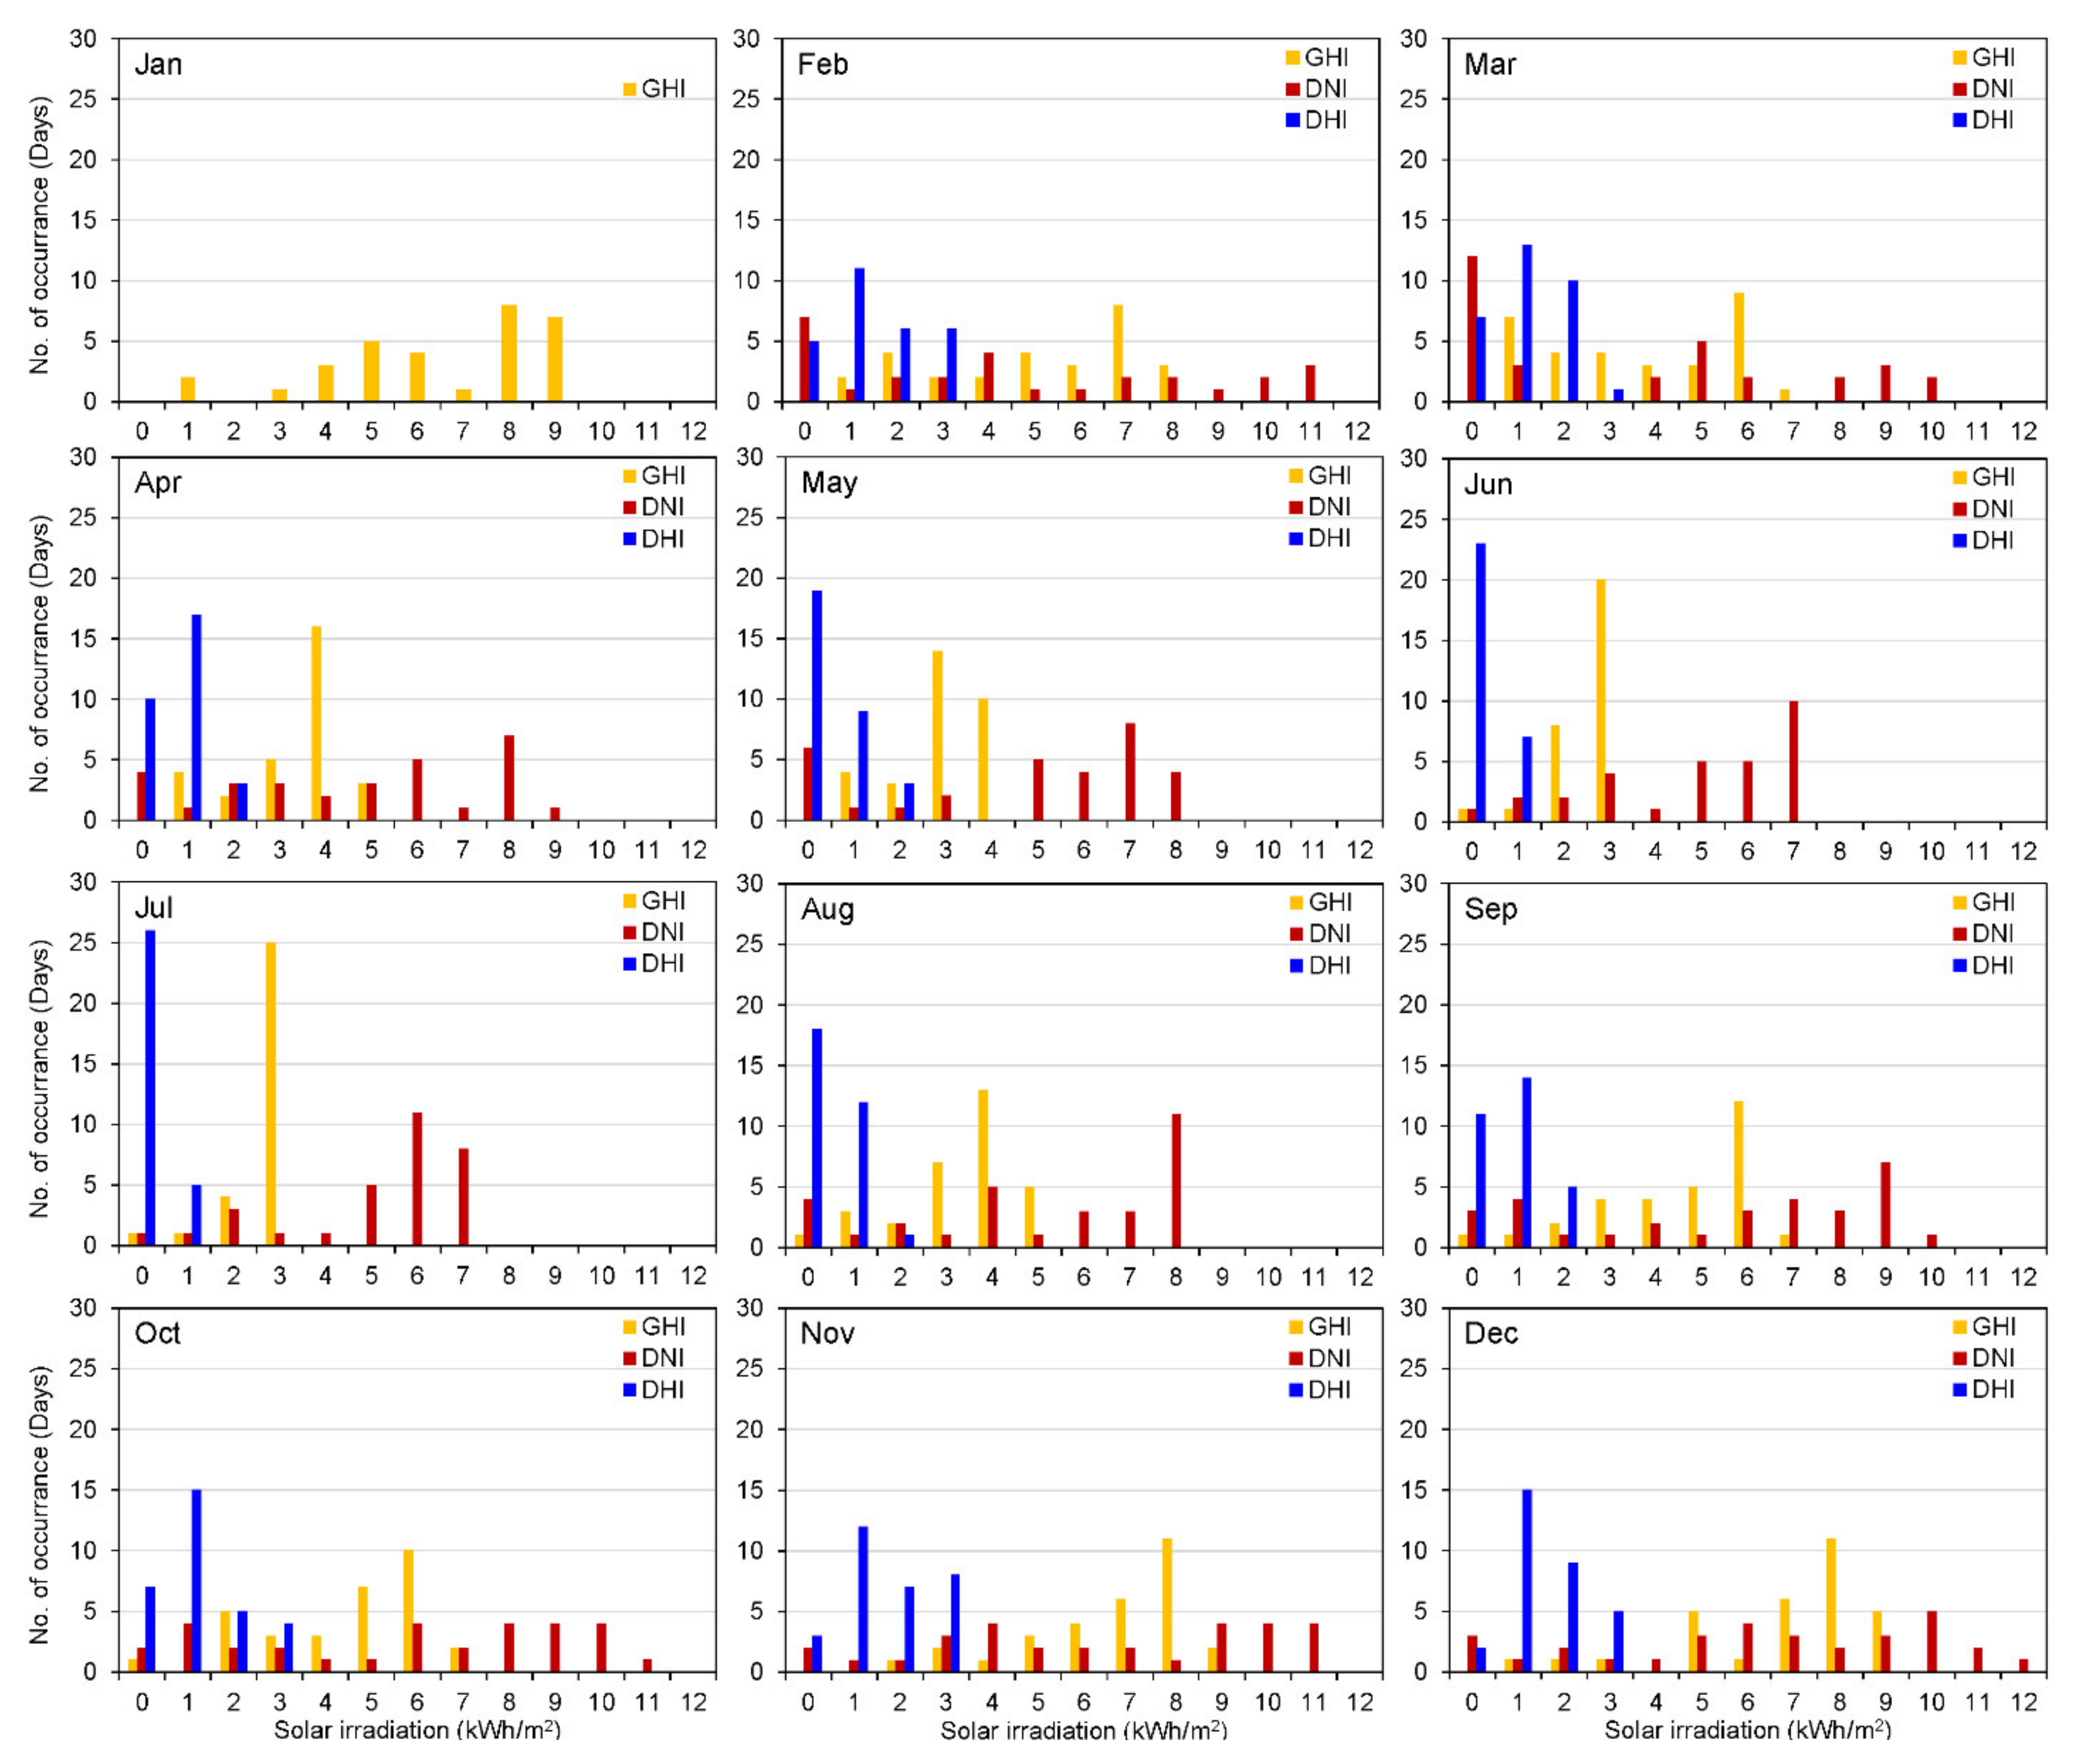
Figure 12 presents monthly bar charts of the daily total GHI, DNI, and DHI regarding their frequency of occurrence.
In Figure 12, the January chart presents the total daily GHI only due to system malfunction, as indicated earlier. Thus, between February and December, the maximum daily DNI observed was 12 kWh/m2, occurring on one day only in December. This was followed by 11 kWh/m2 DNI, observed on ten days between February and December, while all days with 11 kWh/m2 total daily DNI occurred in the summer season, with November having the most. The maximum daily total DNI observed during the winter was 8 kWh/m2, occurring on 11 days in August. In both seasons, total daily DNI was as low as 0 kWh/m2, with March (summer) having the most occurrences, i.e., 12 days.
The findings in Figure 12 are comparable with those of a similar study conducted in the Northern Cape of South Africa, which is among one of the locations in the world with the highest amount of solar resources [49,50]. According to GeoModel (currently SolarGIS) [49], Upington’s total daily GHI and DNI in the Northern Cape of South Africa also ranged from 0–9 kWh/m2 and 0–12 kWh/m2, respectively. However, approximately 7–7.99 kWh/m2 total daily GHI was the most common in the summer season, as well as a total daily DNI of 8–8.99 kWh/m2. In the winter season, daily 6–6.99 kWh/m2 and 7–7.99 kWh/m2 were observed to be the most common. The relatively large number of clear sky days in the Northern cape compared to other regions in the country made the province the solar park of the nation.
As indicated earlier, more than 50% of the country’s operating solar power plants (Solar PV and CSP) are located in the northern cape. According to Hermann et al. [51], CSP plants can operate at an efficiency of 12% under an average annual DNI of 1800 kWh/m2 and up to 16% under 4000 kWh/m2/year, depending on the design. Raboaca et al. [52] indicated that the average annual efficiency of a CSP plant could be up to 15% using a parabolic trough, 8–11% using a linear fresnel reflector, 17–35% using a solar trough and 25–30% using the parabolic dish. Based on the solar resources indicator in Table 5, Table 6 and Table 7, deployment of CSP plants in Alice with optimum design could deliver up to 12% efficiency. Furthermore, a comparison of the solar resources in Alice with those in countries where solar power generation is practised on a large (utility) or small scale was conducted, as presented in Table 8.
Satellite-based (GSA and SolarGIS) data were used in the comparison of solar resources presented in Table 8. The difference between the on-site (Table 5) and satellite-based GHI, DNI and DHI were respectively 50, 143 and 49 kWh/m2. Satellite-based data were adopted to ensure an unbiased comparison. The difference between the average annual solar irradiation in other regions and that of Alice was used to establish the comparison. Hence, a negative value indicates that the annual solar irradiation of Alice is higher than that of the specified region, and vice versa. Among the 19 locations considered in the comparison, only seven experienced higher GHI and DNI than Alice, i.e., Fuentes de Andalucia in Spain, Calama, the Atacama Desert in Chile, Arizona (both locations) in the US, Langkzi, Zhongba and Gongha in China and Ouarzazate in Morocco. The average annual GHI for regions such as Meuro in Germany, Kimberly in Canada and Gangwon in South Korea were less than that of Alice by 679, 422, and 311 kWh/m2, respectively. A minimum of 85 kWp solar PV plant is operational in all three regions, with Germany having the maximum installed solar PV plant of 166 MW. Also, the average annual DNI in Delingha, China, with a 50 MW tower CSP plant, is less than 24 kWh/m2.

5.2. Performance Analysis of a Solar PV System in Alice

The performance of the solar PV system relative to the weather conditions in Alice is covered in this section. During this research, the house was occupied by a member of the university staff and his daughter. Between 08h00 and 15h00 from Monday to Friday (weekdays), the occupants were observed to be out for their daily activities. On Saturday and Sunday (weekends), the house was unoccupied.
Two months of data, including a typical summer (March) and winter months (August), were considered in analysing the solar PV system performance. The on-site measured global horizontal irradiance (GHI), solar PV power generation, and the house load demand in the two months covered, are presented in Figure 13.
In Figure 13, the period when the batteries were used to power the house load (discharge) is indicated with −ve Amps, while +ve Amps implies that the batteries were charging. Also, the short regular peaks represent low-demand periods (LDP). During these periods, only the refrigerator and a few lights were operational. On the other hand, the irregular upward peaks resulted from the use of a pressing iron, electric stove, microwave oven, electric kettle or other high energy consuming appliance. These periods are classified as high-demand periods (HDP) in the analysis and discussion of the results hereafter. Table 9 contains a summary of the solar PV generation amounts in the summer and winter months, as well as the battery charge/discharge rate and house demand during both periods mentioned above.
Furthermore, the summer and winter daily solar irradiation, the house cumulative energy consumption and solar PV energy were deduced and are presented in Figure 14a,b. In Figure 14, the full-blue bars represent HDP, while LDP is represented with white grid bars. In Figure 4a, HDP showed a daily average of 8.15 kWh energy consumption, amounting to a total of 114.05 kWh. In the same period, the generated solar PV energy was 245.88 kWh, which is equivalent to a daily average of 17.56 kWh. The generated solar PV energy was found to be 50% more than the house’s total energy consumption. The house energy consumption decreased by 38.93 kWh. Finally, solar PV energy generation decreased by 8.47 kWh in LDP.
As indicated in Equation (7), CUF is expressed in the number of hours per year, 8760, i.e., 365 days multiplied by 24 h. Since daily CUF was considered in the study due to data availability, 24 h was used to multiply the installed peak power as given in Equation (7). The average summer month CUF was 7%. A maximum CUF of 13% was observed on 1st of March, which was a HDP, while 15th of March, a LDP, was found to have the lowest CUF, i.e., 4%. However, the 8th and 26th of March were not considered in the above CUF because the solar PV system was not operating fully on those days.
A 7% average CUF was also obtained in the winter months. In the same period, 14% CUF on the 20th of August was the highest value obtained; this day was categorised as HDP, while for LDP, 25th of August had the lowest CUP, i.e., 3%. The total global horizontal irradiation in the winter months was 130.93 kWh/m2, equivalent to a daily average of 4.22 kWh/m2. The resultant generated solar PV energy was 246.29 kWh, equivalent to 13.9 kWh/day. However, only 159.80 kWh energy was consumed during HDP and 50% less during LDP in the winter month. Equations (1) to (6) were employed to further evaluate the performance of the solar PV system, and the findings are presented in Figure 15 and Figure 16.
A rated peak power of 3.8 kWp was used to deduce the final yield, which amounted to an average of 1.70 kWh/kWp/day in the summer months. The obtained final yield only covered days on which the solar PV system was fully operational. The house energy consumption pattern contributed to the low final yield; this is supported by the findings of Seme et al. [16]. The inverter AC energy output, which is equivalent to the house energy consumption, was substituted into Equation (4) to compute the solar PV system PRAC and was found to vary from 19 to 85% in the summer months.
As shown in Figure 14 and Figure 16, the lowest total global horizontal irradiation and maximum PRAC were observed on 25 March (excluding the 10 and 26 March). Theoretically, the PR tended to increase with a decrease in the global horizontal irradiation due to its inverse relationship with the module temperature [69], as demonstrated in Figure 15 and Figure 16. This is more evident in the PRDC plot, as a dip in the ambient air and module temperatures was observed on days such as the 8th, 10th, 14th, 20th, 21st, and 31st of March. On these days, the average PRDC was 95%, while the average ambient air and module temperatures were 18.3 °C and 22.2 °C, respectively. The relatively high PRDC, as well as the inverse relationship between the PR and temperature obtained in this study, agree with the findings of Romero-Fiances et al. [20]. The authors [20] highlighted that PRDC overestimates solar PV system performance due to a lack of inverter loss, spectral effects and under-rated STC peak power. Regarding efficiencies, the average PV module efficiency was 12%, i.e., 4% lesser than the rated value. An average of 44% efficiency was obtained for the inverter; this low efficiency was also attributed to the occupants’ energy usage pattern. As alluded to earlier, minimum loads were utilised in the house during typical solar PV system generation peak periods, i.e., between 9h00 and 15h00, since the occupants were out for their daily activities. As a result, the inverter dissipated a large amount of the generated PV DC energy while the MPPT operated in float mode. This also affected the PR values of the system.
Similarly, an average final yield of 1.70 kWh/kWp/day was observed in the winter months, with a maximum of 3.36 kWh/kWp on 28 August. However, the PRAC for the winter months was found to be marginally higher, ranging from 15% to 87%. This finding agrees with Marion et al. [18], who indicated that the winter season tends to have a higher PR than the summer season due to lower solar radiation and cooler ambient air temperature, reducing the module operating temperature. The measured module temperature was found to support the argument of Marion et al. [18], as the average temperature in the winter month drops by 8.9 °C. In the PRDC evaluation, slightly contradictory findings were observed. Although the maximum PRDC of 120%, which could be overestimated, as highlighted earlier, was observed in the winter months, the summer month average PRDC was 5% higher. This finding can be attributed to the influence of solar radiation on the PRDC, which was 20 kWh/m2 higher in the summer months. Furthermore, an average PV module efficiency of 12% was also obtained in the winter months, while the inverter efficiency was found to be between 21% and 77% during that time.
In addition to the explanation of Marion et al. [18] regarding seasonal PR variation, PR was also influenced by the daily total AC consumption in the study house, which was equivalent to the total AC energy generation (EAC) of the solar PV system, as determined using Equations (1)–(7). From Equation (4), the final yield was shown to influence PRAC, i.e., an increase in the final yield would result in a higher PRAC under similar weather conditions. Recall that final yield deals with solar PV system performance relative to the load, while reference yield deals with available solar radiation (GHI). Based on the basic operation of a solar PV module, in the presence of the sun and absence of load, the module’s internal load resistance increases, resulting in near-zero current flow. The connection of a load, on the other hand, reduces the internal load resistance, leading to the flow of current and power generation. Therefore, the house’s inconsistent and relatively low energy consumption compared to a grid-tied solar PV system led to different daily and low PRAC. The operation of the solar PV system in open-circuit voltage (Voc) mode also influenced the module efficiency, as the internal resistance increased the operating temperature. In general, the performance of the solar PV system indicated that the technology is a viable source of energy, i.e., comparable to the performance of solar PV systems in other regions, given the local solar radiation and air temperature [69].

6. Recommendations and Future Studies

The current study dealt with the feasibility of solar power generation in an underutilised region in South Africa based on available solar radiation. Although solar radiation is the main factor for the installation of solar PV plants, other factors such as environmental and government policies also play a crucial role in the adoption of this technology. The research findings are sufficient for pre-feasibility studies for residential rooftop and small-scale (office and public buildings) solar PV power generation under the weather conditions in the study area. In the context of this study, environmental influence includes environmental impact assessment (EIA), available land relative to sunray blockade and soil fertility, accessibility, and topography. In terms of government policies, renewable energy policies at the local government level, such as electricity distribution, sales, and grid connection, are also very important. According to Edson et al. [27], many municipalities in South Africa are responsible for the local distribution and sale of electricity. The authors of that paper [27] further noted that some of these municipalities have developed a business model based on the procurement of cheap, carbon-intensive electricity on credit from the national utility, which consumers pay off. The financial benefits and employment associated with conventional coal-fired electricity, as well as the lack of skilled workers for the installation, operation, and maintenance of solar power plants, are the major barriers to adopting grid-scale solar PV plants at the local level in South Africa [27].
In view of the outlined research limitations and grid-scale solar PV projects in South Africa, further studies on the EIA of grid-scale solar power generation in underutilised regions are recommended. Such studies could unpack the potential impacts of grid-scale solar power generation projects on wildlife, indigenous birds, rivers used for farming and domestic purposes, available farmland, and people’s livelihoods in underutilised regions. EIA, which covers the pros and cons of such projects, was also used to assess potential mitigating measures. Further, the topography, blocking of sunlight by obstacles, and soil fertility for farming are other crucial aspects of grid-scale solar power projects in underutilised regions that require further study. Soil fertility evaluations in this context should be approached in terms of single and mixed land-use for farming and/or solar power generation. In recent years, agrivoltaic (mixed) land-use has gained recognition in the renewable energy sector as a mitigating measure for the contest between land-use for farming and solar power generation, as well as a means of efficiently using of resources [70]. Furthermore, research on political will and local government targets and policies on sustainable and renewable energy in underutilised regions is also recommended. This also includes the distribution and sale of the electricity by local municipalities and its viability to a just renewable energy transition.

7. Conclusions

This study evaluated the solar resources and PV power potential of an underutilised region in South Africa. Raw ground measured GHI, DNI and DHI data were used to establish the solar resources at the location. The measured solar radiation data were analysed under clear and cloudy sky conditions. An unconventional but effective approach was used to distinguish the sky conditions.
The average daily total GHI, DNI, and DHI of Alice were found to be 4.98, 5.74, and 1.44 kWh/m2, respectively. Classifying the sky conditions based on daily total GHI, it was found that days with total daily GHI between 0 and 2.99 kWh/m2 were cloudy, while clear sky days had daily total GHI ranging from 3 to 9.99 kWh/m2. The distribution and magnitude of the solar radiation components supported these findings. Moreover, clear sky conditions, which occurred on 233 days in the study year, resulted in an average daily total GHI of 6.13 kWh/m2, DNI of 6.73 kWh/m2 and DHI of 0.17 kWh/m2. Based on GSA and SolarGIS satellite data, it was found that the solar resources of Alice are comparable with those of other regions around the world with large-scale solar energy projects. In addition, the performance of a 3.8 kWp stand-alone rooftop PV system in Alice was found to be comparable with those of solar PV power systems in other parts of the world. However, due to the occupants’ daily activities and the configuration of the system (off-grid), a relatively low PR and inverter efficiency were obtained.

Author Contributions

Conceptualisation, O.K.O.; methodology, O.K.O. and E.L.M.; software, O.K.O.; validation, E.L.M.; formal analysis, O.K.O. and E.L.M.; investigation, O.K.O. and E.L.M.; resources, E.L.M.; data curation, O.K.O.; writing—original draft preparation, O.K.O.; writing—review and editing, E.L.M.; visualisation, O.K.O.; supervision, E.L.M.; funding acquisition, E.L.M. All authors have read and agreed to the published version of the manuscript.

Funding

This work was based on the research supported in part by the National Research Foundation of South Africa (Grant number 129641). We also thank the Department of Science and Innovation, Eskom and Govan Mbeki Research and Development Centre for financially supporting this research.

Institutional Review Board Statement

Not applicable.

Informed Consent Statement

Not applicable.

Data Availability Statement

Not applicable.

Conflicts of Interest

The authors declare no conflict of interest.

References

  1. REN21. Renewables 2019 Global Status Report. Paris, France. 2019. Available online: https://www.ren21.net/gsr-2019/chapters/chapter_01/chapter_01/ (accessed on 14 February 2020).
  2. Franfurt School-UNEP. Global Trends in Renewable Energy Investment 2019; Franfurt School-UNEP: Frankfurt, Germany, 2019; Volume 1. [Google Scholar]
  3. International Energy Agency. Global Energy Review 2021: Assessing the Effect of Economic Recoveries on Global Energy Demand and CO2 Emissions in 2021; International Energy Agency: Paris, France, 2021. [Google Scholar]
  4. Stegmann, A. The design and construction challenges of utility scale PV plants. In Proceedings of the 10th Renewable Energy Postgraduate Symposium, Stellenbosch, South Africa, 18–19 July 2019; pp. 1–31. [Google Scholar]
  5. Fountoukis, C.; Figgis, B.; Ackermann, L.; Ayoub, M.A. Effects of atmospheric dust deposition on solar PV energy production in a desert environment. Sol. Energy 2018, 164, 94–100. [Google Scholar] [CrossRef]
  6. Ruiz-Arias, J.A.; Gueymard, C.A. Worldwide inter-comparison of clear-sky solar radiation models: Consensus-based review of direct and global irradiance components simulated at the earth surface. Sol. Energy 2018, 168, 10–29. [Google Scholar] [CrossRef]
  7. SolarGIS. Methodology—Solar Radiation Modeling. SolarGIS Website. 2019, pp. 1–4. Available online: https://solargis.com/docs/methodology/solar-radiation-modeling (accessed on 19 September 2019).
  8. Chang, K.; Slater, R.; Chang, K. Forecasting Localized Weather-Based Photovoltaic Energy Production. SMU Data Sci. Rev. 2019, 2, 1–19. [Google Scholar]
  9. Solargis. Solargis: pvPlanner. Solargis Webpage. 2019. Available online: https://solargis.info/pvplanner/#tl=Google:hybrid&bm=satellite (accessed on 23 August 2019).
  10. Energy Sector Management Assistance Program (ESMAP) Global Solar Atlas. Solar Map of South Africa. Global Solar Atlas. 2019. Available online: https://globalsolaratlas.info/?c=-28.523998,24.00941,6&s=-29,24 (accessed on 31 August 2019).
  11. Solcast. Solcast API Toolkit: Rooftops. Solcast Webpage. 2019. Available online: https://toolkit.solcast.com.au/rooftop-sites (accessed on 19 September 2019).
  12. Ernst, M.; Gooday, J. Methodology for generating high time resolution typical meteorological year data for accurate photovoltaic energy yield modelling. Sol. Energy 2019, 189, 299–306. [Google Scholar] [CrossRef]
  13. Benali, L.; Notton, G.; Fouilloy, A.; Voyant, C.; Dizene, R. Solar radiation forecasting using artificial neural network and random forest methods: Application to normal beam, horizontal diffuse and global components. Renew. Energy 2019, 132, 871–884. [Google Scholar] [CrossRef]
  14. Nwodo, J.C.; Overen, O.K.; Meyer, E.L. Decoupling the Monitoring of Solar Water Heaters and their Usage Profiles. Water 2021, 13, 3186. [Google Scholar] [CrossRef]
  15. Necaibia, A.; Bouraiou, A.; Ziane, A.; Sahouane, N.; Hassani, S.; Mostefaoui, M.; Dabou, R.; Mouhadjer, S. Analytical assessment of the outdoor performance and efficiency of grid-tied photovoltaic system under hot dry climate in the south of Algeria. Energy Convers. Manag. 2018, 171, 778–786. [Google Scholar] [CrossRef]
  16. Seme, S.; Sredenšek, K.; Štumberger, B.; Hadžiselimović, M. Analysis of the performance of photovoltaic systems in Slovenia. Sol. Energy 2019, 180, 550–558. [Google Scholar] [CrossRef]
  17. Energyblog. Utility-Scale Renewable Energy Generation Sites—South Africa. 2018, p. 1. Available online: https://www.energy.org.za/map-south-african-generation-projects (accessed on 30 August 2019).
  18. Marion, B.; Adelstein, J.; Boyle, K.; Hayden, H.; Hammond, B.; Fletcher, T.; Canada, B.; Narang, D.; Kimber, A.; Mitchell, L.; et al. Performance parameters for grid-connected PV systems. In Proceedings of the Conference Record of the 31st IEEE Photovoltaic Specialists Conference, Lake Buena Vista, FL, USA, 3–7 January 2005; pp. 1601–1606. [Google Scholar]
  19. Attari, K.; Elyaakoubi, A.; Asselman, A. Performance analysis and investigation of a grid-connected photovoltaic installation in Morocco. Energy Rep. 2016, 2, 261–266. [Google Scholar] [CrossRef] [Green Version]
  20. Romero-Fiances, I.; Muñoz-Cerón, E.; Espinoza-Paredes, R.; Nofuentes, G.; De La Casa, J. Analysis of the Performance of Various PV Module Technologies in Peru. Energies 2019, 12, 186. [Google Scholar] [CrossRef] [Green Version]
  21. Hashim, E.T.; Kasim, N.K.; Obaid, N.M. Performance Assessment of First Grid–tied PV Solar System under Baghdad City Climate Condition. Iraqi J. Sci. Technol. 2019, 10, 63–71. [Google Scholar]
  22. Mostefaoui, M.; Necaibia, A.; Ziane, A.; Dabou, R.; Rouabhia, A.; Khelifi, S.; Bouraiou, A.; Sahouane, N. Importance cleaning of PV modules for grid-connected PV systems in a desert environment. In Proceedings of the 2018 4th International Conference on Optimization and Applications (ICOA), Mohammedia, Morocco, 26–27 April 2018; pp. 1–6. [Google Scholar]
  23. Kumar, B.S.; Sudhakar, K. Performance evaluation of 10 MW grid connected solar photovoltaic power plant in India. Energy Rep. 2015, 1, 184–192. [Google Scholar] [CrossRef] [Green Version]
  24. Assefa, Y.; Prasad, P.V.V.; Foster, C.; Wright, Y.; Young, S.; Bradley, P.; Stamm, M.; Ciampitti, I.A. Major Management Factors Determining Spring and Winter Canola Yield in North America. Crop Sci. 2018, 58, 1–16. [Google Scholar] [CrossRef] [Green Version]
  25. Al-Badi, A.H. Measured performance evaluation of a 1.4 kW grid connected desert type PV in Oman. Energy Sustain. Dev. 2018, 47, 107–113. [Google Scholar] [CrossRef]
  26. Martín-Martínez, S.; Cañas-Carretón, M.; Honrubia-Escribano, A.; Gómez-Lázaro, E. Performance evaluation of large solar photovoltaic power plants in Spain. Energy Convers. Manag. 2019, 183, 515–528. [Google Scholar] [CrossRef]
  27. Meyer, E.L.; Overen, O.K. Towards a sustainable rural electrification scheme in South Africa: Analysis of the Status quo. Energy Rep. 2021, 7, 4273–4287. [Google Scholar] [CrossRef]
  28. SABS. SANS 204:2011—South African National Standard: Energy Efficiency in Buildings; SABS: Pretoria, South Africa, 2011.
  29. South Africa Weather Service. Climate South Africa. 2017. Available online: ftp://ftp.weathersa.co.za (accessed on 1 January 2017).
  30. Overen, O.K.; Meyer, E.L.; Makaka, G. Thermal Behavior of a Low-Cost House Coated with Transparent Infrared Reflective Paint. In World Sustainable Built Environment Conference Hong Kong; SBE: Hong Kong, China, 2017; pp. 758–764. [Google Scholar]
  31. Conradie, D.C.U. South Africa’s climatic zones: Today, tomorrow. In Proceedings of the International Green Building Conference and Exhibition, Sandton, South Africa, 25–26 July 2012; pp. 1–9. [Google Scholar]
  32. Overen, O.K.; Meyer, E.L.; Makaka, G. Thermal, Economic and Environmental Analysis of a Low-Cost House in Alice, South Africa. Sustainability 2017, 9, 425. [Google Scholar]
  33. Ziuku, S.; Meyer, E. Electrical performance results of an energy efficient building with an integrated photovoltaic system. J. Energy S. Afr. 2010, 21, 2–8. [Google Scholar] [CrossRef]
  34. Victron Energy. MultiPlus Inverter/Charger: 800VA—5kVA. Datasheet. 2018, pp. 1–2. Available online: https://www.victronenergy.com/inverters-chargers/multiplus-12v-24v-48v-800va-3kva#datasheets (accessed on 2 October 2019).
  35. OutBack Power System. FLEXmax 80: Continuous Maximum Power Point Tracking Charge Controller. Datasheet. 2007, pp. 1–2. Available online: http://www.outbackpower.com/downloads/documents/charge_controllers/flexmax_6080/owner_manual.pdf (accessed on 3 November 2018).
  36. First National Battery. Renewable Energy: Raylit M-Solar. 2016, pp. 1–4. Available online: https://www.battery.co.za/wp-content/uploads/2017/06/M_Solar_Dec_2016_.pdf (accessed on 19 February 2018).
  37. Mousazadeh, H.; Keyhani, A.; Javadi, A.; Mobli, H.; Abrinia, K.; Sharifi, A. A review of principle and sun-tracking methods for maximizing solar systems output. Renew. Sustain. Energy Rev. 2009, 13, 1800–1818. [Google Scholar] [CrossRef]
  38. Kipp & Zonen. Instruction Manual SOLYS2 Sun Tracker SOLYS Gear Drive Sun Tracker. Instruction Manual. 2017, Volume 1, p. 1. Available online: http://www.kippzonen.com/Product/20/SOLYS2-Sun-Tracker#.WyzN1vlKjcs (accessed on 22 February 2019).
  39. Overen, O.K.; Meyer, E.L. Daylighting: A Residential Energy—Efficiency Demand-side Management Initiative. In Proceedings of the 27th IEEE Domestic Use of Energy, Wellington, South Africa, 25–27 March 2019; pp. 1–9. [Google Scholar]
  40. Kipp & Zonen. Instruction Manual—Pyranometer and Albedometer. User Manual. 2015, pp. 1–46. Available online: http://www.kippzonen.com/Download/72/Manual-Pyranometers-CMP-series-English (accessed on 18 May 2016).
  41. Kipp & Zonen. Pyrheliometers. Brochure. 2018, pp. 1–4. Available online: http://www.kippzonen.com/Download/43/Pyrheliometers-Brochure (accessed on 2 September 2019).
  42. Kipp & Zonen. Solar Monitoring Stations; Case Study; Kipp & Zonen: Milan, Italy, 2012; pp. 1–24. Available online: http://www.kippzonen.com/Download (accessed on 24 May 2017).
  43. Overen, O.K.; Meyer, E.L.; Makaka, G. Indoor Daylighting and Thermal Response of a Passive Solar Building to Selective Components of Solar Radiation. Buildings 2021, 11, 34. [Google Scholar] [CrossRef]
  44. Meyer, E.L.; Apeh, O.O.; Overen, O.K. Electrical and Meteorological Data Acquisition System of a Commercial and Domestic Microgrid for Monitoring PV Parameters. Appl. Sci. 2020, 10, 9092. [Google Scholar] [CrossRef]
  45. Brooks, M.; Du Clou, S.; Van Niekerk, W.L.; Gauché, P.; Leonard, C.; Mouzouris, M.J.; Meyer, R.; Van Der Westhuizen, N.; Van Dyk, E.E.; Vorster, F.J. SAURAN: A new resource for solar radiometric data in Southern Africa. J. Energy S. Afr. 2015, 26, 2–10. [Google Scholar] [CrossRef]
  46. Apeh, O.; Overen, O.; Meyer, E. Monthly, Seasonal and Yearly Assessments of Global Solar Radiation, Clearness Index and Diffuse Fractions in Alice, South Africa. Sustainability 2021, 13, 2135. [Google Scholar] [CrossRef]
  47. Stoffel, T.; Renné, D.; Myers, D.; Wilcox, S.; Sengupta, M.; George, R.; Turchi, C. Concentrating Solar Power: Best Practices Handbook for the Collection and Use of Solar Resource Data; National Renewable Energy Laboratory: Golden, CO, USA, 2012. Available online: https://www.nrel.gov/docs/fy10osti/47465.pdf (accessed on 14 February 2020).
  48. Ziuku, S.; Seyitini, L.; Mapurisa, B.; Chikodzi, D.; van Kuijk, K. Potential of Concentrated Solar Power (CSP) in Zimbabwe. Energy Sustain. Dev. 2014, 23, 220–227. [Google Scholar] [CrossRef]
  49. GeoModel Solar. Site Assessment of Solar Resource: Upington Solar Park. Solar Fuel for Energy Systems; Centre for Renewable and Sustainable Energy Studies: Stellenbosch, South Africa, 2011. [Google Scholar]
  50. Hoffmann, J. On the outlook for solar thermal hydrogen production in South Africa. Int. J. Hydrogen Energy 2019, 44, 629–640. [Google Scholar] [CrossRef]
  51. Hermann, S.; Miketa, A.; Fichaux, N. Estimating the Renewable Energy Potential in Africa: A GIS-Based Approach [Internet], 1st ed.; International Renewable Energy Agency: Abu Dhabi, United Arab Emirates, 2014; Available online: https://www.irena.org/DocumentDownloads/Publications/IRENA_Africa_Resource_Potential_Aug2014.pdf (accessed on 19 October 2019).
  52. Răboacă, M.S.; Badea, G.; Enache, A.; Filote, C.; Răsoi, G.; Rata, M.; Lavric, A.; Felseghi, R.-A. Concentrating Solar Power Technologies. Energies 2019, 12, 1048. [Google Scholar] [CrossRef] [Green Version]
  53. Dinter, F. Sustainable and flexible solar energy solution for Chile. In Solar World Congress; International Solar Energy Society: Santiago, Chile, 2019; pp. 1–33. [Google Scholar]
  54. Campos, P.; Troncoso, L.; Lund, P.D.; Cuevas, C.; Fissore, A.; Garcia, R. Potential of distributed photovoltaics in urban Chile. Sol. Energy 2016, 135, 43–49. [Google Scholar] [CrossRef]
  55. Mardonova, M.; Choi, Y. Assessment of Photovoltaic Potential of Mining Sites in Uzbekistan. Sustainability 2019, 11, 2988. [Google Scholar] [CrossRef] [Green Version]
  56. Huang, J.; Fan, J.; Furbo, S. Feasibility study on solar district heating in China. Renew. Sustain. Energy Rev. 2019, 108, 53–64. [Google Scholar] [CrossRef]
  57. Islam, M.; Shawon, M.H.; Akter, S.; Chowdhury, A.; Khan, S.I.; Rahman, M. Performance Investigation of Poly Si and Mono Si PV Modules: A Comparative Study. In Proceedings of the 2019 International Conference on Energy and Power Engineering (ICEPE), Dhaka, Bangladesh, 14–16 March 2019; pp. 1–5. [Google Scholar]
  58. Lilliestam, J.; Ollier, L.; Pfenninger, S. The dragon awakens: Will China save or conquer concentrating solar power? In Proceedings of the SOLARPACES 2018: International Conference on Concentrating Solar Power and Chemical Energy Systems; AIP Publishing: Melville, NY, USA, 2019; pp. 1–9. [Google Scholar]
  59. Shaochao, L. Supcon’s Experience in CSP. In Solar World Congress; International Solar Energy Society: Santiago, Chile, 2019; pp. 1–12. [Google Scholar]
  60. Mugnier, D. Solar Cooling Worldwide: Status and Perspective. In Solar World Congress; International Solar Energy Society: Santiago, Chile, 2019; pp. 1–20. [Google Scholar]
  61. Choi, Y.; Song, J. Review of photovoltaic and wind power systems utilized in the mining industry. Renew. Sustain. Energy Rev. 2017, 75, 1386–1391. [Google Scholar] [CrossRef]
  62. Tschopp, D.; Tian, Z.; Berberich, M.; Fan, J.; Perers, B.; Furbo, S. Large-scale solar thermal systems in leading countries: A review and comparative study of Denmark, China, Germany and Austria. Appl. Energy 2020, 270, 114997. [Google Scholar] [CrossRef]
  63. Feierl, L.; Poier, H.; Holter, C. Measurement Results and Operating Experience of Large-Scale Solar Air Conditioning Plants. Proc. EuroSun 2018, 2018, 1–11. [Google Scholar] [CrossRef] [Green Version]
  64. Jiao, Q. Solar heating market in China. In Solar World Congress; International Solar Energy Society: Santiago, Chile, 2019; pp. 1–59. [Google Scholar]
  65. Mir-Artigues, P.; Del Río, P.; Caldés, N. Public Support Schemes for the Deployment of Plants. In Smart Energy Grid Design for Island Countries; Springer Science and Business Media LLC: Cham, Switzerland, 2019; pp. 157–193. [Google Scholar]
  66. Bouhal, T.; Agrouaz, Y.; Kousksou, T.; Allouhi, A.; El Rhafiki, T.; Jamil, A.; Bakkas, M. Technical feasibility of a sustainable Concentrated Solar Power in Morocco through an energy analysis. Renew. Sustain. Energy Rev. 2018, 81, 1087–1095. [Google Scholar] [CrossRef]
  67. Al Naqbi, S.; Tsai, I.; Mezher, T. Market design for successful implementation of UAE 2050 energy strategy. Renew. Sustain. Energy Rev. 2019, 116, 109429. [Google Scholar] [CrossRef]
  68. Photovoltaic Power System Programme. Cost and Performance Trends in Grid-Connected Photovoltaic Systems and Case Studies; International Energy Agency: Erlenbach, Switzarland, 2007. [Google Scholar]
  69. Sharma, R.; Goel, S. Performance analysis of a 11.2 kWp roof top grid-connected PV system in Eastern India. Energy Rep. 2017, 3, 76–84. [Google Scholar] [CrossRef]
  70. Dinesh, H.; Pearce, J.M. The potential of agrivoltaic systems. Renew. Sustain. Energy Rev. 2016, 54, 299–308. [Google Scholar] [CrossRef] [Green Version]
Figure 1. (a) GSA Map of South Africa indicating the annual GHI of each province, adapted from Global Solar Atlas 2.0 [10]; (b) fully operational DoE IPP solar PV projects in South African provinces in 2017 and their average daily total daily GHI [17].
Energies 15 04646 g001
Figure 2. GSA annual total global horizontal irradiation map of South Africa, indicating the research study area, Alice in the Eastern Cape province, adapted from Global Solar Atlas 2.0 [10].
Energies 15 04646 g002
Figure 3. Sun path diagram of Alice.
Energies 15 04646 g003
Figure 4. Simulated rooftop solar exposure in Alice.
Energies 15 04646 g004
Figure 5. The case study solar photovoltaic system.
Energies 15 04646 g005
Figure 6. The solar photovoltaic system schematic diagram.
Energies 15 04646 g006
Figure 7. On-site weather station for (a) solar resources (SOLYS Gear Drive sun tracker) and (b) ambient air temperature and relative humidity (shielded HMP60 probe) monitoring.
Energies 15 04646 g007
Figure 8. Data acquisition system for (a) solar PV system electrical parameters monitoring and (b) solar resources and ambient air observations.
Energies 15 04646 g008
Figure 9. A year solar radiation date of Alice from on-site and SAURAN solar weather stations.
Energies 15 04646 g009
Figure 10. Summer season daily average GHI, DNI and DHI distribution.
Energies 15 04646 g010
Figure 11. Winter season daily average GHI, DNI and DHI distribution.
Energies 15 04646 g011
Figure 12. Monthly bar chart of daily total irradiation summaries.
Energies 15 04646 g012
Figure 13. Generated solar photovoltaic power, house load demand and global horizontal irradiance in (a) summer months and (b) winter months.
Energies 15 04646 g013
Figure 14. The daily global horizontal irradiation, solar PV system energy generation, and the house energy consumption profiles in (a) summer months and (b) winter months.
Energies 15 04646 g014
Figure 15. Performance of the solar photovoltaic system in the summer months.
Energies 15 04646 g015
Figure 16. Performance of the solar photovoltaic system in the winter months.
Energies 15 04646 g016
Table 1. Technical specifications of PV module.
HIP-190N1-BO-02Specification
Maximum power (Pmax)190 W
Maximum power voltage (Vmp)37.6 V
Maximum power current (Imp)5.05 A
Open circuit voltage (Voc)46.4 V
Short circuit current (Isc)5.57 A
Reference irradiance at STC1 kW/m2
Cell typeMono-crystalline silicon
Design66 cells connected in series
Cell efficiency18.5%
Module efficiency16.1%
Dimension144.30 × 81.2 × 3.5 (cm)
Table 2. Technical specifications of the MPPT charge controller.
FLEX Max 80Specification
Nominal battery voltage12–60 V
Maximum output current80 A
PV open-circuit voltage (Voc)150 V absolute maximum coldest condition/145 V start-up and operating maximum
Standby power consumptionLess than 1 W
Power conservation efficiency97.5% at 80 Amp in a 48 V system
Charging regulationBulk, absorption, float, silent and equalisation
Table 3. Technical specifications of the inverter.
Multiplus 48/5000Specification
Input voltage38–66 V
Output voltage230 VAC ± 2%
Continuous output power at 25 °C5 kVA
Peak power10 kW
Zero-load power25 W
Maximum efficiency94–95%
Table 4. Optical and electrical specifications of the radiometers.
RadiometerSpecifications
Spectral Range (µm)Sensitivity (µV/W/m2)Response Time (s)Non-Stability (%Δ/year)Expected Daily Uncertainty (%)Max. Operating Irradiance (W/m2)
Pyheliometer (CHP 1)0.2 to 47 to 14<50.5<14000
Pyranometer (CMP 11)0.3 to 2.87 to 14<50.5<14000
Table 5. Statistical description and comparison of measured solar radiation data.
GHIDNIDHI
RMSE4.888.495.39
MAE23.9071.9929.05
Mean (W/m2)Summer season423.58444.67126.75
Winter season353.26571.7885.12
Total annual irradiation (kWh/m2)18162095527
Average daily irradiation (kWh/m2)4.985.741.44
Monthly Range (kWh/m2)135.9281.0138.51
Maximum (W/m2)13171047633.5
Table 6. Summaries of cloudy and clear sky day solar radiation in the summer season.
Cloudy Sky DaysClear Sky Days
GHIDNIDHIGHIDNIDHI
Mean irradiance (W/m2)147.7830.23130.30470.93515.82126.14
Total irtadiation (kWh/m2)76.8915.7467.8314281569383.50
Average daily irradiation (kWh/m2)1.920.391.706.136.730.17
Number of days (days)40233
Occurrence (%) 1585
Table 7. Summaries of cloudy and clear sky days solar radiation in the winter season.
Cloudy Sky DaysClear Sky Days
GHIDNIDHIGHIDNIDHI
Mean irradiance (W/m2)204.84212.35114.79379.31658.8671.52
Total irradiation (kWh/m2)45.1246.8825.33266463.9350.44
Mean daily irradiation (kWh/m2)2.052.131.153.806.630.72
Number of days (days)2270
Occurrence (%) 2476
Table 8. Comparison of solar resources of other countries and that of South Africa, Alice.
ProjectCountry (Town/City)TechnologyRemarksAnnual Solar Irradiation Comparison (kWh/m2) [7,10]
Other CountriesDifference (Alice)
GHIDNIDHIGHIDNIDHI
GemaSolarSpain (Fuentes de Andalucia)Concentrated Solar Power (CSP)GemaSolar is the first commercial Solar Power Tower (SPT) plant with 20 MW and 15 h of storage capacity. The world record SPT plant was built in 2011 in Fuentes de Andalucia, near Seville in Spain. The plant uses molten salt as a heat transfer fluid [53].183520765926912416
Calama PV power plantChile (Calama, Atacama Desert)Solar Photovoltaic (SPV)The Calama centralised solar PV power generator is a three PV power plant configuration; 20° titled fixed surface with 1 and 2 axis tracking surface, to give a 100 MWp capacity [54].264433684778781416−99
Solarpark MeuroGermany (Meuro)SPVThe German Government built the 166 MWp Solarpark is located in an abandoned mine (Meuro mine) near Leipzig. The development of the solar plant after the closure of the mine create not only clean energy but job opportunities for the locals [55].1087990571−679−962−5
Hebei rooftop SDHSChina (Hebei)Solar heating and cooling (SHC)The Hebei rooftop solar heating system with seasonal storage project consists of evacuated tube collectors, a gas boiler, a set of storage tanks and fan coil units. The project’s agenda is to improve the water temperature of the bath centre and space heating during the winter seasons [56].14051065766−361−887190
Solana Solar Power StationUSA (Arizona)CSPThe Solana Solar Power Station is a 280 MW CSP plant located in Arizona, USA. The plant comprises of 2200 km2 parabolic trough with 6 h molten salt storage tanks, which occupy approximately 1920 acres of land [57].20152455465249503−111
Delingha CSP plantChina (Delingha, Qinghai)CSPDelingha CSP plant is a 50 MW solar thermal project in Delingha, Qinghai province in China. The plant is made up of approximately 543 km2 heliostats and 7 h of molten salt storage. The plant was synchronised to the national grid in December 2018, and it is expected to generate 146 GWh/year [58]1793192867927−24103
Energy Efficient Social Housing SchemeUnited Kingdom (Corncroft, Nottingham)SPVIn 2001, 22 energy-efficient bungalows in part of a large social housing scheme for the elderly and disabled in Nottingham in the UK were built. The houses were fitted with a 34 kW rooftop solar PV plant. [16].993788565−773−1164−11
Greece MINOSGreece (Crete Island)CSP + SPVGreece MINOS is a combined 50 MW CSP and 5 MW PV power plant project in Crete Island in Greece. The project, which is currently under construction, is expected to be commissioned in December 2021 [59]1782183559916−11723
Ramagundam Solar PV plantIndia (Ramagundam)SPVThe Ramagundam solar PV power plant is a 10 MWp grid-connected project in Ramagundam, India [23].19241442904158−510328
DMHS Solar CoolingUSA (Scottsdale, Arizona)SHCThe 1.75 MW solar cooling system with a 4.94 km2 collector area was commissioned in 2014 at the Desert Mountain High School. As of 2018, the system is the most powerful solar cooling system in the world [60] 21212718480355766−96
Sullivan mine Canada (Kimberley)SPVThe 2 MW solar PV plant in Kimberley, British Columbia, Canada, is another abandoned minefield utilisation project. The solar farm holds 4000 solar modules mounted on 96 sun trackers [61].13441511530−422−441−46
Tibet SDHSChina (Langkazi, Tibet)SHCTibet solar district heating system is located in Langkazi county, China. The system comprises a 24.3 km2 collector area, 4.3 MW heating capacity and 15.0 km3 pit storage with an electric backup boiler [62].20492548555283596−21
Hambaek mineSouth Korea (Gangwon)SPVThe 85 kW solar PV power plant is installed over the water surface of successive alkalinity systems, and the generated power is used for treatments of acid mine drainage in a nearby facility [61].14551261715−311−691139
UWC Solar coolingSingapore (Queenstown)SHCIn 2011, a 1.48 MW rooftop solar cooling system with a collector area of 3.87 km2 was commissioned in the United World College, Queenstown in Singapore. The system is also utilised for domestic hot water [63].1648935933−118−1017357
Tibet SDHSChina (Zhongba, Tibet)SHCTibet Zhongba solar district heating system has a solar collector area of 34.65 km2 and a heating area of 88.20 km2 [64]21382618497372666−79
Gonghe CSP plantChina (Gonghe, Qinghai)CSPGonghe 50 MW tower CSP plant has 6 h storage capacity with molten salt and 600.32 m2 heliostats, which occupies a 2.13 km2 land area. The plant was synchronised with the national grid in September 2019 [65].17961981630302954
Noor I, II, III, and IVMorocco (Ouarzazate)CSPMorocco has set an ambitious target of installing a 2 GW CSP generation in 2020. The plan is being put in motion by the Noor I–IV CSP projects in Ouarzazate province. The combined cumulative installed capacity of the four plants is 880 MW [66].2159246263539351059
DEWA Solar Energy projectUnited Arab Emirate (Dubia)CSP+SPVThe Dubai Electricity and Water Agency set a target of 1.8 GW (1 GW SPV and 700 MW CSP) solar capacity generation by 2020 and 5.7 GW (5 GW and 700 MW CSP) by 2030. In 2018, 223 MW solar power plants/rooftops and 100 MW CSP plants were commissioned [67].21561883879390−69303
EWZ Solar power projectSwitzerland (Zurich)SPVBy the end of 2007, the Electric Work of Zurich has successfully connected more than 130 solar PV plants with a cumulative capacity of 4.5 MW to the grid. Most of the plants were on rooftops to reduce development costs and bidding [68].12181152570−548−800−6
Table 9. PV system production and house demand.
SummerWinter
HDPLDPHDPLDP
Solar PV generation (kW)1.451.341.240.84
Battery (A)Charging25.7622.4118.0210.39
Discharging9.505.139.054.38
House demand (W)345.06204.43359.51171.39
Publisher’s Note: MDPI stays neutral with regard to jurisdictional claims in published maps and institutional affiliations.

