Article

Experimental Evaluation of the Multiphase Flow Effect on Sand Production Process: Prepack Sand Retention Testing Results

1
Petroleum Faculty, Saint Petersburg Mining University, 199106 Saint Petersburg, Russia
2
Faculty of Oil and Gas, Yugra State University, 628011 Khanty-Mansiysk, Russia
3
Sevkomneftegaz LLC, 309180 Gubkin, Russia
4
Department of Development and Operation of Oil Fields, Gubkin University, 119991 Moscow, Russia
5
Petroleum Engineering, Saint Petersburg State University, 199034 Saint Petersburg, Russia
*
Author to whom correspondence should be addressed.
Energies 2022, 15(13), 4657; https://doi.org/10.3390/en15134657
Submission received: 30 May 2022 / Revised: 18 June 2022 / Accepted: 22 June 2022 / Published: 25 June 2022

Abstract

:
This paper considers a field with high-viscosity oil in a terrigenous weakly consolidated reservoir (sandstone) with a massive gas cap and an aquifer. The major challenge in the field operation is the migration of solid sand particles into the well, accompanied by a breakthrough of water and/or gas. The goal of the investigation was to evaluate the degree of influence on the sanding process of water and gas shares in the produced fluid and to determine the effect of pressure drop. The research methodology is based on a series of filtration experiments on small-sized bulk reservoir models. Particle size distribution of bulk models was created in accordance with that of the reservoir. The experiments were made in the form of Prepack Sand Retention Tests (SRT). Gas breakthrough allows sand production on a relatively high level for a longer amount of time, even though the concentration of solids in the produced fluid is lower than that of water breakthrough. On the other hand, water breakthrough triggers higher sand production, but it rapidly decreases as time goes on. Retained permeability of the model-screen system from the drawdown pressure (pressure gradient) and phase distribution of the flow were investigated. Moreover, a methodology has been developed for conducting filtration tests on bulk reservoir models to evaluate the efficiency of different screens (wire-wrapped screens, in particular).

1. Introduction

The destruction of the bottomhole formation zone during the operation of a weakly cemented reservoir and, as a result, sanding, is a complex process that has been thoroughly examined for more than 80 years. The sanding process is being investigated for steam-assisted gravity drainage (SAGD) operations and for conventional oil and gas production. This is mostly due to specific applications of the SAGD-production process: high temperatures, low reservoir depths, high clay content, and other features [1,2,3,4,5,6,7]. Conventional oil and gas production from wells prone to sanding is not as widely discussed and studied as for SAGD-operations, even though sanding in such fields is present for almost a century [8].
There are many factors that affect the process of sanding, thus, creating many ways to categorize them in different groups. Some categories are stuck with geological and technological factors [9], and others are focusing on the parameters influencing the factors for and against sanding [10]. Since the primary goal in sand control is excluding or enhancing sand production (it depends on the production strategy and sometimes may be beneficial) [11], dividing factors by their action—excluding or enhancing seems more reasonable. This leads to a problem, because some of the factors can be interpreted either as excluding or as enhancing in specific terms.
These factors are discussed in many papers worldwide, with the most popular topics being reservoir drawdown, water and gas breakthrough, particle size distribution (PSD) of reservoir rock, and sand control technologies that are chosen on this PSD-basis. But there are many uncertainties in the process of sand production itself—how it is affected by these factors.
Some authors stated that sand production decays over time due to forming of sand arches—“stable” bridges of rock around openings/slots of different screens. Their existence was hypothesized and proven in the 1960–1970s [12,13]. Even though these arches prevent sand from being produced into the well, stress redistribution in the reservoir may sometimes destroy these arches causing sand production. This triggers the process of forming sand plugs in the wellbore. These plugs must be flushed, thus, requiring well shut-in. This causes stress redistribution in the reservoir. One could say that there is a loop of plugging-flushing.
As such, the authors formulated the goal—to establish and quantify the degree of influence on the sanding process of drawdown during filtration, and long-term sand production capabilities, as well as to evaluate the effect of water and gas breakthroughs on the process of sand production.
The experiments to model the process of sanding can be divided into two main groups—Slurry tests and Prepack tests. There is no standard procedure or standard facility for the experiments performed for both the slurry and prepack tests [14]. Prepack SRT mostly applies to the modeling of the latter stages of the sanding process development—when part of the bottomhole formation zone collapsed due to continuous sanding. The rock material lies on the surface of the screen and the filtering goes both through destructed rock material and through the screen [15]. Prepack SRT also allows precise injection of different fluids, provides no bias, and also gives insight into sanding process evolution [16]. The main issue of the prepack testing facility used in this experiment is linear flow and scale effect. The scale effect is discussed later in the article. Linear flow might bias the results towards higher values, because it was proven that for the radial flow regime the amount of sand production is significantly (40–50%) lower [17].

Field and Reservoir Characterization

The oil and gas condensate field is located in the Yamal Peninsula and currently is under development of the main production facility.
The reservoir is identified within the upper part of the Pokurskaya suite and is characterized by tidal Upper Cretaceous deposits of the Cenomanian stage, represented by weakly compacted rocks: sands, sandstones, silts, siltstones, and mudstones. They are specified by the presence of plant detritus, organic residues, coal interlayers, and siderite lenses completely (Figure 1). The deposits are characterized by explicit facies heterogeneity (Figure 2). The sedimentological concept includes two stratigraphic zones that have significant vertical and lateral differences.
The complexity of reservoir development is due to the following challenges:
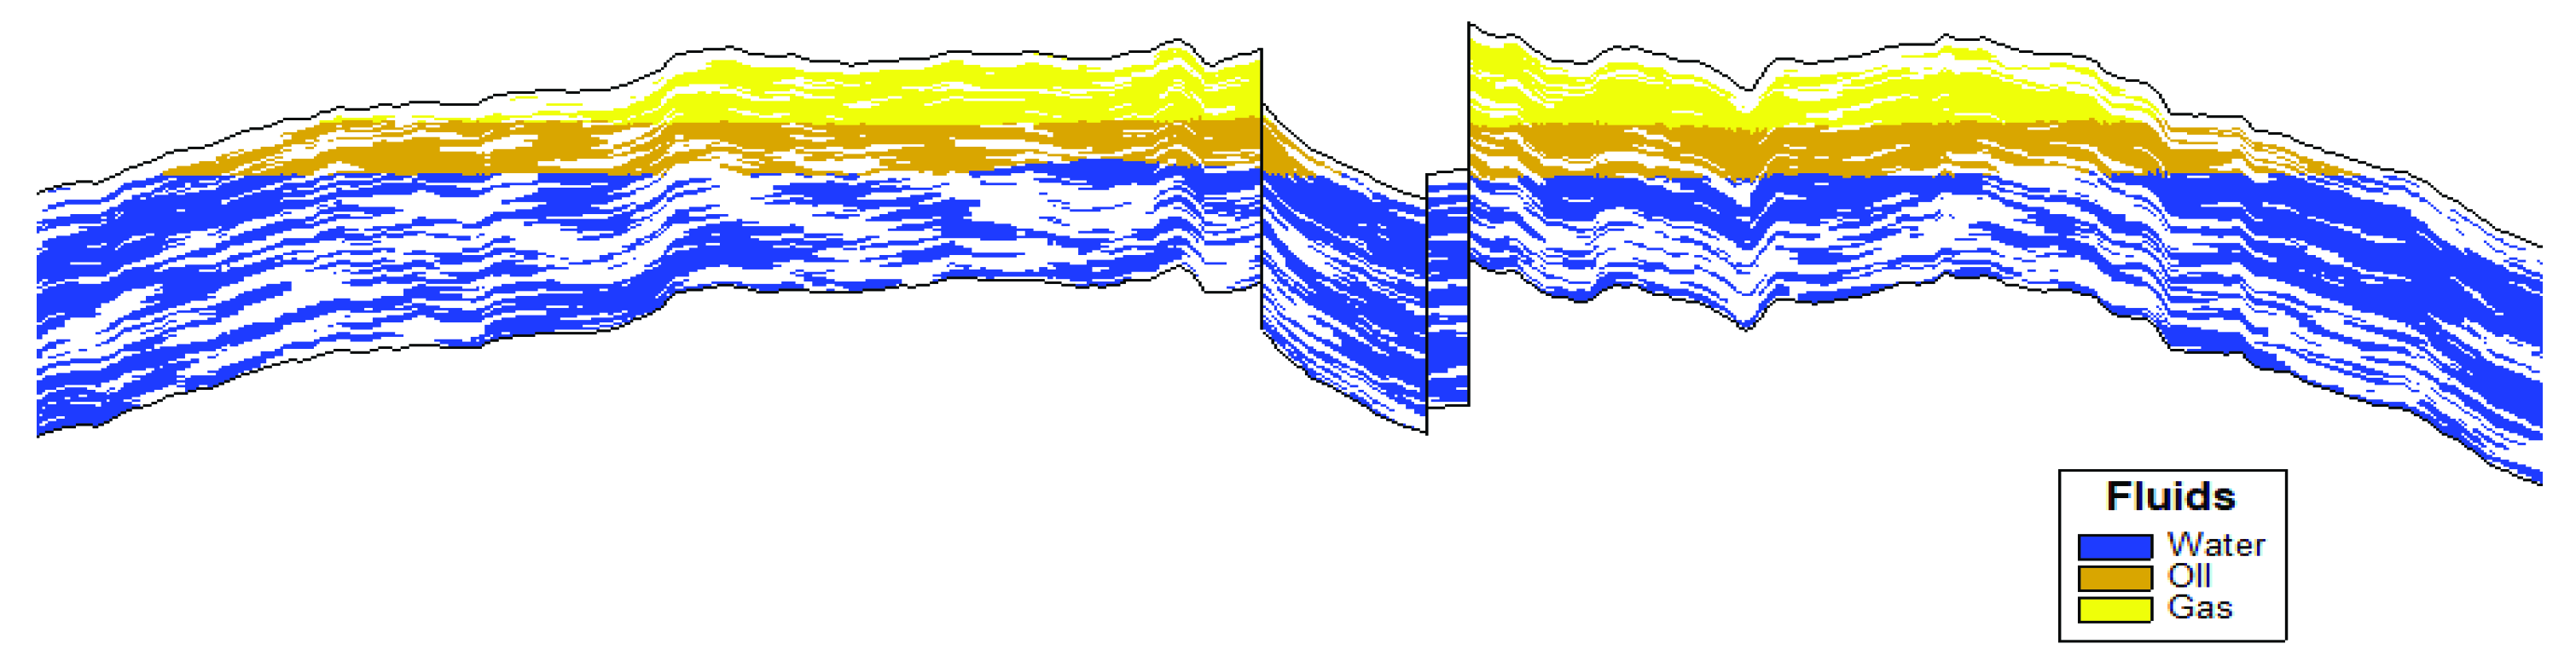
  • The reservoir is composed of unconsolidated/weakly consolidated sandstone;
  • High oil viscosity (67 cP);
  • Low reservoir temperature (35 °C);
  • Small thickness of the pay zone (10–20 m);
  • Presence of aquifer and extensive gas cap;
  • Sharp contrast of permeability (100–10,000 mD);
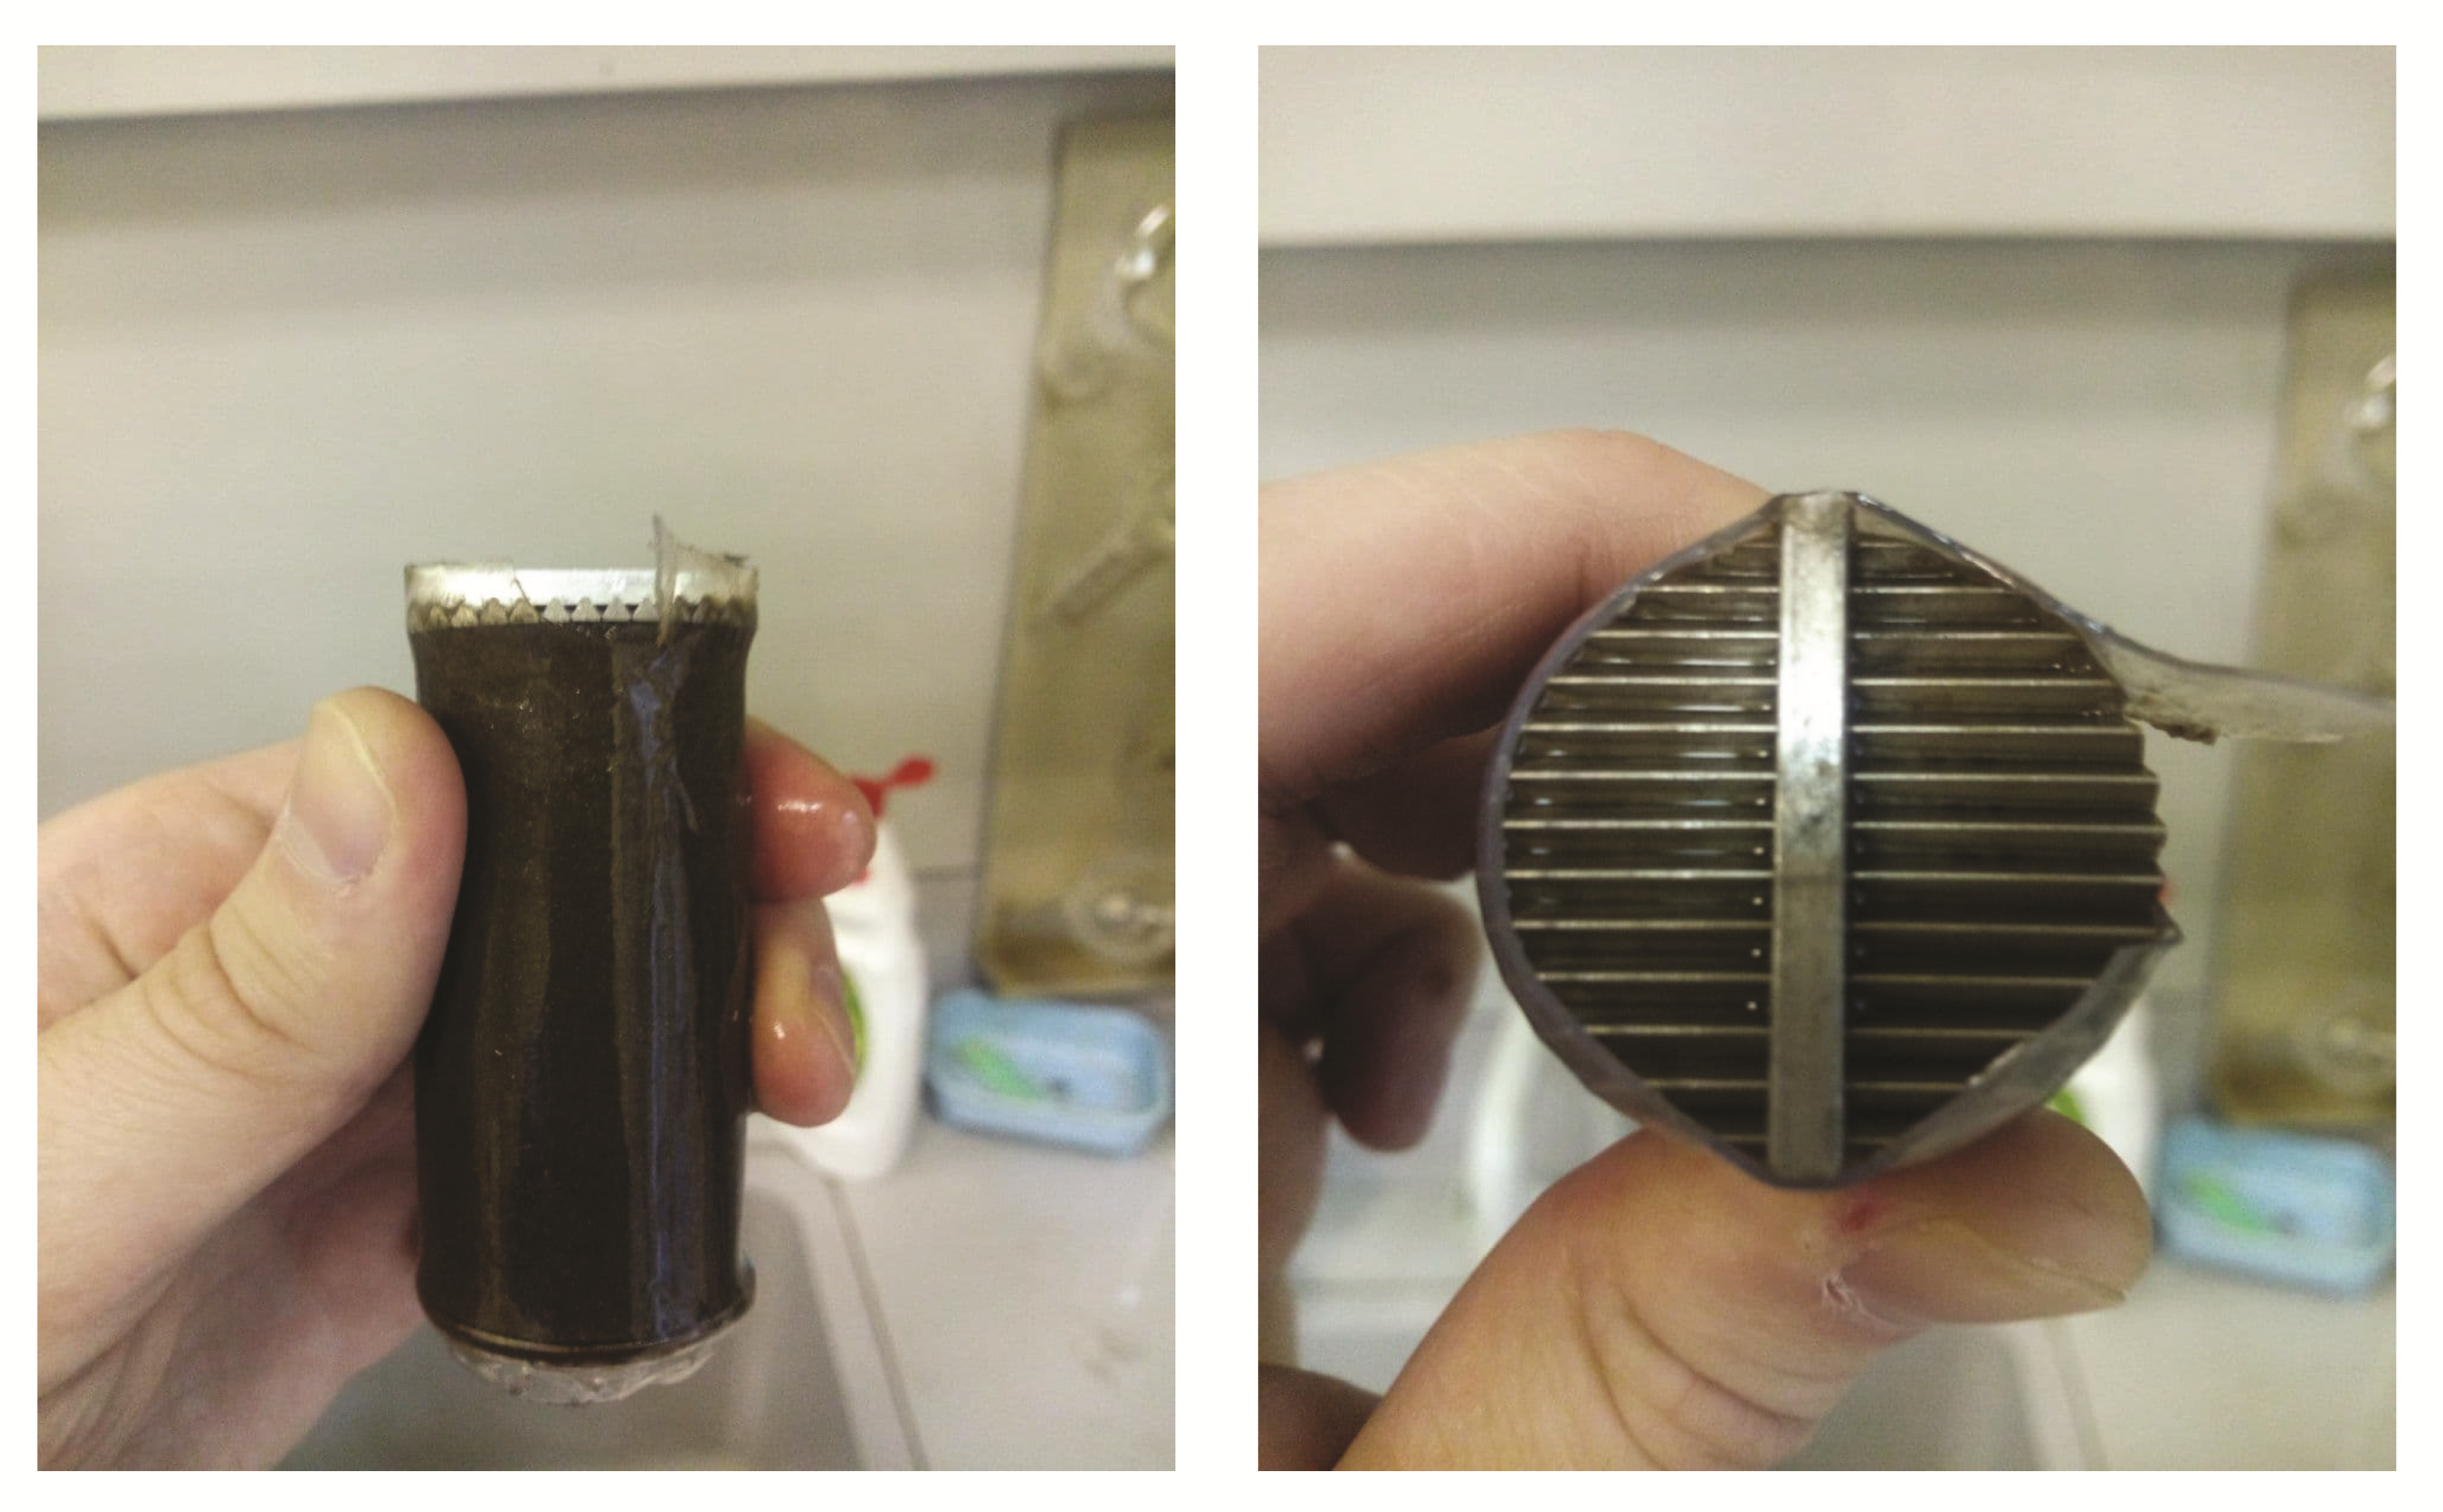
  • Active sand production during well operation (Figure 3);
  • Low strength properties of the formation.
Moreover, the geological structure of the reservoir in the central part is complicated by faults and fractures. The field is under development by the grid of horizontal wells with length of horizontal part of 1000 m (3300 ft, 0.62 miles).
A great difference in viscosity between oil and water causes water and gas breakthroughs along the highly permeable channels, which does not allow to provide efficient development of the field.
It is necessary to develop special approaches and methods for monitoring horizontal wells during operation, as well as to optimize the design, modes and technologies of their completion and sand control devices implementation to improve the efficiency of oil production in such difficult conditions.

2. Materials and Methods

To achieve the desired goal a coreholder from AutoFlood 700 (Vinci Technologies) unit was modified and a series of laboratory experiments were conducted on the created facility (Figure 4).
The efficiency and resistance to clogging of wire-wrapped screens of various apertures were determined in the process of conducting laboratory studies. Single-phase and multi-phase studies were carried out (with different gas, oil, and water content in the flow) for wire wrapped screens with openings sizes of 100, 150, 200, 500, 700, and 1000 µm with a given set particle size distribution of the bulk reservoir model.
The research program consisted of a series of filtration experiments carried out on a small-scale bulk reservoir model with a particle-size distribution similar to that of the reservoir. The experiments were performed under conditions simulating reservoir pressure, which made it possible to recreate the nature of the removal of mechanical particles in the bottomhole zone of the simulated reservoir. Previous studies show that results of small-scale and large-scale testing correlate with each other in a way that allows companies to make motivated decisions [21,22].
The parameters controlled during the laboratory tests were:
  • Screen aperture size;
  • Drawdown pressure during filtration;
  • Oil, water (brine) and gas content of the injected fluid.
Results of the experiments were determined to evaluate the influence of the input parameters on:
  • Suspended solids concentration (content) (SSC);
  • Relative changes of permeability in the “model-screen” system;
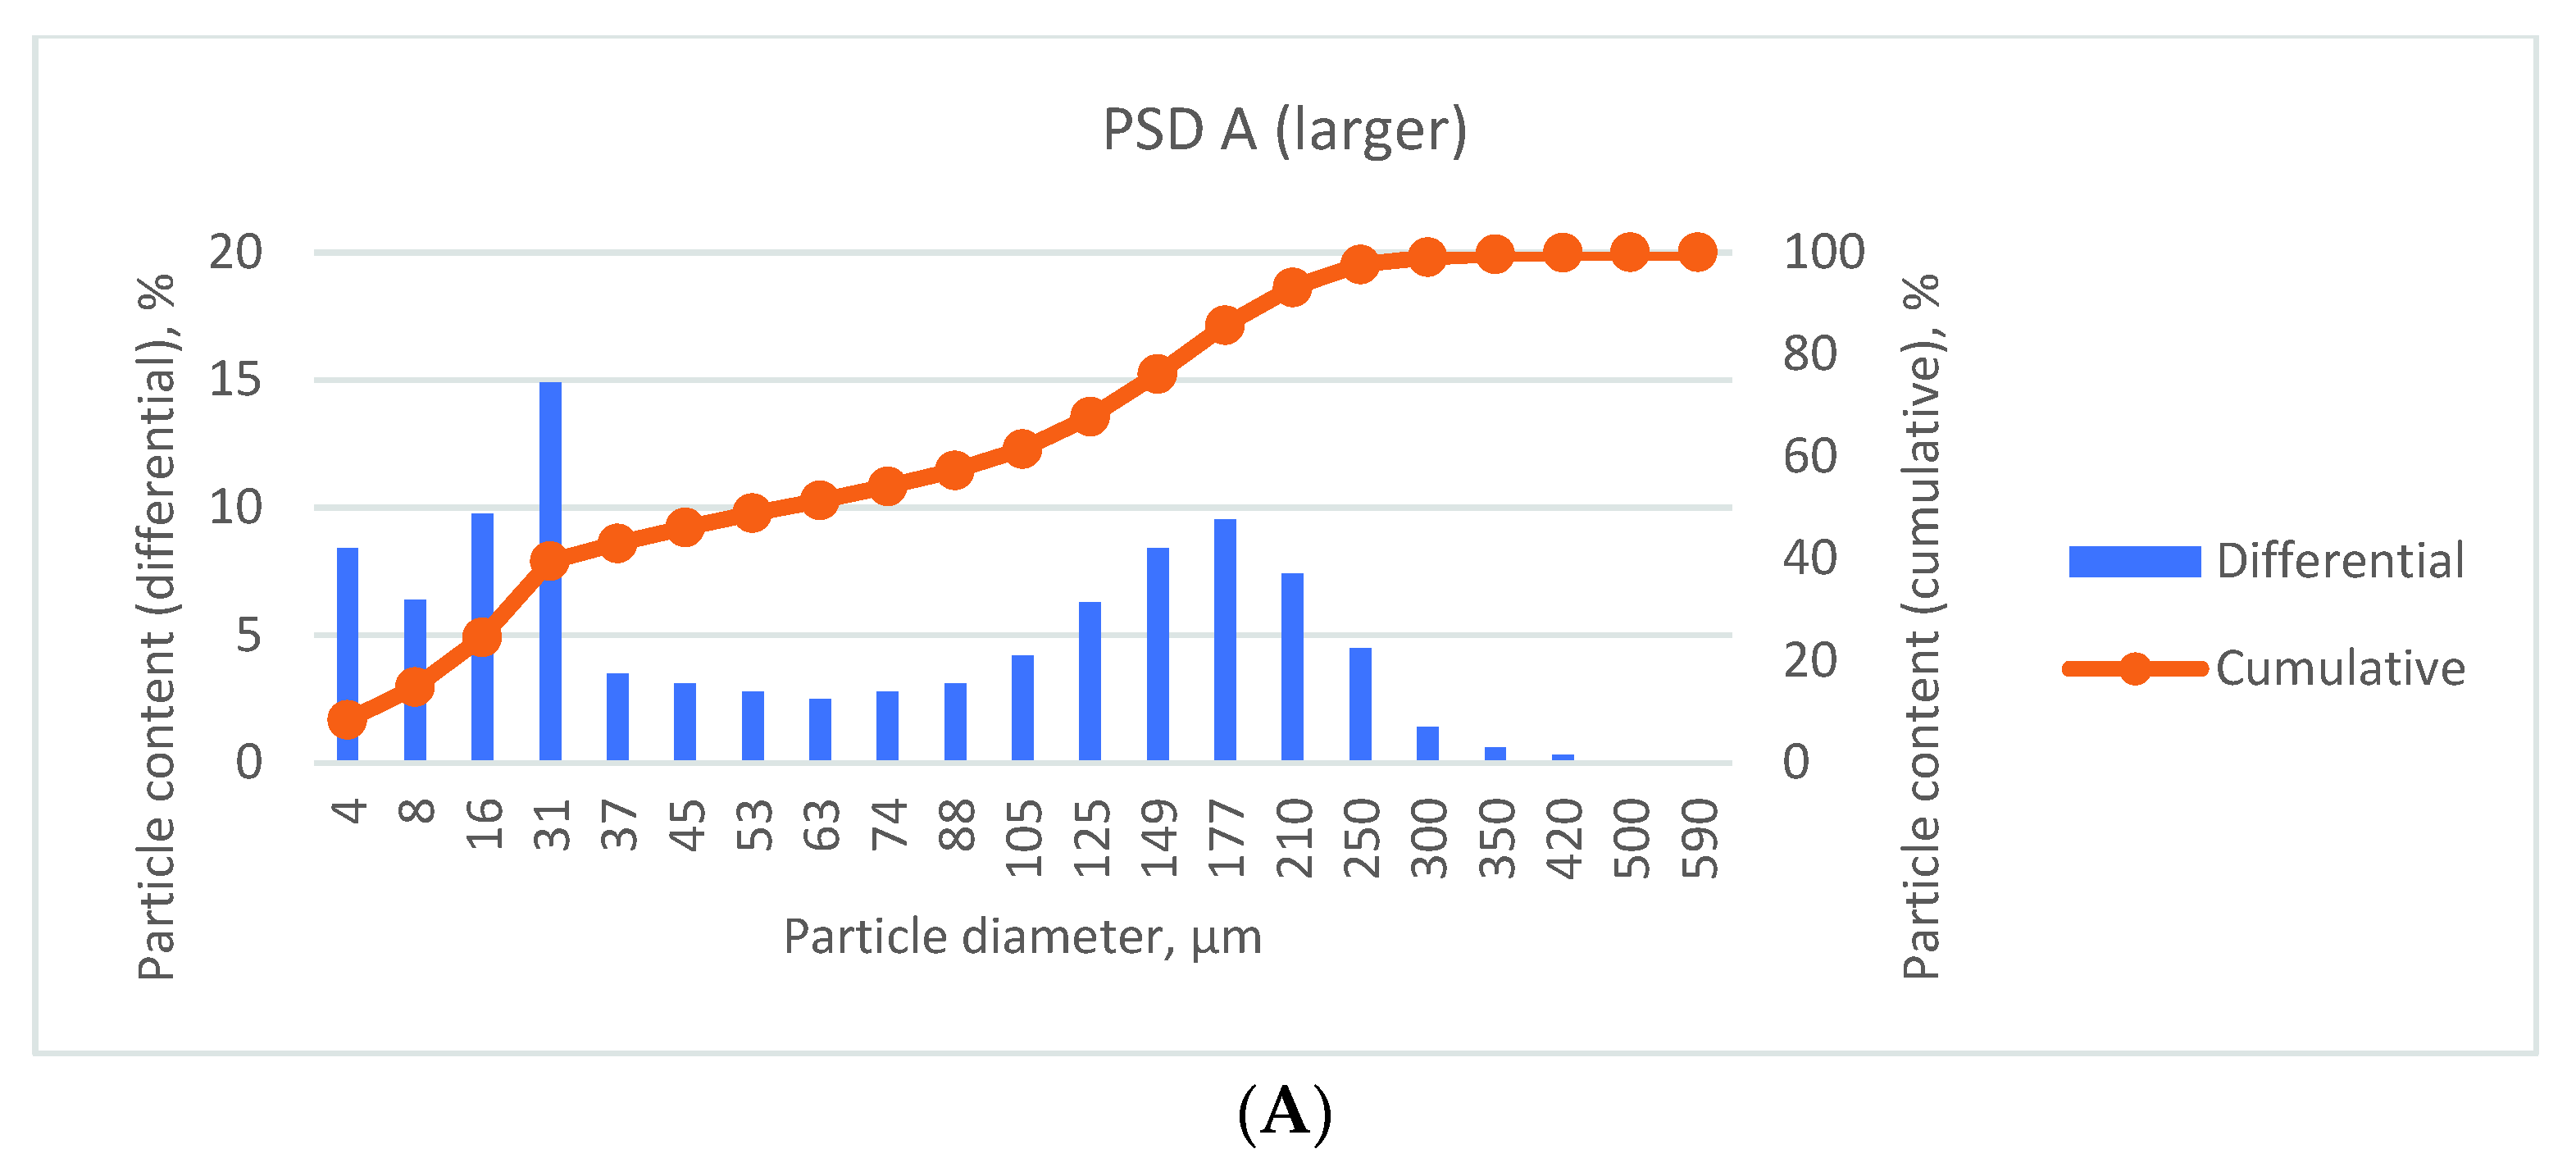
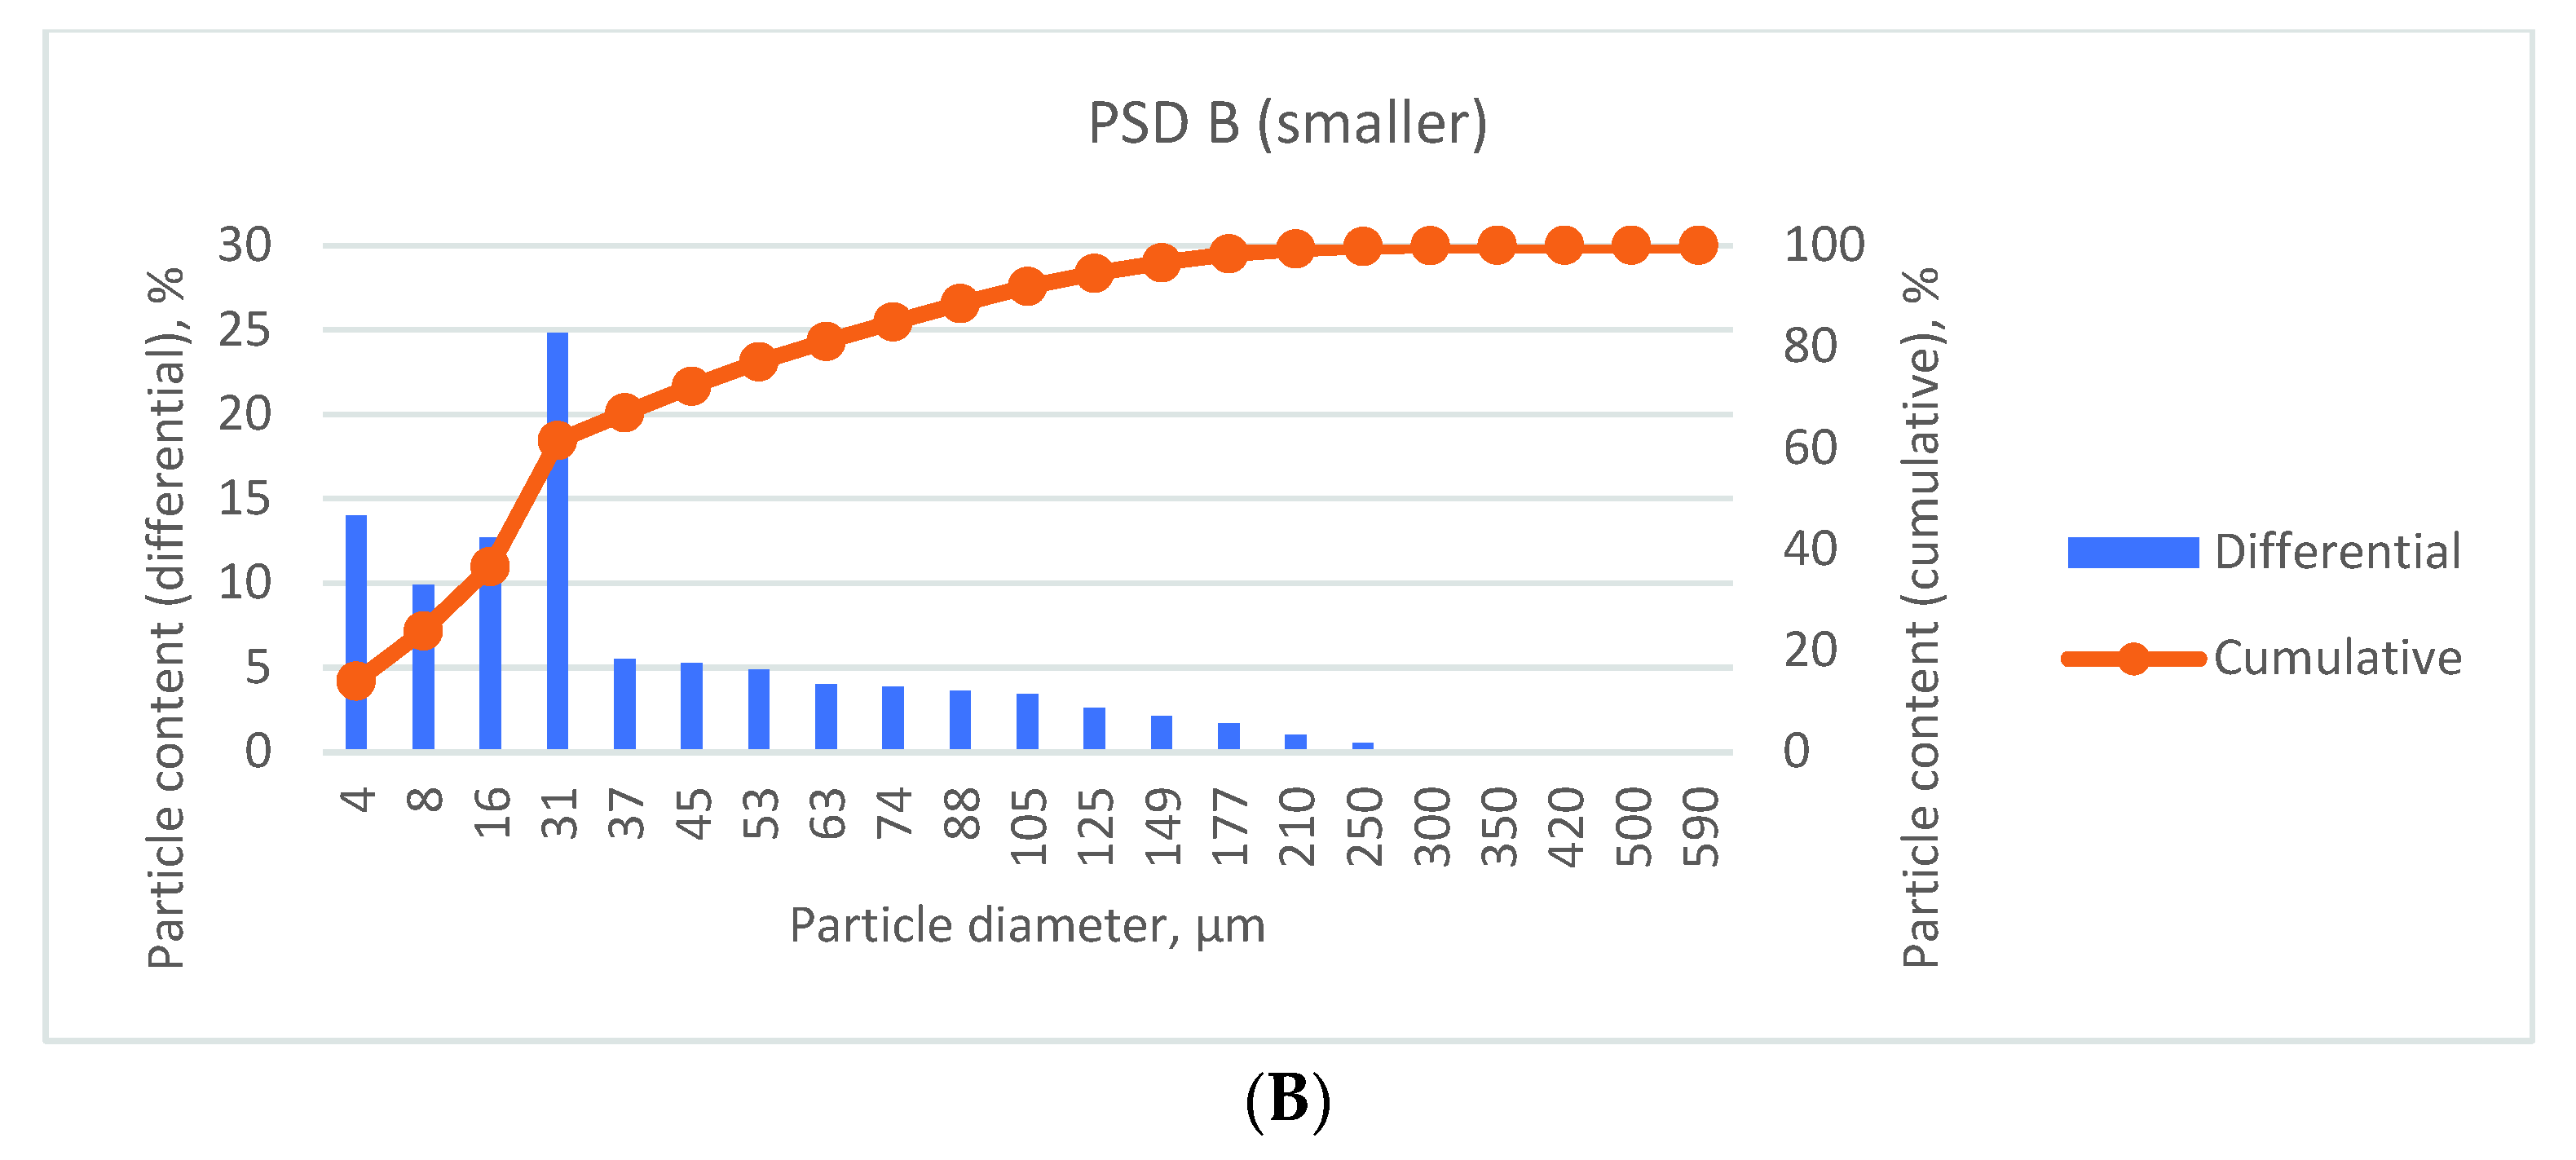
  • Particle size distribution of the produced solids.
During the experiments, filtration was carried out with the following ratios of injected phases:
  • 100% “oil”;
  • 90%/10% “oil”/brine;
  • 50%/50% “oil”/brine;
  • 30%/70% “oil”/brine;
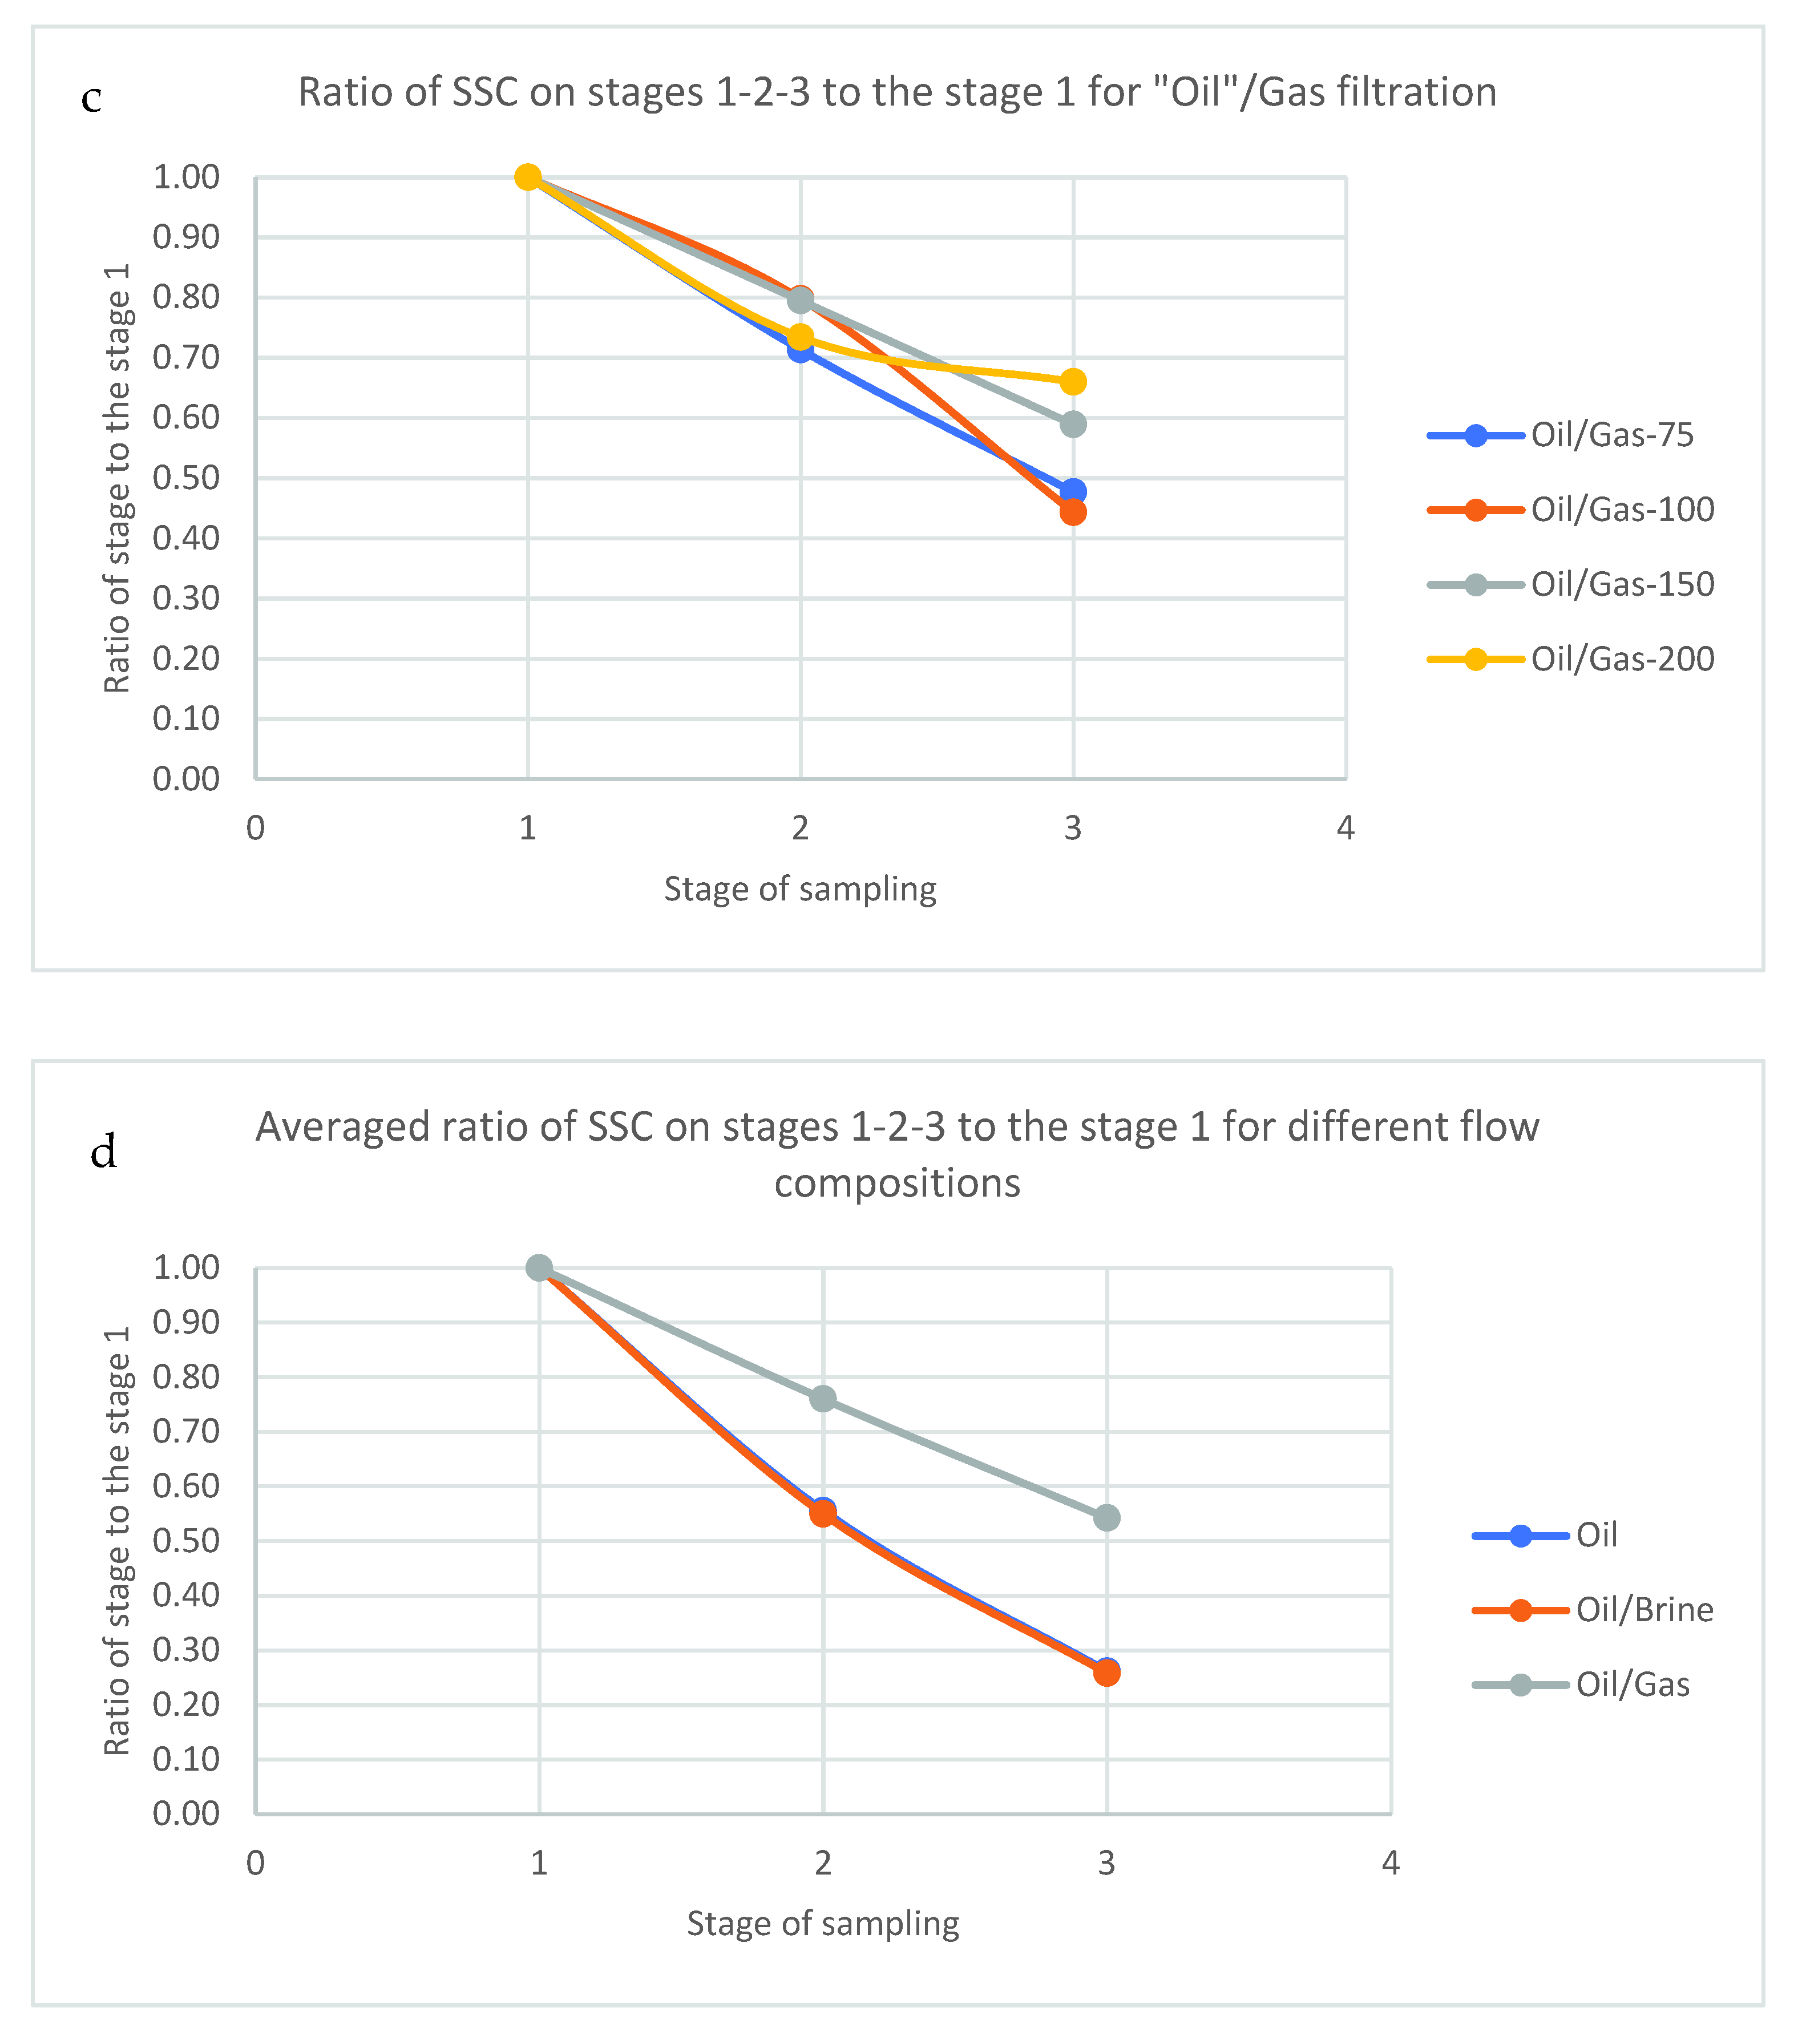
  • 70%/30% “oil”/gas;
  • 50%/50% “oil”/gas;
  • 10%/90% “oil”/gas.
As a model “oil” in laboratory studies, a transparent mixture of mineral oils PMS-50 and PMS-100 (PMS refers to methyl silicone or polymethylsiloxane, the number after hyphen refers to viscosity in centipoise) was used with an exact reproduction of the specified viscosity. Formation water obtained by mixing distilled water with the required amount of initial salts was used as water. Nitrogen was used as the gas. Tests were performed at ambient temperature with recalculation of oil viscosity to ambient temperatures, because it was proven that temperature does not affect the results of sand retention tests (SRT) [4].
The authors used coupons of wire wrapped screens of 3 cm (0.1 ft) in diameter with the following aperture (screen opening) sizes: 100, 150, 200, 500, 700, and 1000 µm. According to the results of preliminary tests, it was decided to abandon the coupon with an aperture of 1000 microns due to the complete destruction of the bulk model. It is worth noting that some authors state that standalone screen (SAS) completions tend to develop less skin-factor over time in field conditions [23].
The tests were carried out on bulk models from rock (fine-grained sandstone) taken from the bottomhole of production wells. The resulting sand was cleaned from residual oil. Next, the sand was dried and sieved in portions through a set of sieves on a vibratory unit. The resulting sand fractions were then mixed in the proportion required to match the particle size distribution of the reservoir (Figure 5).
The number of sieves directly affects the accuracy of matching the initial particle size distribution with what is mixed for the bulk model. It is worth noting that the decision regarding the choice of reservoir sand versus commercial sands is debatable and was covered in papers [24,25]. We chose reservoir sand over commercial due to reservoir heterogeneity and uneven distribution of different clays.
The bulk reservoir model (Figure 6) is assembled using the moist tampering method, i.e., water is added to the previously prepared and mixed sandstone sample and then saturated with “oil”, which is subsequently used in the test. There are differences between “dry” and “moist” tampering methods in terms of end-porosity and end-permeability of the model—porosity and permeability of models prepared with “moist” tampering tend to be slightly higher than that of models made with “dry” tampering [14]. During preliminary tests, we found that under these conditions it is impossible to prepare a high-quality model using the “dry” tampering method.
There is also one more process to account for during model preparation, which is called convergence—tendency of smaller-sized particles to shift down the model due to the natural gravitational force [14]. To neglect this effect, it was decided to use “moist” tampering—a mixture of sand was pre-mixed as a dry sand, then mixed well with reservoir water and then the sand was successively tampered with in tubes by small layers.
The model is sequentially compacted after addition of water. The heat shrink tube is then shrunk to the required size. During the next step, the model is subjected to uniaxial compression. After compression, bulk reservoir model is saturated with “oil” in the vacuum pump facility.
The important differences between using bulk models in filtration testing and fluid filtration through rock in a standard Prepack Sand Retention Test (SRT) are:
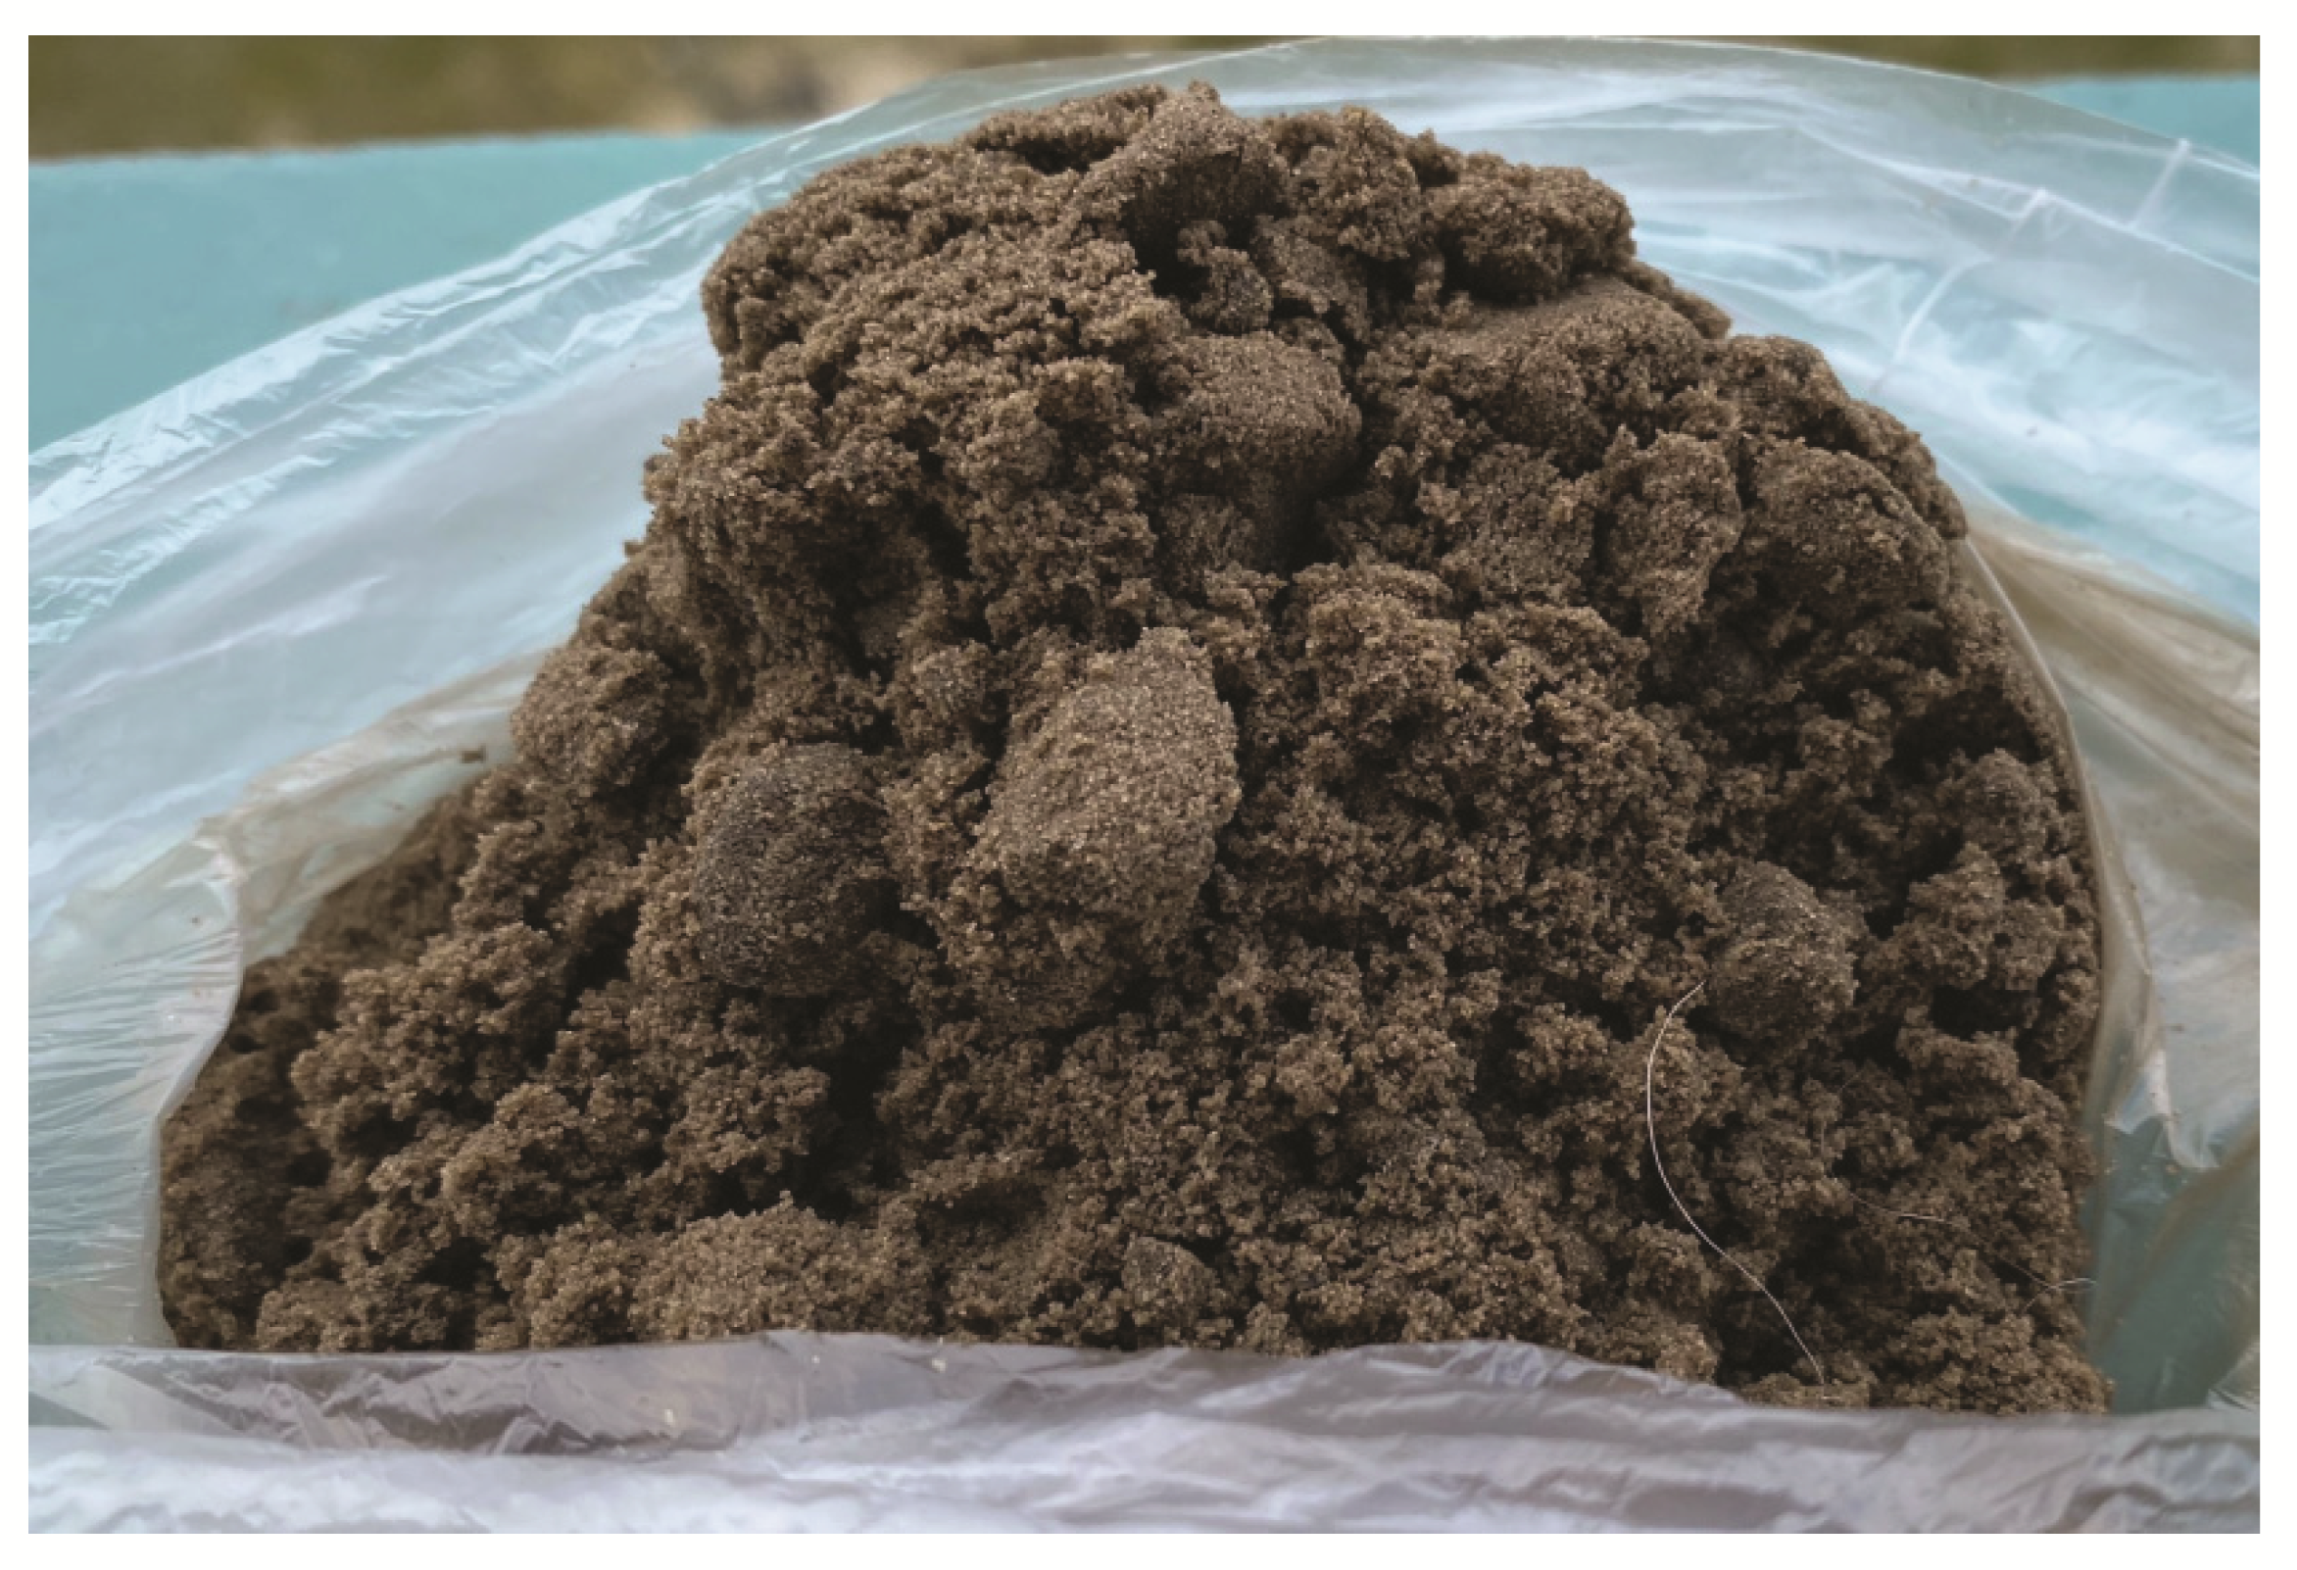
  • scale effect—the smaller the sample of rock, the less uncertainty in the distribution of rock particles by volume, which directly affects the reservoir properties of the model;
  • the ability to “change” the porosity and permeability of the bulk model during its assembly (by changing the amount of force during uniaxial compression), as well as by changing the rock pressure in the filtration facility;
  • the ability to saturate bulk models with formation water to the required level.
The permeability of bulk models for gas immediately after assembly is about 3–4 µm2 (measured on the TBP-804 unit) and varies depending on the level of compression of the model on the uniaxial compression unit.
The model is then placed in a filtration unit. The facility could carry out multi-phase filtration of liquids and gases, as well as simulate rock pressure in significant ranges.
A schematic representation of the core holder used during the laboratory tests is shown in Figure 7.
There are no publications on recalculation of the rock pressure acting in the reservoir to the conditions of bulk models, as a result of which it was decided to select the rock pressure according to the criterion of convergence of the obtained oil phase permeability with that of oil under reservoir conditions. The target range for permeability was 0.5–1.5 µm2 (500–1500 mD). Empirically, it was found that the most optimal value of rock pressure for testing is 300 psi (2041 MPa) with the following dimensions of the bulk model: height—0.055–0.065 m, diameter—0.028 m. Given the length of the horizontal section of the wellbore, the corresponding volume of the bottom hole zones, and the volume of the bulk model—it was decided to neglect the scale factor. However, the investigation of different pressure levels for prepack testing was covered in [1].
At the outlet of the core holder, fluid samples are taken, which are subsequently used to evaluate the suspended solids content (SSC) and PSD of rock particles suspended in the fluid. Probe sampling was performed as follows:
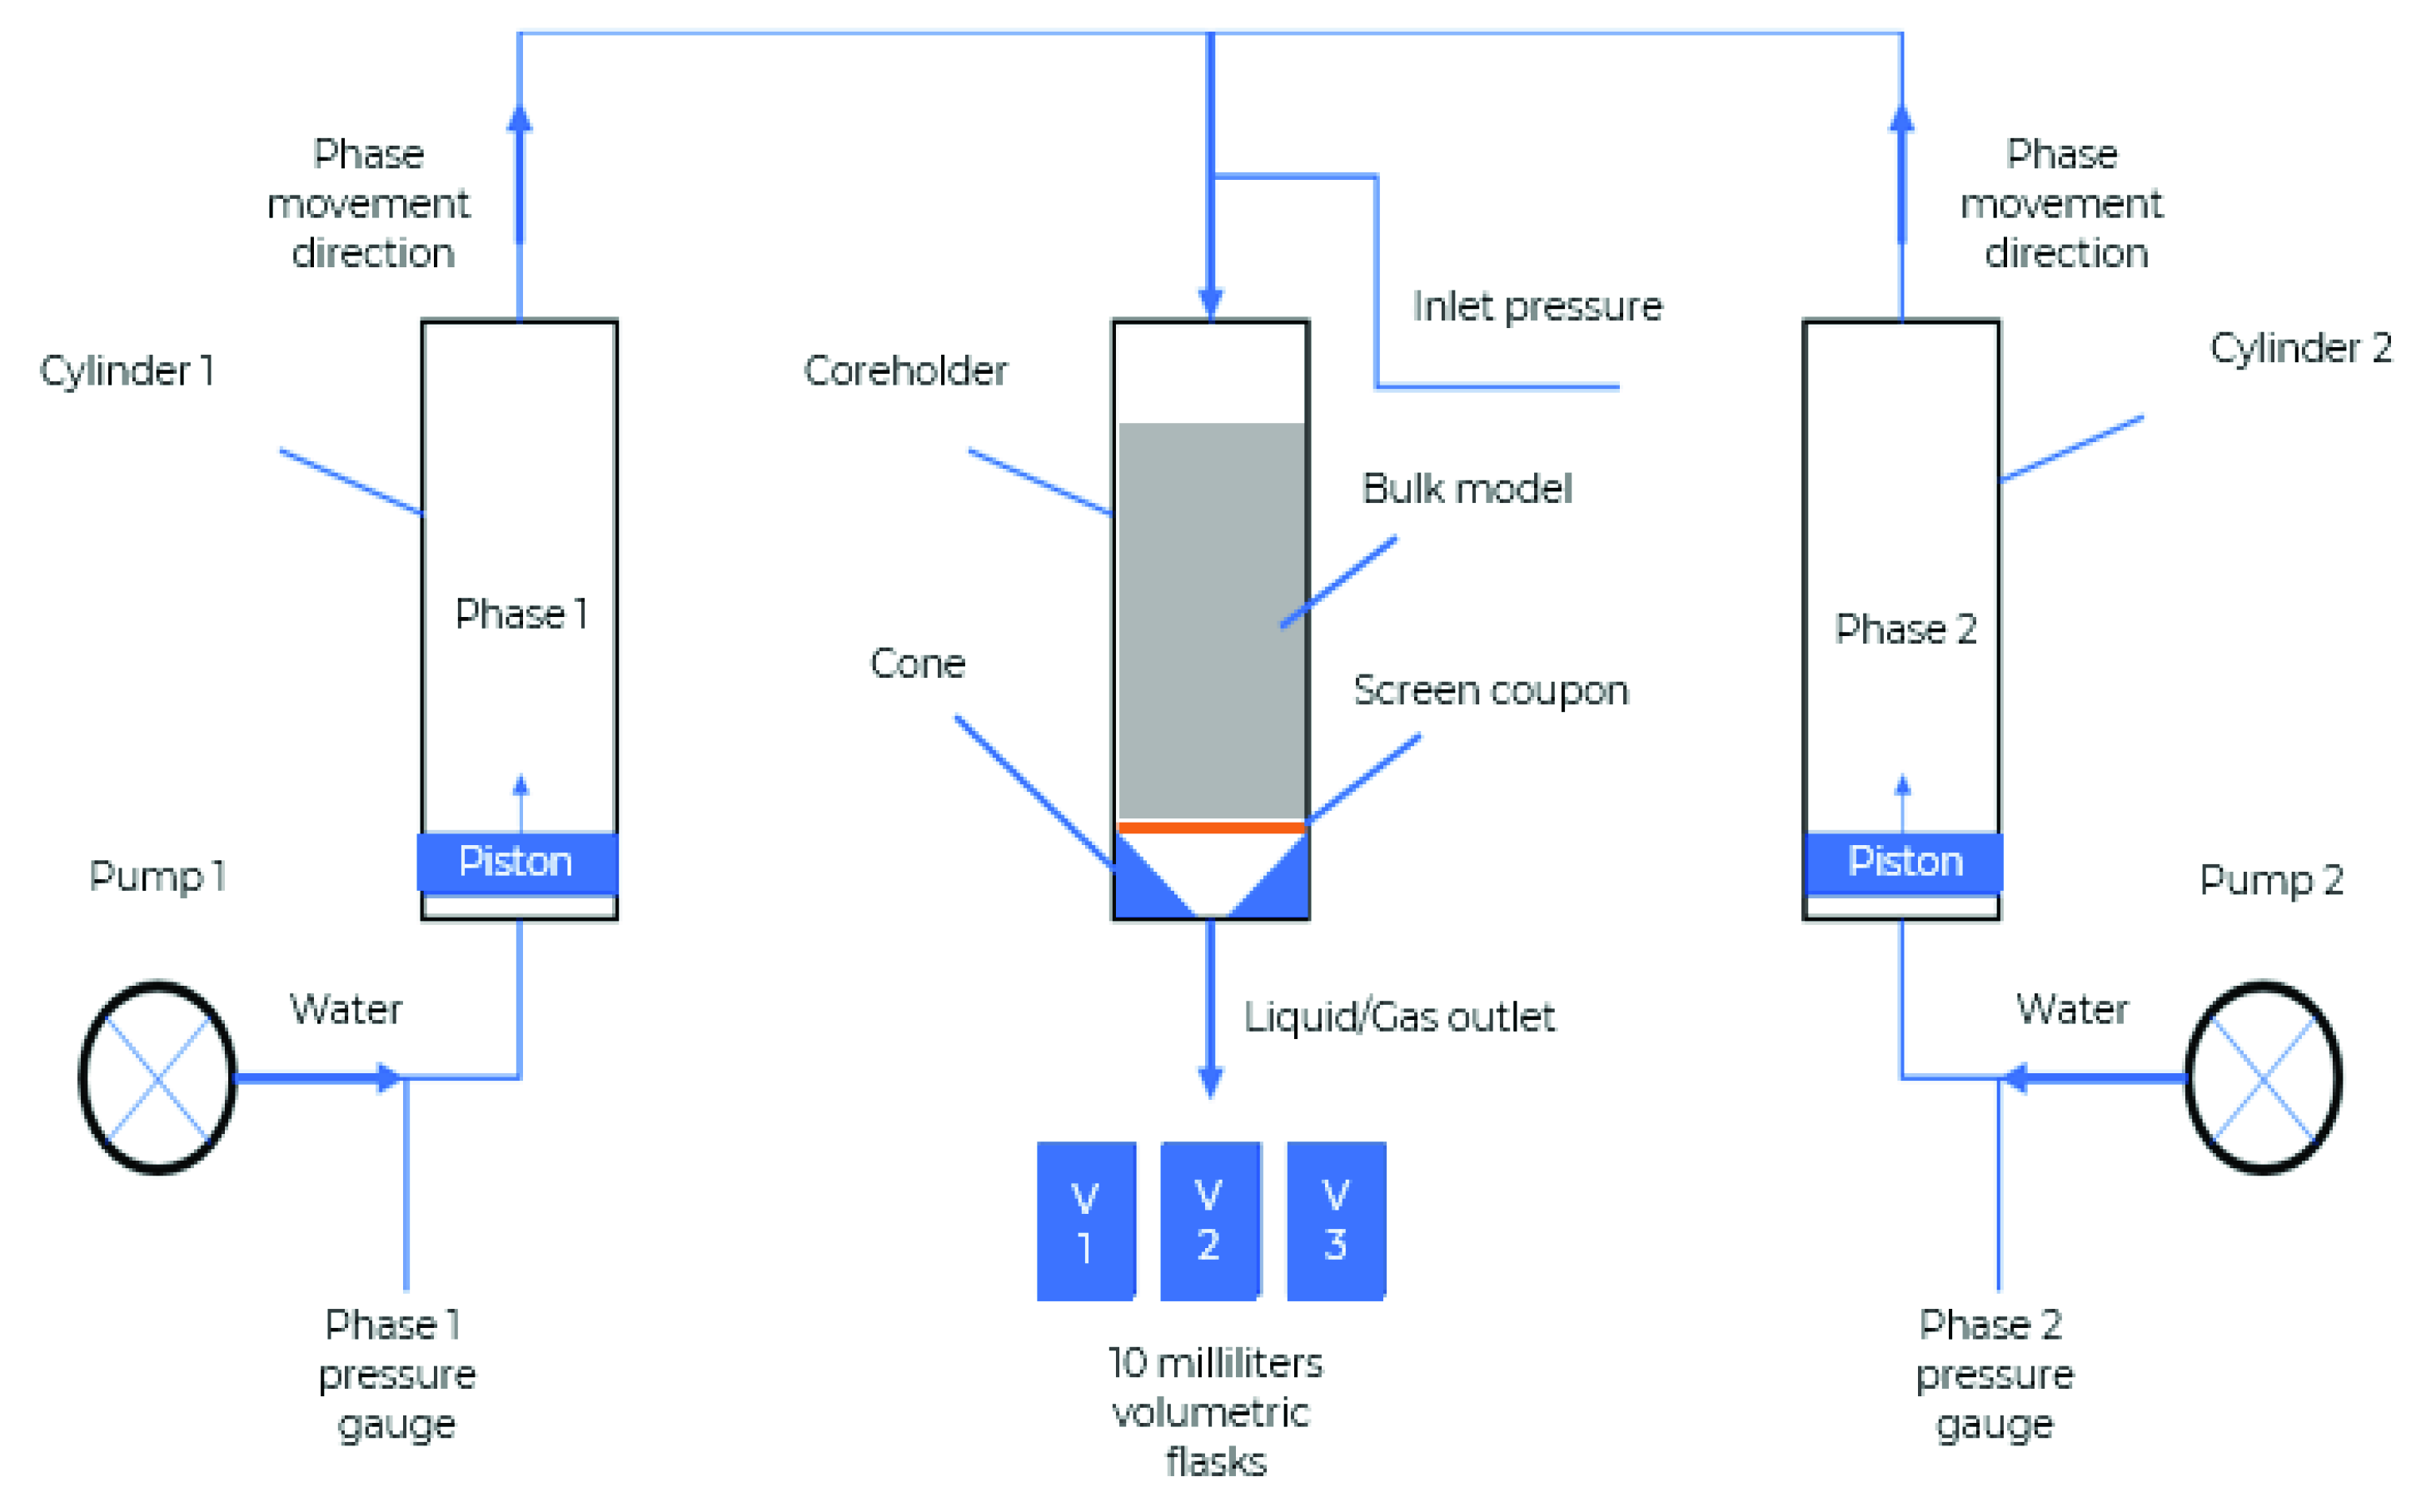
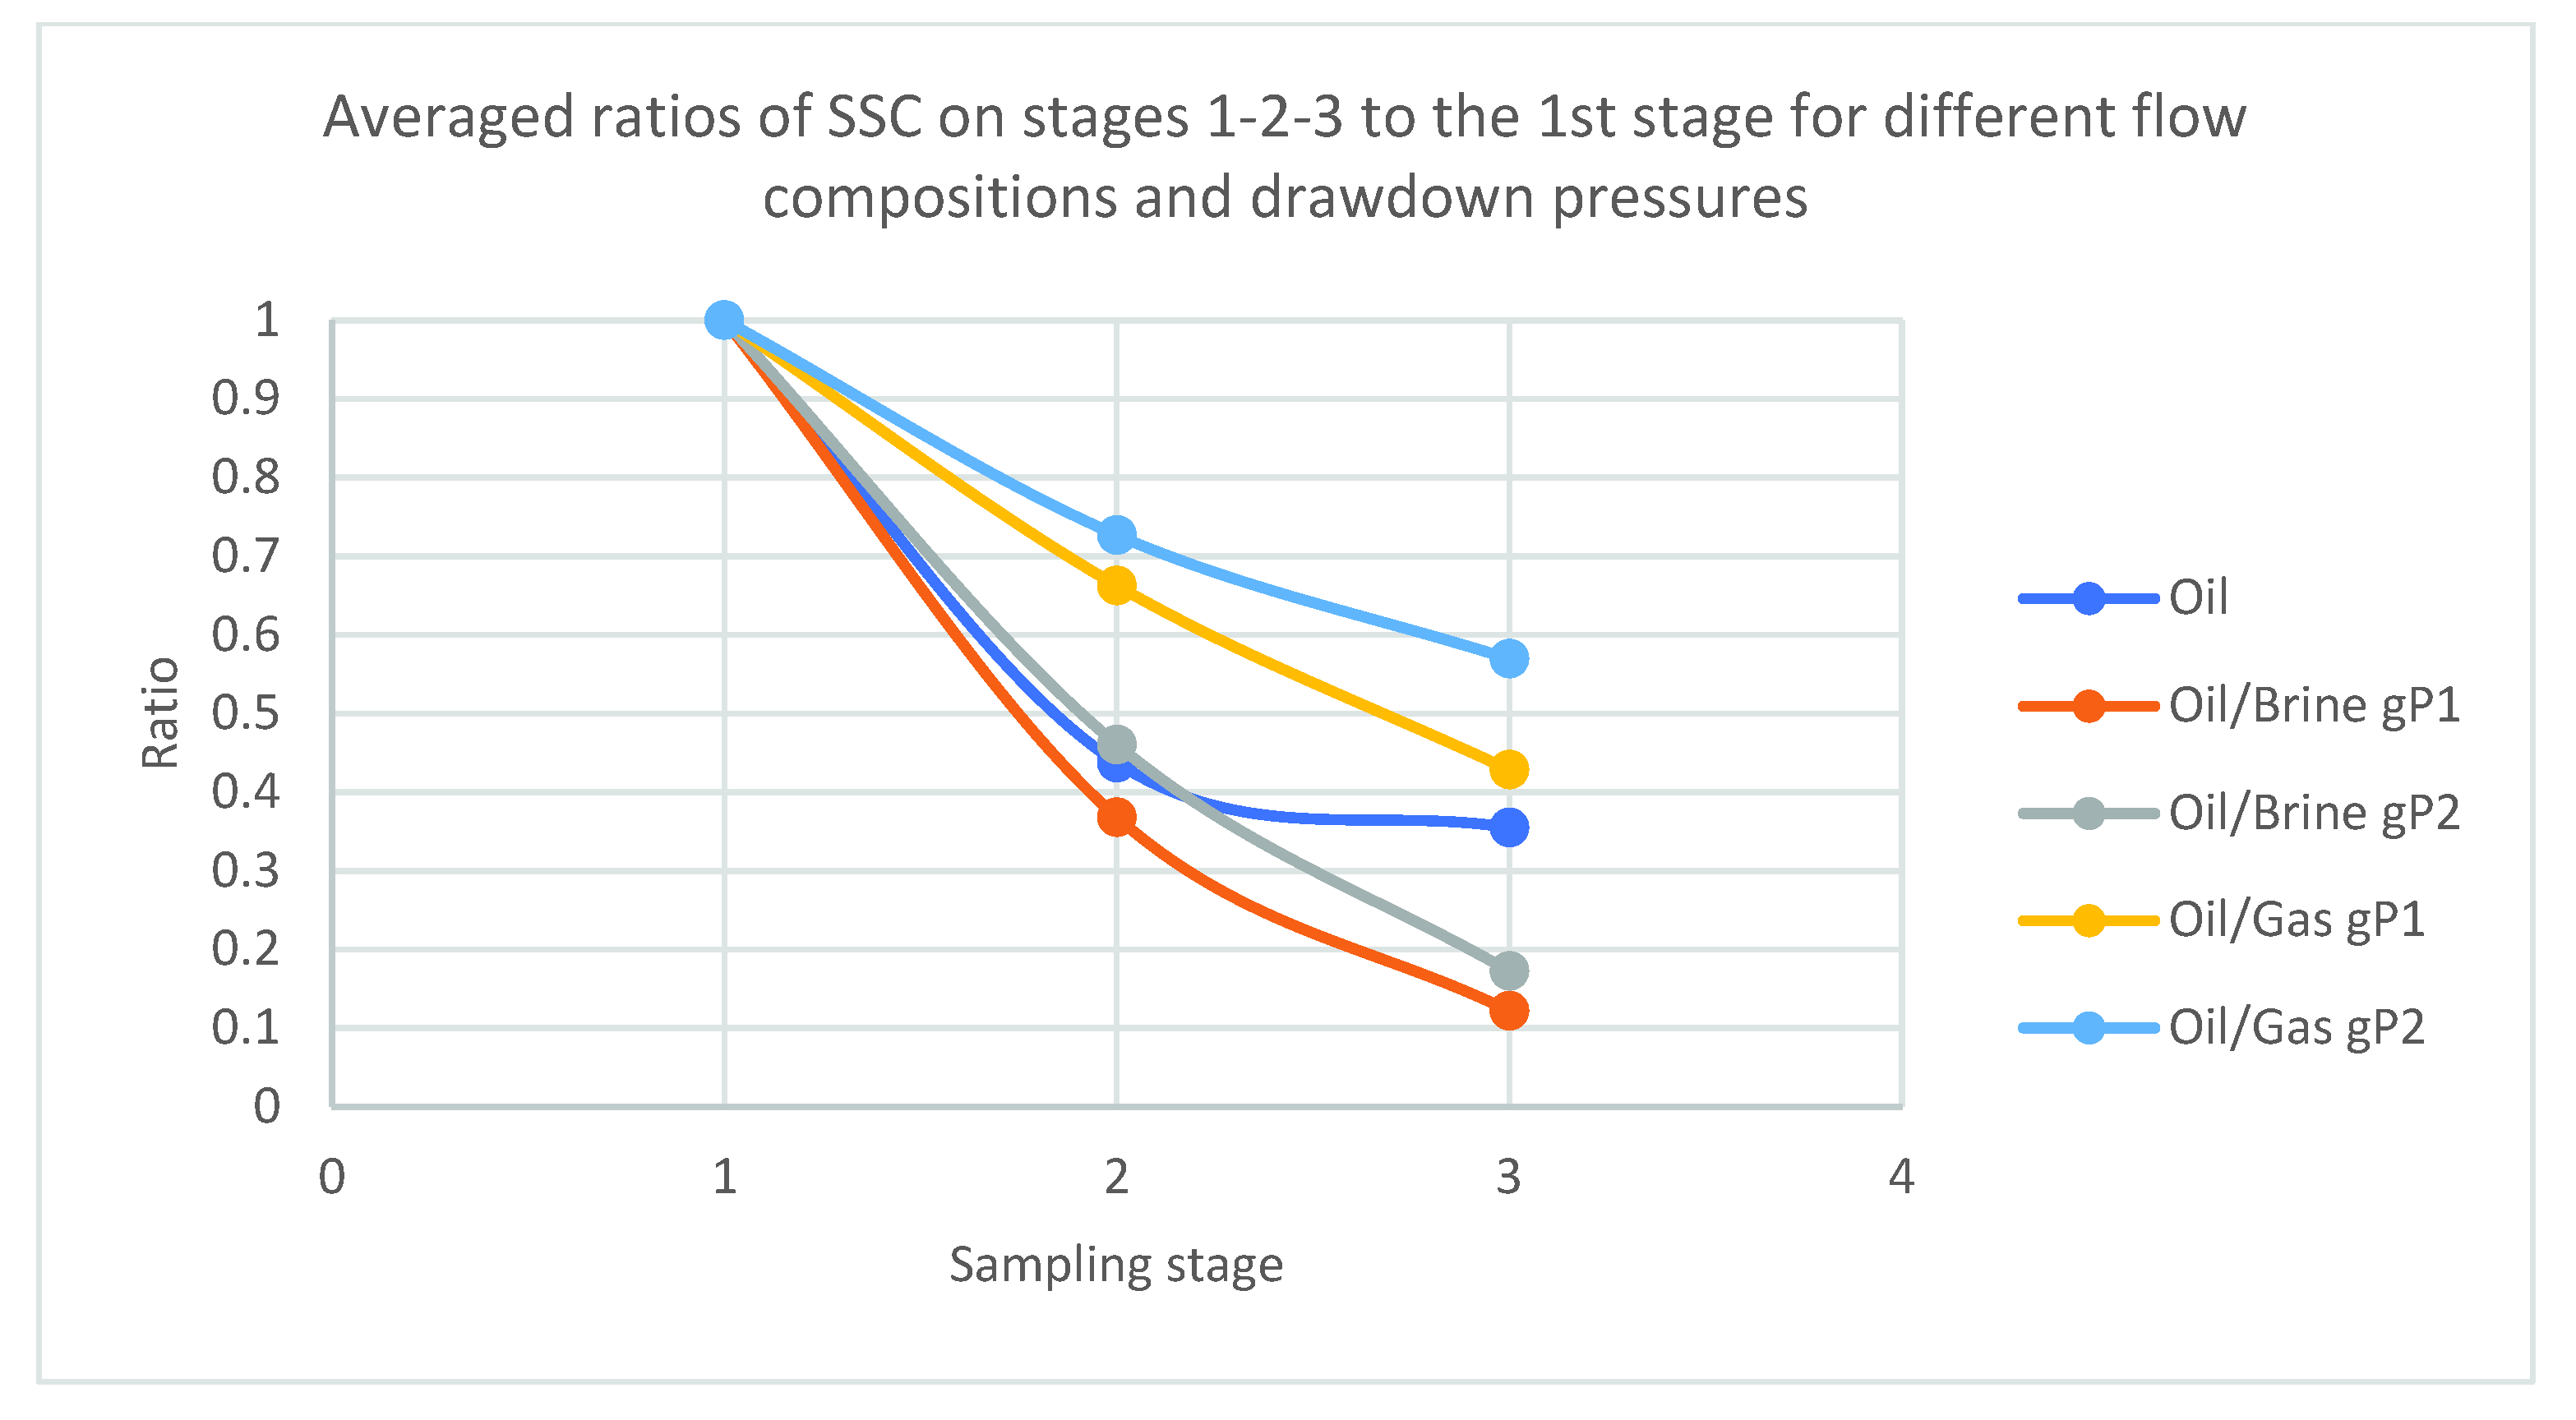
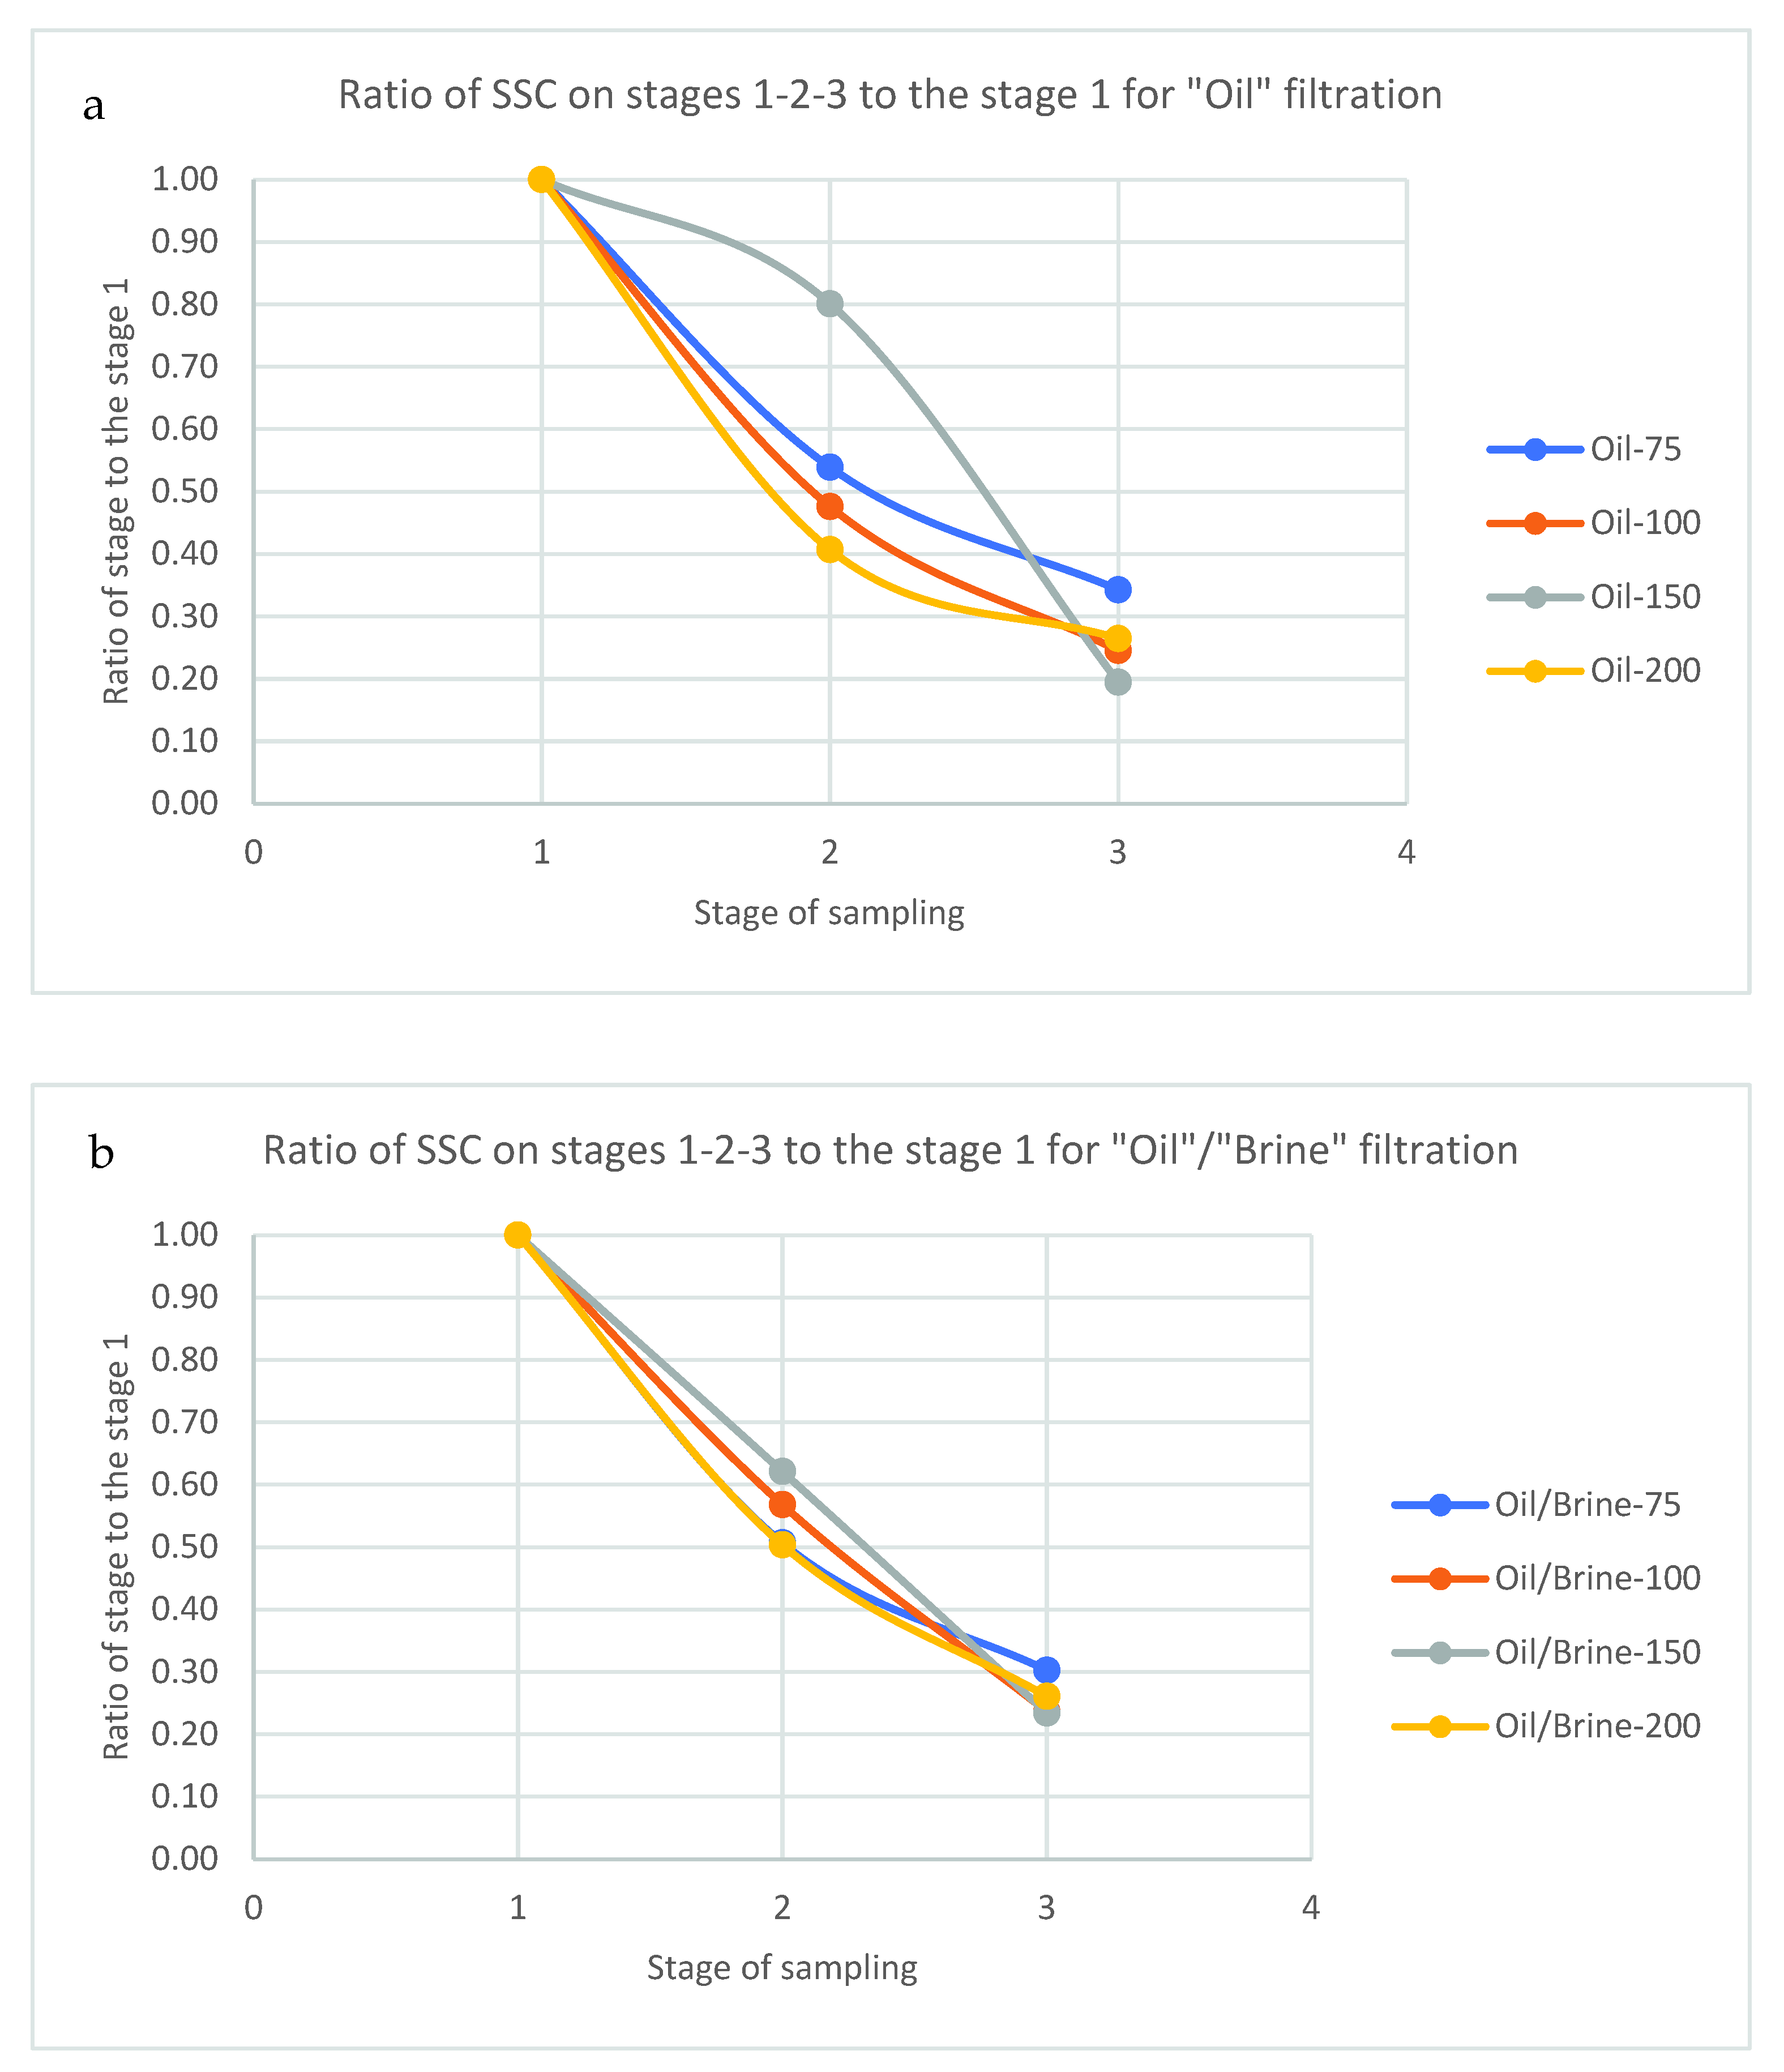
  • First probe was taken from initial liquid flux up to 10 milliliters of liquid (with sand) of volume. Pore volume of the model was estimated to be around 3–4 mL, thus, the first probe contained 2–3 pore volumes of simulated bottomhole formation zone (BHZ), which can be classified as well stimulation stage.
  • Second probe was taken immediately after the first one. This stage represents the pseudo-steady state of the flow in the model (reservoir) and also contained 10 mL of liquid (with sand). Given the high permeability of the reservoir and models, that represent it, it is likely that the pseudo-steady flow stage would not last for a long period of time.
  • Third probe was taken immediately after the second. This stage represents the “steady” state of the flow and also contained 10 mL of liquid (with sand).
  • Fourth probe was the last and it contained all the remaining volume of liquid with sand that was pumped through the model during the experiments. Approximately 250 mL of liquid was gathered at this stage.
SSC measurements were carried out in two different ways depending on the aperture of the studied coupon [26,27]:
  • For coupons with openings of 100, 150, and 200 µm SSC was measured using pycnometers (due to the small size of the washed-out particles and their adhesion to filter-paper);
  • For coupons with openings of 500 and 700 µm SSC was measured using filter-paper (“Blue ribbon”).
Given 4 samples of liquid with sands, only 3 probes were measured for SSC and particle size distribution (PSD), because the fourth probe was mostly transparent and contained an unnoticeable number of particles (considering its high volume SSC for this probe was negligible). Three stage measurements allowed to measure the process of the “stabilizing” of sanding over time, because some authors state that sanding decays over time (under normal circumstances) [17,28,29]. This happens due to:
(a) Effect of sand “arching” in front of the screen openings;
(b) Redistribution of stresses and flow paths in the model (reservoir).

3. Results

The series of filtration tests carried out on a small-scale model makes it possible to simulate the growth of water and gas cut/ratio (10%, 30%, 50% water/gas in the flow) at different screen apertures. Filtration was carried out at two drawdown pressures—gradP1 and four times greater gradP2 [30,31]. Summarized data on the amount of suspended particles is presented in Table 1 and Table 2 and Figure 8. Suspended solids concentration (SSC) is indicated for the liquid that has passed through the screen. Note that these are the averaged results for three probes of liquid with sand.
Table 1 demonstrates that SSC increases with increased drawdown pressure—this is mainly due to the increased flow rate (to create such drawdown pressure). Increasing the aperture size of the screen almost always results in increasing SSC. Finer PSD results in higher SSC, which was also expected. Although the increase in SSC is not that high given the immense difference between the two PSD curves. This result does not agree with the data given in [29], where the author states that even small differences in D50 will result in significant changes in the results of the experiment.
As was mentioned earlier, some authors noted that SSC decays over time so a 3-probe-sampling procedure was implemented [32,33]. The figures below represent the ratio of SSC on stages 2–3 to the SSC on stage 1. It’s important to note that for one and only flow composition rate of “stabilization” differentiates between different aperture sizes. The last figure in the section represents the average-weighted ratio for different flow compositions—as it can be seen, gas flow strongly affects stabilization rate, but this effect is negligible given lower SSC for flow with gas in all cases. The process of stabilization is also affected by the pressure gradient of the flow (flowrate)—higher flowrates result in lower stabilization rates. The stabilization process can be observed in results obtained by [5]. They also noted that increasing flow rate for a short period of time will result in an increase in SSC, which will also “stabilize” to the rates below this increase in flowrate. Effect of gas flow on SSC and permeability changes was covered in [10]. Experiments were performed under constant drawdown pressure (denoted as gradP in the tables and graphs) due to the possible misconception of permeability evolution in constant-flowrate tests [29]. Outlet pressure was 1 atmosphere (1053 bar) and inlet pressure was changing from gradP1 to four times higher gradP2 depending on the needs of an experiment. Effect of drawdown pressure, phase distribution, and screen aperture size can be observed in Figure 8 and Figure 9.
Figure 9 clearly demonstrates that for both “oil”/brine and “oil”/gas filtrations increased drawdown pressure (increased flowrate) affects the rate of SSC decrease. The higher effect of pressure increase for flow with gas also should be noted—an increase in pressure for flows with brine did not account for much difference in stabilization rate.
An increase in SSC due to increased aperture size is to be expected. An increase in SSC for flows with gas is not that high compared to the increase with brine flows. A decrease in SSC with an increase of gas content in the flow was studied thoroughly with data from PSD analysis of the washed-out particles. It was discovered that high gas content results in a decrease in the radius of washed-out particles as the time goes on—thus, a smaller amount of SSC should be expected for high gas content in the flow.
On average, a four times increase in drawdown pressure between the tests resulted in 2.15 times increase in SSC for the screen with aperture sizes of 100, 150, and 200 µm. It is hard to predict how a change in pressure affected screens with higher aperture sizes due to the lack of data—these screens did not pass the test program completely (Figure 10 and Figure 11). This data is in correspondence with studies [10,12,17,34,35,36].
For both PSD’s trend for higher SSC with increased water cut can be observed (except for experiments with 200 µm WWS, where an increase in water cut resulted in a decrease in SSC). This is probably due to the hydrophilic nature of the reservoir sand—the interaction of sand with water results in decreased capillary pressures and this “triggers” the mobilization of the individual sand grains.
Authors pay special attention to the effect of gas flow—an increase in gas/oil ratio (GOR) resulted in increased SSC for tests on finer sands and decreased SSC for tests on larger sands. This can be explained by the “critical mass of sand”, which is somewhere in between the average masses of these sand samples. Thus, below this point—gas is able to mobilize a significant portion of sand particles, but above it—the energy of the gas flow is not high enough to trigger the movement of individual sand particles. Figure 11 clearly demonstrates that an increase in gas injection pressure (gas flowrate) results in a two times increase in SSC for larger sand (PSD A).
Another important factor that should be accounted—returned permeability of the screen. In this series of experiments, the initial permeability of the “model-screen” system was measured for the first time when certain pressure in the system was reached (gradP1 or gradP2). The second point was taken at the end of the test, right before pumps were shut off. Permeability was calculated using standard Darcy’s law. Data on the permeability change is shown in Table 3.
An increase in drawdown pressure during filtration results in a decrease of retained permeability—it is likely that high flowrates induce the movement of sand particles that block the permeable channels. Combining data on returned permeability and SSC can give a clue about screen efficiency. Maximum returned permeability with high SSC results in complete screen inefficiency. However, small returned permeability and high SSC should be studied thoroughly for any possible interferences between fluid and sand particles (due to pH changes [37,38] or convergence of the flow in the vicinity of the screen [39], or any other effect). All of the screens passed the 50% retained permeability criterion proposed by [40]. It is also worth noting that retained permeability of the linear flow might be biased towards lower values and the retained permeability of the same experiment design with a radial flow regime will be higher [17].

4. Discussion

The Prepack nature of the test allows to represent the whole specter of the reservoir characteristics in a single test. In this series, a reservoir with high clay content is present, thus, making it prone to effects of clay swelling and brine chemistry, and others that are standard in the industry [16].
Suspended solids content (SSC) is one of the key parameters that define both the process of sanding and technologies, that prevent sanding. SSC depends on many factors, but the crucial can be listed as follows:
  • amount of cementing material in the reservoir rock;
  • both physical and chemical processes in the reservoir;
  • gas-oil ratio;
  • water cut;
  • technology, that is used to prevent sanding;
  • reservoir drawdown (fluid flowrate) [41];
  • completion type.
Thus, it can be concluded that multiphase flow will strongly affect the process of sand production. The appearance of gas in the flow leads to the turbulent nature of the flow in the lower part of the porous channel and this affects that angle at which flow meets the sand particle. Given the lower energy of the gas, it still provides enough force to the particle to separate it from the surface of the channel [39,42]. The potential effects of water in the flow are as follows [42]:
  • Capillary pressure changes;
  • Possible interaction in the hydrophilic reservoirs where brine adheres to the surface and this makes it easier for the flow to enthrall particles;
  • Possibility of emulsification of the flow, thus, increasing effective viscosity and increasing drag force of the flow.
Suspended particle content directly affects the turnaround cycle of both surface and subsurface equipment including pumps, pipelines, Christmas tree, separator equipment, etc. High SSC can also lead to sand plug forming, which requires well workovers (flushing), thus, stopping the production [43].
Certain assumptions were made during mass measurements with pycnometers:
  • The ratio of fluids in the pycnometers corresponds to the given parameters of the test—i.e., during the experiment, water/“oil” 30/70, the ratio of liquids in the pycnometer was taken as such [44];
  • Mass of sand that is left in the installation was not measured or evaluated;
  • Densities of “oil” and brine were measured once at the beginning of the test.
It is also worth noting that sand production behavior and its stabilization over time depends on the equipment that is used in the bottomhole section. For example, in [45] two similar wells both had an erratic bean-up program, but one of them had less sand production due to more suitable equipment in the bottomhole.
In order to better understand the nature of the observed effects and other trends in the sanding process, Prepack SRT must be coupled with the results of the Slurry SRT test—this will allow to simulate of the behavior of the bottomhole formation zone during the well’s life cycle. Slurry SRT for bringing the well into operation and early stages of the well’s life and Prepack SRT for mature wells, where continuous sanding has led to the destruction of the bottomhole formation zone and sand deposited on the screen surface.
Given the fact that SSC decreases over time, it is worth noting that normalizing the results of the different SRT tests is a difficult task due to the difference between trends for increasing the area of the screen and produced volume of the fluid through this screen. This effect can be represented as follows (Figure 12).
Thus, increasing the area of the screen 10 times will result in 10 times higher cumulative SSC for a given equal filtered volume of fluid. In order to reach 10 times higher cumulative SSC one will have to filter a very high amount of fluid and the increase is non-linear. This makes it difficult to normalize the results of the SRT tests in terms of gram/liter/square meter or kilogram/cubic meter/square meter (1 kg of produced sand filtered through a screen with an area of 1 square meter after filtration of 1 cubic meter of fluid). One way to surpass this problem is to differentiate the process of sanding into two stages—where in the first stage decrease in differential SSC will be linear and during the second stage decrease will be non-linear. [21] recommends normalizing results of testing not by screen area or volume, but by open to the flow area of the screen (OFA)—but this normalizing does not give any clear representation of the screen’s efficiency in the field conditions, even though it is a good indicator for the screen manufacturers.

5. Conclusions

A series of Prepack SRT tests on bulk reservoir models with two different compositions of sand (larger and finer sand) was performed. Keynote distinction between Prepack test on sandpacks and bulk models is the option to somewhat control parameters of the resulting bulk model before the experiment—its initial saturation and porosity/permeability.
During these tests, the effect of gas/brine flow combined with the model of oil was examined. Water cut directly affects the amount of washed-out particles—suspended solids concentration (SSC): in many cases increase in water cut up to 70% resulted in increase in SSC.
Increase in drawdown pressure (pressure difference) during the filtration experiment results in increase in SSC. The reason for that is increased “energy” of the flow—the flowrates required to create higher drawdown pressure are higher. Water (brine) also affects returned permeability of the screen—during tests it was investigated that during filtration of “oil”/brine compositions returned permeability of the screen was the lowest among three types of phase distributions.
The flow of “oil”/gas compositions tends to have the lowest SSC amounts, but the “stabilizing” rate of these compositions is the lowest among all phase distributions—i.e., SSC slowly decreases over time, but this decline is not as rapid as for “oil”/brine or pure “oil” compositions.
It is important to perform all kinds of tests (Prepack, Slurry, LSCE, RSCE) to better represent the behavior of the wells that is prone to sanding, because each of them represents a different stage in the well’s lifecycle.

Author Contributions

Conceptualization, M.G. and D.T.; methodology, M.G.; validation, M.K. and T.S.; formal analysis, N.M.; investigation, M.N.; data curation, M.G.; writing—original draft preparation, M.G. and M.N.; writing—review and editing, D.T., M.K., T.S. and N.M.; visualization, M.N.; supervision, D.T. and T.S.; project administration, D.T. and M.G. All authors have read and agreed to the published version of the manuscript.

Funding

This research received no external funding.

Institutional Review Board Statement

Not applicable.

Informed Consent Statement

Not applicable.

Data Availability Statement

Not applicable.

Acknowledgments

We would like to acknowledge Raupov Inzir, Associate at Saint Petersburg Mining University, for his help with testing procedures.

Conflicts of Interest

The authors declare no conflict of interest.

References

  1. Abram, M.; Cain, G. Particle-Size Analysis for the Pike 1 Project, McMurray Formation. J. Can. Pet. Technol. 2014, 53, 339–354. [Google Scholar] [CrossRef]
  2. Fattahpour, V.; Mahmoudi, M.; Wang, C.; Kotb, O.; Roostaei, M.; Nouri, A.; Fermaniuk, B.; Sauve, A.; Sutton, C. Comparative Study on the Performance of Different Stand-Alone Sand Control Screens in Thermal Wells. In Proceedings of the SPE International Conference and Exhibition on Formation Damage Control, Lafayette, LA, USA, 6–8 February 2018. [Google Scholar] [CrossRef]
  3. Romanova, U.; Ma, T. SPE 165111 An Investigation of the Plugging Mechanisms in a Slotted Liner from the Steam Assisted Gravity Operations. In Proceedings of the SPE European Formation Damage Conference & Exhibition, Noordwijk, The Netherlands, 5–7 June 2013; p. 8. [Google Scholar]
  4. Romanova, U.G.; Gillespie, G.; Sladic, J.; Weatherford, T.M.; Solvoll, T.A.; Andrews, J.S. A Comparative Study of Wire Wrapped Screens vs. Slotted Liners for Steam Assisted Gravity Drainage Operations. In Proceedings of the World Heavy Oil Congress 2014, New Orleans, LA, USA, 5–7 March 2014; p. 24. [Google Scholar]
  5. Mahmoudi, M.; Fattahpour, V.; Nouri, A. SPE-184999-MS An Experimental Evaluation of Pore Plugging and Permeability Reduction Near SAGD Sand Control Liners. In Proceedings of the SPE Canada Heavy Oil Technical Conference, Calgary, AL, Canada, 15–16 February 2017; pp. 1–18. [Google Scholar]
  6. Mahmoudi, M.; Fattahpour, V.; Nouri, A.; Yao, T.; Baudet, B.A.; Leitch, M. Oil Sand Characterization for Standalone Screen Design and Large-Scale Laboratory Testing for Thermal Operations. In Proceedings of the SPE Thermal Well Integrity and Design Symposium, Banff, AB, Canada, 23–25 November 2015. [Google Scholar] [CrossRef]
  7. Mahmoudi, M.; Fattahpour, V.; Nouri, A.; Rasool, S.; Leitch, M. WHOC16-612 The Effect of Screen Aperture Size on Fines Production and Migration in SAGD Production Wells. In Proceedings of the Effect of Screen Aperture Size on Fines Production and Migration in SAGD Production Wells, 2016 World Heavy Oil Congress, Calgary, Al, Canada, 5–8 July 2016; pp. 1–6. Available online: https://www.researchgate.net/publication/307522135 (accessed on 10 October 2021).
  8. Suman, G.O., Jr.; Ellis, R.C.; Snyder, R.E. Sand Control Handbook, 2nd ed.; Gulf Publishing Company: Houston, TX, USA, 1986. [Google Scholar]
  9. Garolera, D.; Carol, I.; Papanastasiou, P. Micromechanical analysis of sand production. Int. J. Numer. Anal. Methods Géoméch. 2019, 43, 1207–1229. [Google Scholar] [CrossRef]
  10. Bianco, L.; Halleck, P. Mechanisms of Arch Instability and Sand Production in Two-Phase Saturated Poorly Consolidated Sandstones. In Proceedings of the SPE European Formation Damage Conference, The Hague, The Netherlands, 21–22 May 2001. [Google Scholar] [CrossRef]
  11. Papamichos, E.; Malmanger, E.M. A Sand-Erosion Model for Volumetric Sand Predictions in a North Sea Reservoir. SPE Res. Eval. Eng. 2001, 4, 44–50. [Google Scholar] [CrossRef]
  12. Clearly, M.P.; Jelvan, J.J.; Kohlhaas, C.A. The Effect Of Confining Stress And Fluid Properties On Arch Stability In Unconsolidated Sands. In Proceedings of the Paper presented at the SPE Annual Technical Conference and Exhibition, Las Vegas, NV, USA, 23–26 September 1979; p. 12. [Google Scholar]
  13. Hall, D.; Div, D.; Harrisberger, W.H. Stability of Sand Arches: A Key to Sand Control. SPE J. Pet. Technol. 1970, 22, 821–829. Available online: http://onepetro.org/JPT/article-pdf/22/07/821/2225169/spe-2399-pa.pdf (accessed on 10 October 2021). [CrossRef]
  14. Kotb, O.; Haftani, M.; Nouri, A. An Investigation into Current Sand Control Testing Practices for Steam Assisted Gravity Drainage Production Wells. Eng 2021, 2, 435–453. [Google Scholar] [CrossRef]
  15. Ma, C.; Deng, J.; Dong, X.; Sun, D.; Feng, Z.; Luo, C.; Xiao, Q.; Chen, J. A new laboratory protocol to study the plugging and sand control performance of sand control screens. J. Pet. Sci. Eng. 2019, 184, 106548. [Google Scholar] [CrossRef]
  16. Fattahpour, V.; Roostaei, M.; Hosseini, S.A.; Soroush, M.; Berner, K.; Mahmoudi, M.; Al-Hadhrami, A.; Ghalambor, A. Experiments with Stand-Alone Sand-Screen Specimens for Thermal Projects. SPE Drill. Complet. 2020, 36, 188–207. [Google Scholar] [CrossRef]
  17. Cespedes, E.A.M.; Roostaei, M.; Uzcátegui, A.A.; Soroush, M.; Izadi, H.; Hosseini, S.A.; Schroeder, B.; Mahmoudi, M.; Gomez, D.M.; Mora, E.; et al. SPE-199062-MS Sand Control Optimization for Rubiales Field: Trade-Off Between Sand Control, Flow Performance and Mechanical Integrity. In Proceedings of the SPE Latin American and Caribbean Petroleum Engineering Conference, Virtual, 27–31 July 2020; p. 31. [Google Scholar]
  18. Solovyev, T. SPE-196851-MS Enhancing Efficiency of High-Viscosity Oil Development with Using Autonomous Flow Control Devices Case Study in Western Siberia. In Proceedings of the SPE Russian Petroleum Technology Conference, Moscow, Russia, 22–24 October 2019. [Google Scholar]
  19. Solovyev, T.; Ivanov, A.; Soltanov, D.; Meshkov, V.; Kamalov, A.; Nagimov, V.; Trusov, A.; Aslanyan, I.; Makarov, D. SPE-201896-MS Smart Completion Improvement in Horizontal Wells Based on Through-Barrier Diagnostics. In Proceedings of the SPE Russian Petroleum Technology Conference, Moscow, Russia, 26–29 October 2020. [Google Scholar]
  20. Tananykhin, D.; Korolev, M.; Stecyuk, I.; Grigorev, M. An Investigation into Current Sand Control Methodologies Taking into Account Geomechanical, Field and Laboratory Data Analysis. Resources 2021, 10, 125. [Google Scholar] [CrossRef]
  21. Anderson, M. SPE-185967-MS SAGD Sand Control: Large Scale Testing Result. In Proceedings of the SPE Canada Heavy Oil Technical Conference, Calgary, AL, Canada, 15–16 February 2017; pp. 15–16. [Google Scholar]
  22. O’Hara, M. Thermal Operations in the McMurray; An Approach to Sand Control. In Proceedings of the SPE Thermal Well Integrity and Design Symposium, London, UK, 23–25 November 2015. [Google Scholar] [CrossRef]
  23. McPhee, C.; Farrow, C.; McCurdy, P. Challenging Convention in Sand Control: Southern North Sea Examples. SPE Prod. Oper. 2007, 22, 223–230. [Google Scholar] [CrossRef]
  24. Ballard, T.; Beare, S.; Wigg, N. SPE-178966-MS Sand Retention Testing: Reservoir Sand or Simulated Sand-Does it Matter? In Proceedings of SPE International Conference and Exhibition on Formation Damage Control, Lafayette, LA, USA, 24–26 February 2016; p. 22. [Google Scholar]
  25. Mahmoudi, M.; Fattahpour, V.; Nouri, A.; Rasoul, S.; Yao, T.; Baudet, B.A.; Leitch, M.; Soroush, M. SPE-182517-MS Investigation Into the Use of Commercial Sands and Fines to Replicate Oil Sands for Large-Scale Sand Control Testing. In Proceedings of the SPE Thermal Well Integrity and Design Symposium, Banff, AL, Canada, 28 November–1 December 2016; pp. 1–23. [Google Scholar]
  26. Gendler, S.; Fazylov, I. Application efficiency of closed gathering system toward microclimate normalization in operating galleries in oil mines. Min. Inform. Anal. Bull. 2021, 65–78. [Google Scholar] [CrossRef]
  27. Rogachev, M.; Aleksandrov, A. Justification of a comprehensive technology for preventing the formation of asphalt-resin-paraffin deposits during the production of highlyparaffinic oil by electric submersible pumps from multiformation deposits. J. Min. Inst. 2021, 250, 596–605. [Google Scholar] [CrossRef]
  28. Chanpura, R.A.; Hodge, R.M.; Andrews, J.S.; Toffanin, E.P.; Moen, T.; Parlar, M. A Review of Screen Selection for Standalone Applications and a New Methodology. SPE Drill. Complet. 2011, 26, 84–95. [Google Scholar] [CrossRef]
  29. Hodge, R.M.; Burton, R.C.; Constien, V.; Skidmore, V. An Evaluation Method for Screen-Only and Gravel-Pack Completions. In Proceedings of the International Symposium and Exhibition on Formation Damage Control, Lafayette, LA, USA, 20–21 February 2002. [Google Scholar]
  30. Islamov, S.; Grigoriev, A.; Beloglazov, I.; Savchenkov, S.; Gudmestad, O. Research Risk Factors in Monitoring Well Drilling—A Case Study Using Machine Learning Methods. Symmetry 2021, 13, 1293. [Google Scholar] [CrossRef]
  31. Palyanitsina, A.; Safiullina, E.; Byazrov, R.; Podoprigora, D.; Alekseenko, A. Environmentally Safe Technology to Increase Efficiency of High-Viscosity Oil Production for the Objects with Advanced Water Cut. Energies 2022, 15, 753. [Google Scholar] [CrossRef]
  32. Mardashov, D.V. Development of blocking compositions with a bridging agent for oil well killing in conditions of abnormally low formation pressure and carbonate reservoir rocks. Записки Гoрнoгo института 2021, 251, 617–626. [Google Scholar] [CrossRef]
  33. Sultanbekov, R.; Islamov, S.; Mardashov, D.; Beloglazov, I.; Hemmingsen, T. Research of the Influence of Marine Residual Fuel Composition on Sedimentation Due to Incompatibility. J. Mar. Sci. Eng. 2021, 9, 1067. [Google Scholar] [CrossRef]
  34. Salahi, A.; Dehghan, A.N.; Sheikhzakariaee, S.J.; Davarpanah, A. Sand production control mechanisms during oil well production and construction. Pet. Res. 2021, 6, 361–367. [Google Scholar] [CrossRef]
  35. Yim, W.-S. Offshore Quaternary sediments and their engineering significance in Hong Kong. Eng. Geol. 1994, 37, 31–50. [Google Scholar] [CrossRef]
  36. Zhenzhen, W.; Shanyu, Z.; Xiaodong, D.; Xuewu, W.; Yapanto, L.M.; Raupov, I.R. Multi-criteria decision making approaches to select appropriate enhanced oil recovery techniques in petroleum industries. Energy Rep. 2021, 7, 2751–2758. [Google Scholar] [CrossRef]
  37. Sheng, J. Critical review of low-salinity waterflooding. J. Pet. Sci. Eng. 2014, 120, 216–224. [Google Scholar] [CrossRef]
  38. Valdya, R.N.; Fogler, H.S. Fines Migration and Formation Damage: Influence of pH and Ion Exchange. SPE Prod. Eng. 1992, 7, 325–330. [Google Scholar]
  39. Soroush, M.; Roostaei, M.; Mohammadtabar, M.; Hosseini, S.A.; Mahmoudi, M.; Sadrzadeh, M.; Ghalambor, A.; Fattahpour, V. SPE-201315-MS Design for Reliability: Purpose Driven Sand Control Methods for Cased and Perforated Wells. In Proceedings of the SPE Annual Technical Conference and Exhibition, Virtual, 26–29 October 2020; p. 29. [Google Scholar]
  40. Adams, P.R.; Davis, E.R.; Hodge, R.M.; Burton, R.C.; Ledlow, L.; Procyk, A.D.; Crissman, S.C. Current State of the Premium Screen Industry: Buyer Beware, Methodical Testing and Qualification Shows You Don’t Always Get What You Paid For. SPE Drill. Completion 2009, 24, 362–372. [Google Scholar] [CrossRef]
  41. Kozhagulova, A.; Shabdirova, A.; Minh, N.H.; Zhao, Y. An integrated laboratory experiment of realistic diagenesis, perforation and sand production using a large artificial sandstone specimen. J. Rock Mech. Geotech. Eng. 2020, 13, 154–166. [Google Scholar] [CrossRef]
  42. Ben Mahmud, H.; Leong, V.H.; Lestariono, Y. Sand production: A smart control framework for risk mitigation. Petroleum 2020, 6, 1–13. [Google Scholar] [CrossRef]
  43. Ikporo, B.; Sylvester, O. Effect of Sand invasion on Oil Well Production: A case study of Garon Field in the Niger Delta. Int. J. Eng. Sci. (IJES) 2015, 4, 64–72. [Google Scholar] [CrossRef]
  44. Palyanitsina, A.; Tananykhin, D.; Masoud, R. Strategy of water-flooding enhancement for low-permeable polymictic reservoirs. J. Appl. Eng. Sci. 2021, 19, 307–317. [Google Scholar] [CrossRef]
  45. Aroyehun, M.E. SPE-193526-MS Comparative Study of Sand Control Methods in Selected Niger-Delta Sand Stone Reservoirs. In Proceedings of the SPE Nigeria Annual International Conference and Exhibition, Lagos, Nigeria, 1–3 August 2018. [Google Scholar]
Figure 1. Left part—Snapshot of core rock (a)—weakly consolidated highly permeable sandstone of “channel” facies, (b)—interbedding of heterogeneous argillaceous sandstone of the “floodland” facies), Right part represents sedimentary environment [18].
Energies 15 04657 g001
Figure 2. Geological profile of the reservoir (depth 950–1100 m) [19].
Energies 15 04657 g002
Figure 3. Sand obtained during well flushing in the workover process.
Energies 15 04657 g003
Figure 4. General scheme of the facility [20].
Energies 15 04657 g004
Figure 5. Reservoir particle size distribution curve: (A)—larger PSD, (B)—finer PSD.
Energies 15 04657 g005aEnergies 15 04657 g005b
Figure 6. Bulk reservoir model with the preinstalled screen coupon (wire-wrapped screen (WWS) 200 µm).
Energies 15 04657 g006
Figure 7. Coreholder scheme.
Energies 15 04657 g007
Figure 8. Combined graph for phase distribution and drawdown pressure effect on stabilization rate for PSD A.
Energies 15 04657 g008
Figure 9. Stabilization rate between stages (ac) and combined graph for phase distributions and its effect on stabilization (d) for PSD B.
Energies 15 04657 g009aEnergies 15 04657 g009b
Figure 10. Suspended solids concentration for different particle size distributions, screen apertures, and flow compositions ((a)—PSD A gradP1, (b)—PSD A gradP2 (4 times higher than gradP1), (c)—PSD B gradP2).
Energies 15 04657 g010
Figure 11. Relative change in suspended solids concentration due to increased drawdown pressure between the tests.
Energies 15 04657 g011
Figure 12. Difference between trends for increasing suspended solids concentration.
Energies 15 04657 g012
Table 1. Generalized results of filtration tests on bulk with different content of phases in the flow for PSD A (larger)—Suspended solids concentration is presented in grams/liters.
Screen ApertureDrawdown Pressure“Oil”“Oil”/Brine“Oil”/Gas
µm-100%90/1050/5030/7070/3050/5010/90
100gradP1 4.36.57.9
150 6.75.34.4
2008.510.811.514.57.35.64.4
50011.978.487336.6422
70018.2 180430
100gradP2191114.416.6
150 1411.97.4
20029.615.418.521.718.313.89.1
50034268.4
700733
Table 2. Generalized results of filtration tests on bulk with different content of phases in the flow for PSD B (finer)—Suspended solids concentration is presented in grams/liters.
Screen ApertureDrawdown Pressure“Oil”“Oil”/Brine“Oil”/Gas
µm-100%90/1050/5030/7070/3050/5010/90
75gradP23.233.503.774.013.172.803.29
1004.755.807.117.564.604.975.10
1507.417.929.0911.187.457.617.79
20010.9217.1615.0712.839.6510.8613.17
Table 3. Permeability change for PSD A during experiments. The number in the table is % of initial permeability of the system. Dash indicates no value (was not able to evaluate).
Screen Aperture SizeDrawdown Pressure“Oil”“Oil”/Water“Oil”/Gas
µm-1003/75/59/13/75/51/9
100gradP1-958794---
150gradP1----969699
200gradP187939897989499
100gradP294876992---
150gradP2----989298
200gradP298827897989695
Publisher’s Note: MDPI stays neutral with regard to jurisdictional claims in published maps and institutional affiliations.

