
Lithium Battery Model and Its Application to Parallel Charging

 , ,
, ,  , and
, and 
Abstract
:1. Introduction
2. Battery Charger
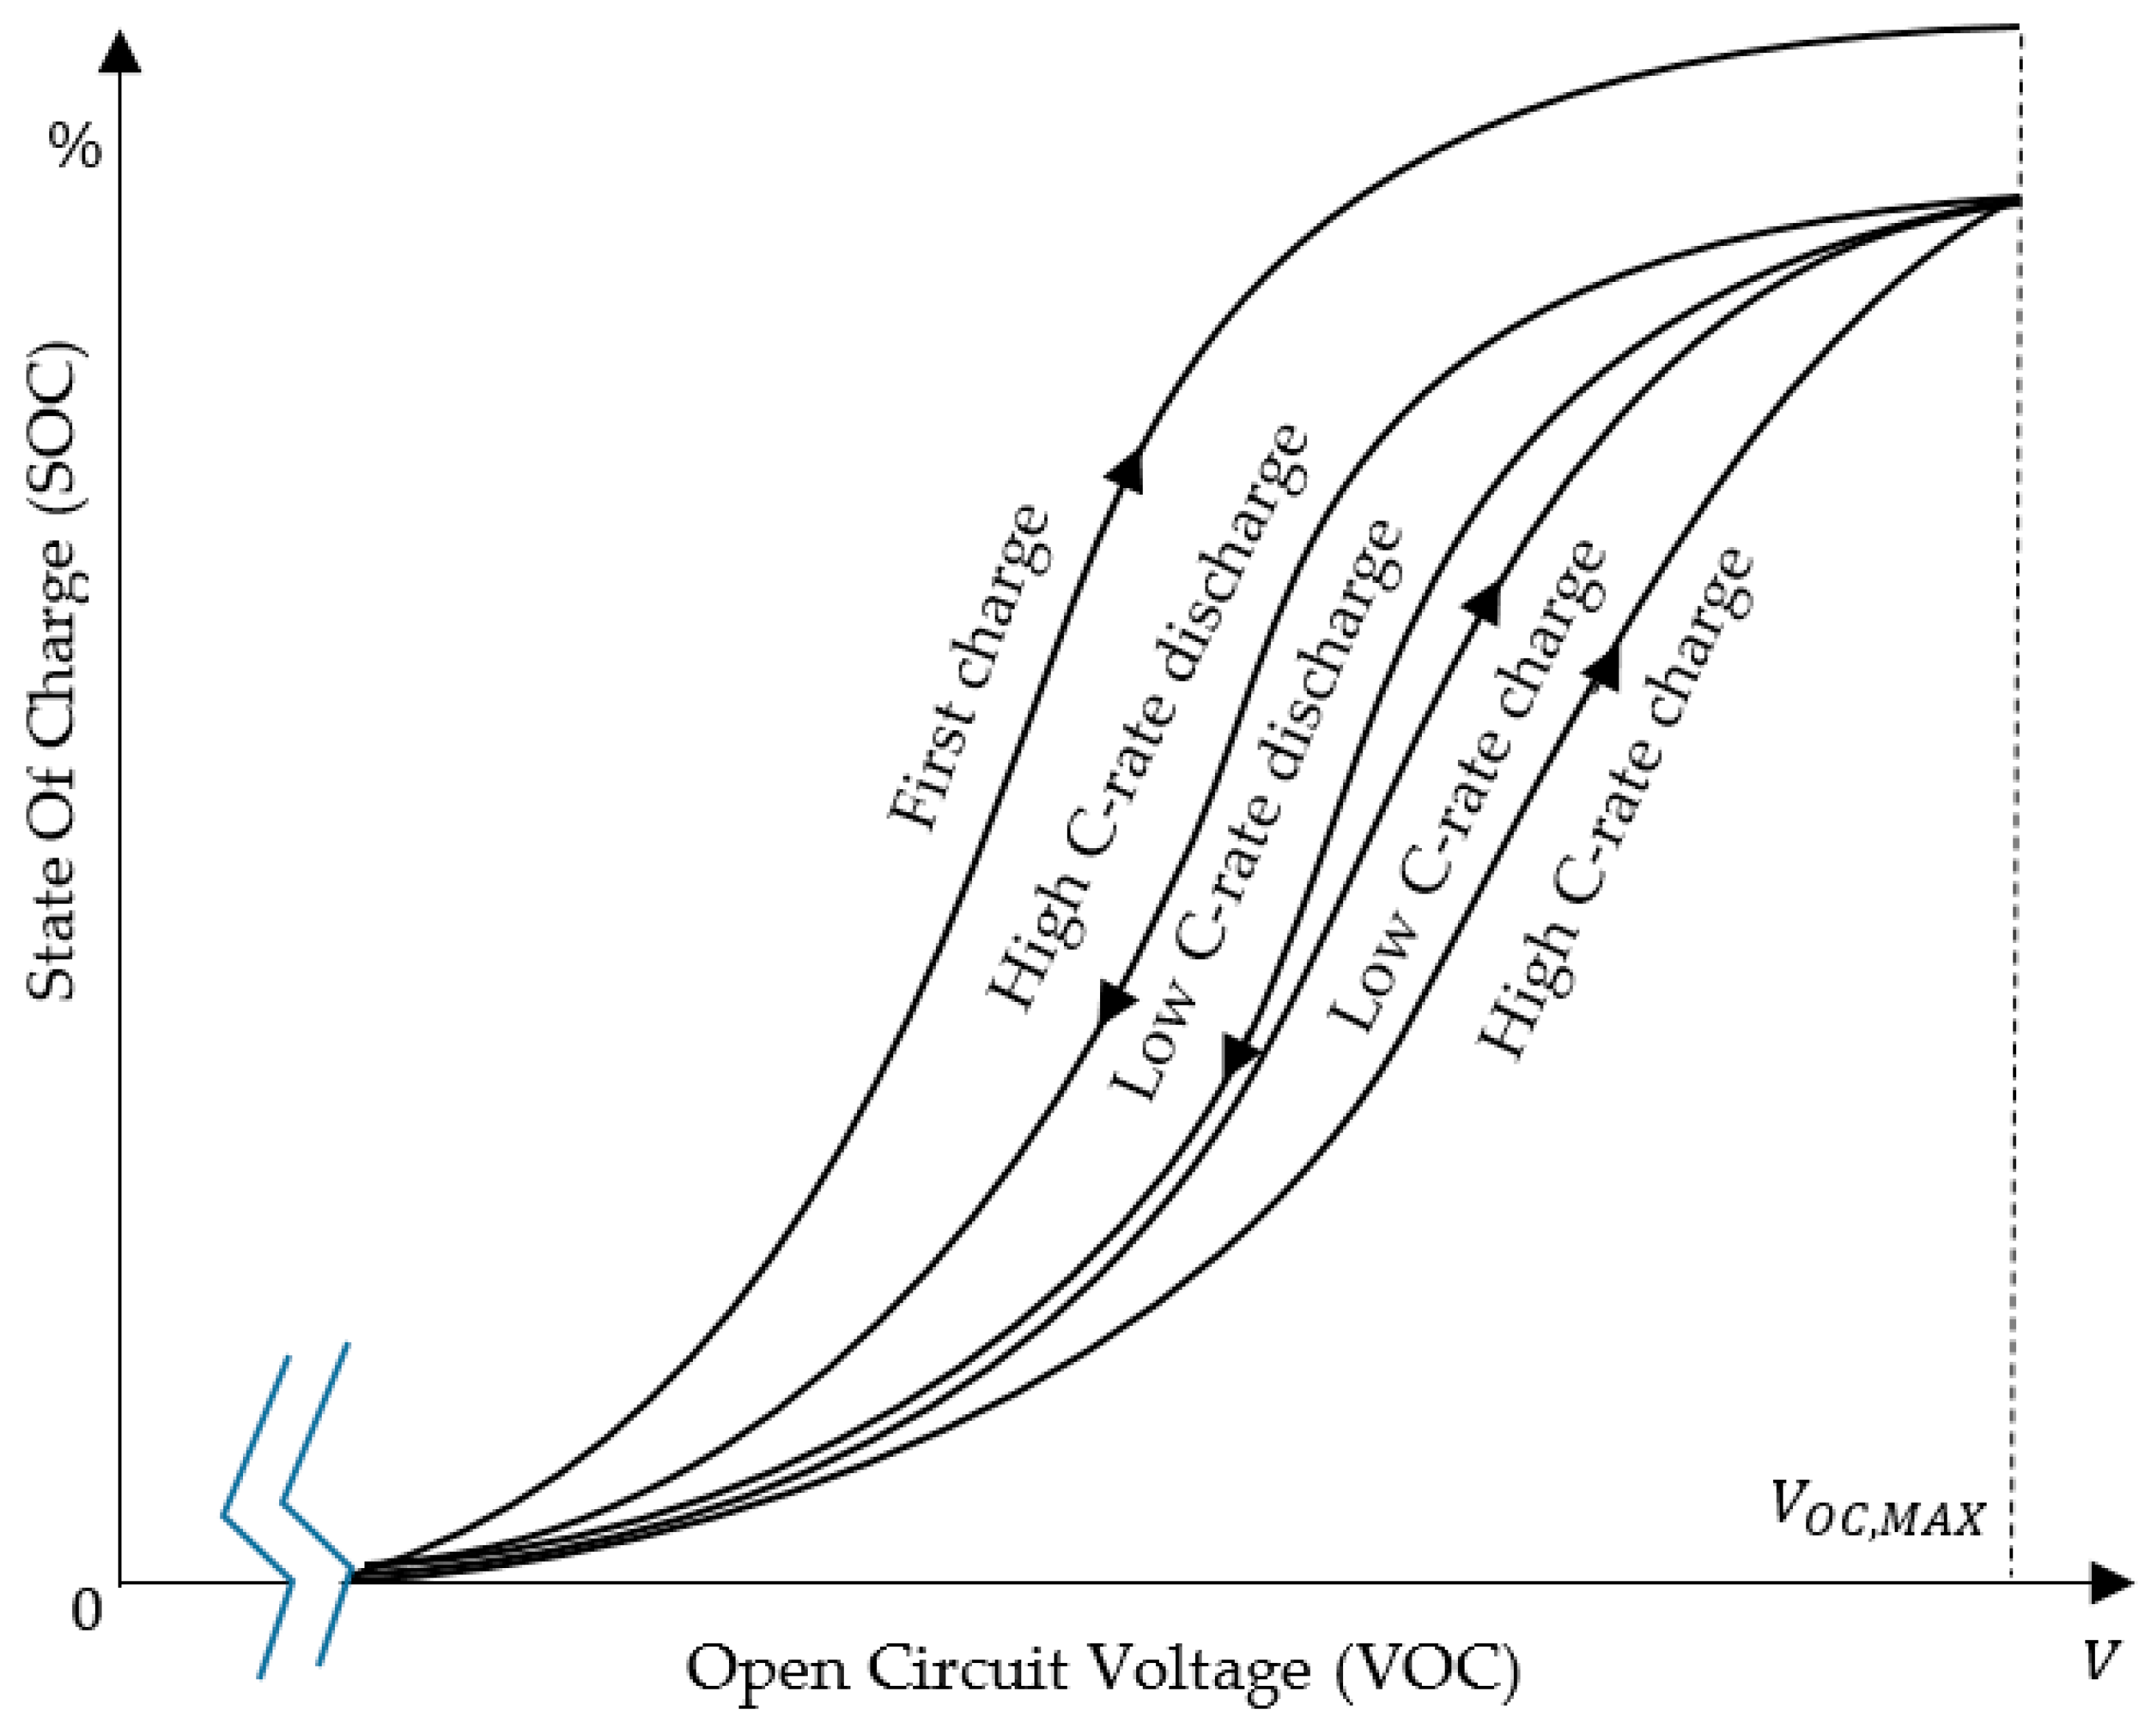
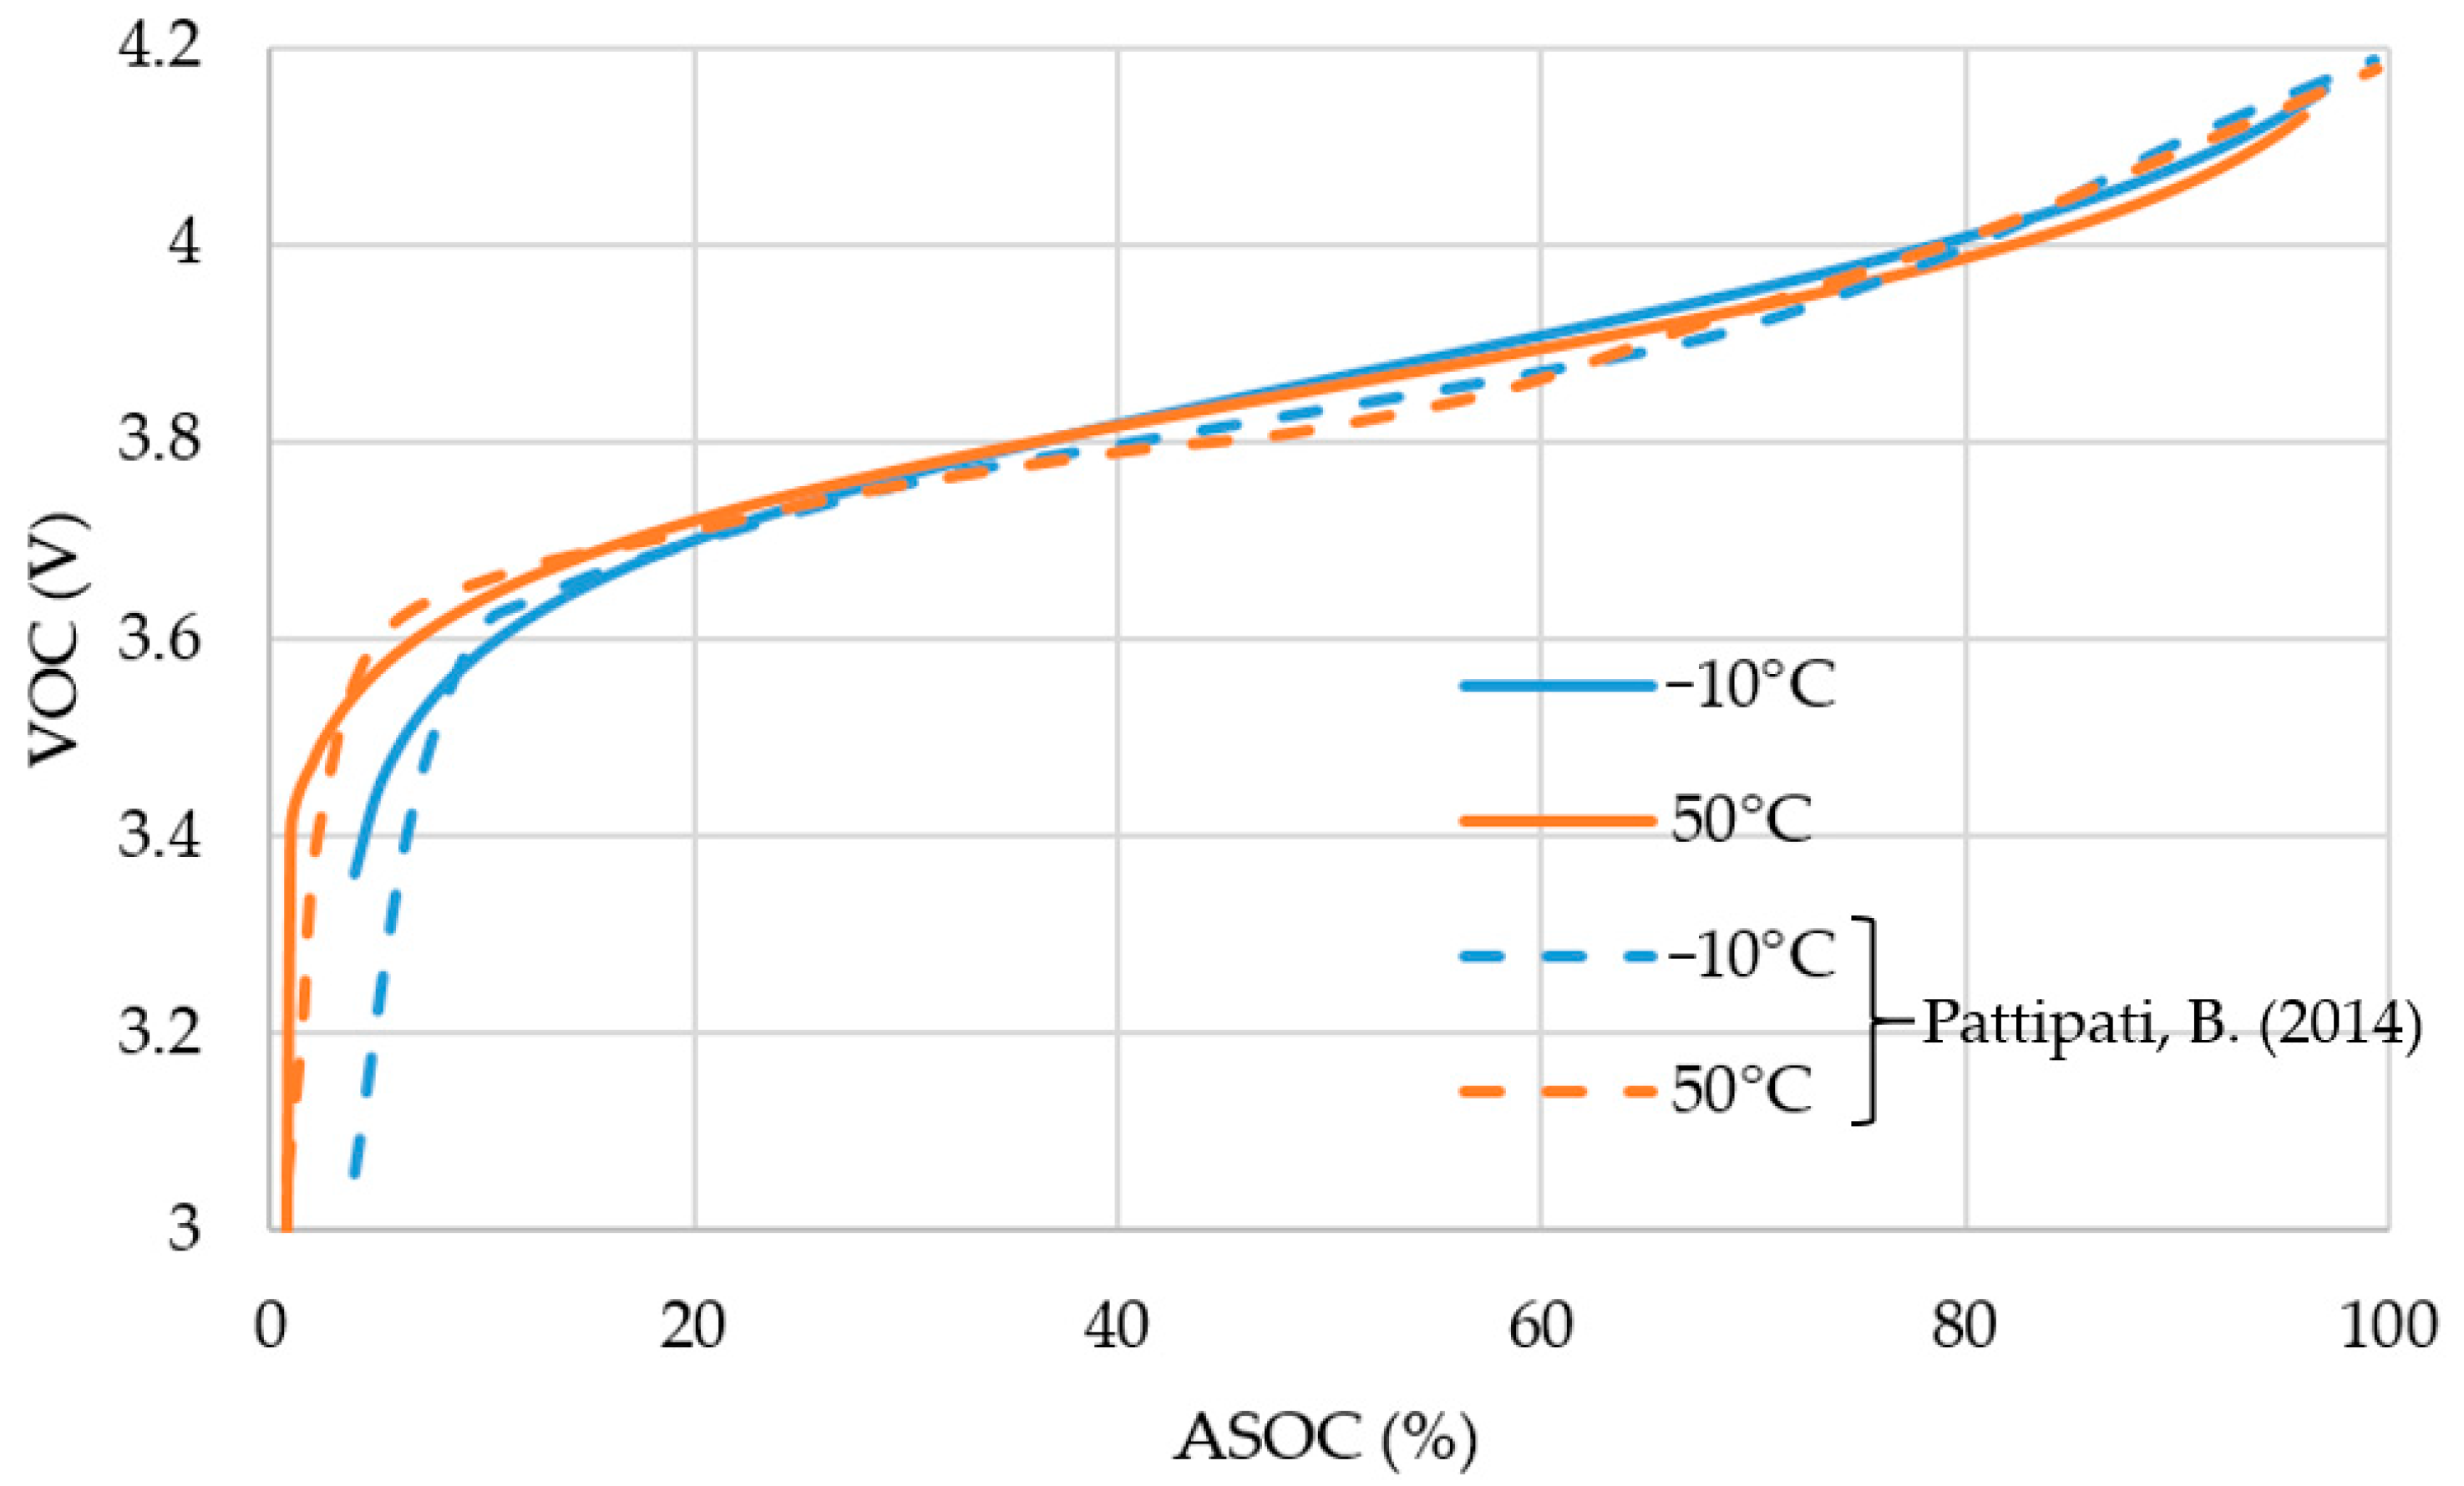
2.1. Battery Characteristics
2.2. Battery Management System
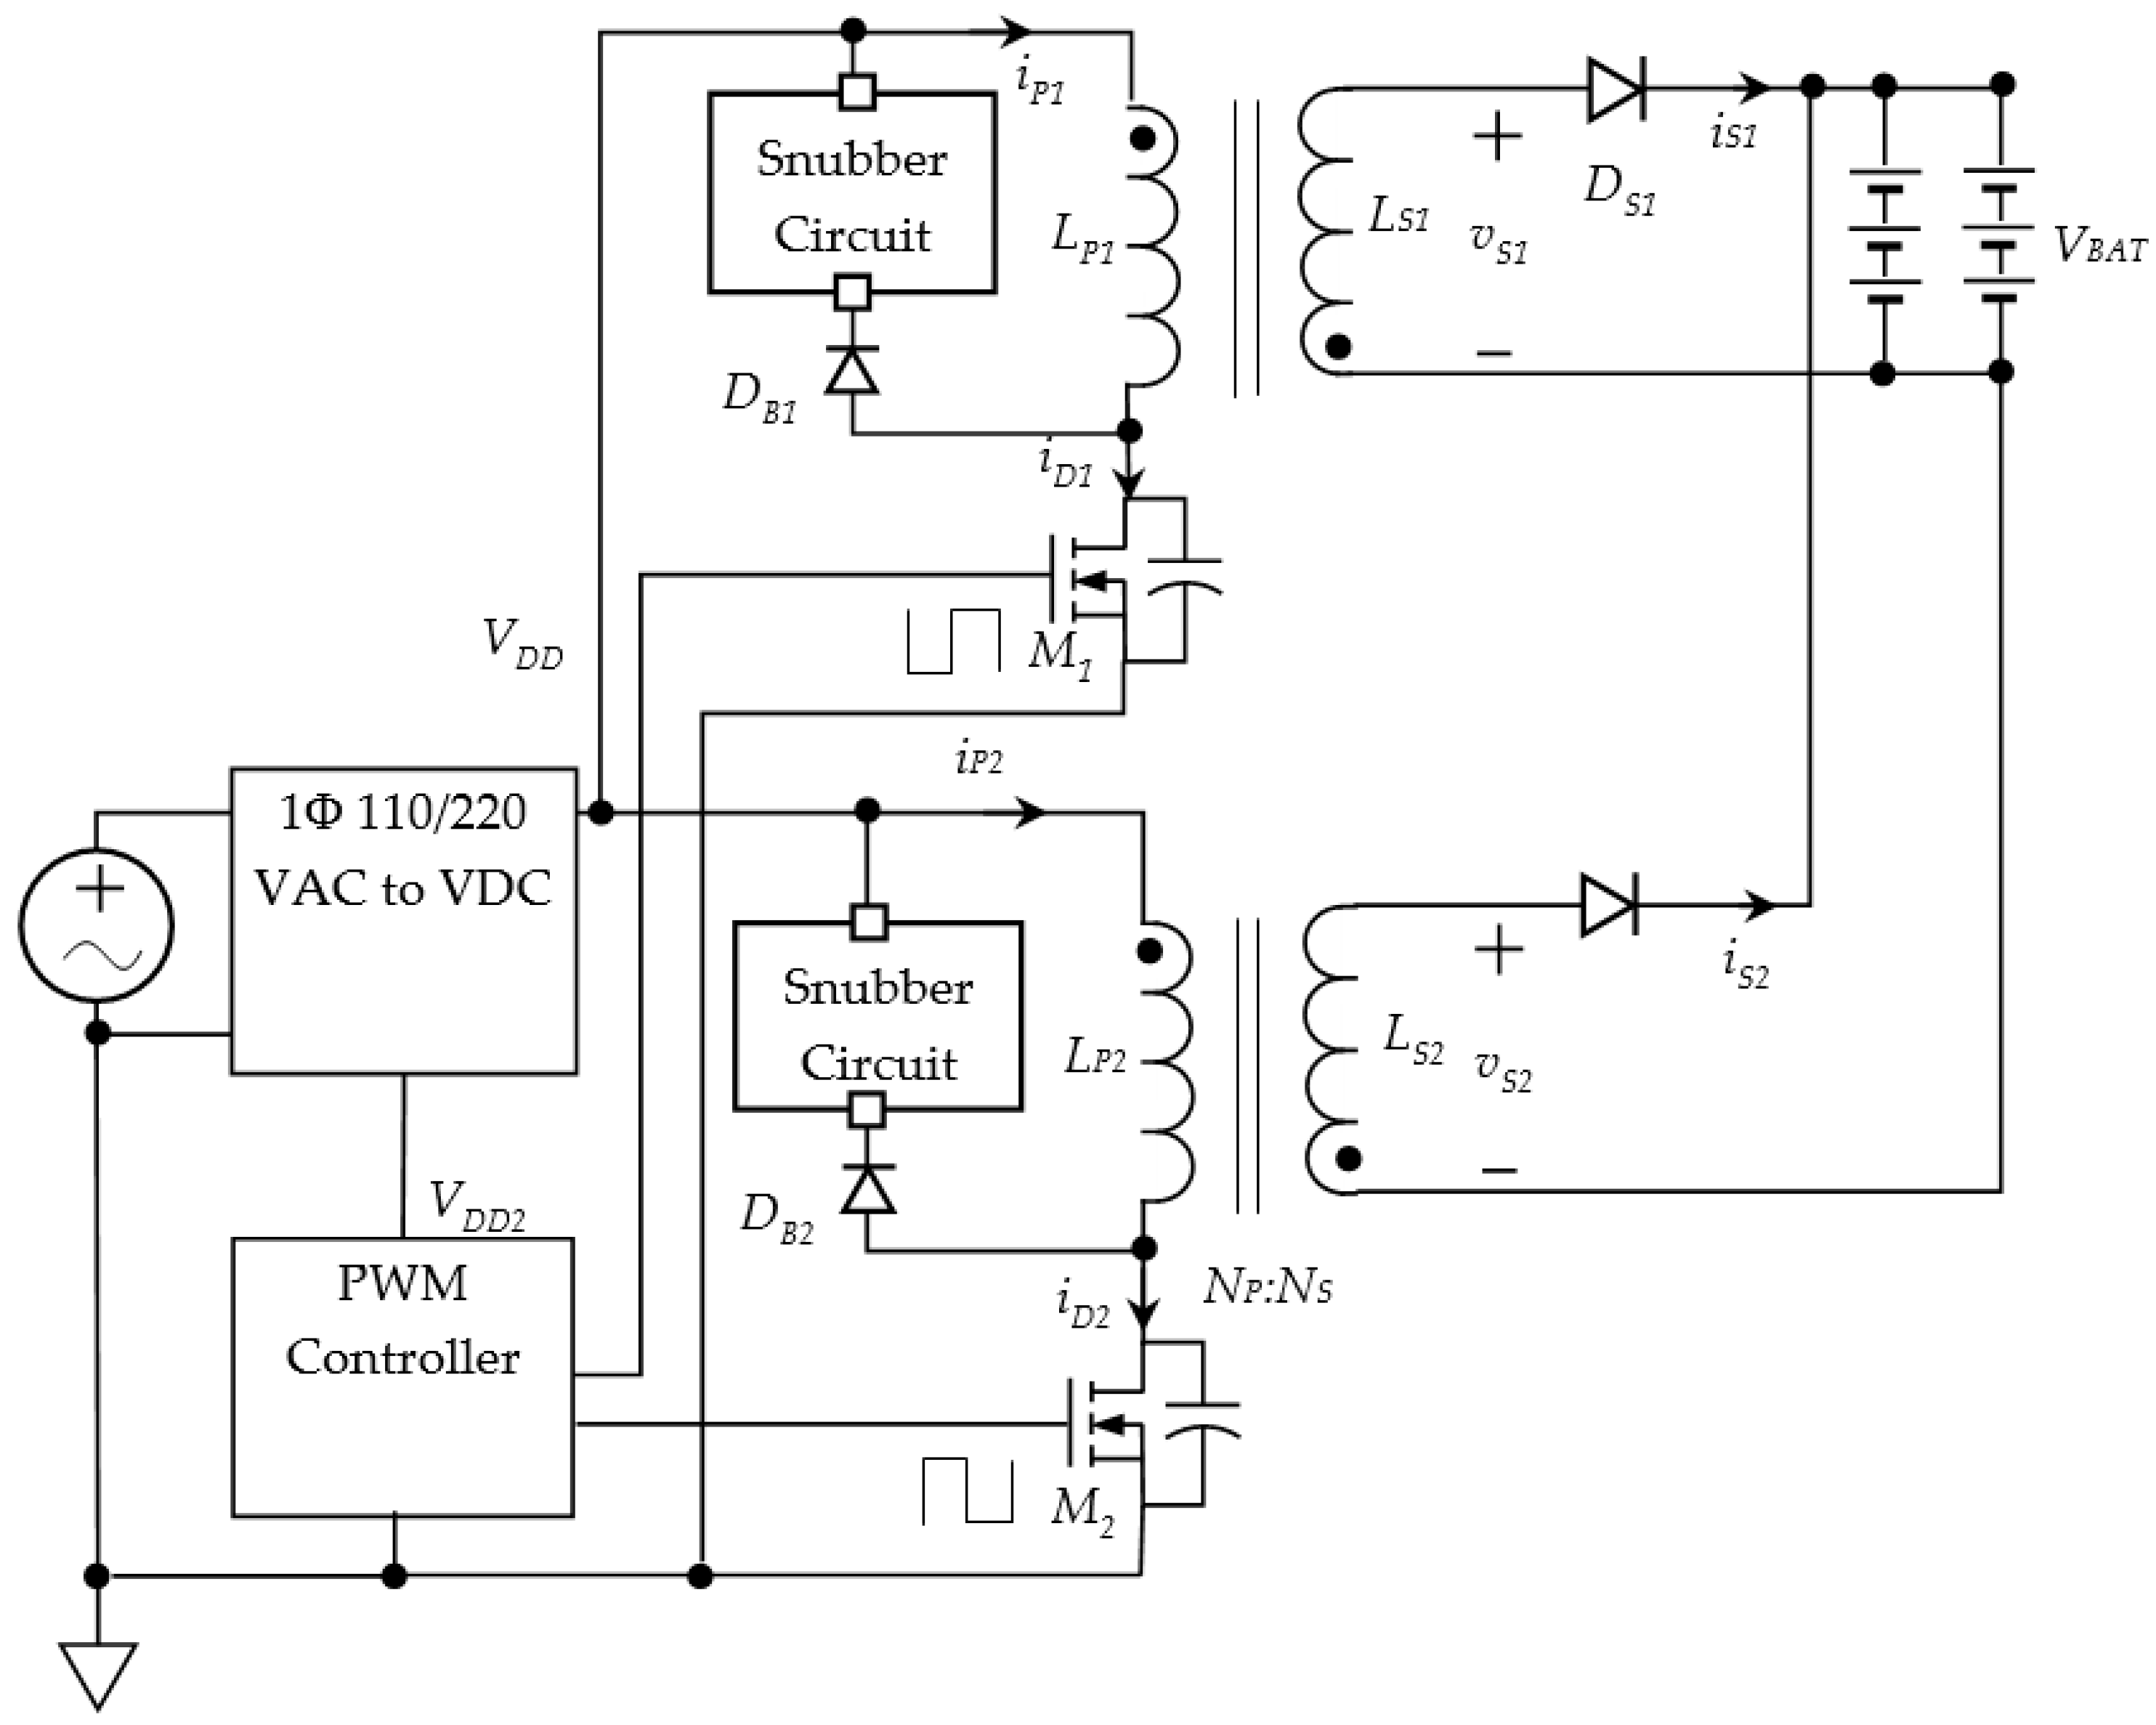
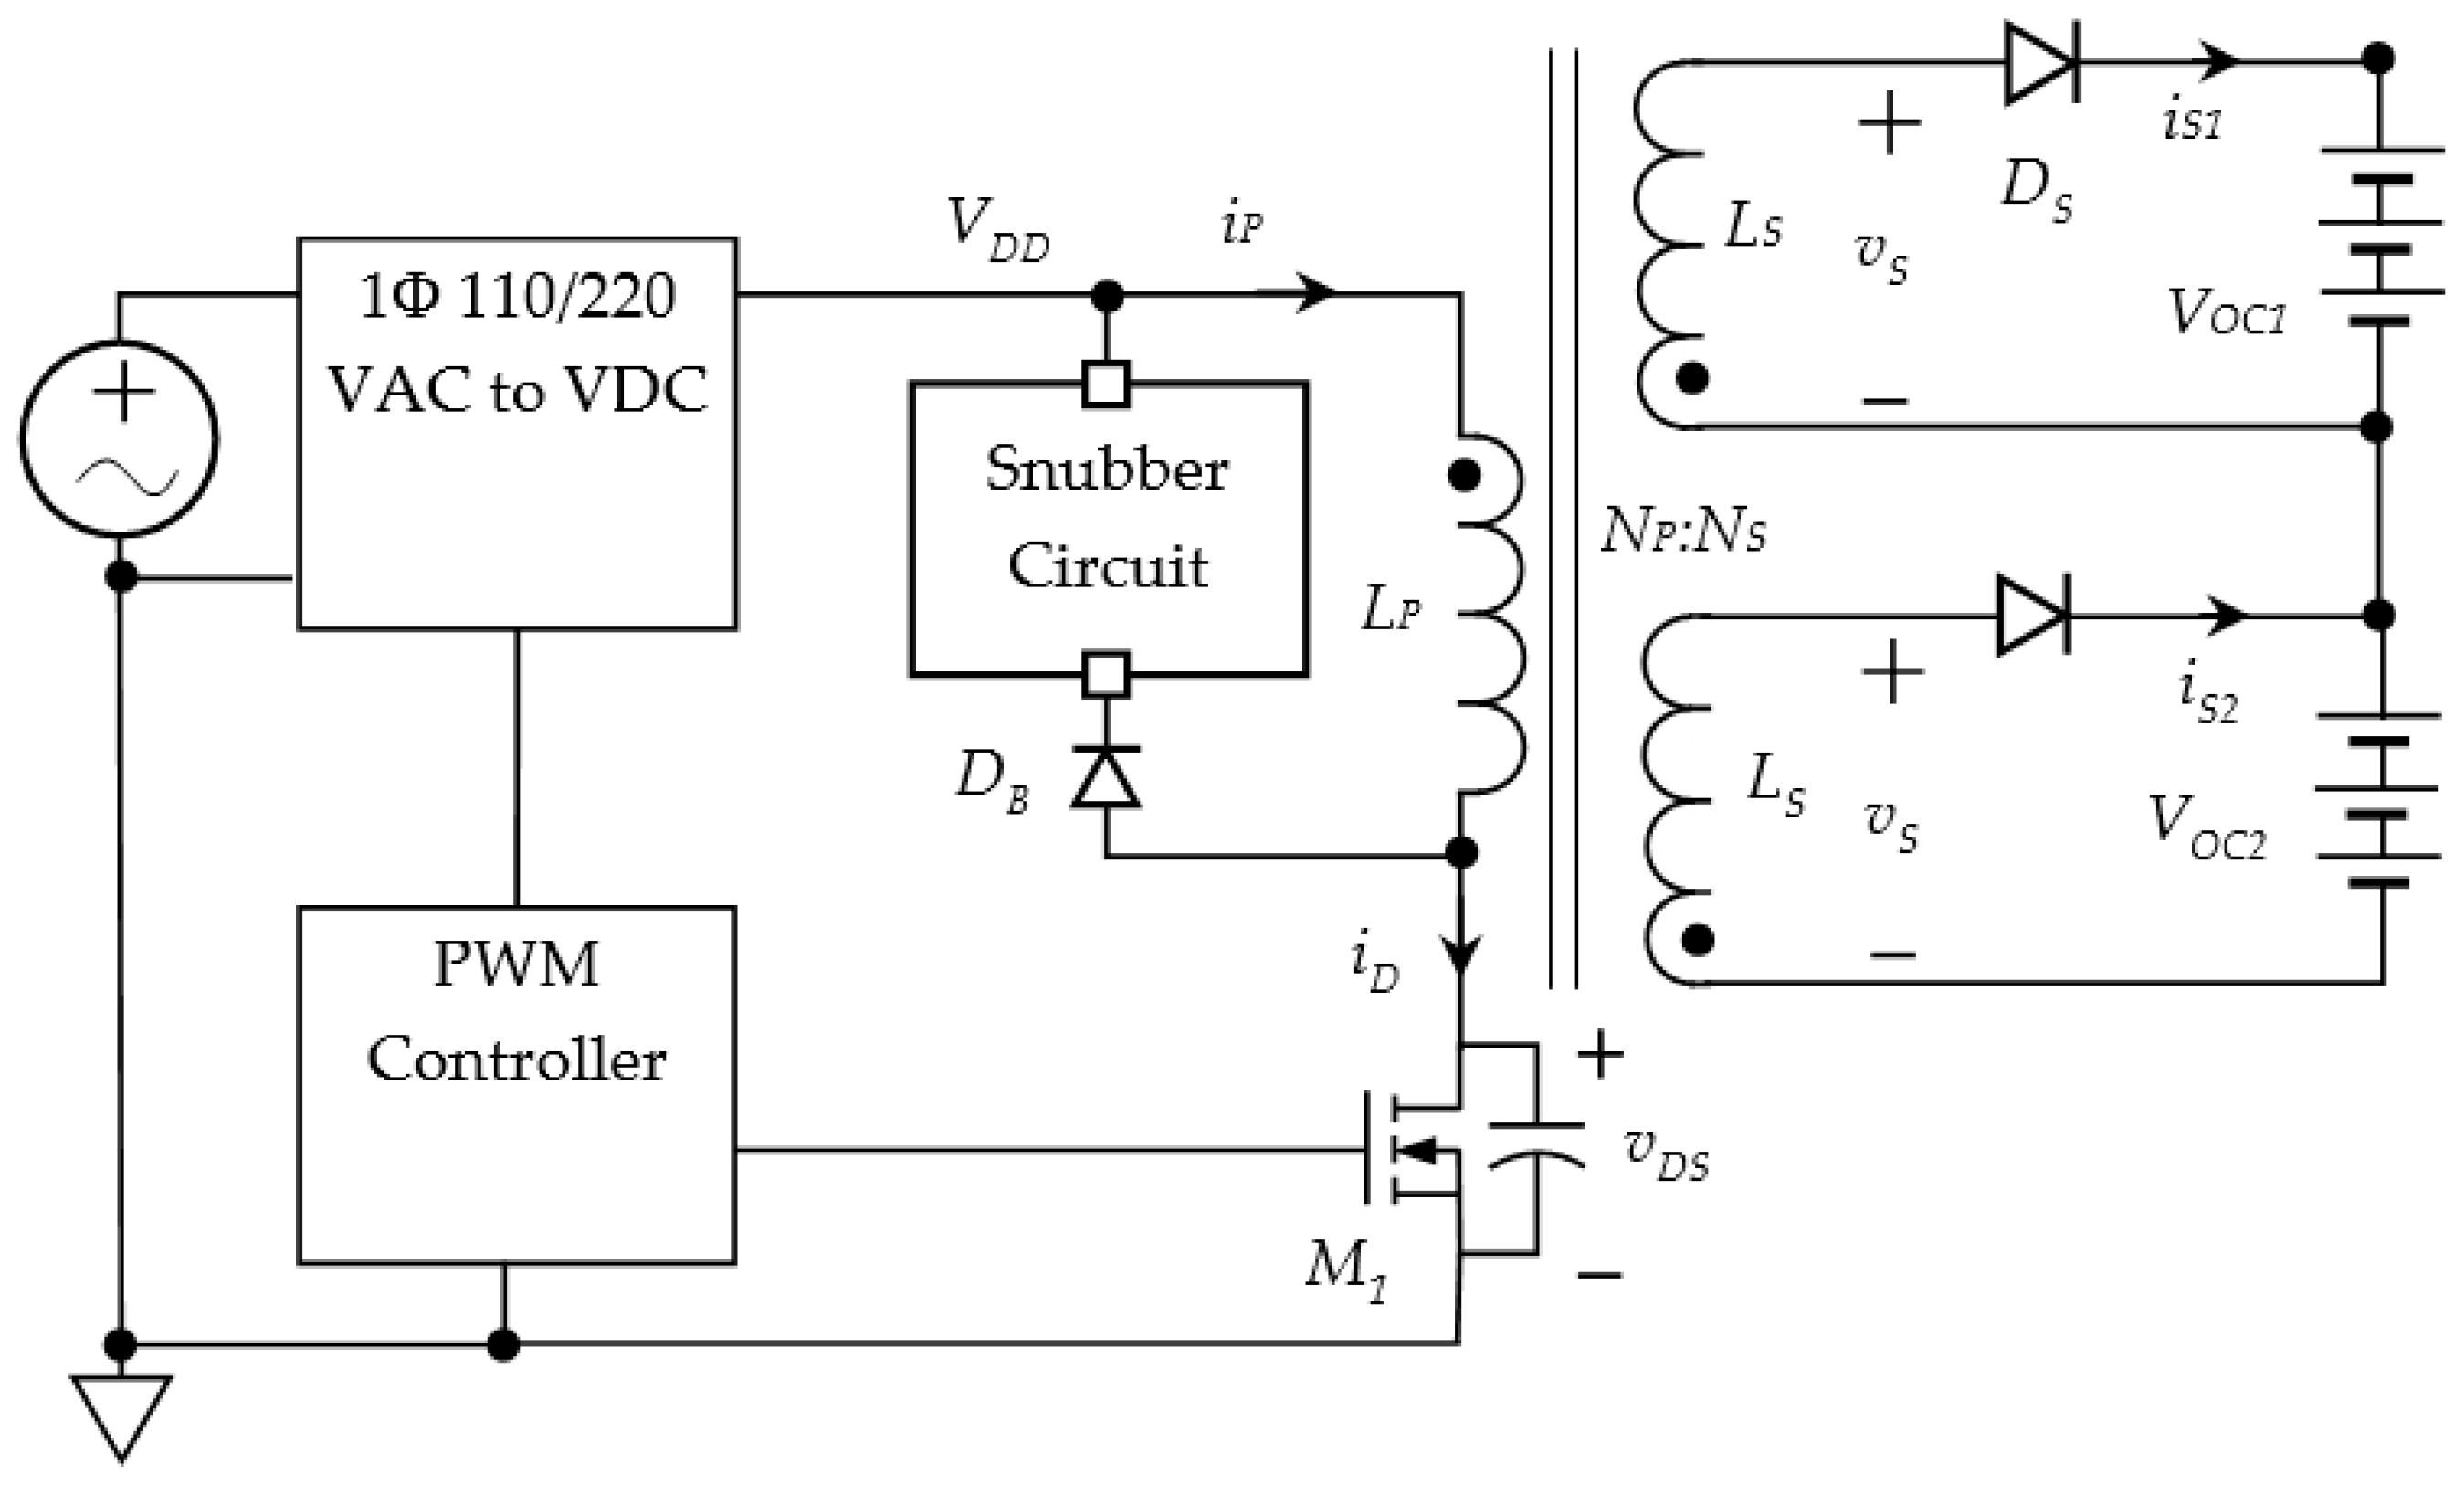
2.3. Interleaved Flyback Converter for Battery Charging
2.4. Multi-Winding Flyback Converter for Battery Charging
3. Battery Charging Model
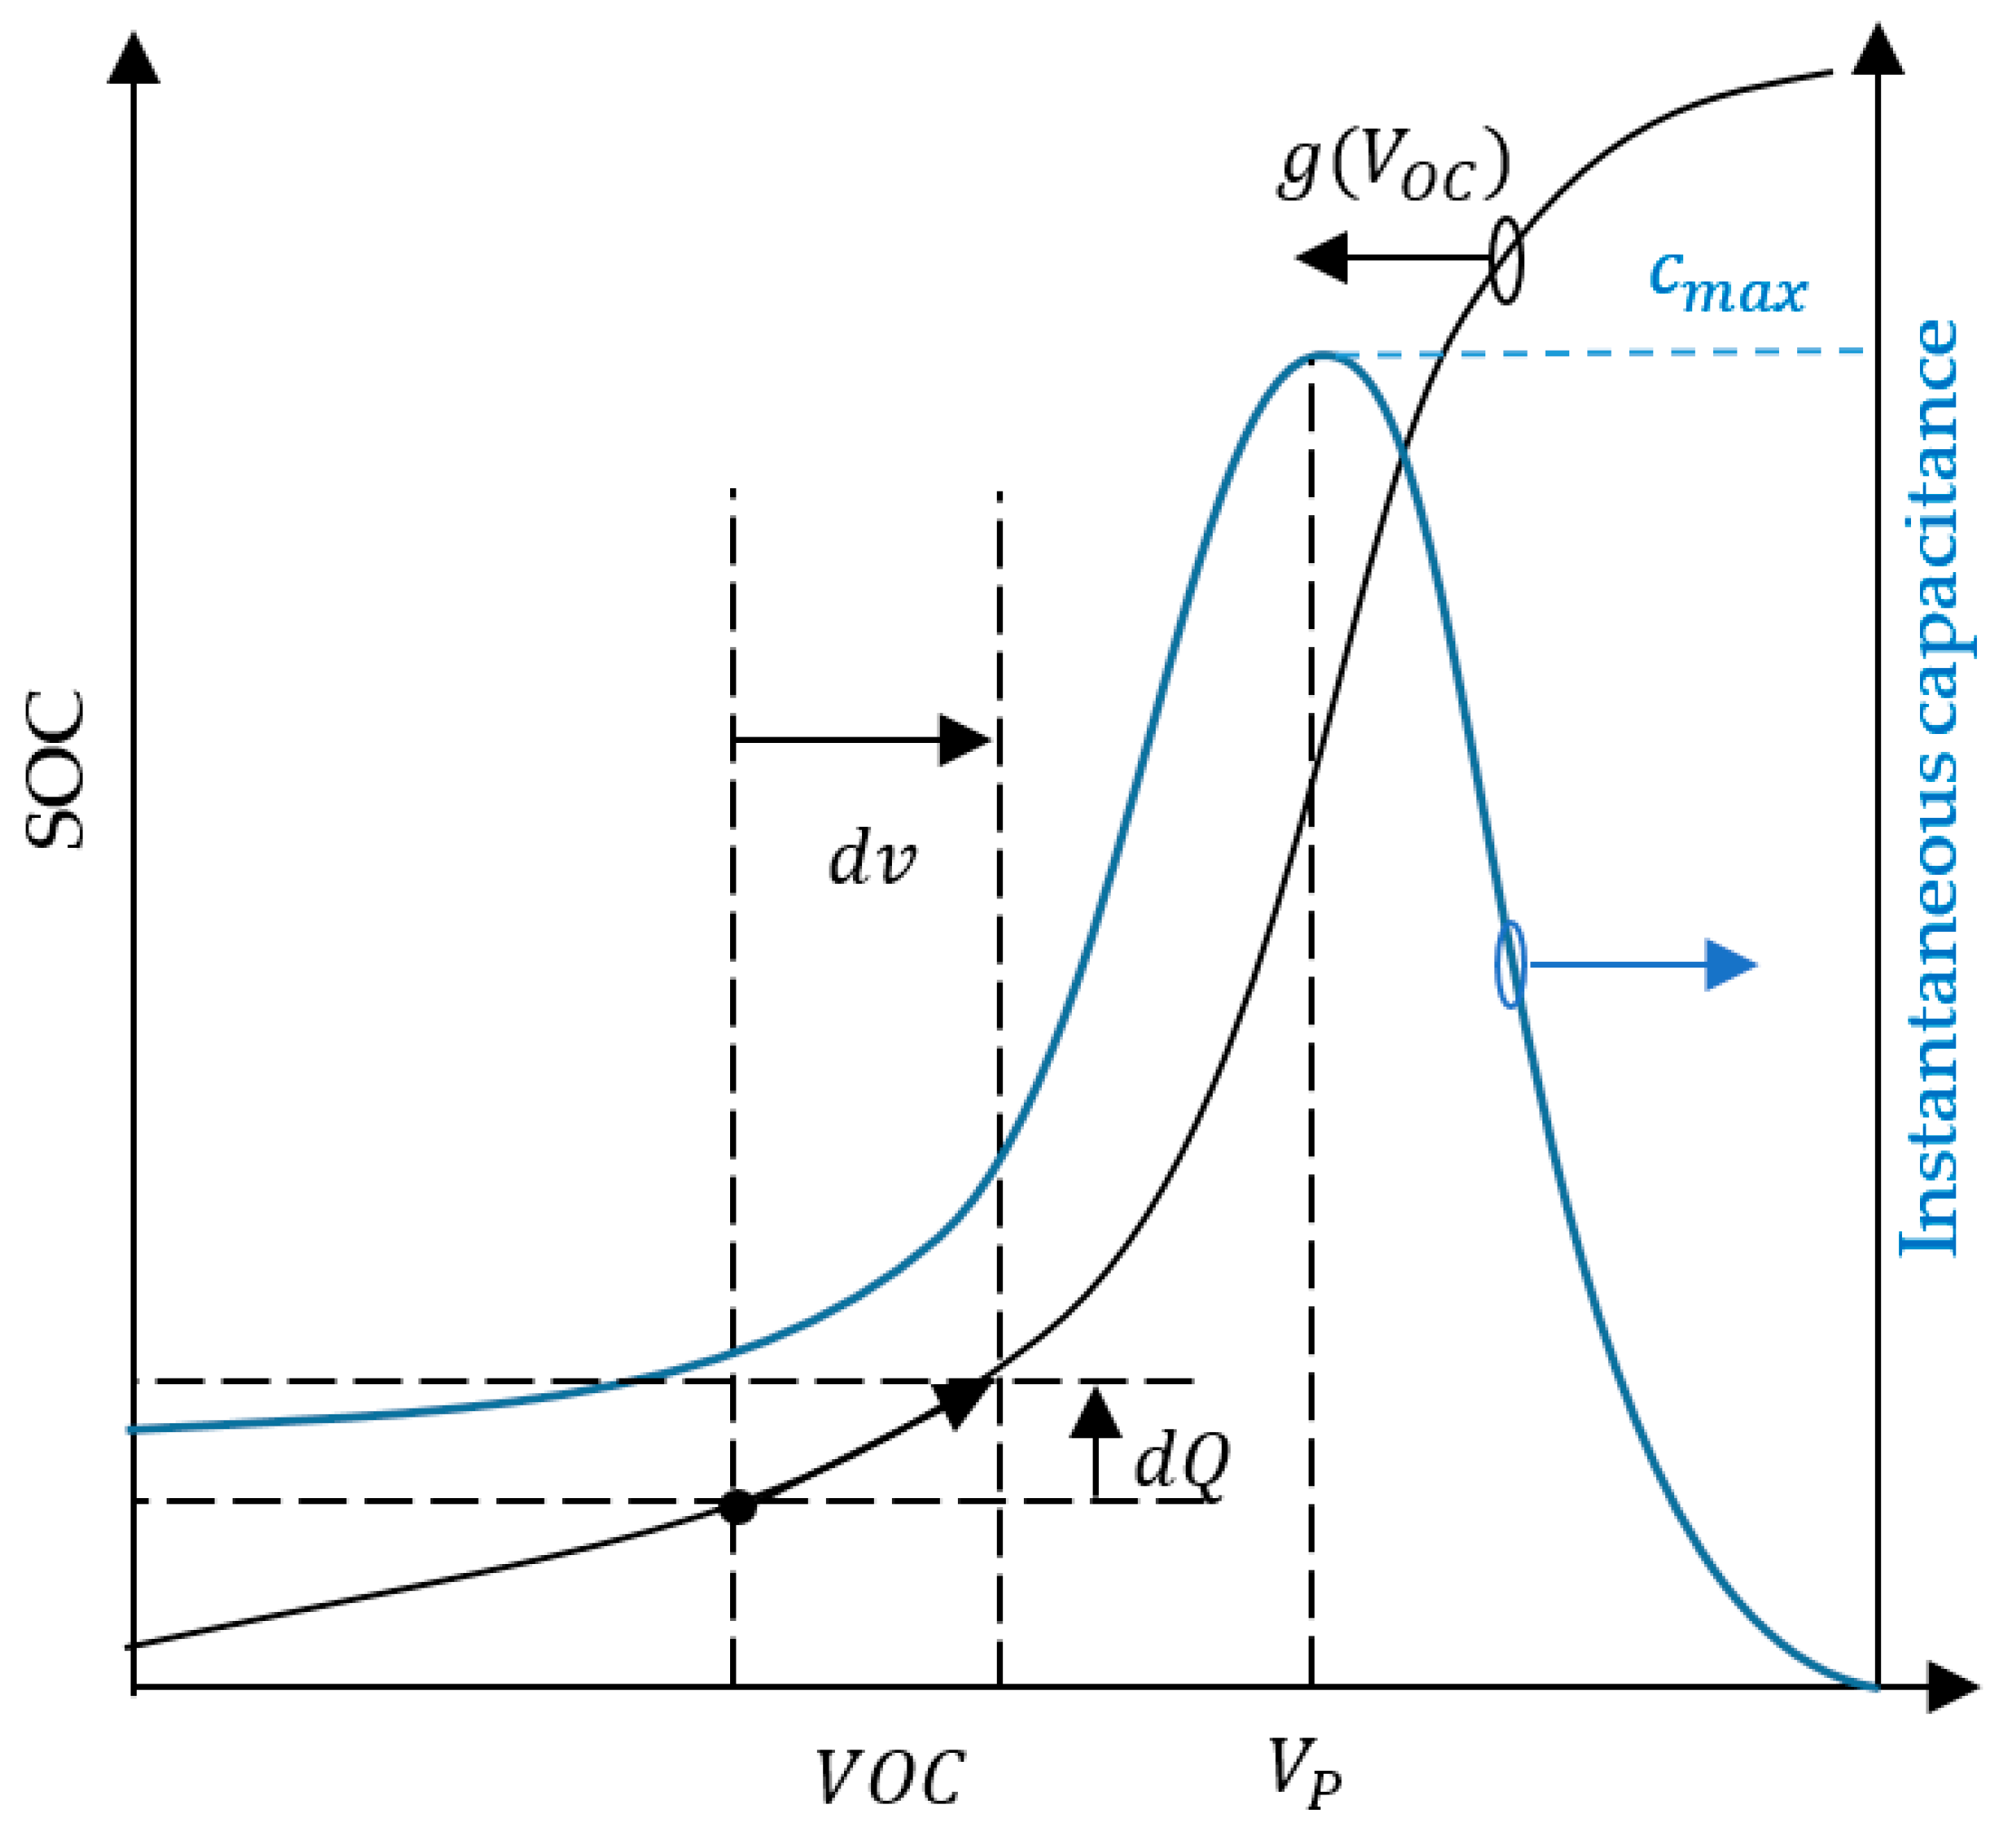
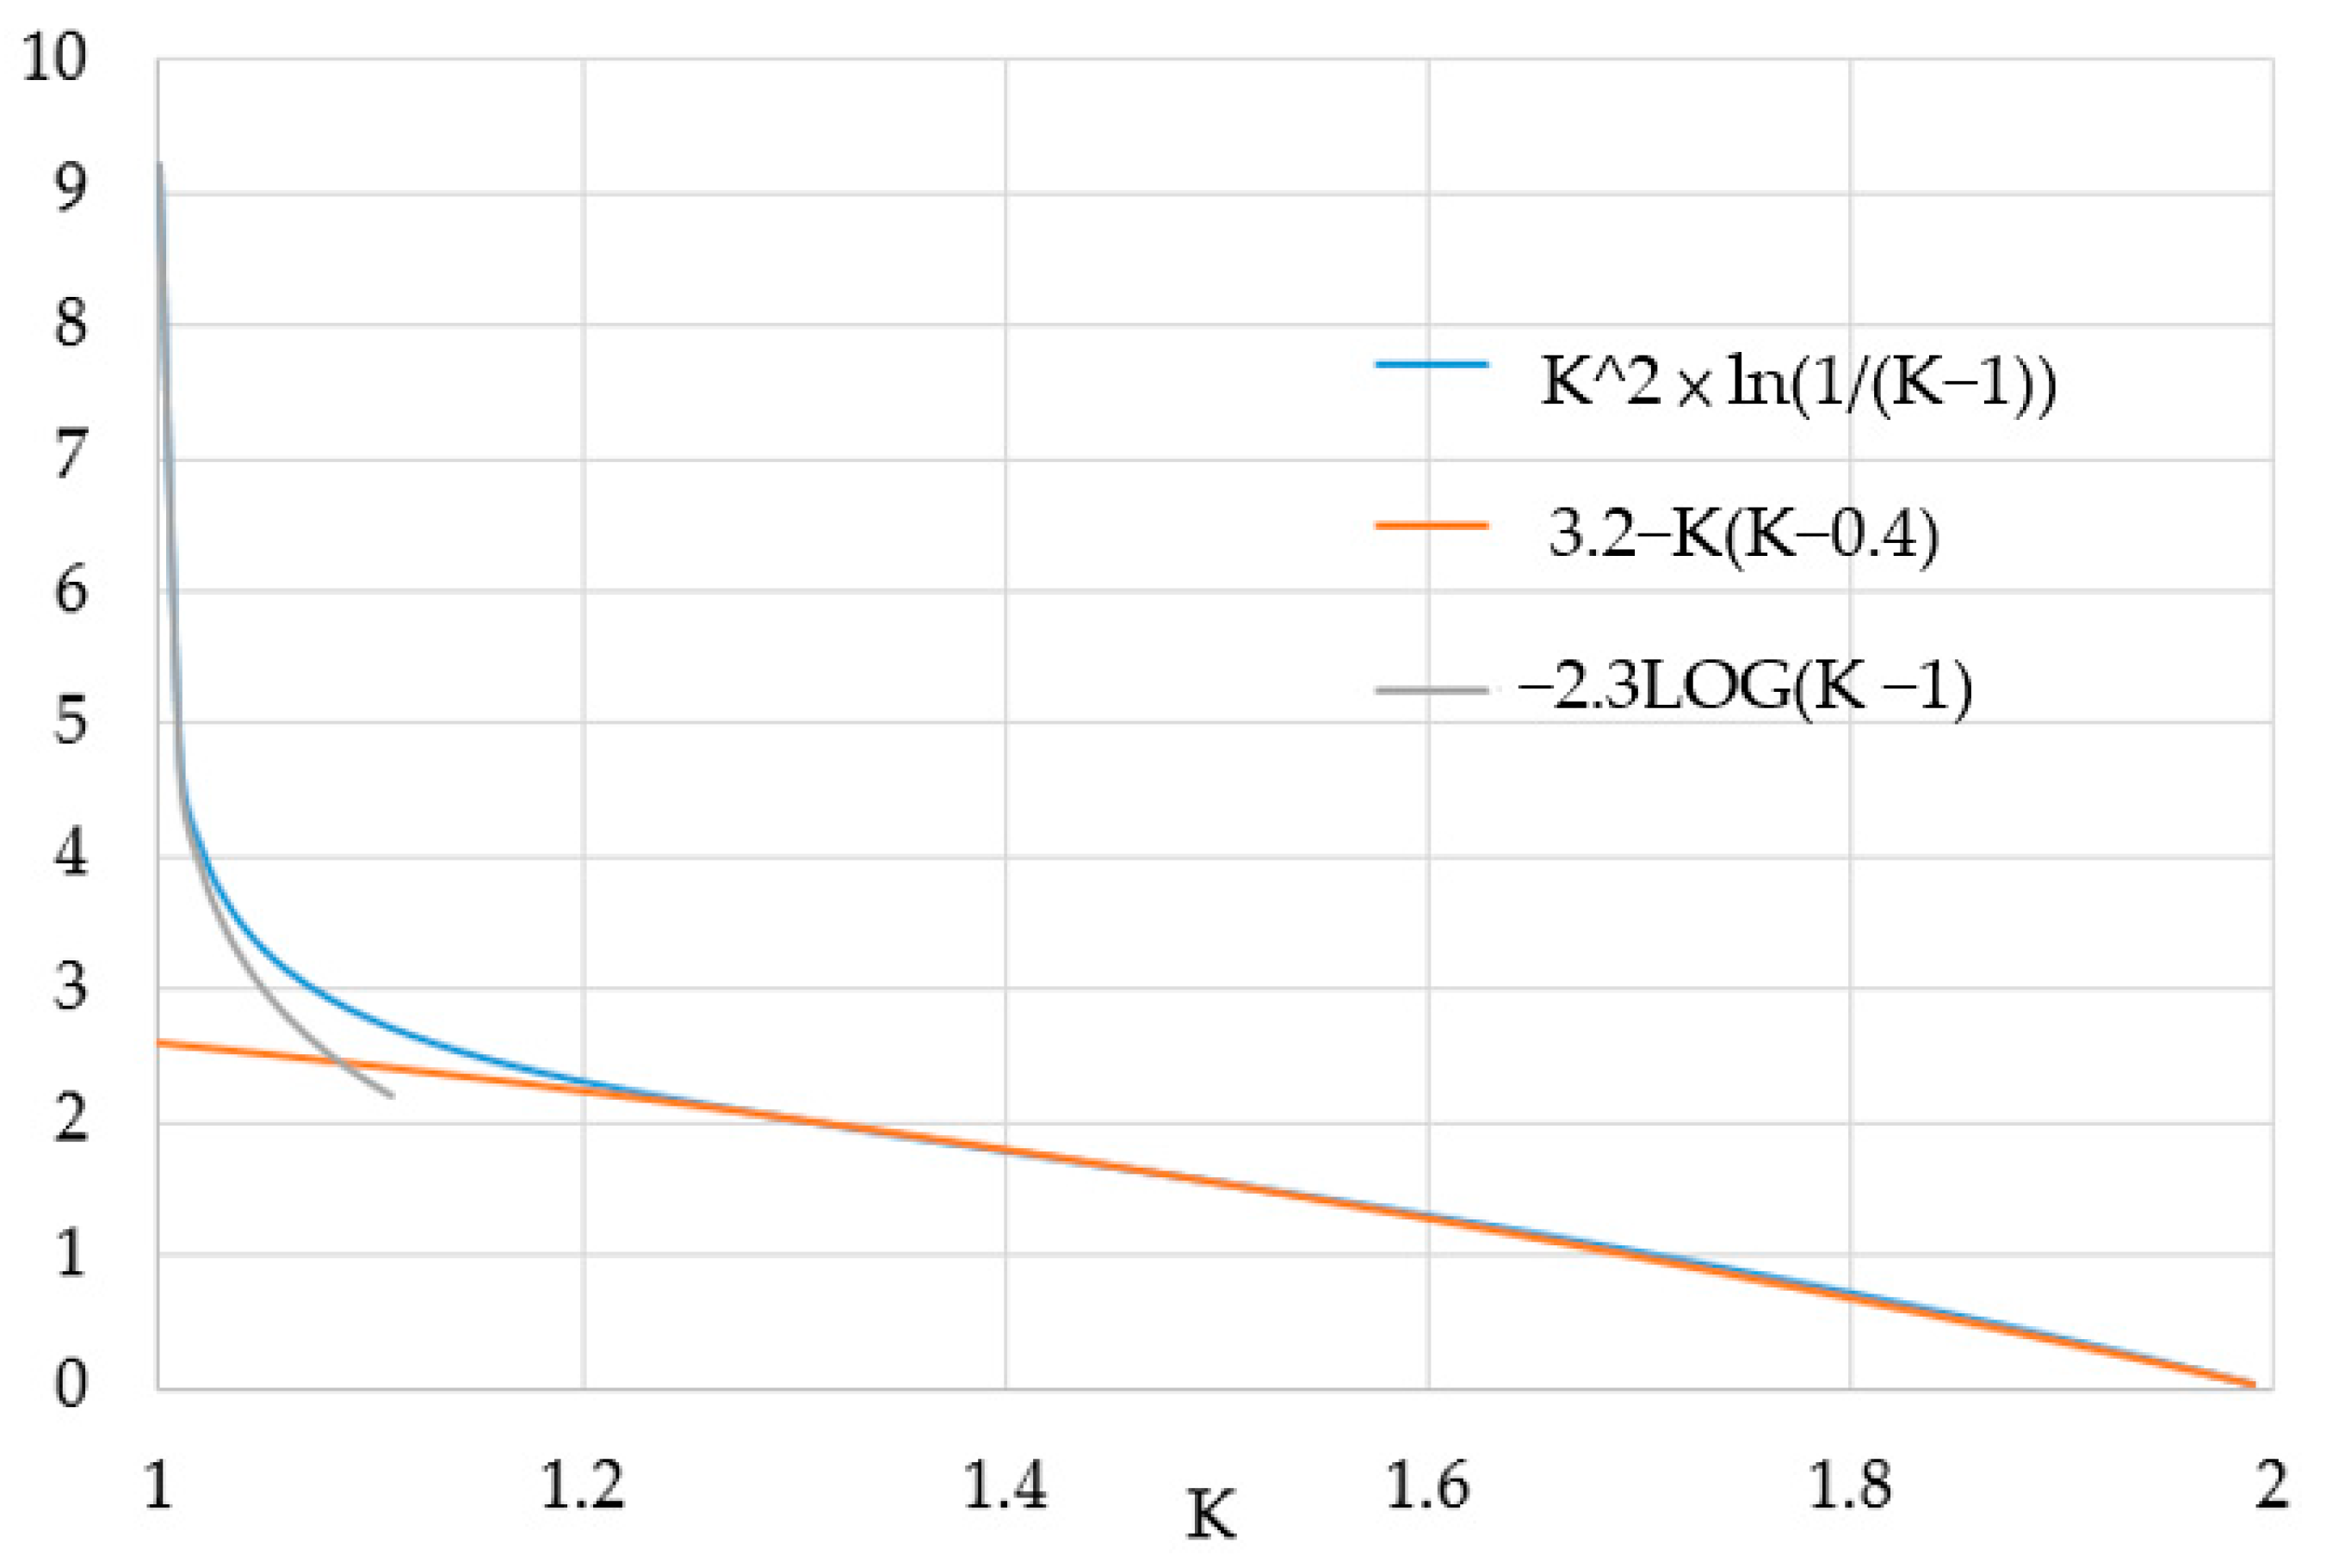
3.1. Shifted Sigmoid SOC–VOC Model
3.2. SOC Model Fitting
3.2.1. LiFePO4 Battery
3.2.2. EV Type-1 Battery
3.3. Constant Current Charging
3.4. Charging Parallel Connected Batteries
4. Simulation and Experiments
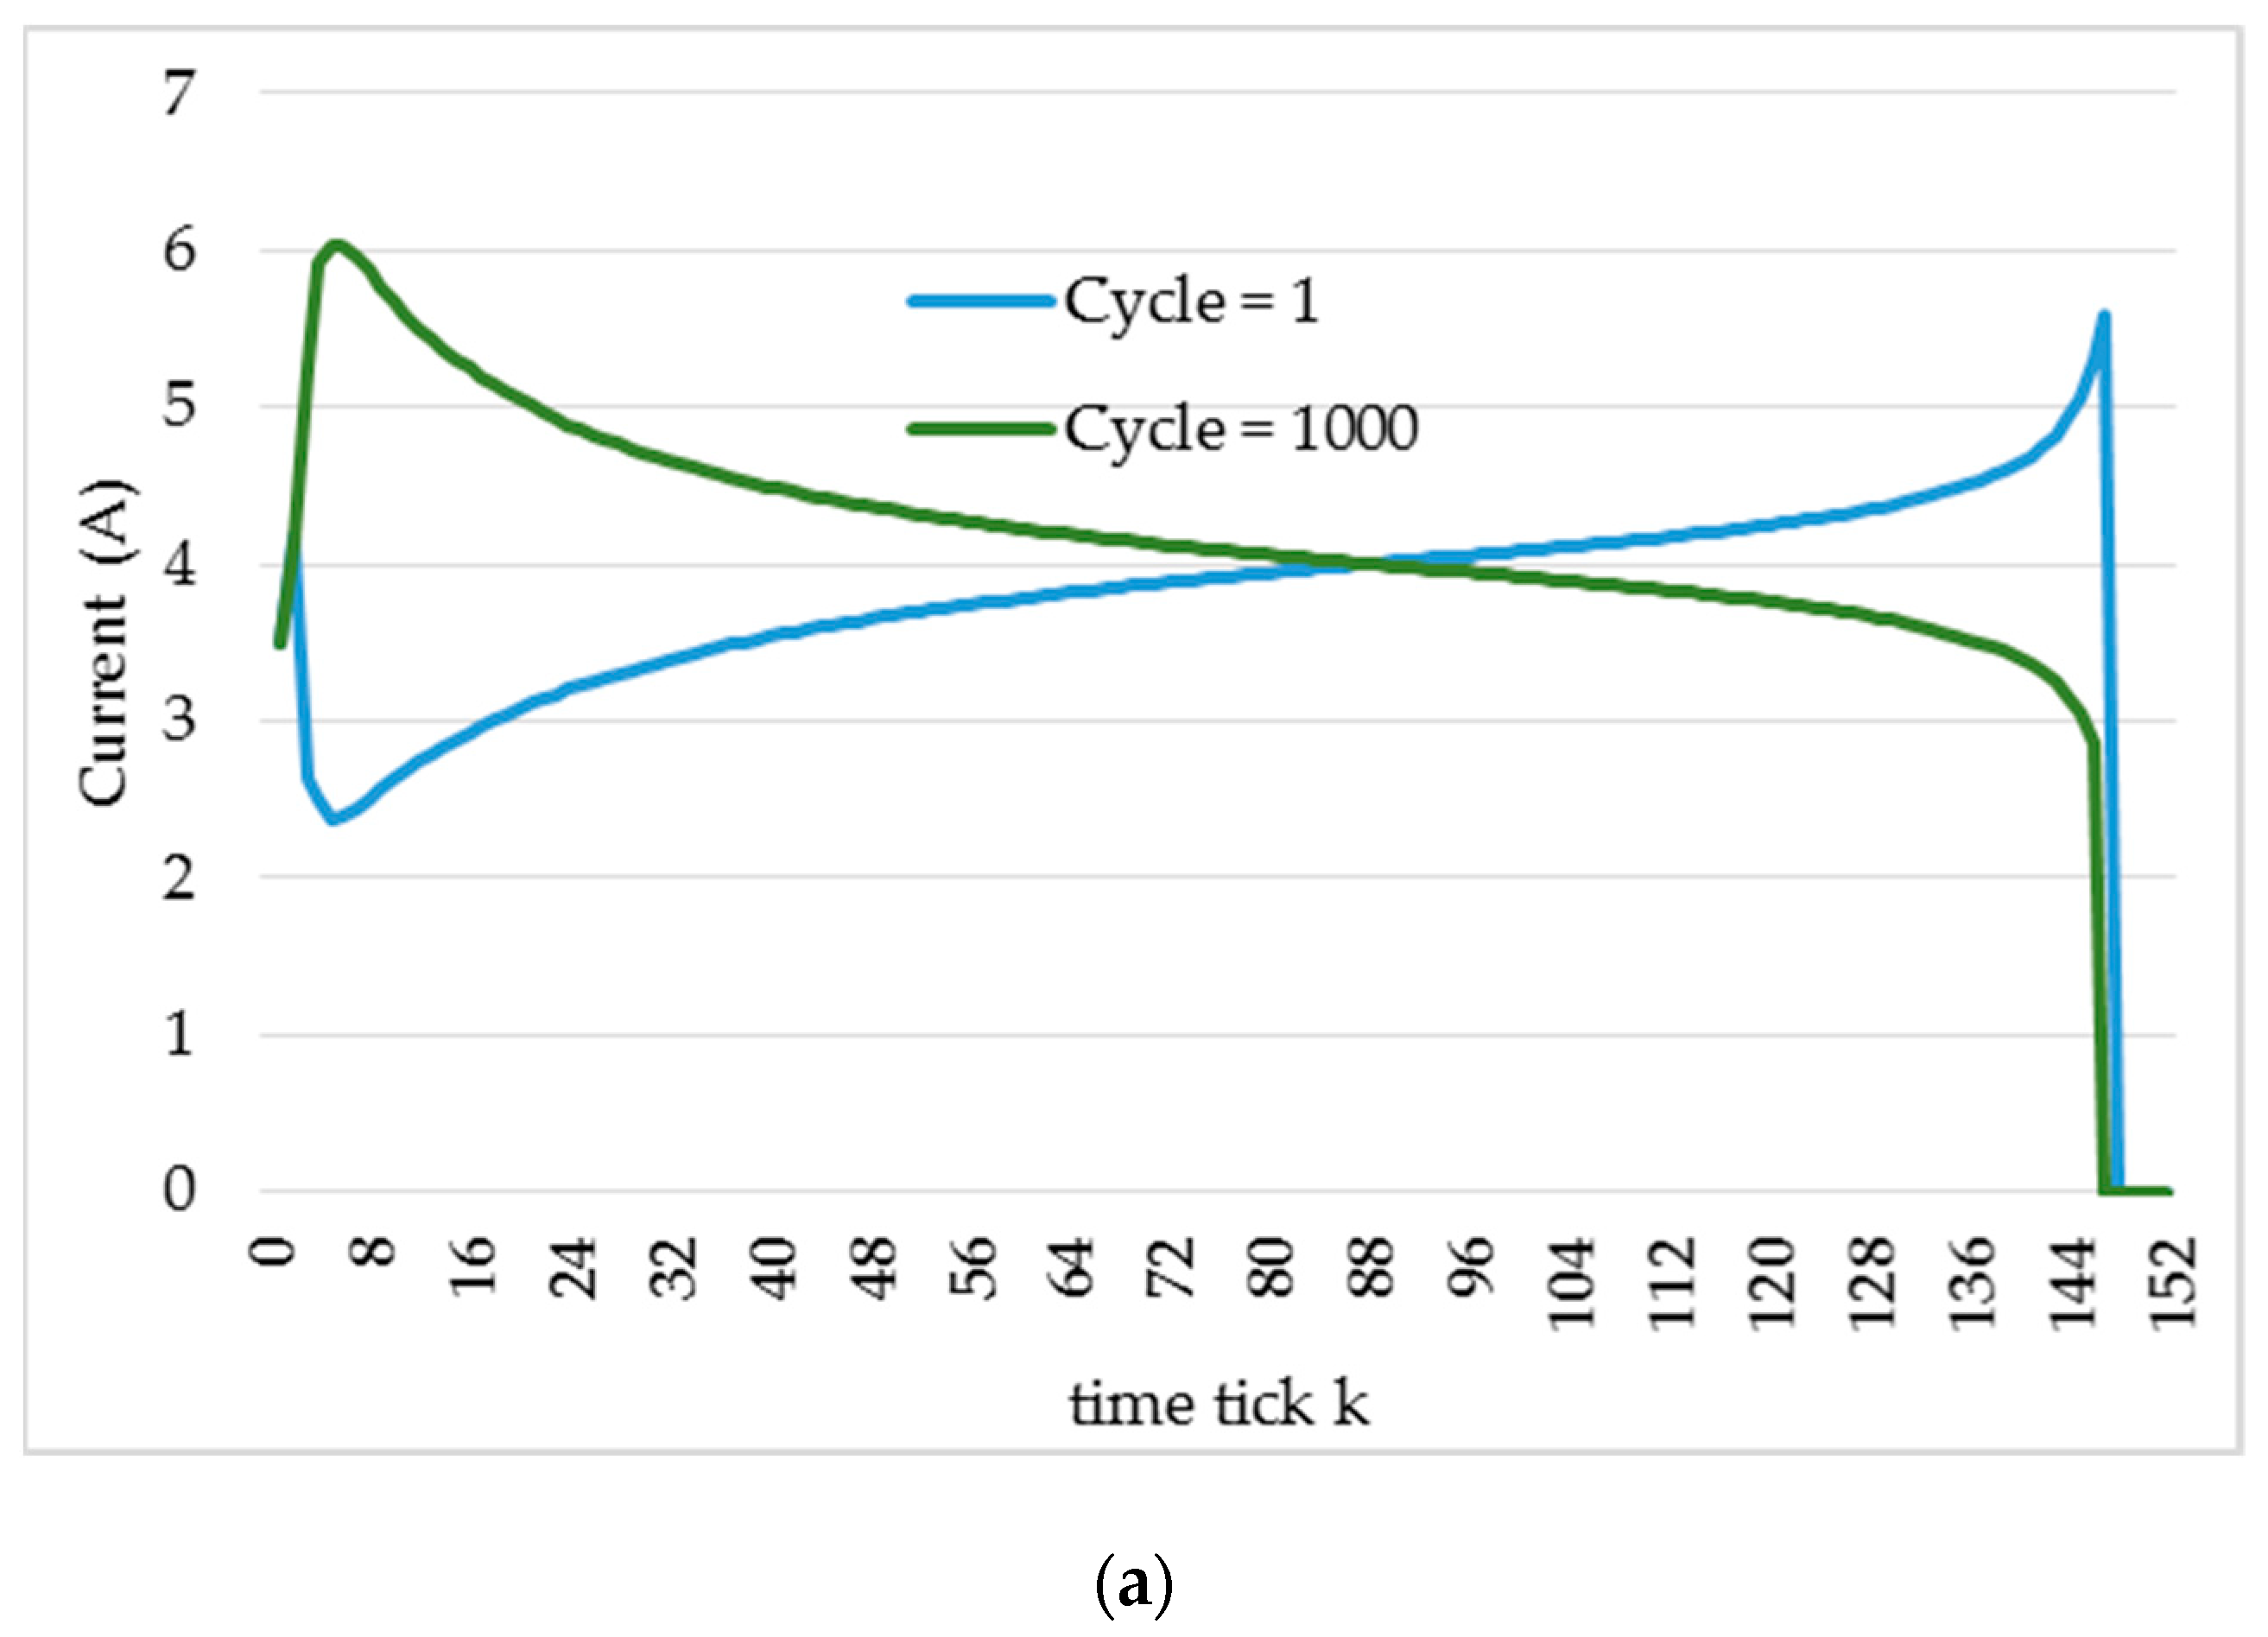
4.1. Simulation
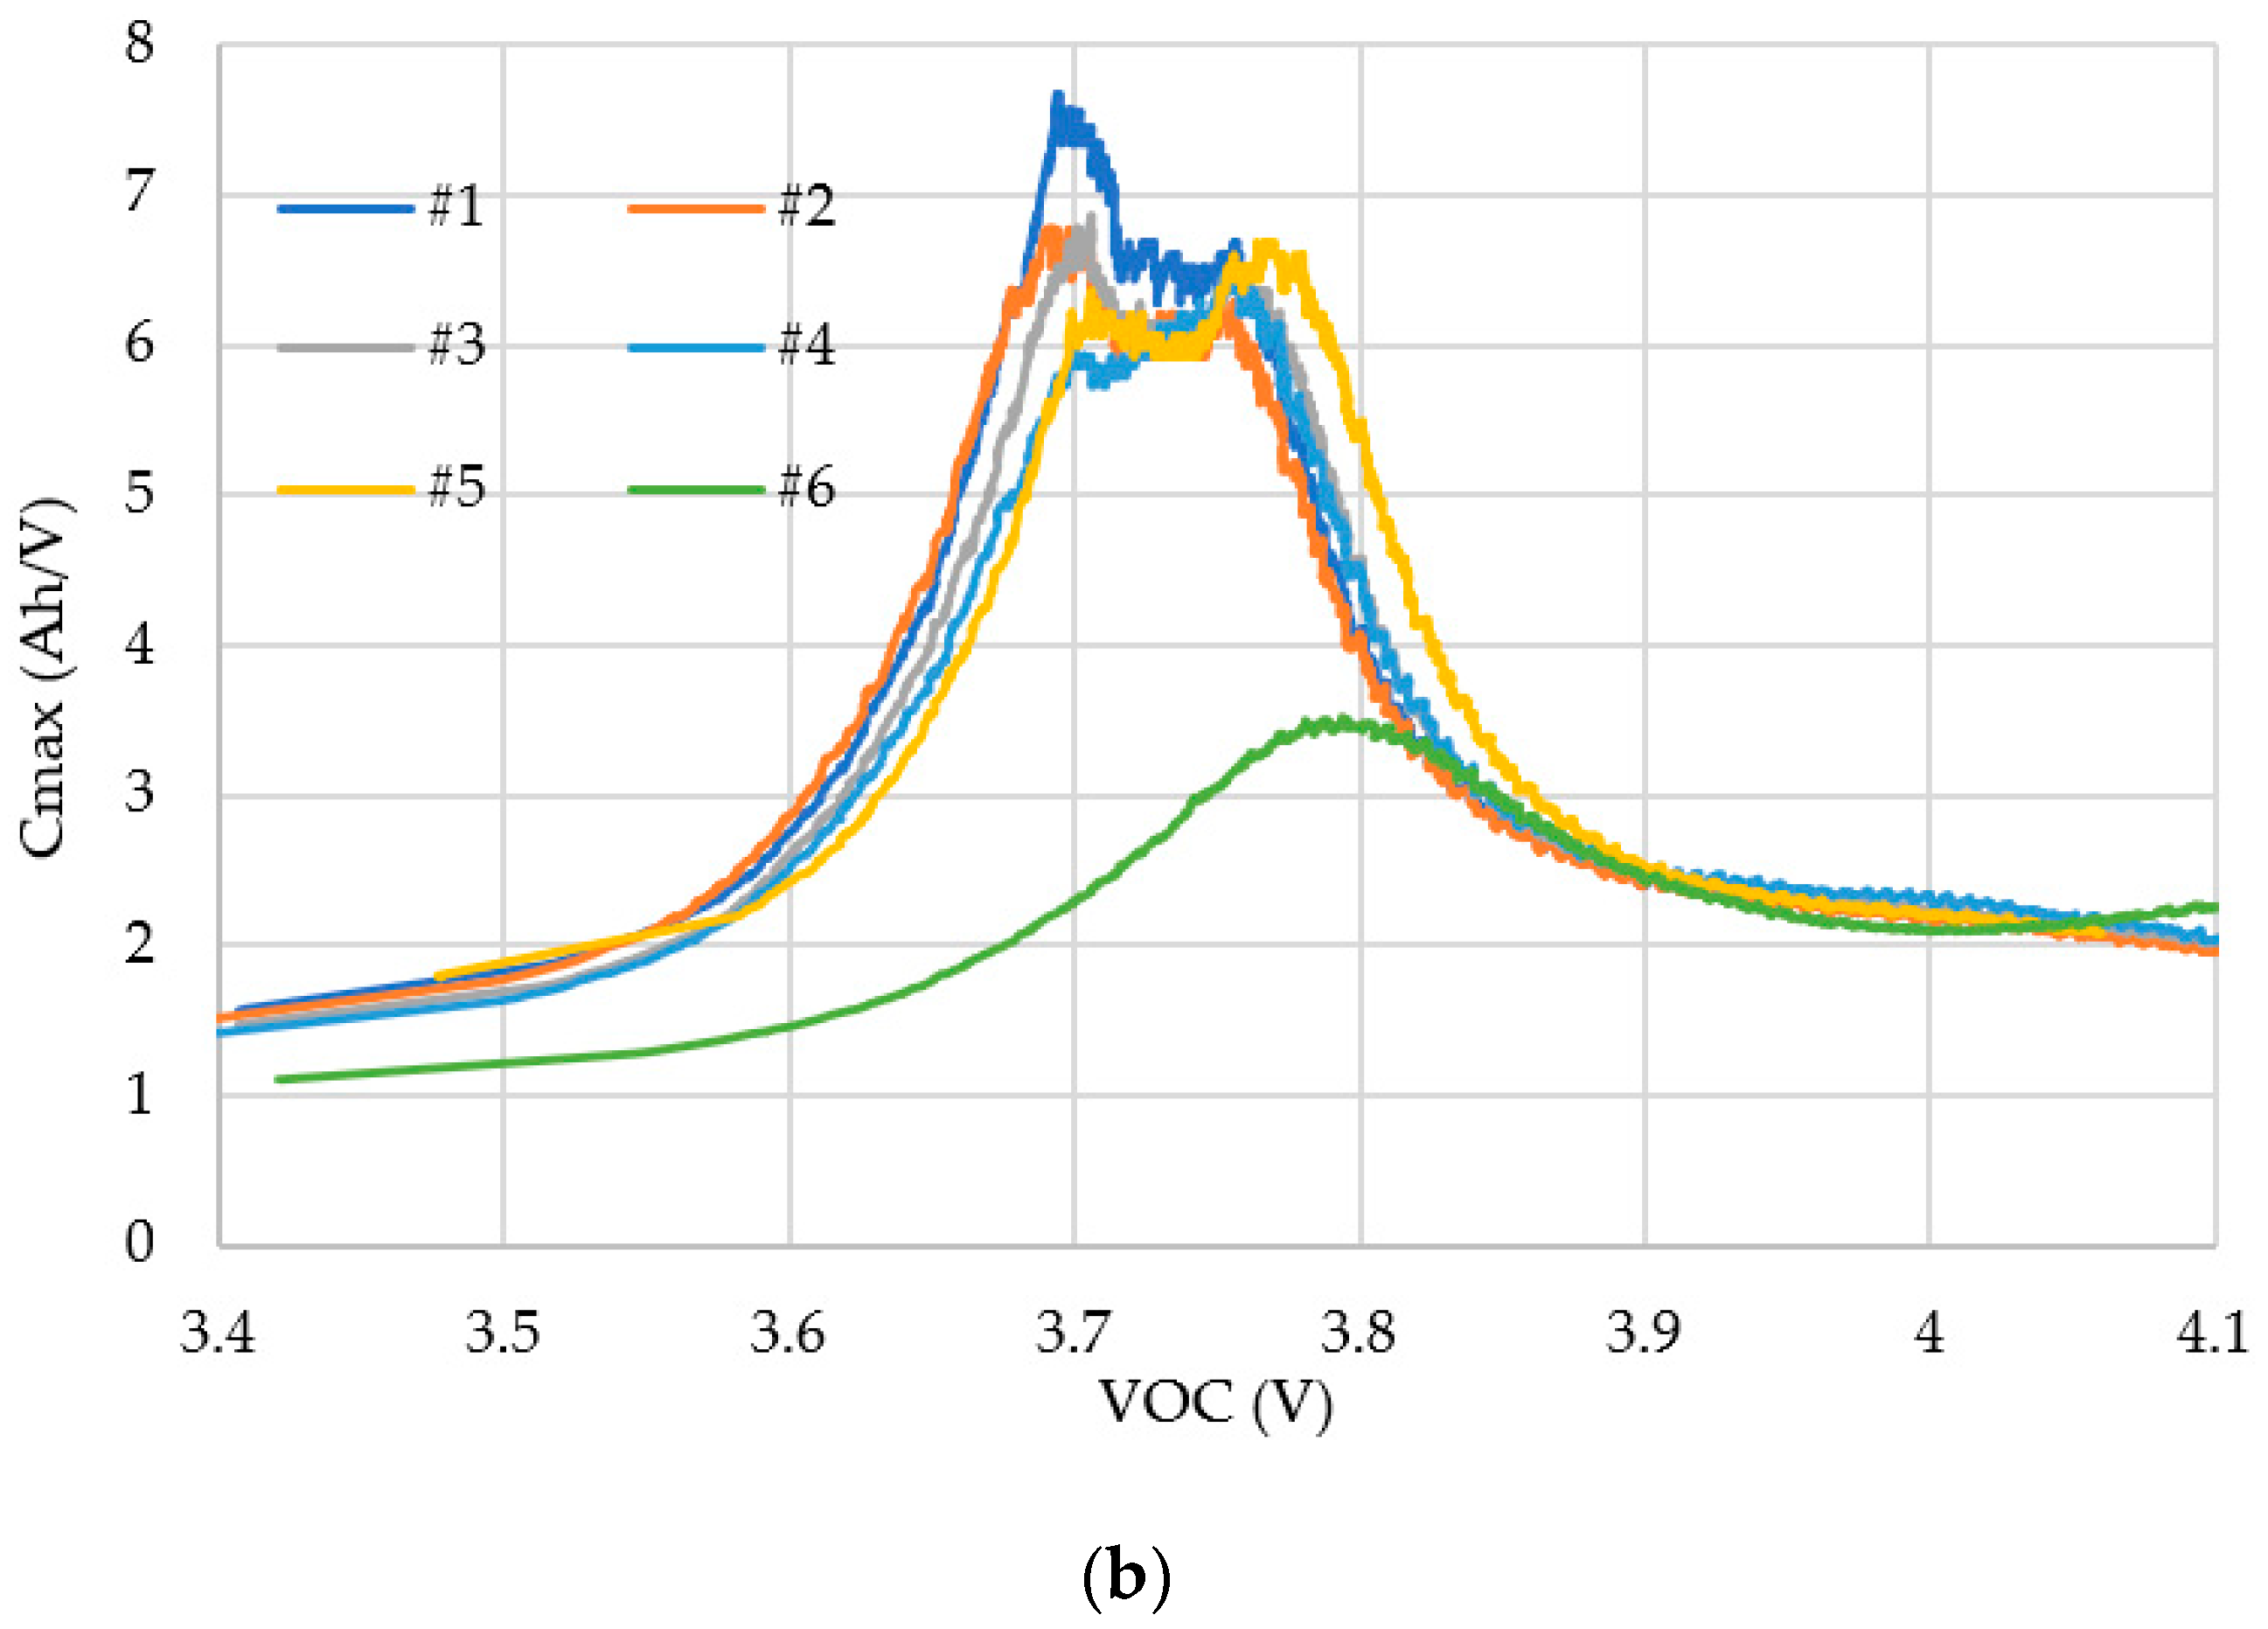
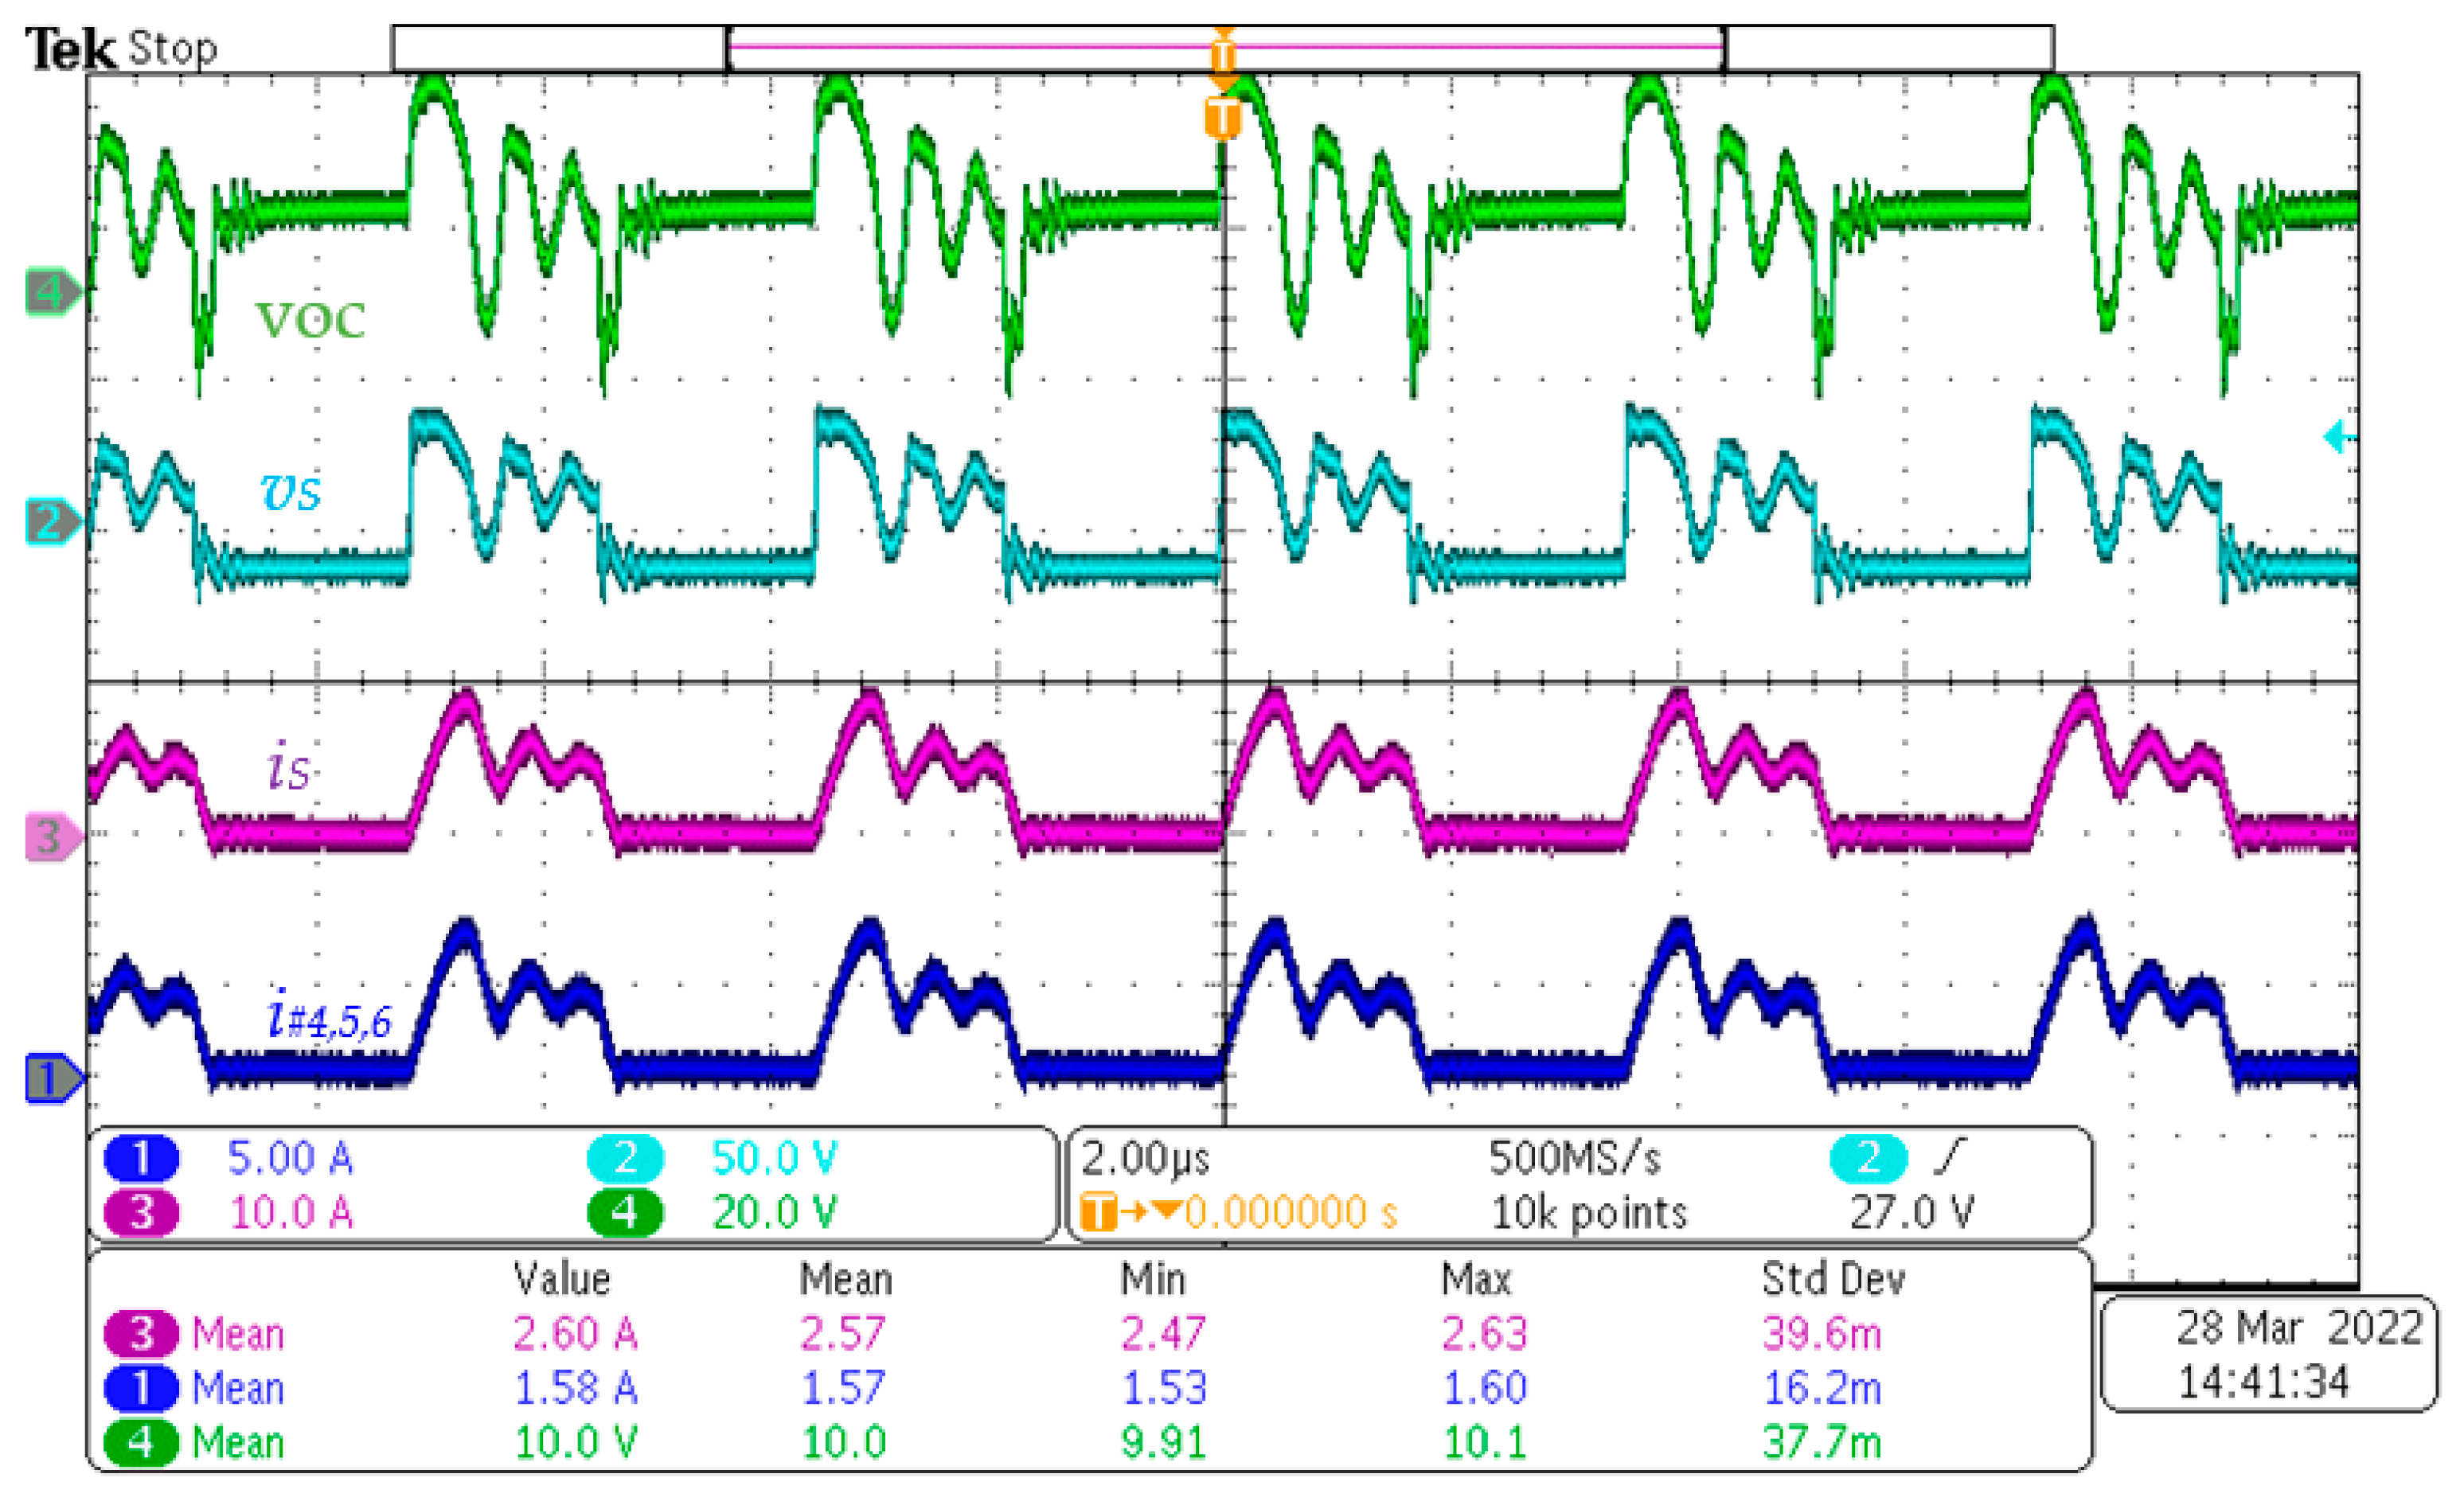
4.2. Experiments
5. Discussion
6. Conclusions
Author Contributions
Funding
Institutional Review Board Statement
Informed Consent Statement
Data Availability Statement
Acknowledgments
Conflicts of Interest
References
- Sun, F.; Xiong, R. A novel dual-scale cell state-of-charge estimation approach for series-connected battery pack used in electric vehicles. J. Power Source 2015, 274, 582–594. [Google Scholar] [CrossRef]
- Bruen, T.; Marco, J. Modelling and experimental evaluation of parallel connected lithium ion cells for an electric vehicle battery system. J. Power Source 2016, 310, 91–101. [Google Scholar] [CrossRef]
- Bui, T.M.; Kim, C.-H.; Kim, K.-H.; Rhee, S.B. A Modular Cell Balancer Based on Multi-Winding Transformer and Switched-Capacitor Circuits for a Series-Connected Battery String in Electric Vehicles. Appl. Sci. 2018, 8, 1278. [Google Scholar] [CrossRef] [Green Version]
- Ramos-Paja, C.A.; Bastidas-Rodriguez, J.D.; Saavedra-Montes, A.J. Design and Control of a Battery Charger/Discharger Based on the Flyback Topology. Appl. Sci. 2021, 11, 10506. [Google Scholar] [CrossRef]
- Guo, X.; Geng, J.; Liu, Z.; Xu, X.; Cao, W. A Flyback Converter-Based Hybrid Balancing Method for Series-Connected Battery Pack in Electric Vehicles. IEEE Trans. Veh. Technol. 2021, 70, 6626–6635. [Google Scholar] [CrossRef]
- Imtiaz, A.M.; Khan, F.H. “Time shared flyback converter” based regenerative cell balancing technique for series connected Li-ion battery strings. IEEE Trans. Power Electron. 2013, 28, 5960–5975. [Google Scholar] [CrossRef]
- Shrivastava, P.; Soon, T.K.; Idris, M.Y.I.B.; Mekhilef, S. Overview of model-based online state-of-charge estimation using Kalman filter family for lithium-ion batteries. Renew. Sustain. Energy Rev. 2019, 113, 109233. [Google Scholar] [CrossRef]
- Elmahdi, F.; Ismail, L.; Noureddine, M. Fitting the VOC-SOC relationship of a battery lithium-ion using genetic algorithm method. In E3S Web of Conferences; EDP Sciences: Les Ulis, France, 2021; Volume 234. [Google Scholar]
- Han, X.; Feng, X.; Ouyang, M.; Lu, L.; Li, J.; Zheng, Y.; Li, Z. A comparative study of charging voltage curve analysis and state of health estimation of lithium-ion batteries in electric vehicle. Automot. Innov. 2019, 2, 263–275. [Google Scholar] [CrossRef] [Green Version]
- He, Y.J.; Shen, J.N.; Shen, J.F.; Ma, Z.F. Embedding monotonicity in the construction of polynomial open-circuit voltage model for lithium-ion batteries: A semi-infinite programming formulation approach. Ind. Eng. Chem. Res. 2015, 54, 3167–3174. [Google Scholar] [CrossRef]
- Weng, C.; Sun, J.; Peng, H. A unified open-circuit-voltage model of lithium-ion batteries for state-of-charge estimation and state-of-health monitoring. J. Power Source 2014, 258, 228–237. [Google Scholar] [CrossRef]
- Deng, Q.; Lin, B. Automated machine learning structure-composition-property relationships of perovskite materials for energy conversion and storage. Energy Mater. 2021, 1, 100006. [Google Scholar] [CrossRef]
- Liang, J.; Wu, T.; Wang, Z.; Yu, Y.; Hu, L.; Li, H.; Zhang, X.; Zhu, X.; Zhao, Y. Accelerating perovskite materials discovery and correlated energy applications through artificial intelligence. Energy Mater. 2022, 2, 200016. [Google Scholar] [CrossRef]
- Wassiliadis, N.; Schneider, J.; Frank, A.; Wildfeuer, L.; Lin, X.; Jossen, A.; Lienkamp, M. Review of fast charging strategies for lithium-ion battery systems and their applicability for battery electric vehicles. J. Energy Storage 2021, 44, 103306. [Google Scholar] [CrossRef]
- Murdock, B.E.; Toghill, K.E.; Tapia-Ruiz, N. A Perspective on the Sustainability of Cathode Materials used in Lithium-Ion Batteries. Adv. Energy Mater. 2021, 11, 2102028. [Google Scholar] [CrossRef]
- Das, A.; Li, D.; Williams, D.; Greenwood, D. Joining Technologies for Automotive Battery Systems Manufacturing. World Electr. Veh. J. 2018, 9, 22. [Google Scholar] [CrossRef] [Green Version]
- Tomaszewska, A.; Chu, Z.; Feng, X.; O’Kane, S.; Liu, X.; Chen, J.; Ji, C.; Endler, E.; Li, R.; Liu, L.; et al. Lithium-ion battery fast charging: A review. eTransportation 2019, 1, 100011. [Google Scholar] [CrossRef]
- Lodh, T.; Pragallapati, N.; Agarwal, V. Novel control scheme for an interleaved flyback converter based solar PV microinverter to achieve high efficiency. IEEE Trans. Ind. Appl. 2018, 54, 3473–3482. [Google Scholar] [CrossRef]
- Naha, A.; Han, S.; Agarwal, S.; Guha, A.; Khandelwal, A.; Tagade, P.; Hariharan, K.S.; Kolake, S.M.; Yoon, J.; Oh, B. An incremental voltage difference based technique for online state of health estimation of li-ion batteries. Sci. Rep. 2020, 10, 9526. [Google Scholar] [CrossRef] [PubMed]
- Das, R.; Wang, Y.; Putrus, G.; Busawon, K. Modelling the State of Charge of Lithium-ion batteries. In Proceedings of the 2018 53rd International Universities Power Engineering Conference (UPEC), Glasgow, UK, 4–7 September 2018; pp. 1–6. [Google Scholar]
- Pattipati, B.; Balasingam, B.; Avvari, G.V.; Pattipati, K.R.; Bar-Shalom, Y. Open circuit voltage characterization of lithium-ion batteries. J. Power Source 2014, 269, 317–333. [Google Scholar] [CrossRef]
- Scott, K.; Nork, S. Active Battery Cell Balancing; Technical Article; Analog Devices, Inc.: München, Germany, 2019; Available online: http://www.analog.com/en/technical-articles/active-battery-cell-balancing.html (accessed on 26 June 2022).


| Symbol | Unit | Description | Value |
|---|---|---|---|
| Q | Ah | Battery capacity | 6.5 |
| VOC,MAX | V | Maximum Open Circuit voltage | 3.65 |
| VP | V | Peak voltage | 3.35 |
| cmax | Ah/V | Maximum instantaneous Capacitance Δvoc = 10 mV | 150 * |
| Symbol | Unit | Cycle 1 Value | Cycle 1000 Value |
|---|---|---|---|
| Q | Ah | 3 | 2.1 |
| cmax | Ah/V | 5.8 | 4.9 |
| VOC,MAX | V | 4.4 | 4.6 |
| VP | V | 3.88 | 3.88 |
| α | 7.883388 | 9.31 | |
| K | 1.034 | 1.001 |
| Symbol | Unit | Value | Cycle 1 Value | Cycle 1000 Value |
|---|---|---|---|---|
| Gp | 0.02 | |||
| Ri | mΩ | 80 | ||
| δR | mΩ/Ampere | |||
| ICH,cmd | A | 20 | ||
| vOC,1(0) = vOC,2(0) | V | 3.7 | ||
| g1(0) | 0.2 | |||
| g2(0) | 0.06 | |||
| Sampling time TS | S | 30 | ||
| Q | Ah | 7 | 6 | |
| cmax | Ah/V | 12 | 9 | |
| VOC,MAX | V | 4.7 | 4.9 | |
| VP | V | 3.8 | 3.9 | |
| α | 7 | 9 | ||
| K | 1 | 1 |
| Symbol | Unit | #1–#4 Nominal Value | #5 Value | #6 Value |
|---|---|---|---|---|
| Q | Ah | 2.35 | 2.3 | 2 |
| cmax | Ah/V | 6 | 5.8 | 3.5 |
| VOC,MAX | V | 4.7 | 4.72 | 4.8 |
| VP | V | 3.75 | 3.77 | 3.9 |
| α | 10.20 | 10.09 | 7 | |
| K | 1 | 1 | 1 |
| Symbol | Unit | −10 °C | 50 °C |
|---|---|---|---|
| Value | Value | ||
| Q | Ah | 1.5 | 1.5 |
| Cmax | V | 3.33 | 3.8 |
| VOC,MAX | V | 4.5 | 4.5 |
| VP | Ah/V | 3.88 | 3.86 |
| α | 8.88 | 10.1 | |
| K | 1.004 | 1.0015 |
Publisher’s Note: MDPI stays neutral with regard to jurisdictional claims in published maps and institutional affiliations. |
© 2022 by the authors. Licensee MDPI, Basel, Switzerland. This article is an open access article distributed under the terms and conditions of the Creative Commons Attribution (CC BY) license (https://creativecommons.org/licenses/by/4.0/).
Share and Cite
Shieh, Y.-T.; Wu, C.-C.; Liu, C.-Y.; Chieng, W.-H.; Su, Y.-S.; Jeng, S.-L.; Chang, E.-Y. Lithium Battery Model and Its Application to Parallel Charging. Energies 2022, 15, 4767. https://doi.org/10.3390/en15134767
Shieh Y-T, Wu C-C, Liu C-Y, Chieng W-H, Su Y-S, Jeng S-L, Chang E-Y. Lithium Battery Model and Its Application to Parallel Charging. Energies. 2022; 15(13):4767. https://doi.org/10.3390/en15134767
Chicago/Turabian StyleShieh, Yueh-Tsung, Chih-Chiang Wu, Ching-Yao Liu, Wei-Hua Chieng, Yu-Sheng Su, Shyr-Long Jeng, and Edward-Yi Chang. 2022. "Lithium Battery Model and Its Application to Parallel Charging" Energies 15, no. 13: 4767. https://doi.org/10.3390/en15134767
APA StyleShieh, Y.-T., Wu, C.-C., Liu, C.-Y., Chieng, W.-H., Su, Y.-S., Jeng, S.-L., & Chang, E.-Y. (2022). Lithium Battery Model and Its Application to Parallel Charging. Energies, 15(13), 4767. https://doi.org/10.3390/en15134767