1. Introduction
One of the most important challenges of the 21st century is the fight against climate change, which is mainly produced by human activities that emit greenhouse gases (GHGs) such as CO
2, NO
x, CH
4, and others into the atmosphere. These GHGs trap infrared radiation, preventing it from escaping back to space and thus increasing the global temperature at the Earth’s surface and lower atmosphere, enhancing the heating producing by direct sunlight [
1].
The largest source of GHGs generated by human activities comes from burning fuels for electricity, heat, and transportation [
2]. According to the European Environmental Agency (EEA), the contribution of the energy sector to the GHG emissions (heat and electricity generation) was 23.24%, and the contribution of the transportation sector was 17.37% in 2019 [
3]. Similar values were obtained in Spain for the same period, where transportation was the largest contributor (27.00% of the total GHG emissions) and electricity generation was the third one, with 17.8% [
4].
The power sector will undergo a very significant increase in the electricity demand in the coming years due to the growth of the world population; the increase of living standards in non-OECD countries, such as China and India; and, above all, the need to electrify one of the most polluting sectors—the transportation sector [
5].
Despite the fact that carbon emissions fell sharply during the worldwide lockdown (March to May 2020) due to the COVID 19 pandemic, the annual average CO
2 concentrations still increased during 2020 [
6], but at a slower rate compared to previous years.
Currently, there is a unique opportunity to align the public policies defined in different post-crisis recovery programs around the world with their climate objectives. The stimulus packages should be designed to invest in sectors that can improve resilience to future climate change crises. In this environment where higher electricity demand must comply with the need to reduce global GHG emissions, the electric power sector must evolve from a fuel-based generation model to a carbon-free generation one, mainly based on renewable energies.
In recent years, the share of renewable generation in the electric generation mix of most of the countries has increased, motivated by the need to reduce emissions and by its rapid cost decrease. In the Spanish mainland system, the renewable power installed capacity by the end of 2019 was 54.3 GW, (46.54% from wind, 31.5% from hydro, 16.2% for solar PV, and 4.2% for solar thermal) [
7] and, only during 2019, 6.50 GW of new renewable power plants were installed (4.2 GW based on solar PV and 2.3 GW based on wind). The forecast is that these figures will increase significantly in the future worldwide [
8]. According to [
5], renewables will become cheaper than existing coal and gas in most regions of the world before 2030.
The main challenge associated with the integration of large amounts of renewable energy in current power systems is its intermittency, which can cause energy management issues to cover spatial and temporal gaps between the energy generated and the energy demanded by the users [
9,
10]. The main solution proposed to address these issues is the electric storage systems (ESSs), which help to balance fluctuating wind and solar energy production.
There are different ESS technologies with different maturity levels [
11]; however, pumped hydro storage (PHS) and batteries are technologies that currently work as energy support of renewable sources, with good results in different projects [
12,
13].
Pumped hydro storage (PHS) is a mature technology and is the largest form of grid energy storage in the world. In addition to energy storage, pumped hydro plants allow balance load changes and frequency adjustment within seconds by controlling the pump turbines in order to maintain the stability of the electrical grid [
14]. Around 3.30 GW of PHS is currently available in Spain, and 3.50 additional GW of installed capacity is foreseen in the National Energy and Climate Plan 2021–2030 (Plan Nacional Integrado de Energía y Clima-PNIEC) [
15]. Nevertheless, its deployment presents limits related to the geography, environmental impacts, legal regulations, and the availability of water, a resource that will be scarcer as climate change progresses.
Batteries are presented as the main alternative to PHS for electric storage. In particular, the Li-ion battery prices fell by 87%, in real terms, from
$1100/kWh in 2010 to
$156/kWh at the end of 2019, and it is forecasted to reach
$100/kWh by 2023 [
16,
17]. This drop is motivating the growing electrification of the transportation sector and the development of several projects of battery storage at a grid-scale, such as Horsdale Power Reserve in South Australia, a facility with 100 MW/120 MWh that has demonstrated to be practical and profitable [
18], and other similar projects are currently being deployed in the USA [
19,
20]. Moreover, it is expected that the development of a new generation of Li-based batteries, redox flow batteries, and hybrid supercapacitors will allow for a further reduction in the manufacturing costs of energy storage systems [
21,
22].
Most analyses found in literature show that off-grid systems [
23,
24], isolated grids [
25], and micro-grids [
26,
27] powered by renewable energy plus EES are technically and economically feasible. In the same way, different works focused on the study of the integration of renewable energy sources (RESs) in Europe also conclude that including energy storage systems as support energy systems will allow us to maintain the flexibility of the electrical grid.
In general, these studies use historical weather or electric consumption (demand curves) data to integrate all technologies of renewable energy and ESS by means of optimization algorithms or simulation models according to the whole generation mix of each country, with different objectives, such as to reach 100% renewable generation mix [
28], minimizes energy costs [
29,
30], maximize renewable sources integration [
31], or plan the future European power system [
32]. In order to reduce the complexity of the models, the storage capacity is calculated, in most cases, from the energy balance between the generation plants and demand, including some constraints, such as the charge–discharge efficiency, technical restrictions, or maximal installable storage capacity. Despite how these works show that a European power system could be converted into a highly renewable power system in terms of flexibility and costs, some aspects, such as the replacement of fossil-power plants in each country or minimization of CO
2 emissions, are not deeply considered.
In addition to giving a European analysis, some works have analyzed the integration of renewable energy sources in the Spanish power system in recent years. Ref. [
33] presented an analysis of the integration of 35 self-consumption facilities with power less than 100 kW in terms of investments, types of consumers, and the Spanish legal framework, but the replacement of fossil-based plants is not included in the analysis. In [
34], the main objective of the study was the substitution of gasoline and diesel demand by CO
2-free-fuels produced from renewable energy sources. This approach shows an important reduction of CO
2 emissions associated to transportation; however, the reduction of the CO
2 emissions of the energy generation mix has not been reported. Ref. [
35] proposes a model focused on predicting the behavior of the Spanish power system according to future scenarios in 2030 and 2040; however, the model includes conventional and renewable sources the scenarios do not consider battery storage systems as a support of renewable sources or the replacement of fossil-based plants by hybrid energy systems (renewable source + storage).
In this work, the study presented in [
36] is expanded upon. From the analysis of 5-year historical data (2015 to 2019) of the Spanish generation mix, we assessed, by means of a two-stage scheduling algorithm, the impact of the replacement of fossil-based electric generation with solar PV–ESS hybrid systems in the Spanish Peninsula, estimating the ESS capacity required to couple this intermittent generation and fulfill the savings in CO
2 emissions objectives. A single type of Li-ion battery is the only ESS system employed to simplify the model, although it can be easily expanded to cover any combination of ESS systems. The main contribution of this work is to include the CO
2 emissions’ reduction as an objective in the model and the evaluation of the replacement of fossil-based plants with PV–storage hybrid systems, also the calculation of the CO
2 emissions reduction and the associated storage costs.
The paper’s contents are organized as follows: In
Section 2, the current generation mix in Spain and its associated CO
2 emissions is analyzed. In
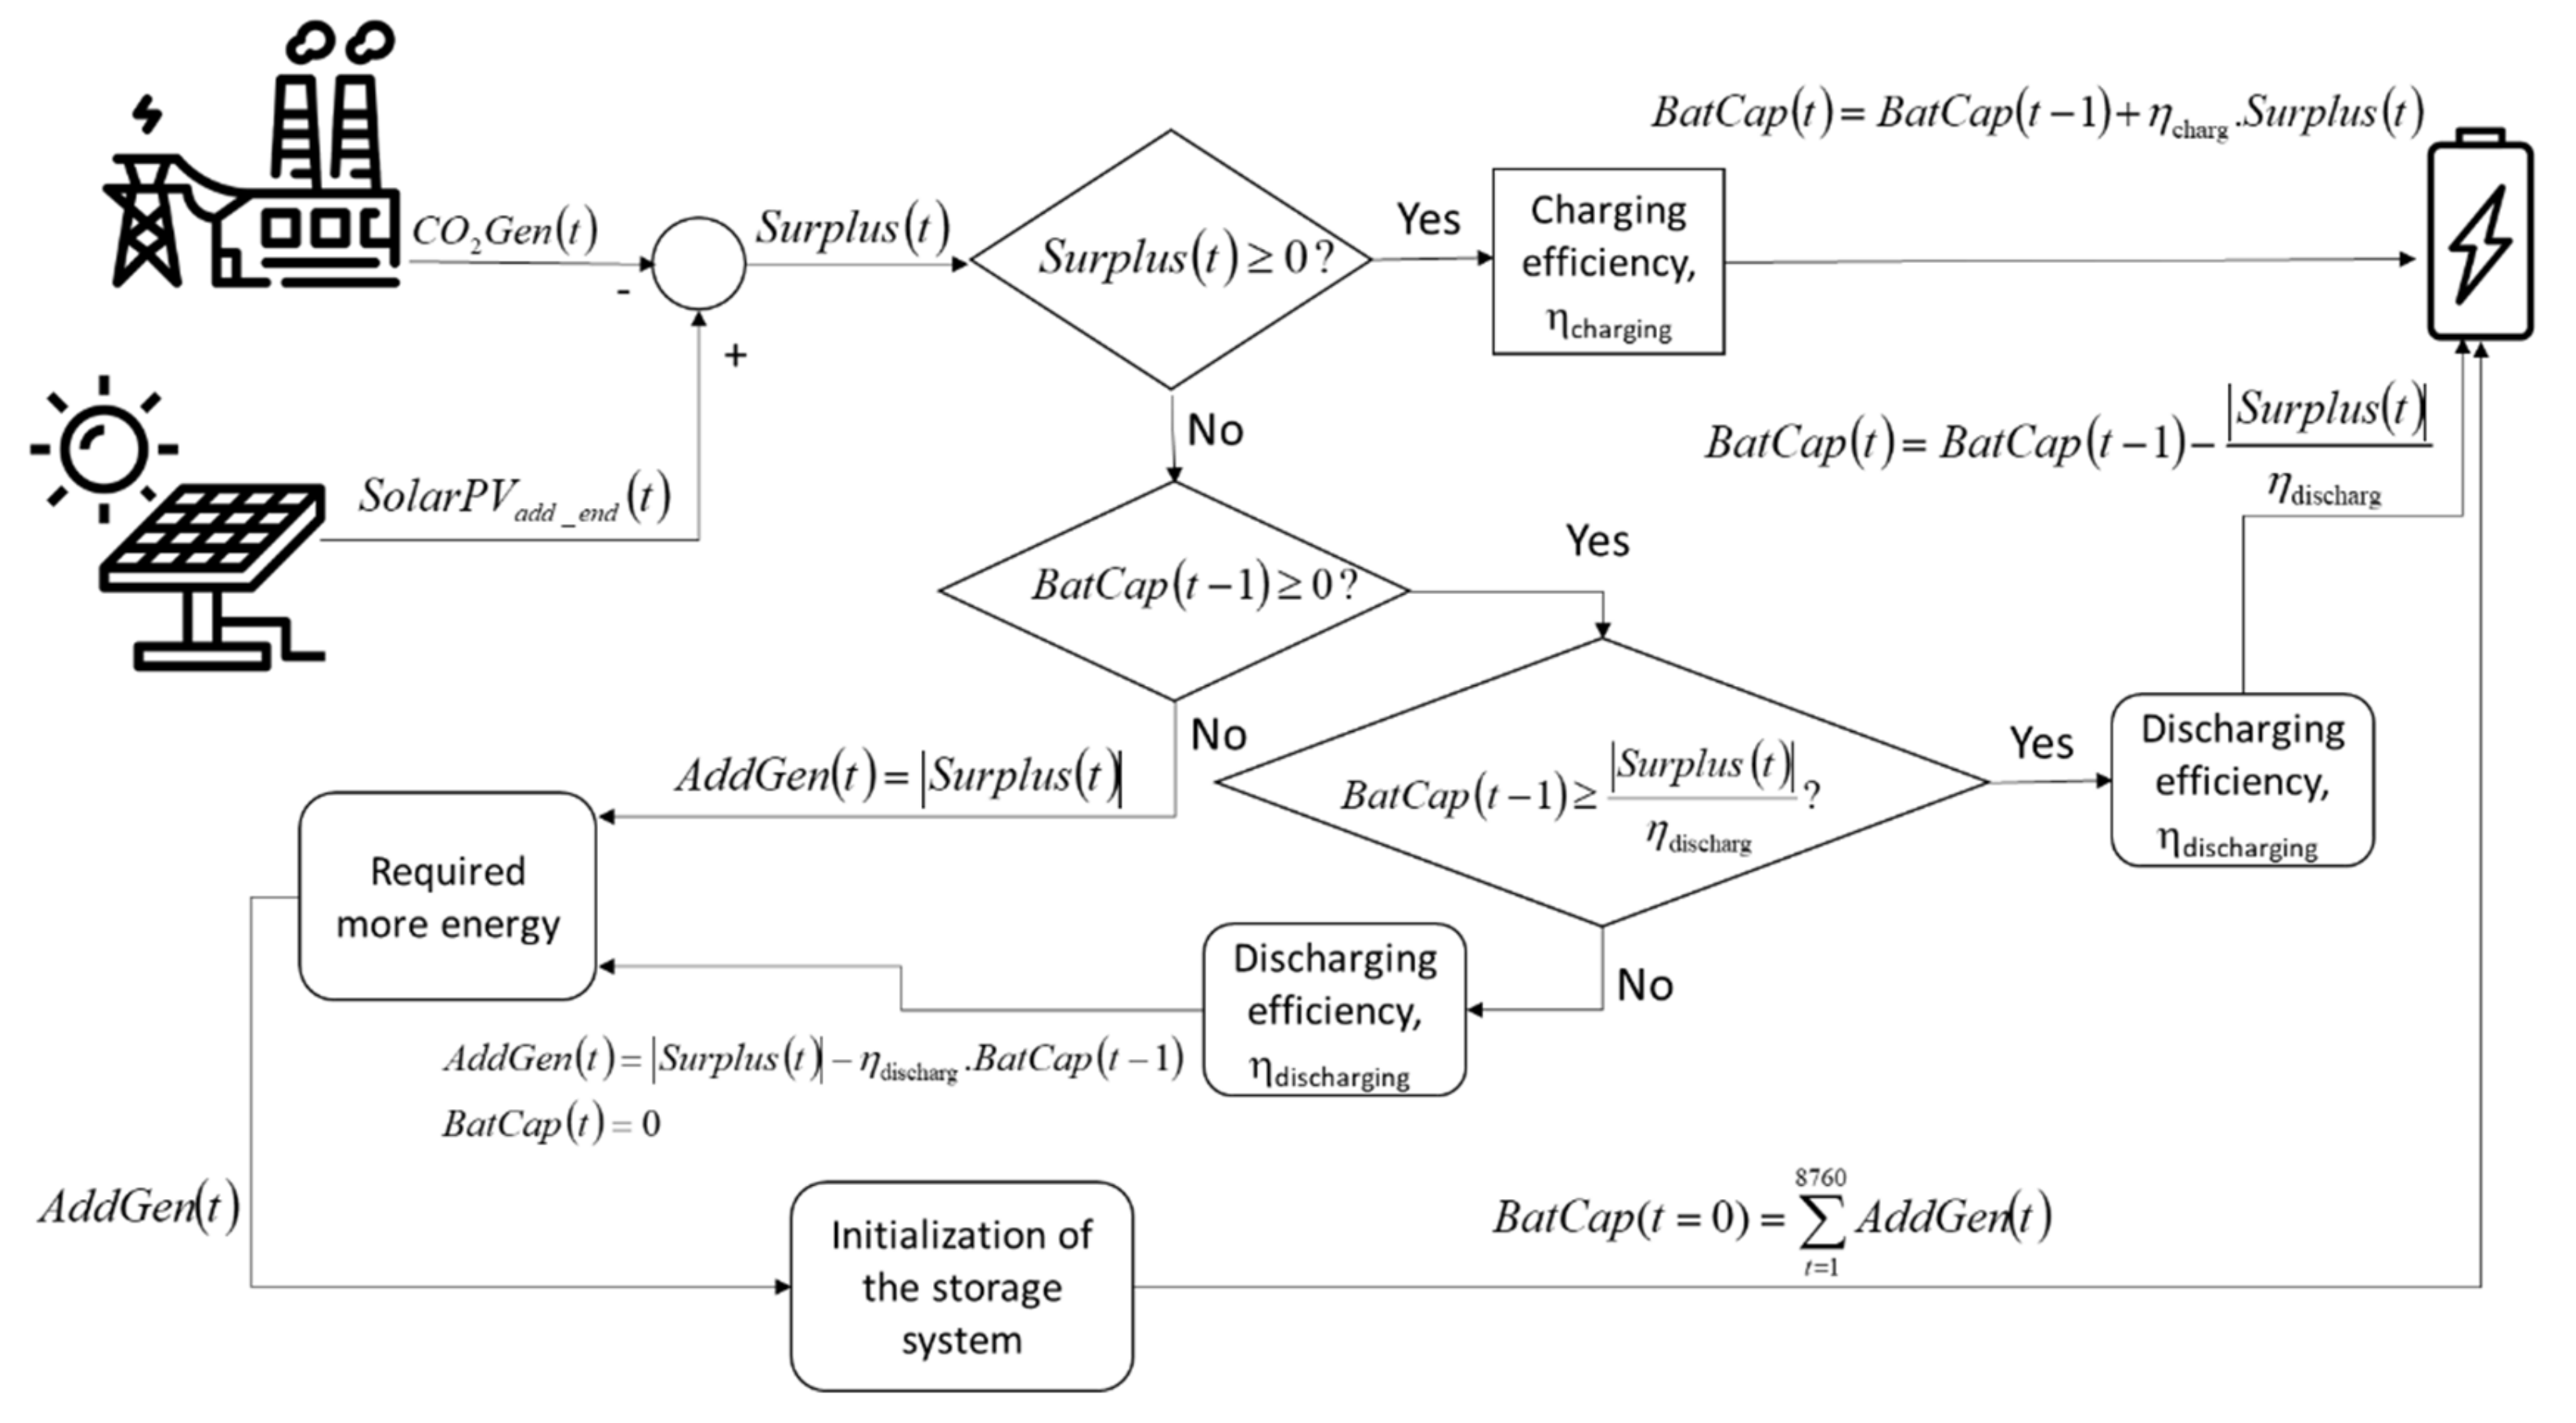
Section 3, a two-stage algorithm to evaluate the energy storage and additional PV requirements is described.
Section 4 presents the main results, and the conclusions are shown in
Section 5.
2. Spain Electricity Generation Mix and Associated CO2 Emissions
2.1. Installed Capacity and Energy Production per Technology in Mainland Spain
In the last five years, the Spanish economy has emerged from a deep recession, directly affecting the national electricity consumption. At the beginning of the crisis, in 2008, the electricity demand in Mainland Spain reached its maximum value of 263.53 TWh, while, in 2014, it reached the minimum one during the current century, with an annual demand of 248 TWh. Since then, the electricity demand of Mainland Spain has been growing at a moderate rate, reaching 249.14 TWh in 2019 [
37].
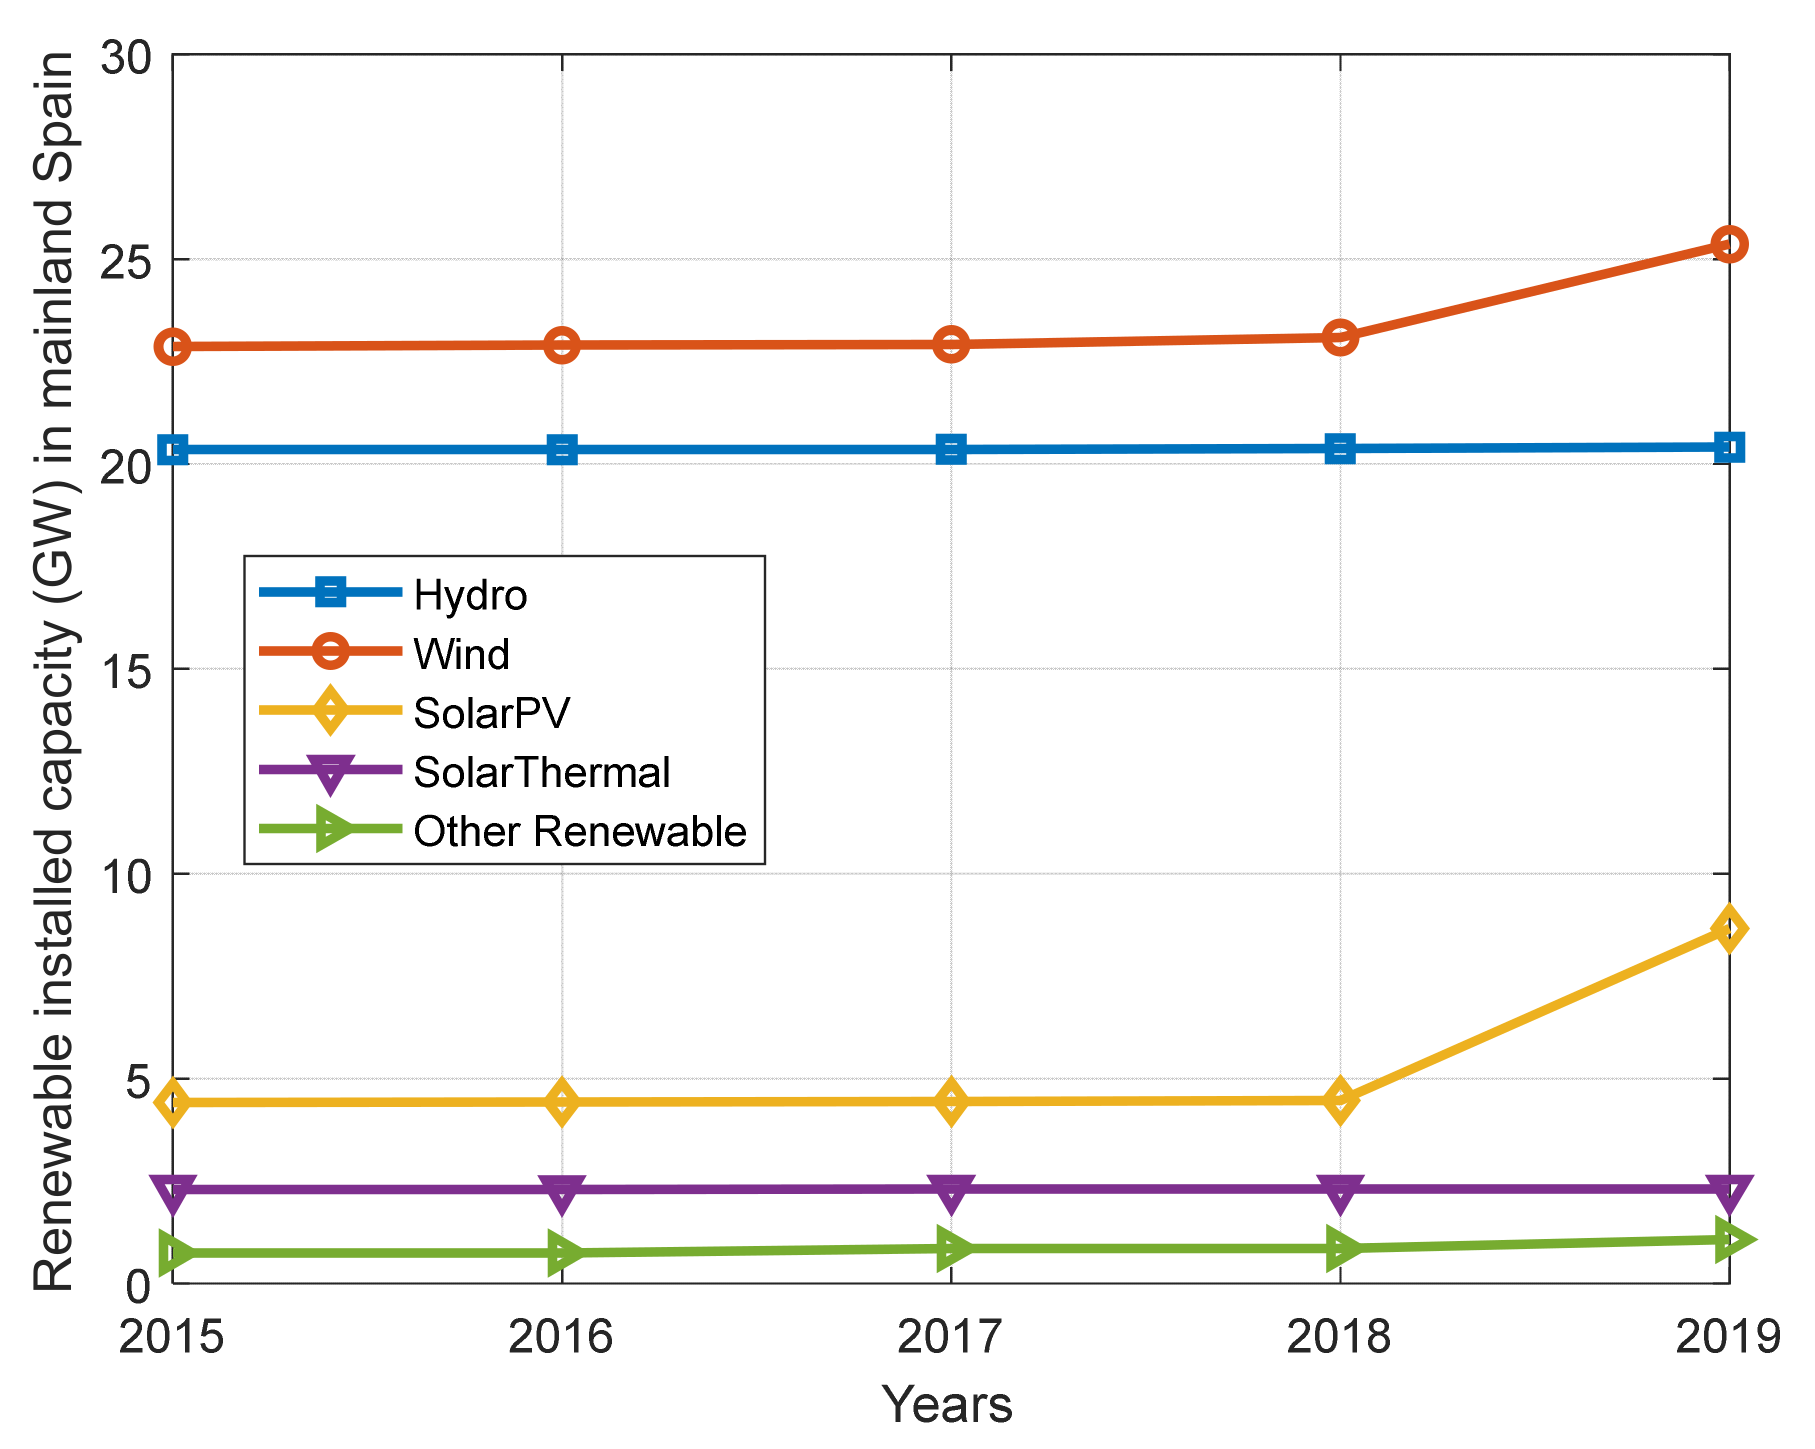
During this period, the main sources of electricity generation did not change significantly until 2019, when 6.70 GW of new renewable power plants were installed (4.20 GW based on solar PV), as is shown in
Figure 1. There are several reasons for this impressive growth in the solar sector: at the governmental level, the previous Spanish Government organized auctions for installing renewable generation by the end of 2019, and the current government has fostered this policy with the publishment of the Royal Decree 244/2019 regulating the electricity self-consumption [
38] and the development of the PNIEC [
15], which promotes the decarbonization of different sectors (mainly energy, heat, and transportation). At the technical level, solar PV panels have reduced in price by approximately 80% in this period, making solar projects profitable (current record of 0.0112 €/kWh, has been reached in the last solar energy auction in Portugal in August 2020) [
39].
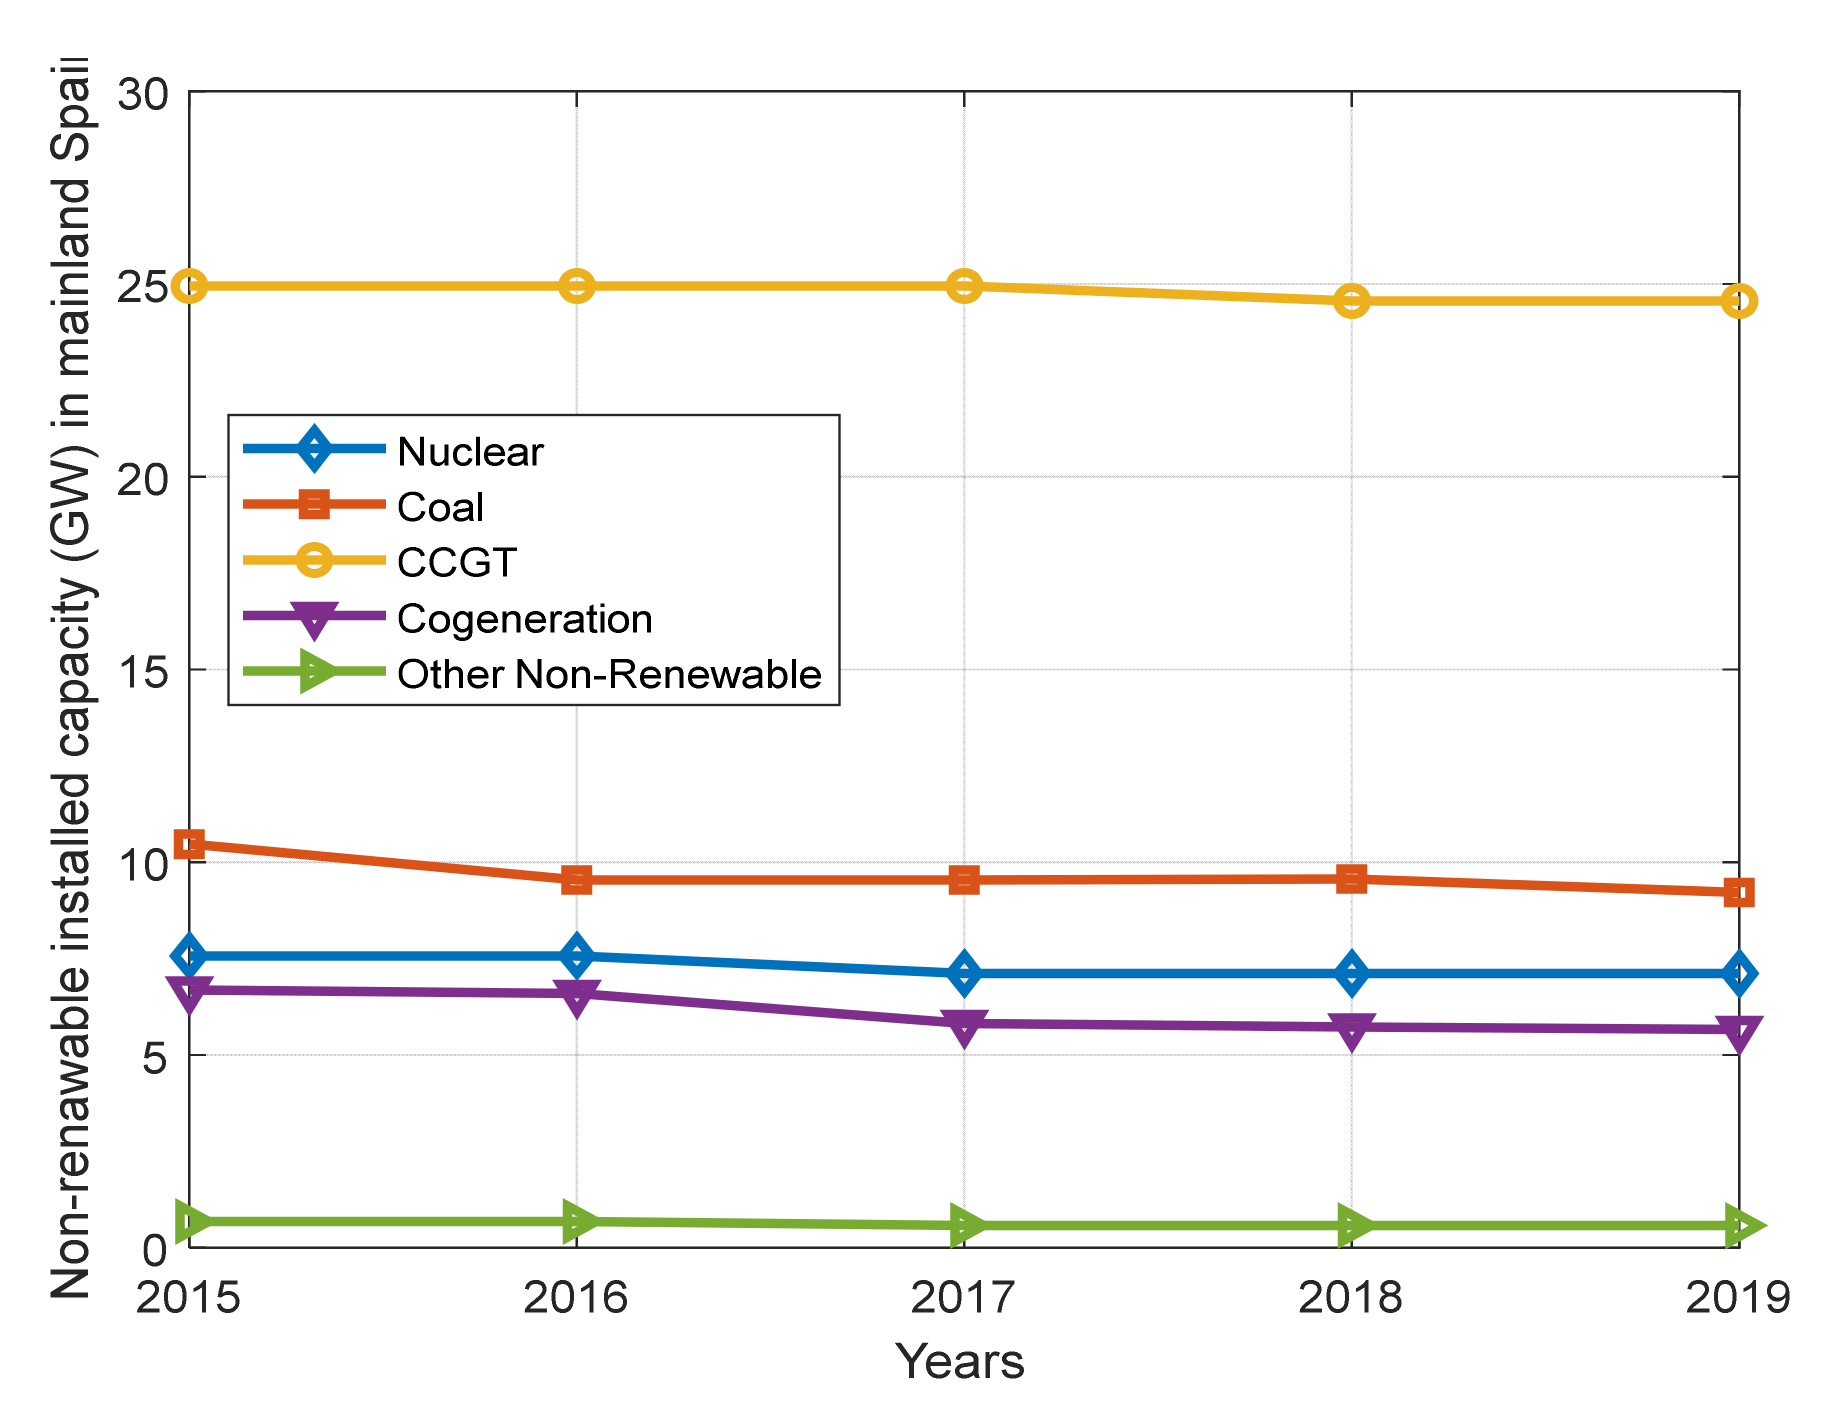
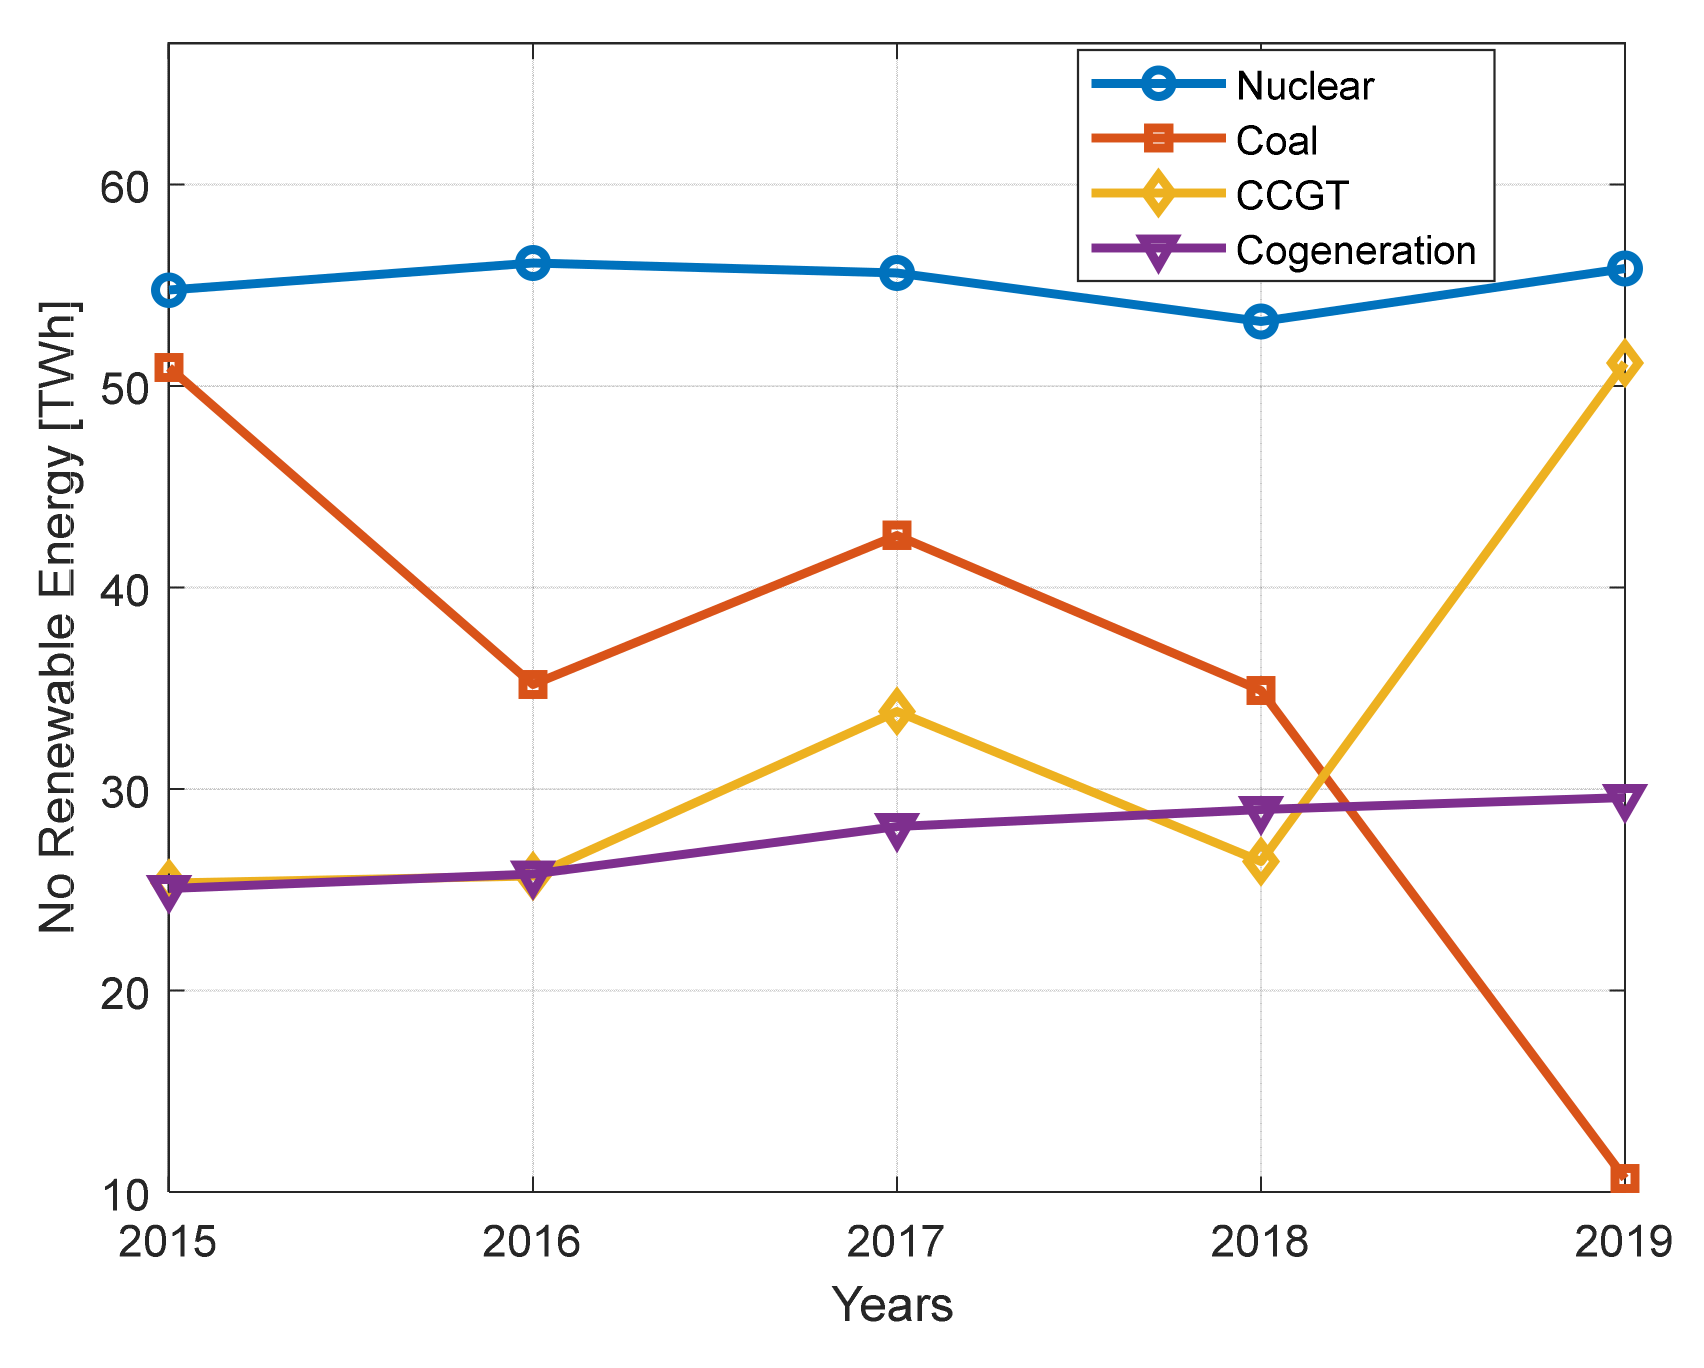
Nuclear generation capacity has remained constant around 7 GW, going from 7.6 GW in 2015 to 7.1 GW in 2019, due to the start of the decommissioning of Santa María de Garoña Nuclear Power Plant (460 MW) in 2017. Coal generation capacity was decreased from 10.47 GW (in 2015) to 9.22 GW in 2019. The current CCGT generation capacity is around 24.5 GW, decreasing by 386 MW from 2015 to 2019. Finally, cogeneration capacity has shrunk slightly from 6.70 GW in 2016 to the current 5.60 GW (
Figure 2).
Hydropower generation capacity (including pumped-storage power plants) has slightly increased from 20.35 GW in 2015 to 20.41 GW in 2019. The fastest-growing technologies during these 5 years have been wind energy (increasing from 22.86 to 25.36 GW) and solar energy, with a growth of more than 4 GW, going from 4.42 to 8. 66 GW, while solar thermal capacity maintains around 2.3 GW (
Figure 1).
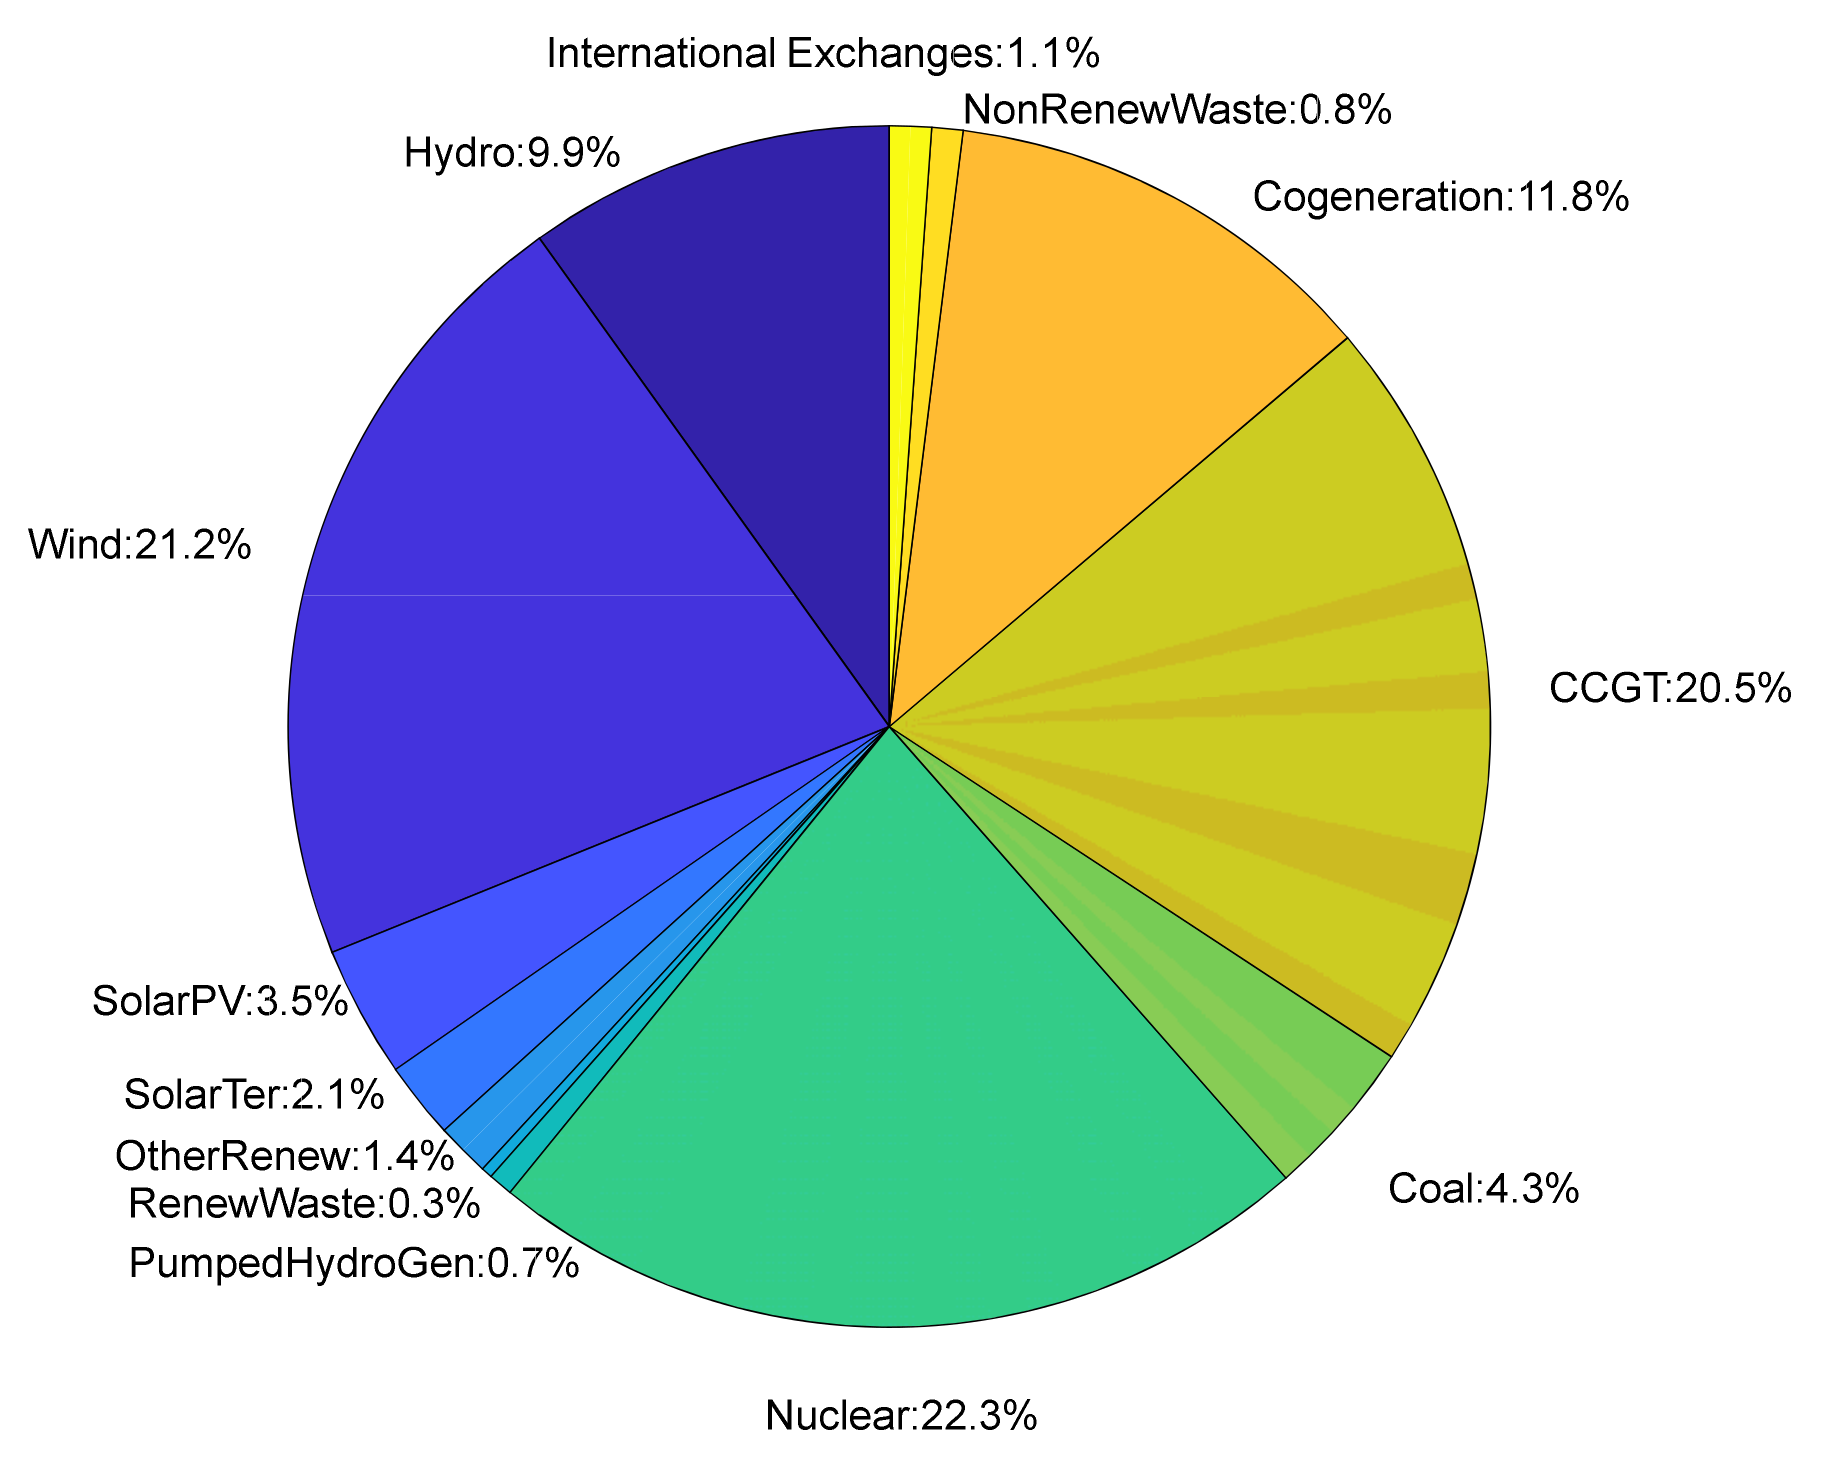
Regarding demand coverage (see
Figure 3), the main contributor in 2019 was nuclear energy, with a contribution of 22.3%, followed by wind energy (21.2%), CCGT (20.5%), and cogeneration (11.8%). Hydro energy was the fifth contributor, with 9.9%, conventional coal thermal power plants’ contribution was 4.3%, and solar thermal contribution reaches 2.1%.
In 2019, renewable energy generation represented 39% of the total energy generated in Mainland Spain, meaning that, in addition to the nuclear plants, 62% of the total energy demand is covered by CO2-free generation sources.
According to the PNIEC [
15], it is planned to reach 42% of energy from renewable sources in gross final energy consumption in 2030. Per technology, the forecast is to obtain a total installed capacity in the electricity sector of 157 GW, with the following distribution mix: 50 GW from wind energy, 39 GW from solar PV, 27 GW from CCGT, 16 GW from hydro, 8 GW from pumped-storage systems, 7 GW of solar thermal, and 3 GW of nuclear.
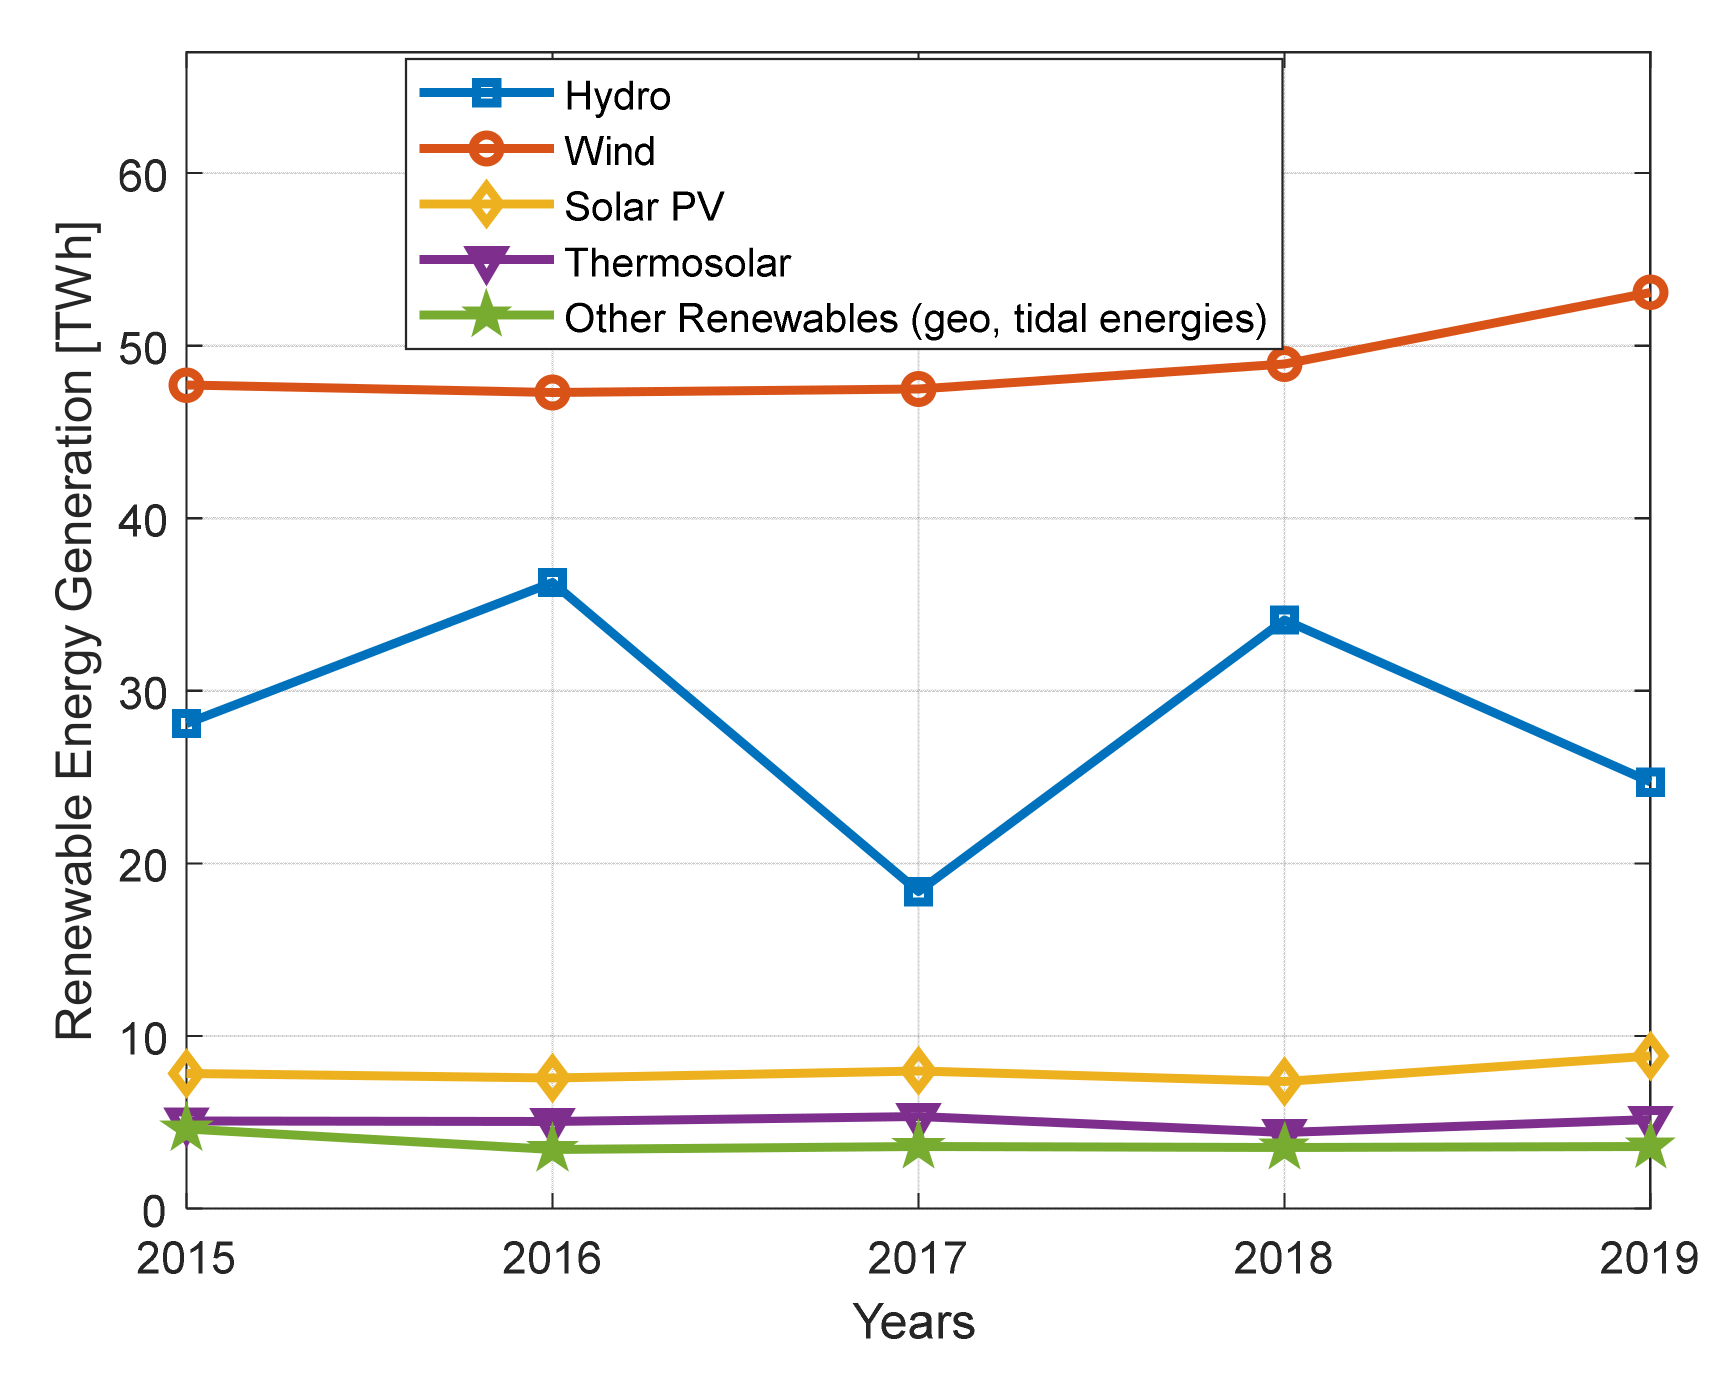
Related to electricity production, most of the energy obtained from renewable technologies has been kept constant during this period, as is shown in
Figure 4, except for wind energy, which grew from 47.7 TWh in 2015 to 53.1 TWh in 2019, mainly due to the increase in wind installed capacity during this period, and hydro generation, which has been highly variable because it depends on rainfall, fluctuating from 36.3 TWh in 2016 to 18.4 TWh in 2017.
Similar behavior is found in other non-renewable source generation, as presented in
Figure 5. Nuclear production has remained almost constant, at around 55.1 TWh per year, and cogeneration grew slightly from 25.1 TWh in 2015 to 29.6 TWh in 2019. In 2019, there was a significant increase in the production with CCGT (almost doubling the 26.4 TWh production from 2018 to 51.1 TWh in 2019) to the detriment of the coal energy production, reducing its value from 35 TWh in 2018 to 10.7 TWh in 2019.
The main reason for this significant reduction in coal-generated energy production was the rise in the price of the EU Emission Trading System allowances that penalize CO2 emissions from different industries, including electricity generation, making coal energy production less competitive than CCGT generation.
Table 1 presents the capacity factor for each technology of generation in Mainland Spain (from data reported by Spanish TSO). The capacity factor of a technology or power plant is the energy produced in a given period (one year) over the maximum energy that could be generated during that period; as expected, the generation technology with the highest capacity factor is nuclear energy, whose equivalent annual operating hours are closed to 7600 h, while pumping stations have the lowest capacity factor, operating at full power less than 1000 h per year.
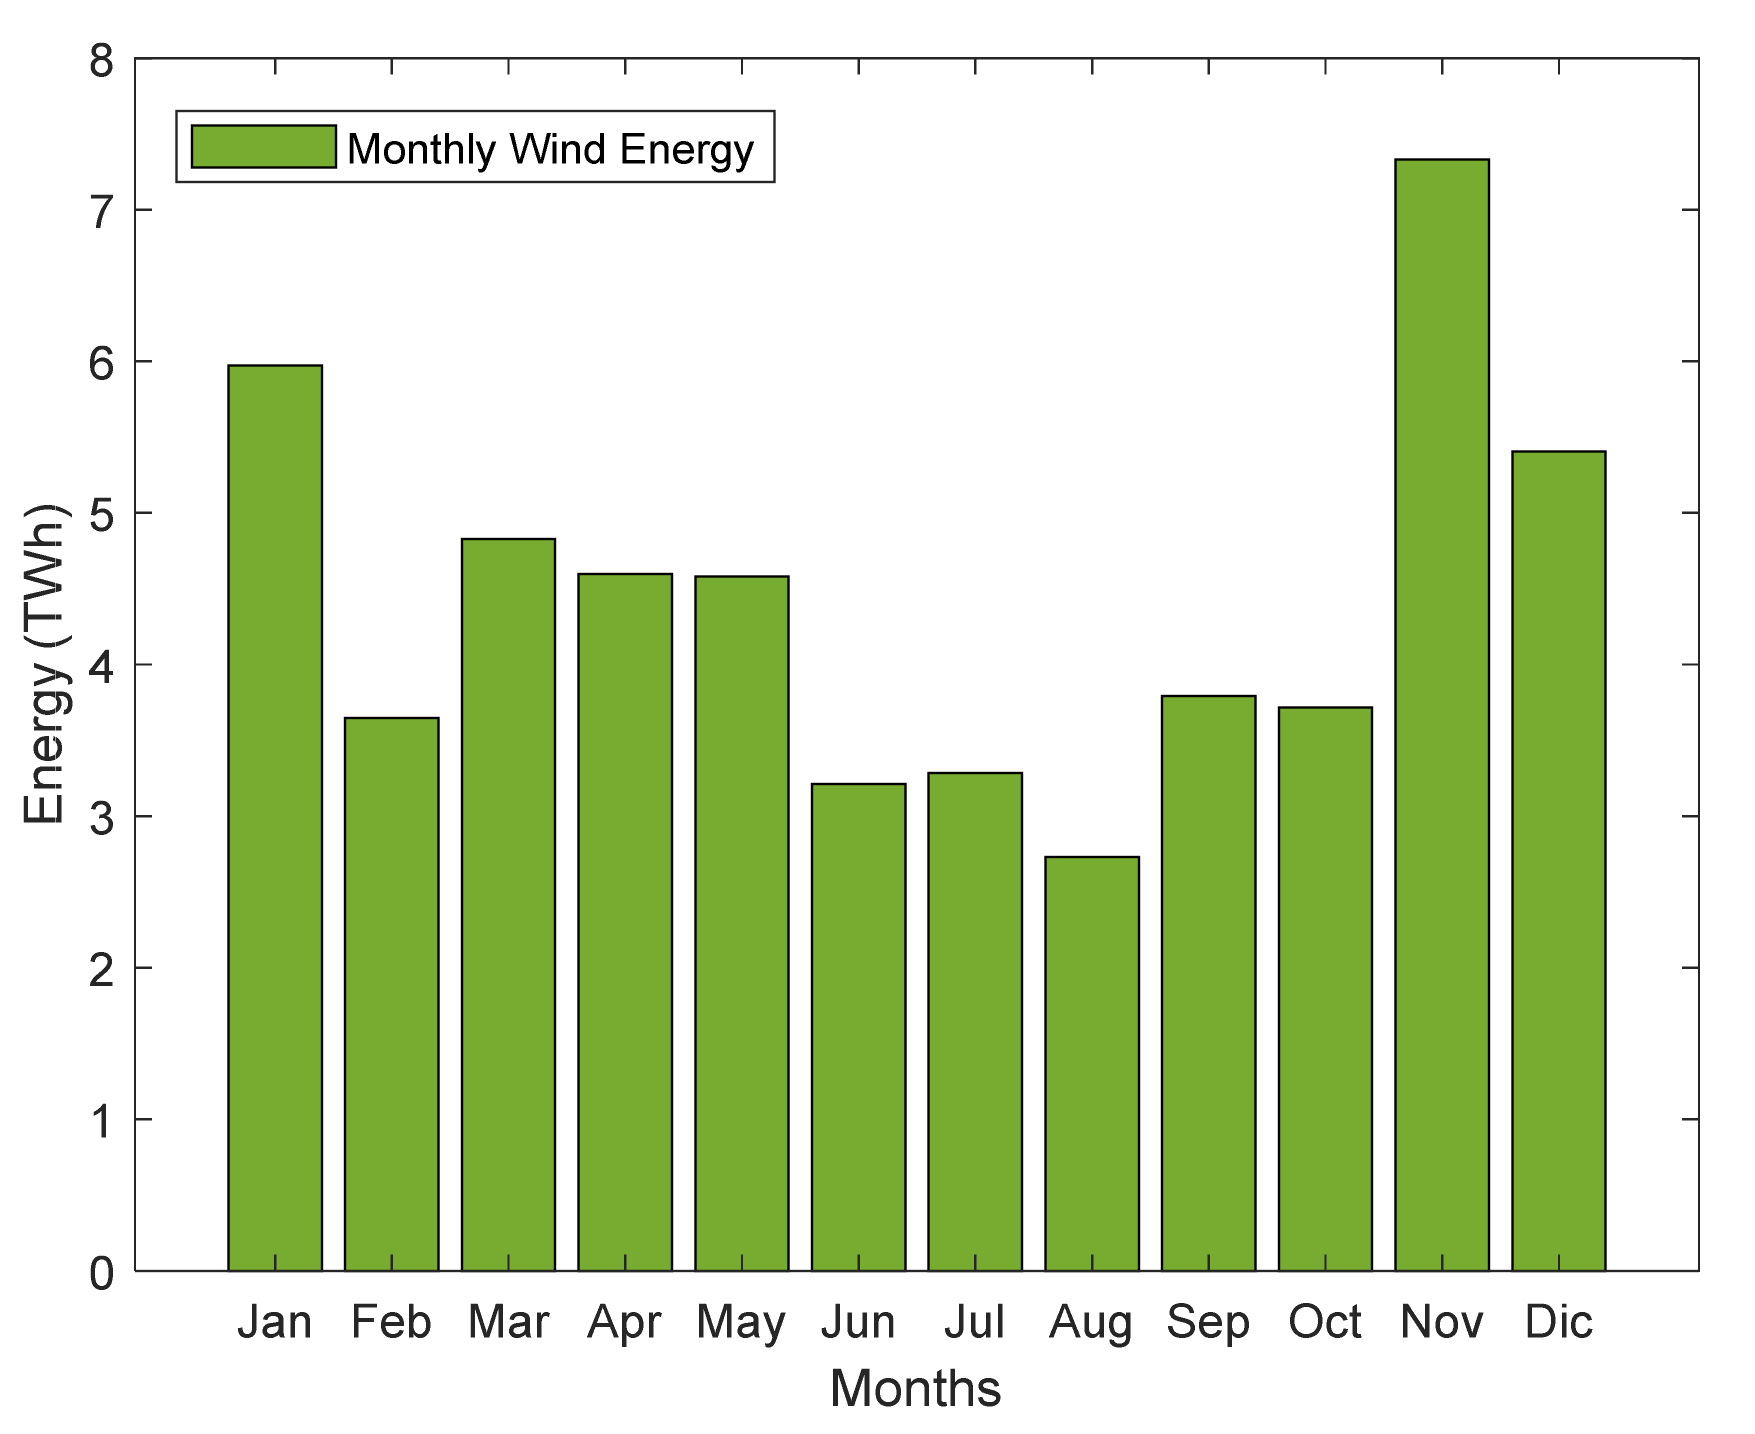
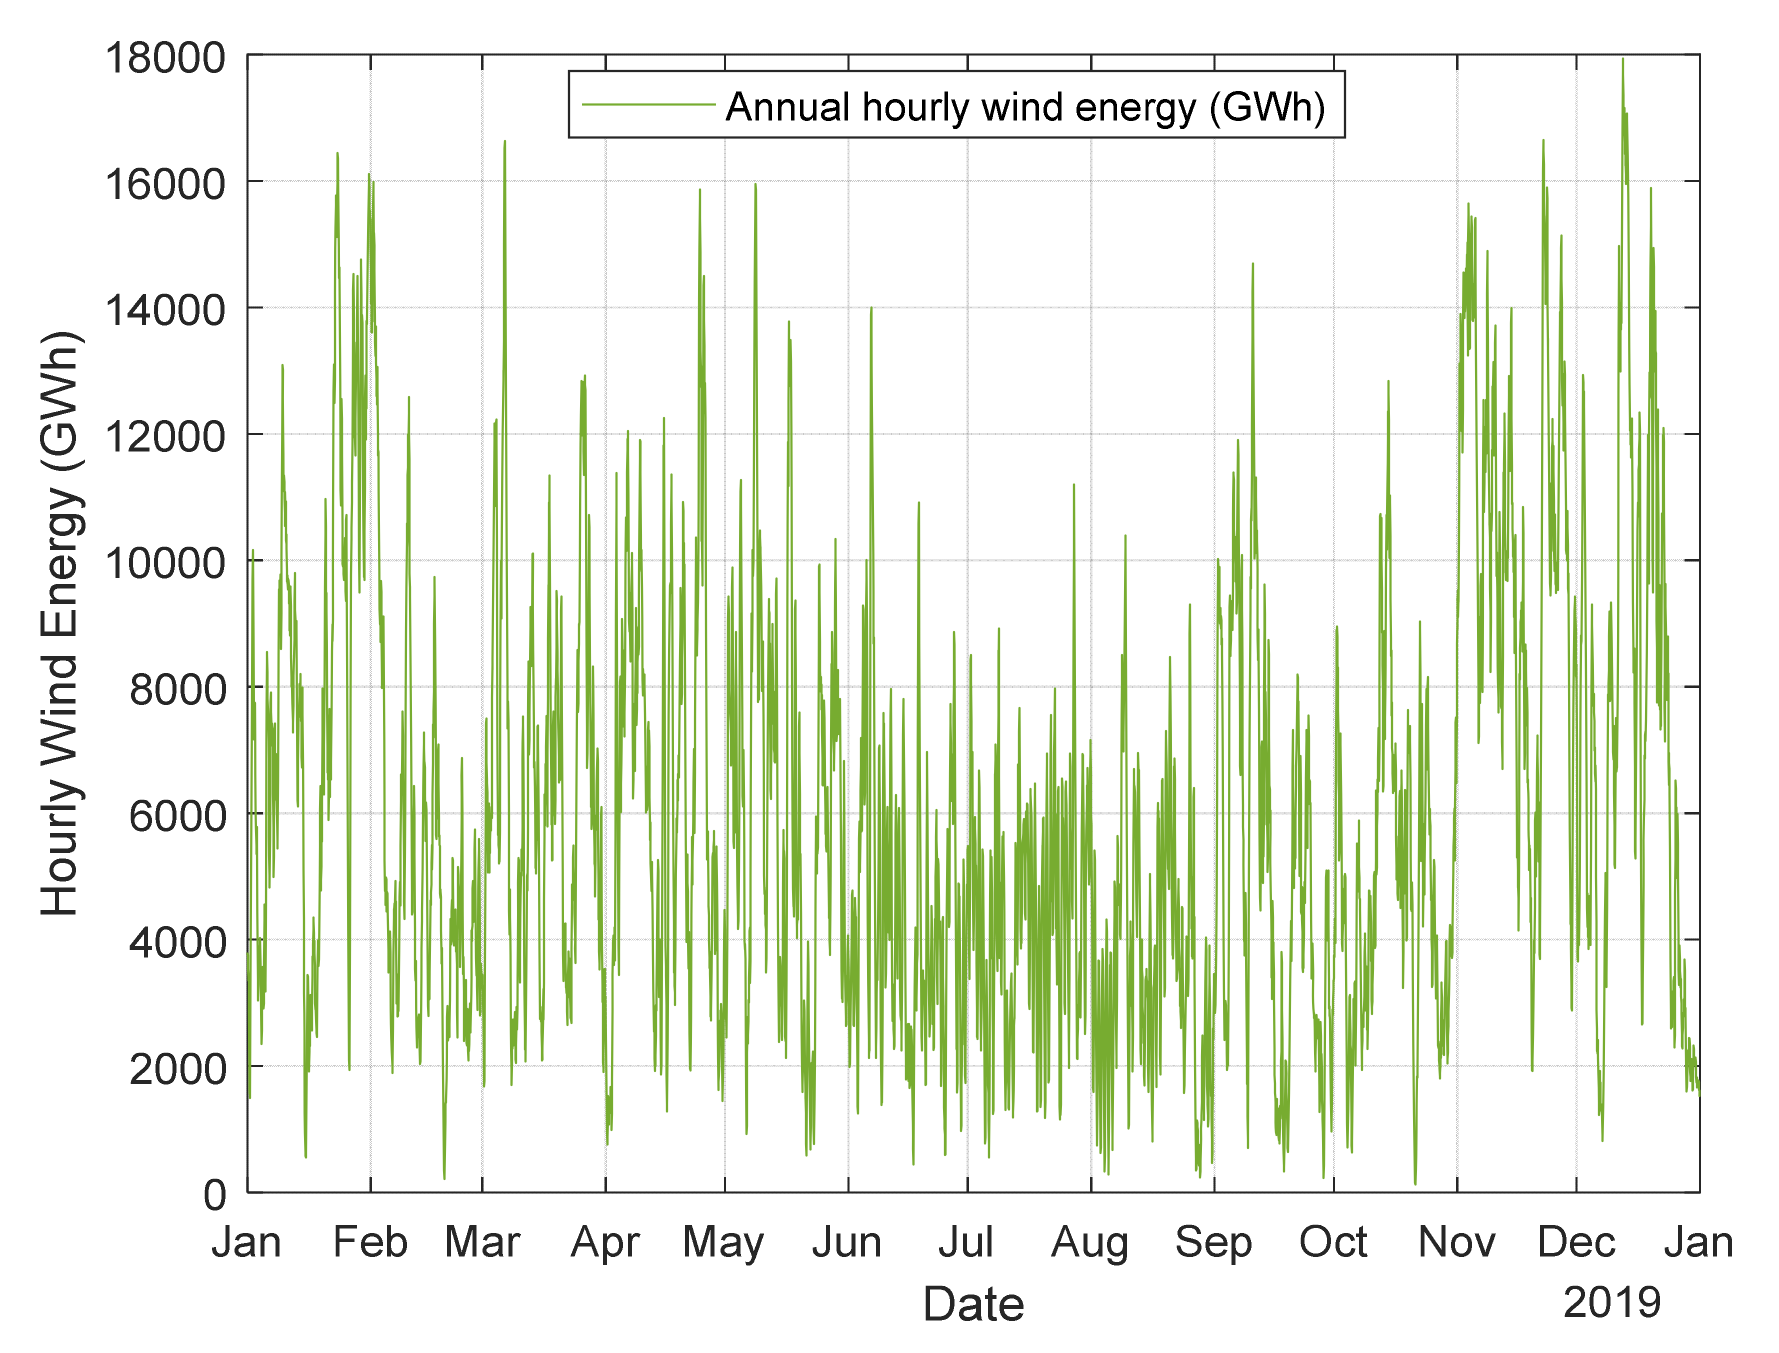
As was previously mentioned, the main problem of renewable energy is its variability.
Figure 6 shows the monthly production of wind generation in Spain in 2019, where seasonal non-regular dips are observed during summer months (June–August) [
40], while
Figure 7 presents the hourly wind energy variability over one year.
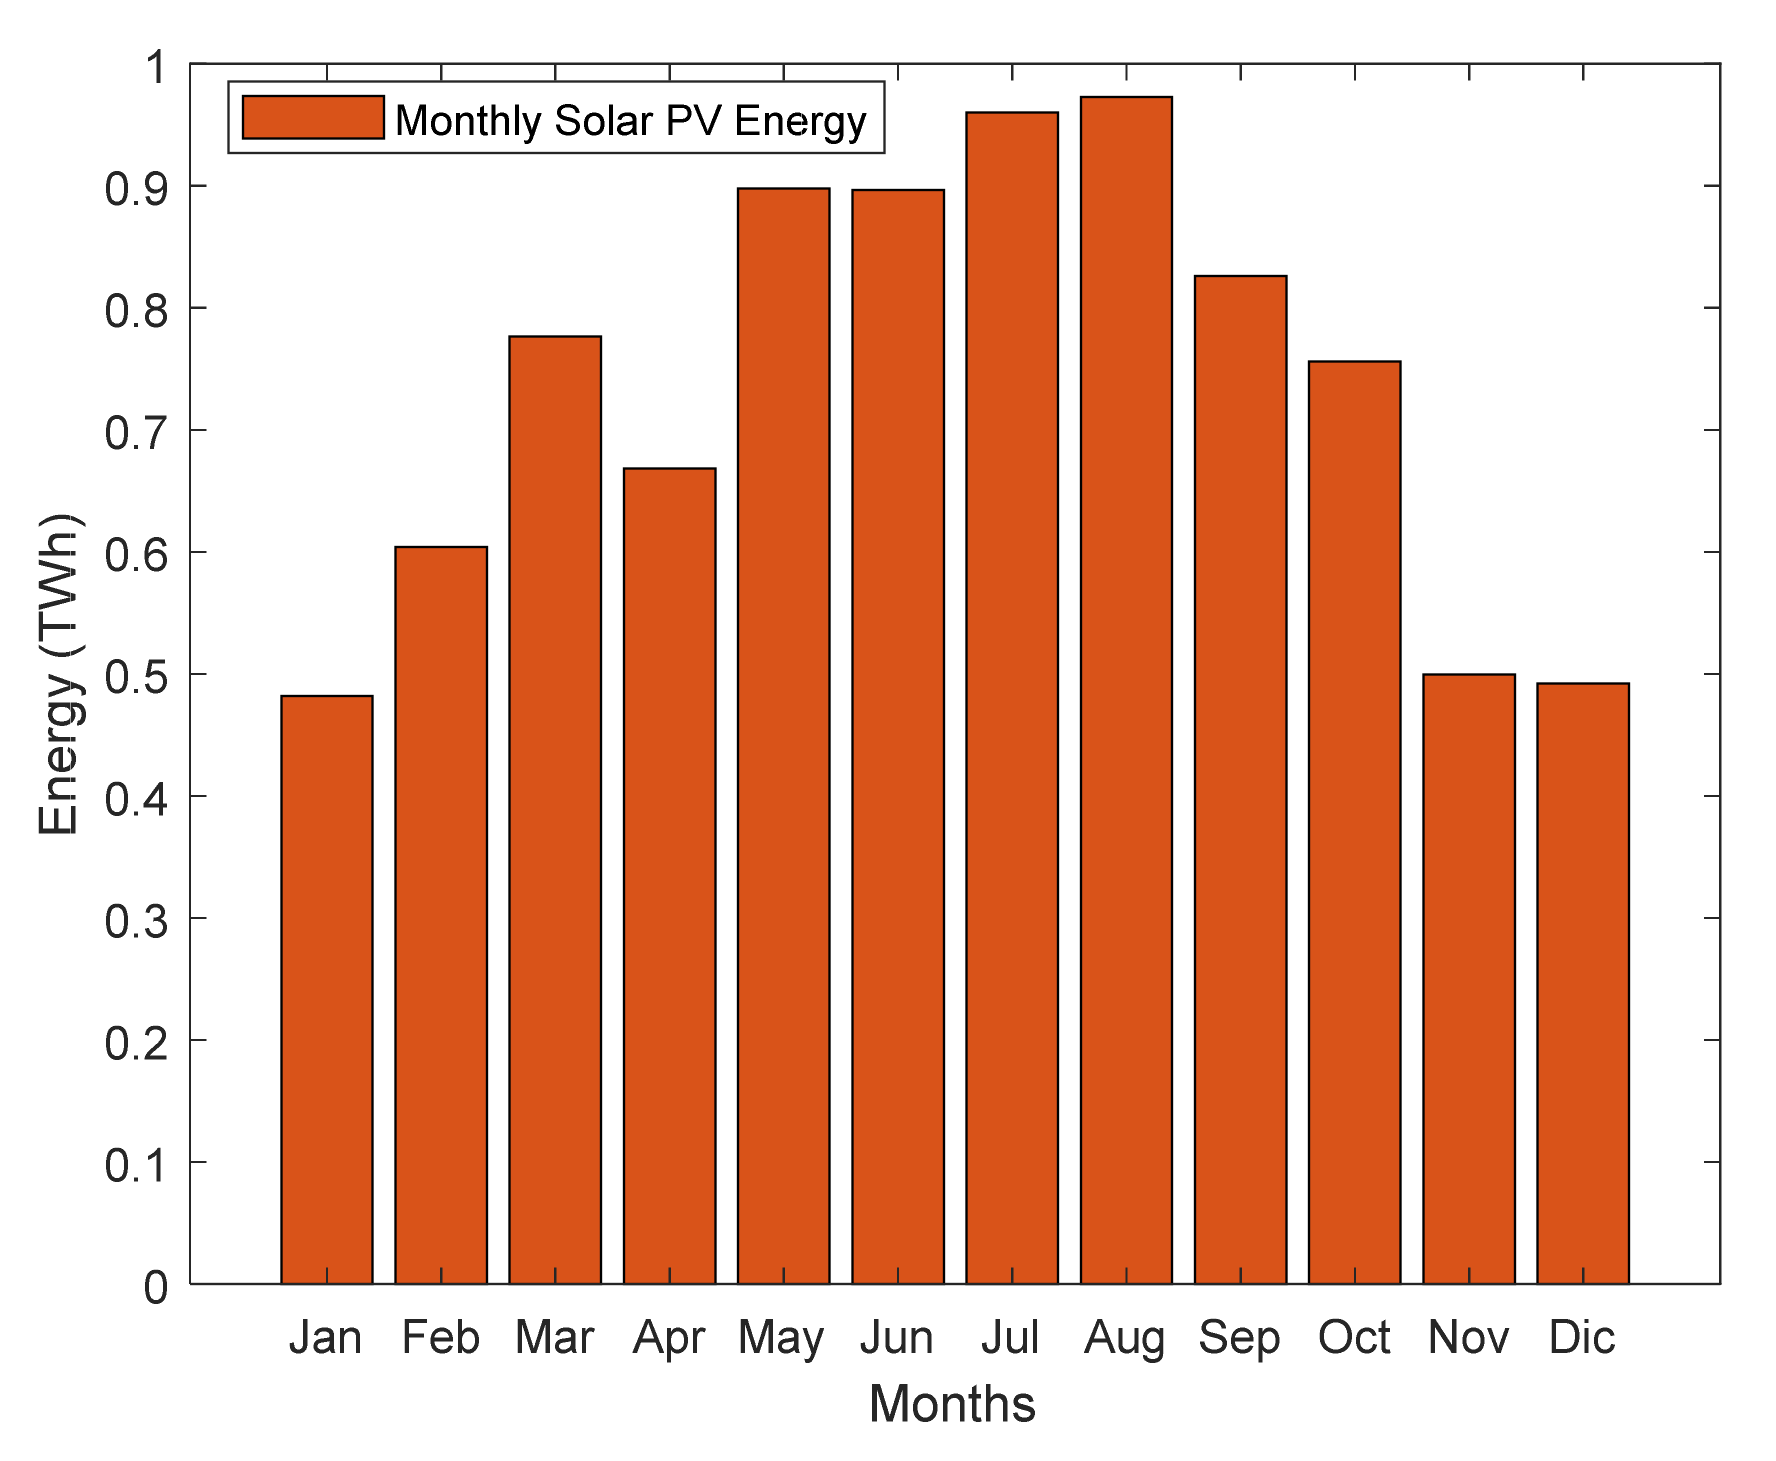
Figure 8 shows the monthly production of solar PV generation in Mainland Spain in 2019, where it is observed that the main production was reached during the summer months.
Hourly PV generation grows from dawn to noon, decreases until dusk, and is kept at zero during the night period. Moreover, PV generation also shows daily variation according to the available solar irradiation, which depends on different factors, such as seasonal and weather conditions [
41].
2.2. CO2 Emissions
According to [
42], CO
2 emissions by the Spanish power sector dropped to a record low of 49.6 million tons in 2019, down by 23% compared to the previous year’s levels. Around 62% of the total electricity generation was produced by CO
2-free emissions technologies (nuclear and renewables), and the share of coal never went above 5%, reaching the lowest point for this technology.
The global national emission factor has decreased from 0.29 tCO
2-eq/MWh in 2015 to 0.19 tCO
2-eq/MWh in 2019, which represents a reduction of more than 30% [
43].
CO
2 emission factors associated with each electricity generation technology used in this model are summarized in
Table 2, and their detailed calculations can be found in Annex I of [
44].
Four different types of coal are used in the Spanish coal-fired thermal power plants: bituminous coal, anthracite, and black and brown lignite, each corresponding to a specific CO2 emission factor. To determine the emission factor of all of these power plants as a whole, a weighting is carried out, taking into account the emission factors of each type of coal and the energy produced by each of them in the considered period. The average value for this generation technology is 0.95 tCO2-eq/MWh.
CCGT uses natural gas, a fuel with carbon content lower than coal, fuel, or diesel. For this reason, and its higher efficiency, this generation technology has an emission factor of 0.37 tCO2-eq/MWh—much lower than that of coal plants.
Hydropower plants, wind energy, and nuclear energy share the characteristics of not emitting CO2 to produce electricity since their operation does not require the combustion of fossil fuels; therefore, their emission factor is 0 tCO2-eq/MWh.
Cogeneration is an efficient technology to produce heat and electricity simultaneously. Several different technologies are used (natural gas turbines, natural gas engines, diesel engines, coal cogeneration, etc.); therefore, a weighted value of 0.37 tCO2-eq/MWh is assumed in this work.
In the case of waste combustion for electricity production, there is great heterogeneity in the used fuels; therefore, an average factor of 0.24 tCO
2-eq/MWh was chosen. Biomass and biogas waste are considered neutral from CO
2 emissions, in accordance with Regulation EU 601/2012 [
45].
This methodology considers CO2 emissions associated with the Mainland Spanish generation park exclusively. For this reason, the emissions associated with imported energy from other countries (Morocco, Portugal, and France) are not added to this study, and, for the same reason, the corresponding emissions from internationally exported energy are retracted.
4. Discussion
In this section, four different scenarios are analyzed. In the first scenario, all coal-fired thermal power plants installed in Mainland Spain are replaced by a combination of renewable generation (installing additional PV system) and ESS. In the second scenario, the cogeneration power plants are replaced.
In the third scenario, CCGT power plants are substituted and, finally, in the last scenario, all generation technologies that emit CO2 are replaced (including waste power plants, which, due to their low contribution to the generation mix, have not been previously considered in any specific scenario).
4.1. Replacement of Coal-Fired Thermal Power Plants
According to current generation mix coverage shown in
Figure 3, 2019 marked the historically lowest contribution to the mix of coal-fired thermal power plants. Additionally, they are the most pollutant generation plants, with an average value of 0.95 tCO
2-eq/MWh (see
Table 2); therefore, the first option is to substitute all of these types of power plants by a combination of PV and ESS.
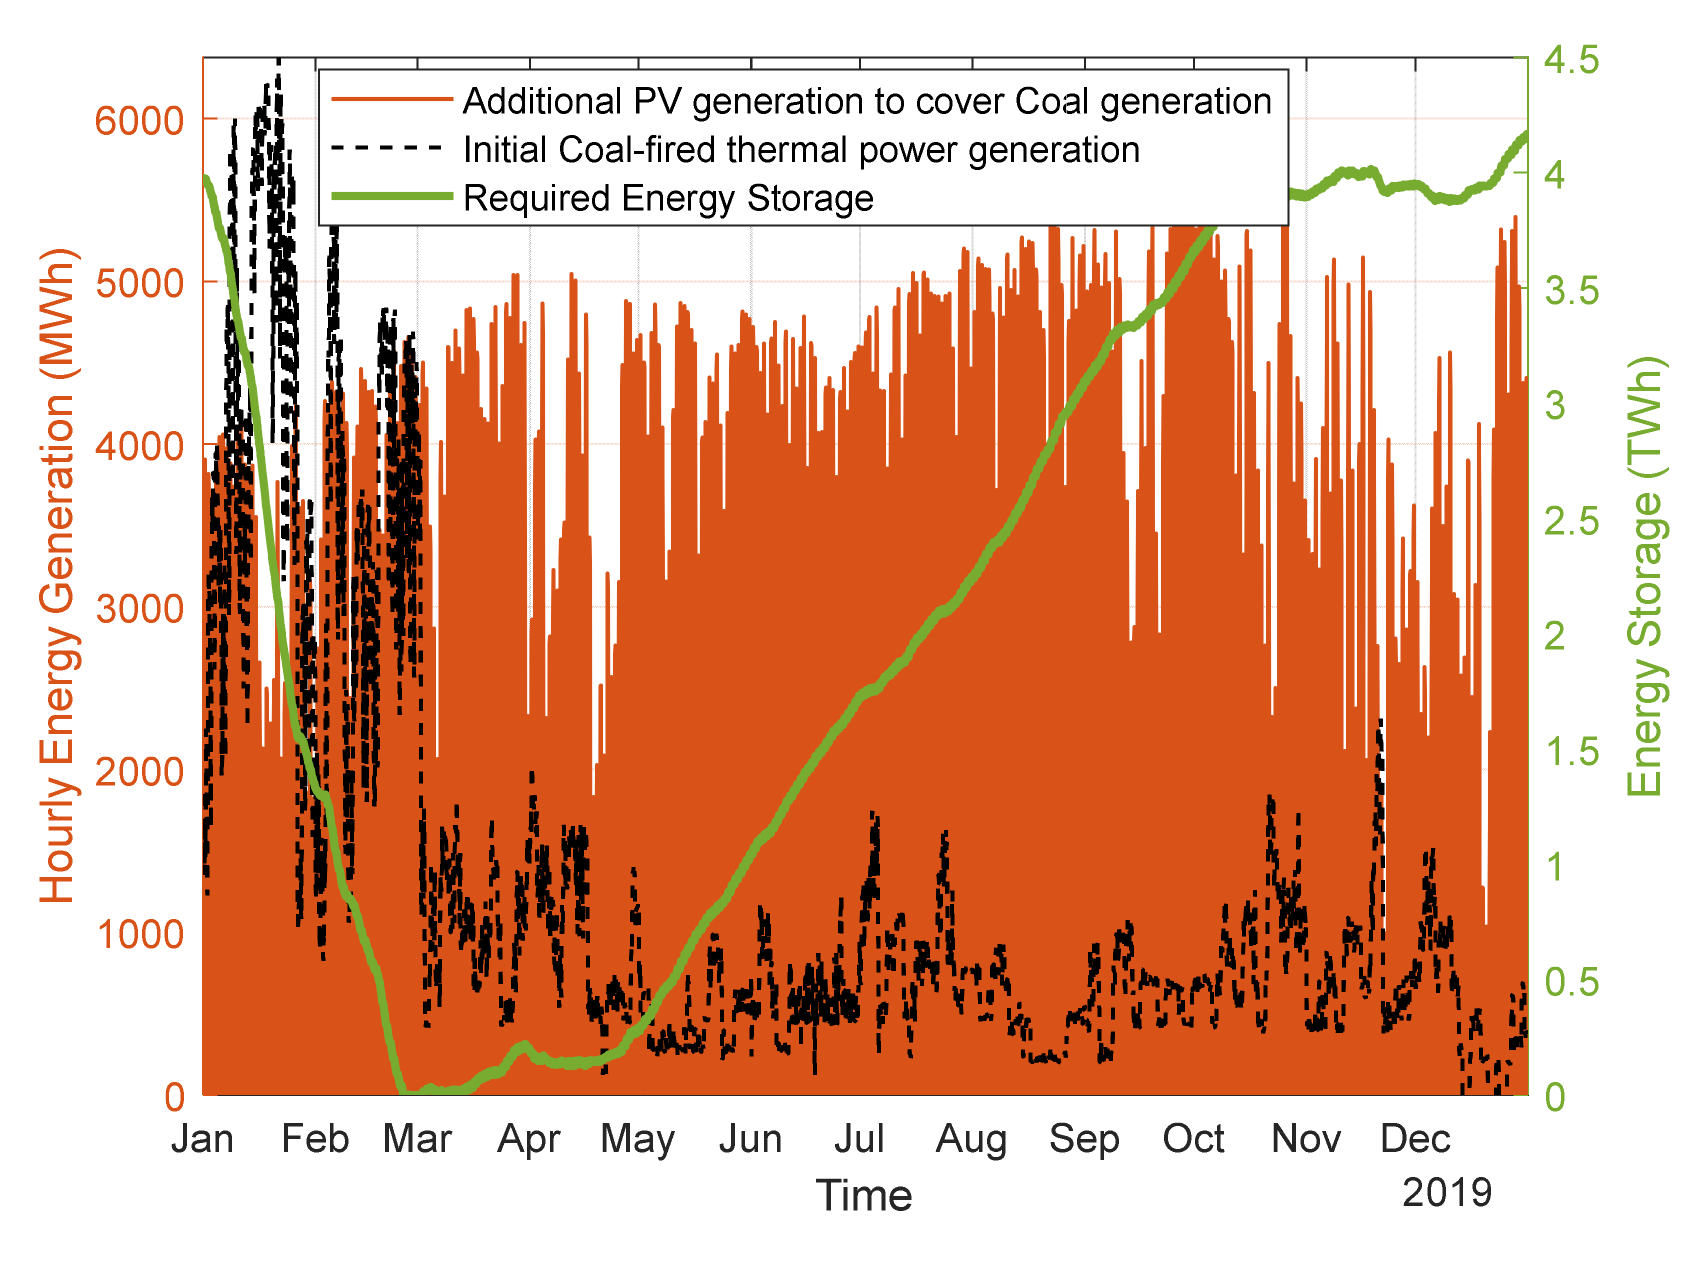
The annual produced energy with coal generation technology was 10.67 TWh in 2019. After applying the two-stage algorithm described in
Section 3, the additional PV required to cover this demand will be 11.49 GW.
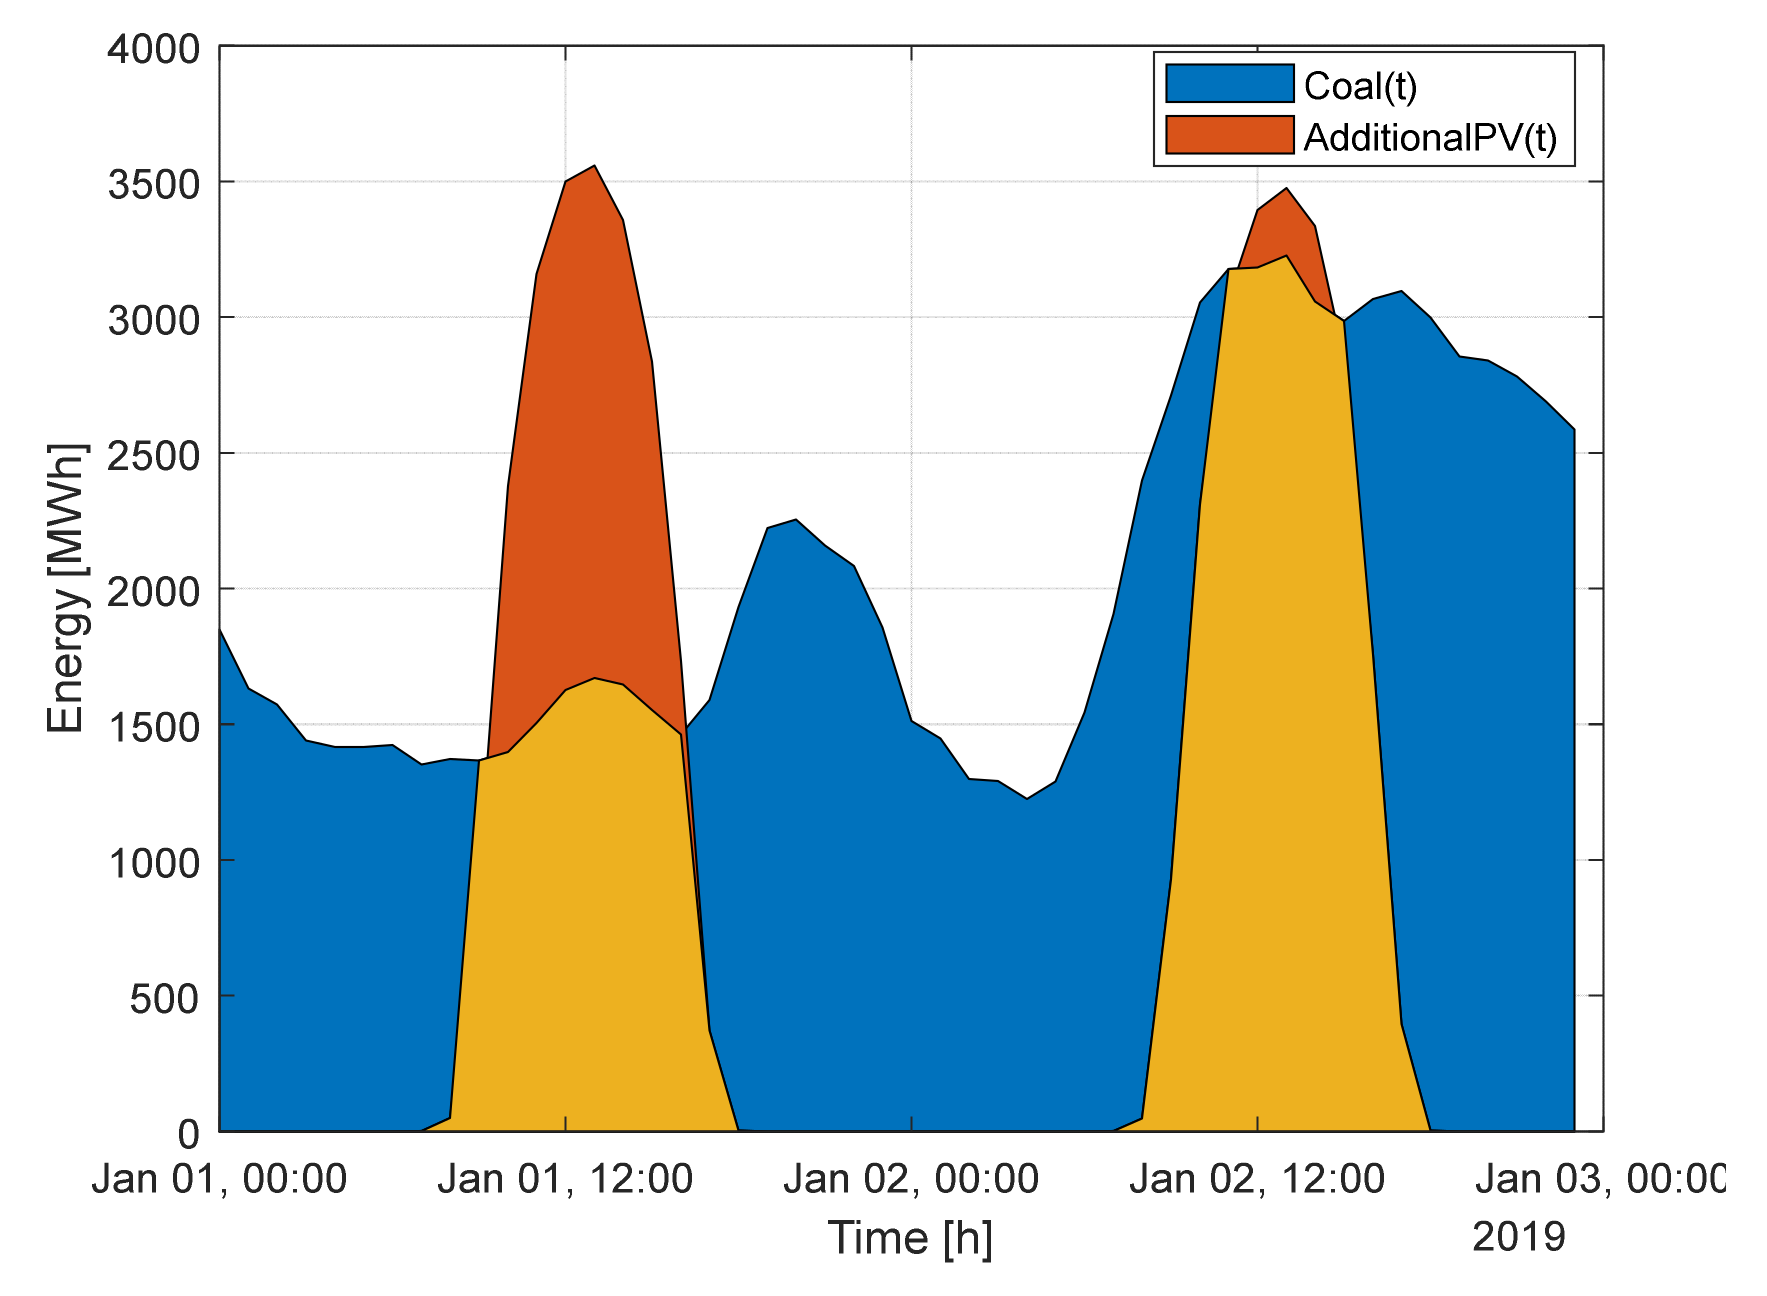
When analyzing
Figure 11, it is observed that the initial coal energy generation was very high in the first two months but suffered a sudden reduction on March 2nd. The hourly mean value until that date was 3.7 GWh, and then it was reduced to 0.716 GWh from that point to the end of the year. For this reason, the ESS must be initialized with 3.78 TWh, which is completely depleted in March. Since then, the additional PV system can cover the demand and recharge ESS, reaching a maximum of 4.18 TWh stored at 17:00 h on 31 December 2019.
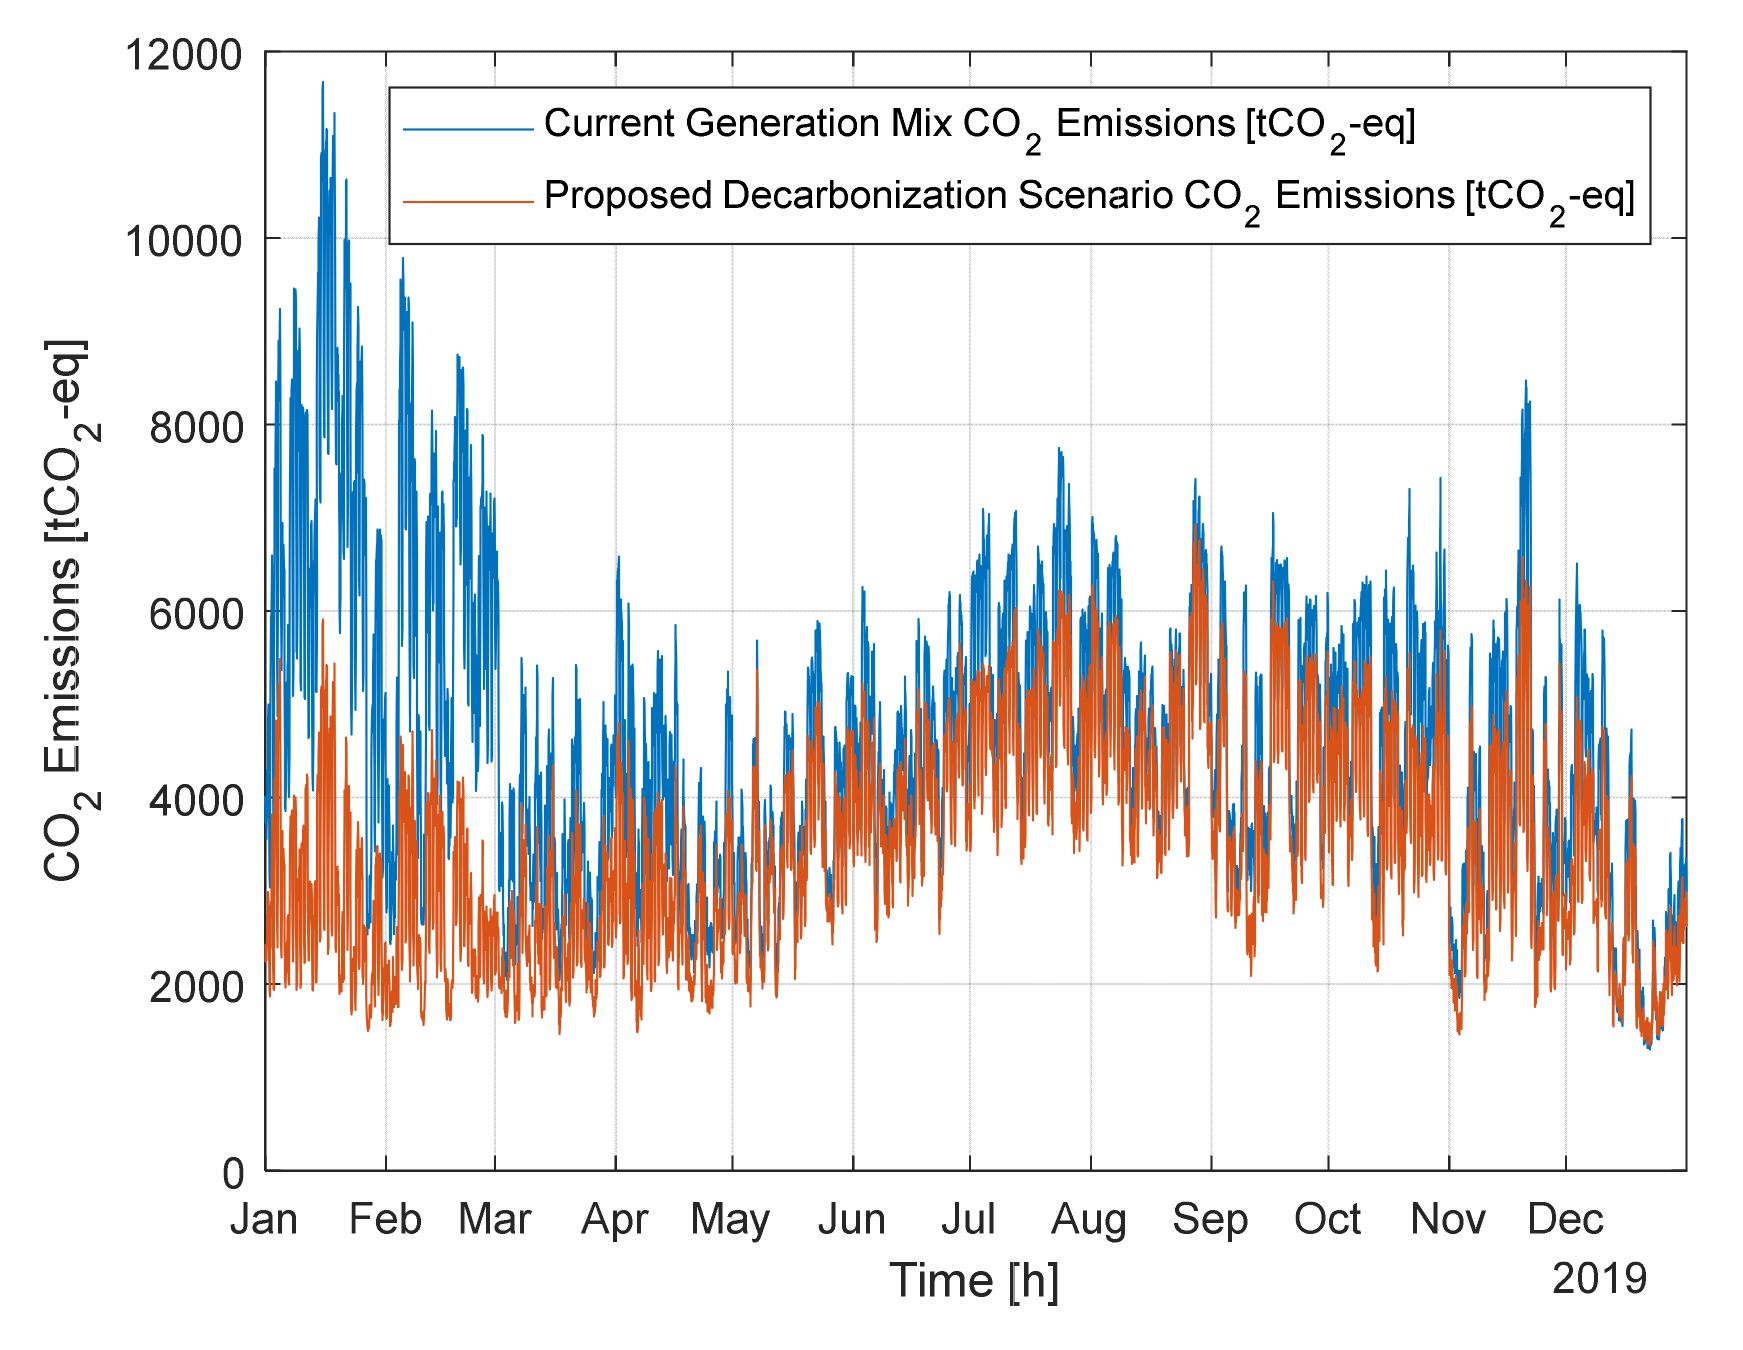
Figure 12 presents the hourly CO
2 emissions during 2019, with the current generation mix (blue) and after substituting coal-fired thermal power plants (orange). We can observe an annual reduction of 32.9%, going from the initial 40.9 megatons (Mt) to 30.8 Mt.
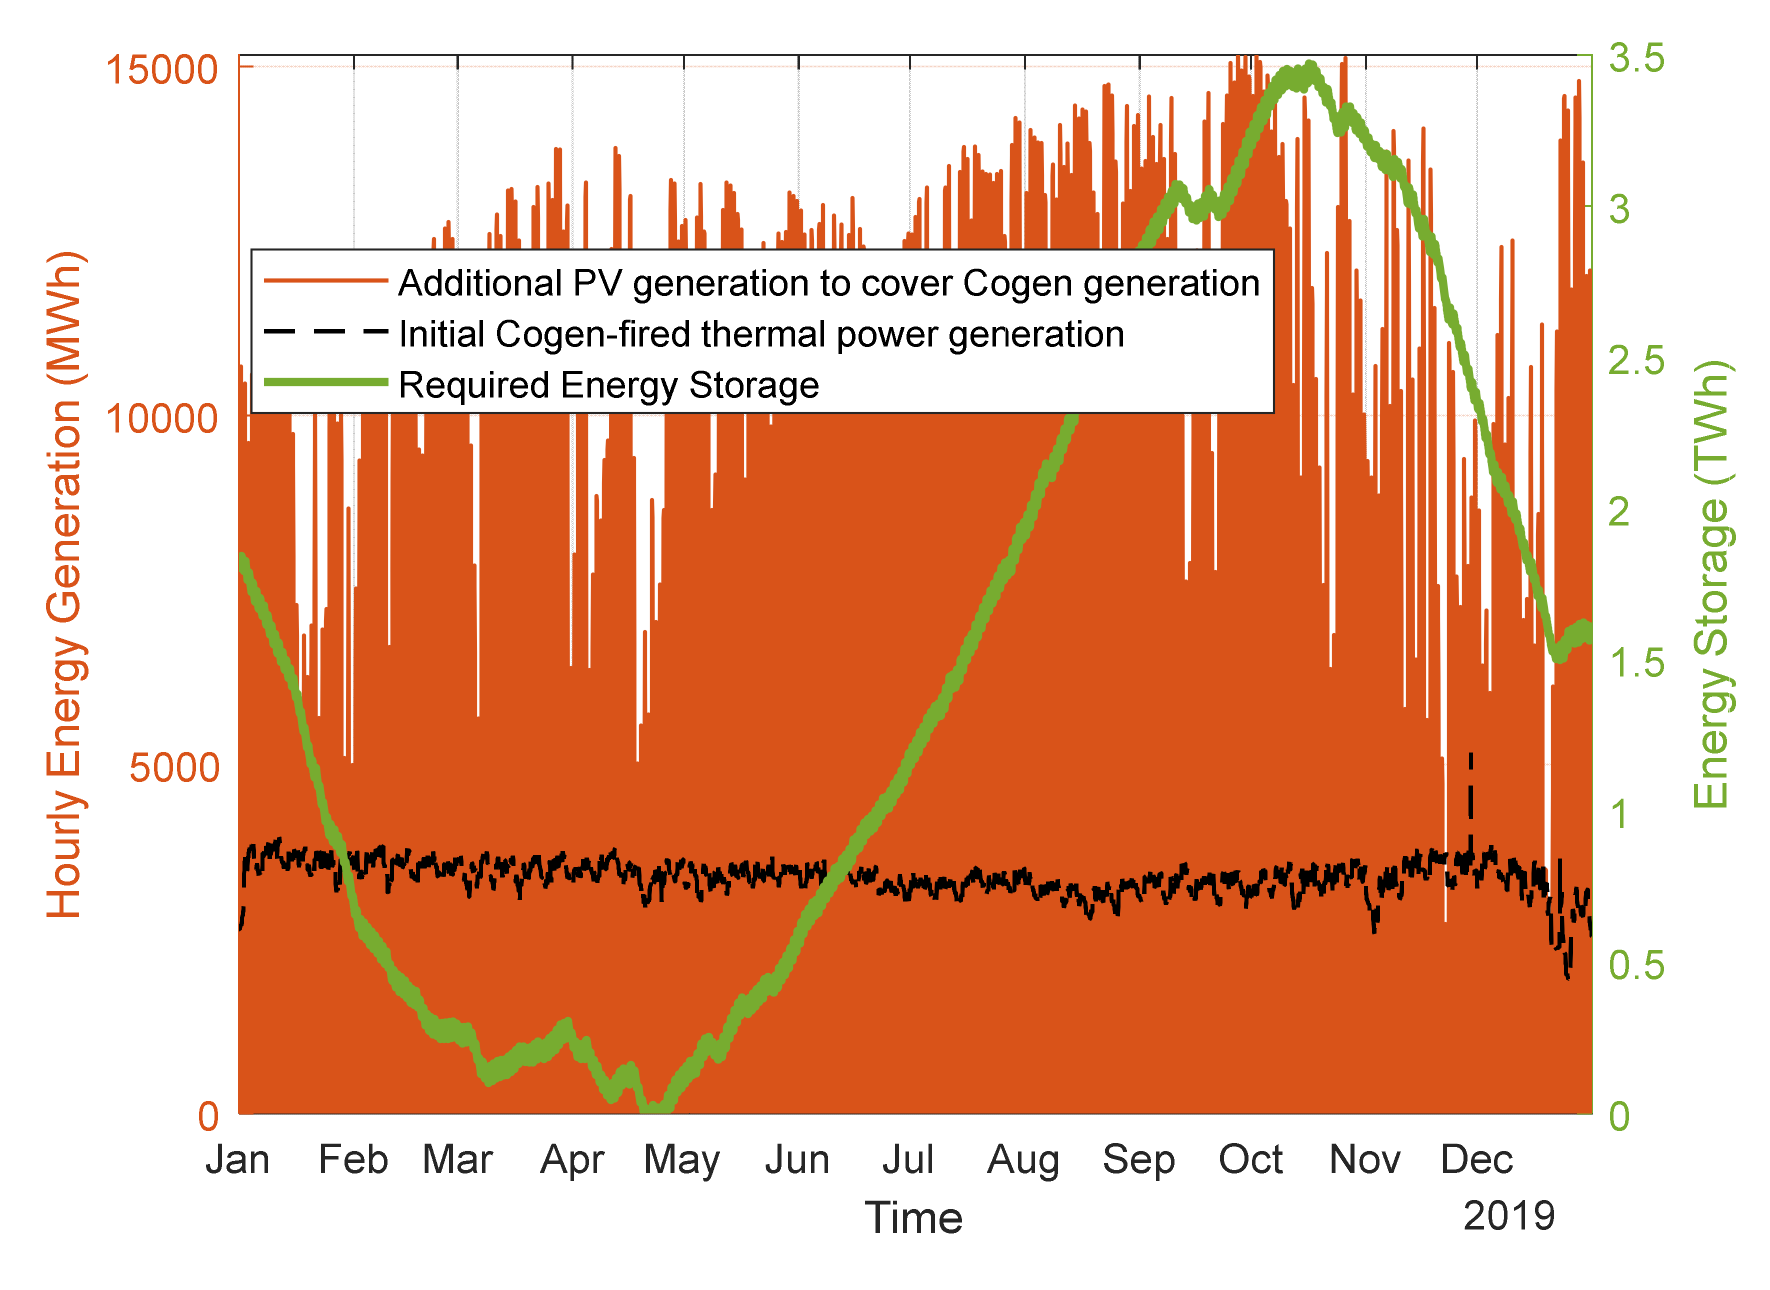
4.2. Replacement of Cogeneration Power Plants
The next-generation technology that contributes to the current generation mix with CO2 emissions is cogeneration power plants.
In 2019, the annual produced energy with cogeneration technology was 29.58 TWh; therefore, the additional PV required to cover this demand will be 31.5 GW.
Figure 13 presents the hourly generation of cogeneration power plants and the additional installed PV. It is observed that the cogeneration is more stable, with a mean value of 3.37 GWh throughout the year. The ESS is initialized with 1.80 TWh and reaches its maximum value of 3.45 TWh at 16:00 on 15 October 2019, and it is completely empty at the beginning of May.
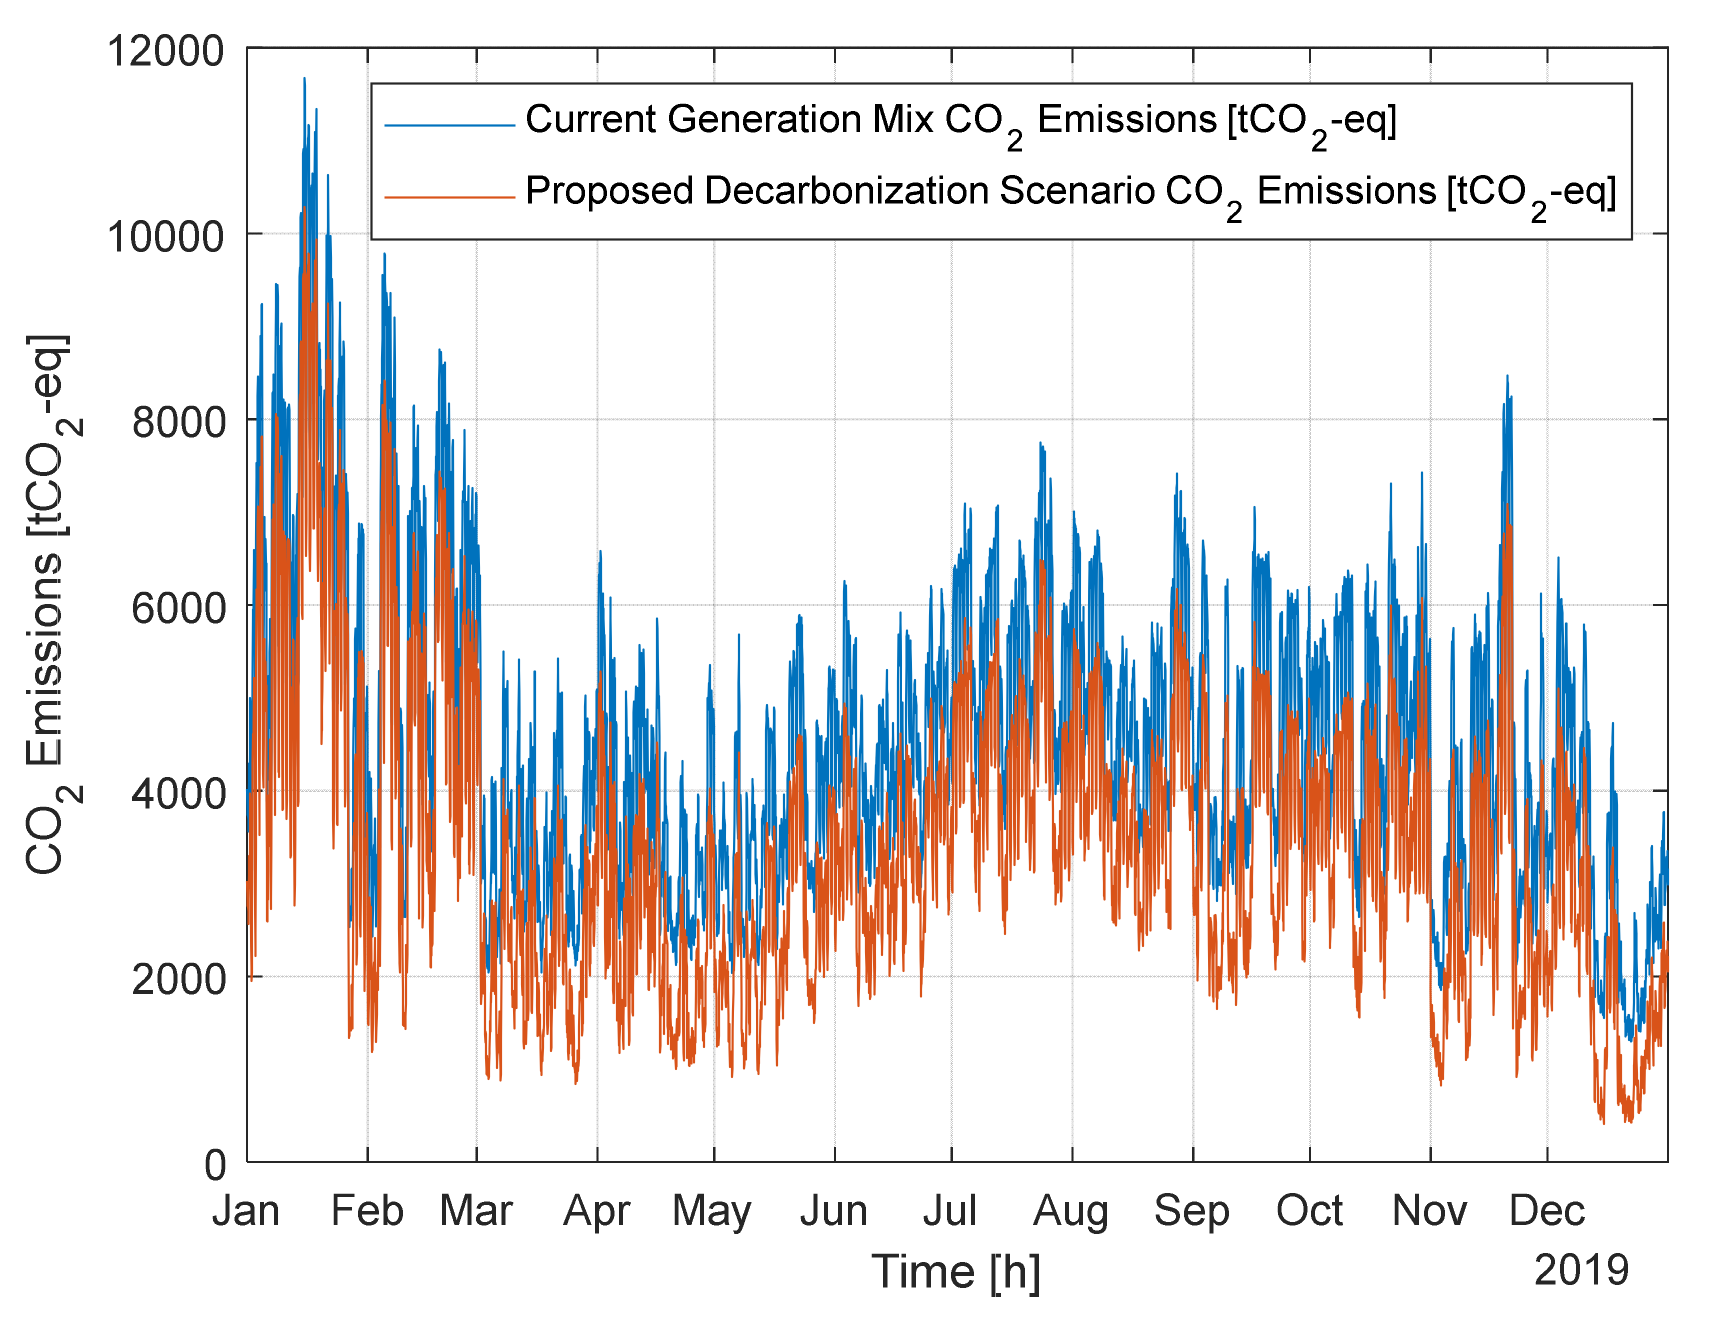
Figure 14 presents the hourly CO
2 emissions during 2019, with the current generation mix (blue) and after substituting cogeneration power plants (orange); in this second scenario, the annual reduction is 36.5%, reaching 30.0 Mt CO
2-eq.
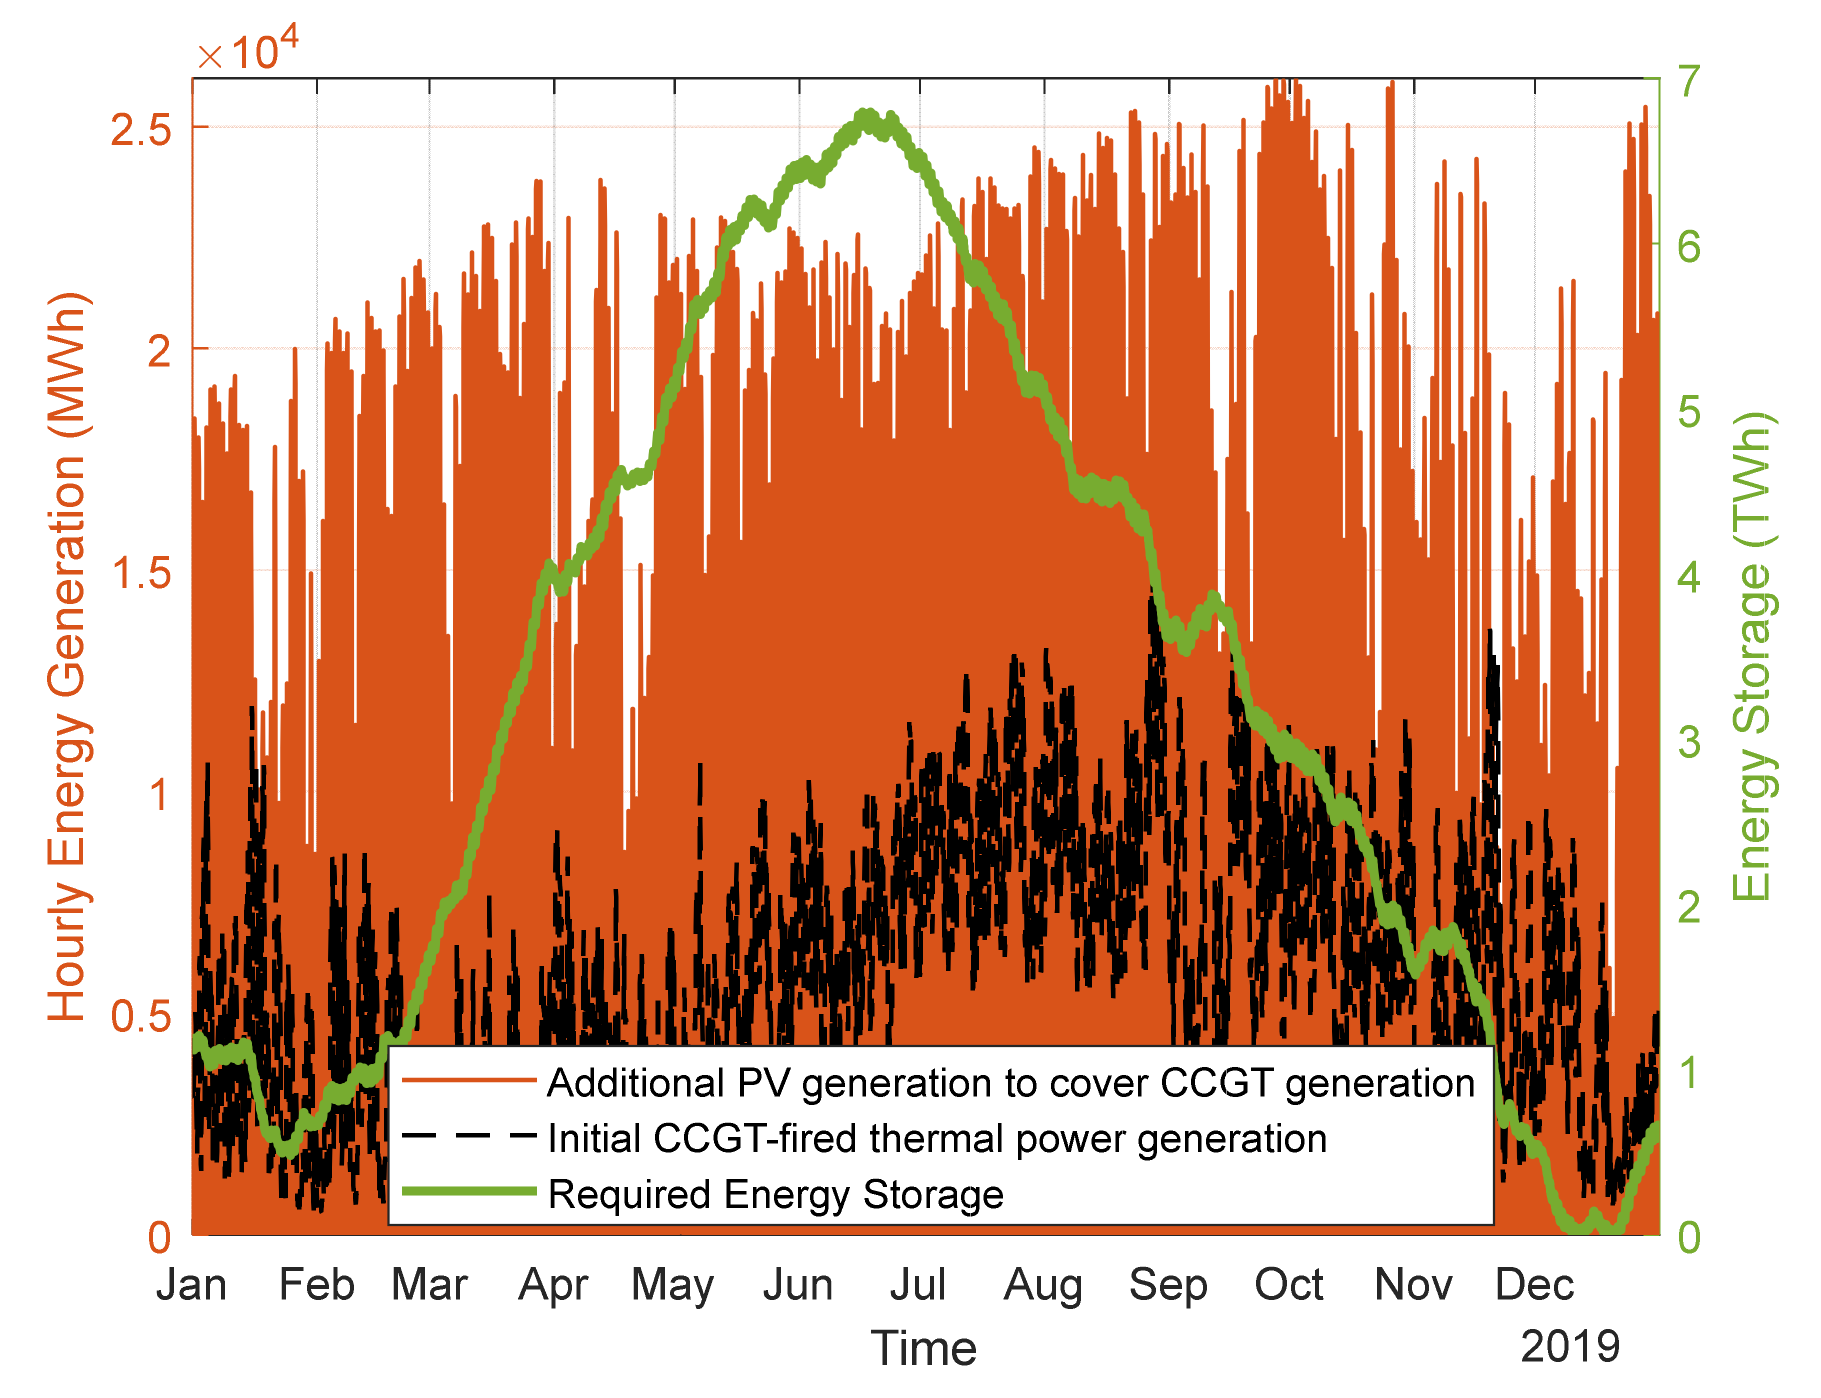
4.3. Replacement of CCGT Power Plants
The fossil generation technology that contributes the most to the current Spanish generation mix is CCGT (with a 20.5%), being one of the polluting technologies with the lowest CO2 emissions per MWh (0.37 tCO2-eq/MWh).
In 2019, the annual produced energy with CCGT power stations was 51.14 TWh, requiring an additional PV installation of 54.2 GW.
The hourly generation profile of CCGT power plants is not constant throughout the year (see the black dot line in
Figure 15). It is lower in the first six months, reaching a minimum in February–March, and then the generation is increased in the summer months, before falling again at the end of the year. The mean value is 5.84 GWh. Due to the fact that CCGT generation is lower at the beginning of the year, it is not necessary to initially store so much energy to cover this generation; therefore, the storage system is initialized to 1.15 TWh. The maximum value of 6.8 TWh is reached at 17:00 on 18 June 2019, and this ESS is depleted in December.
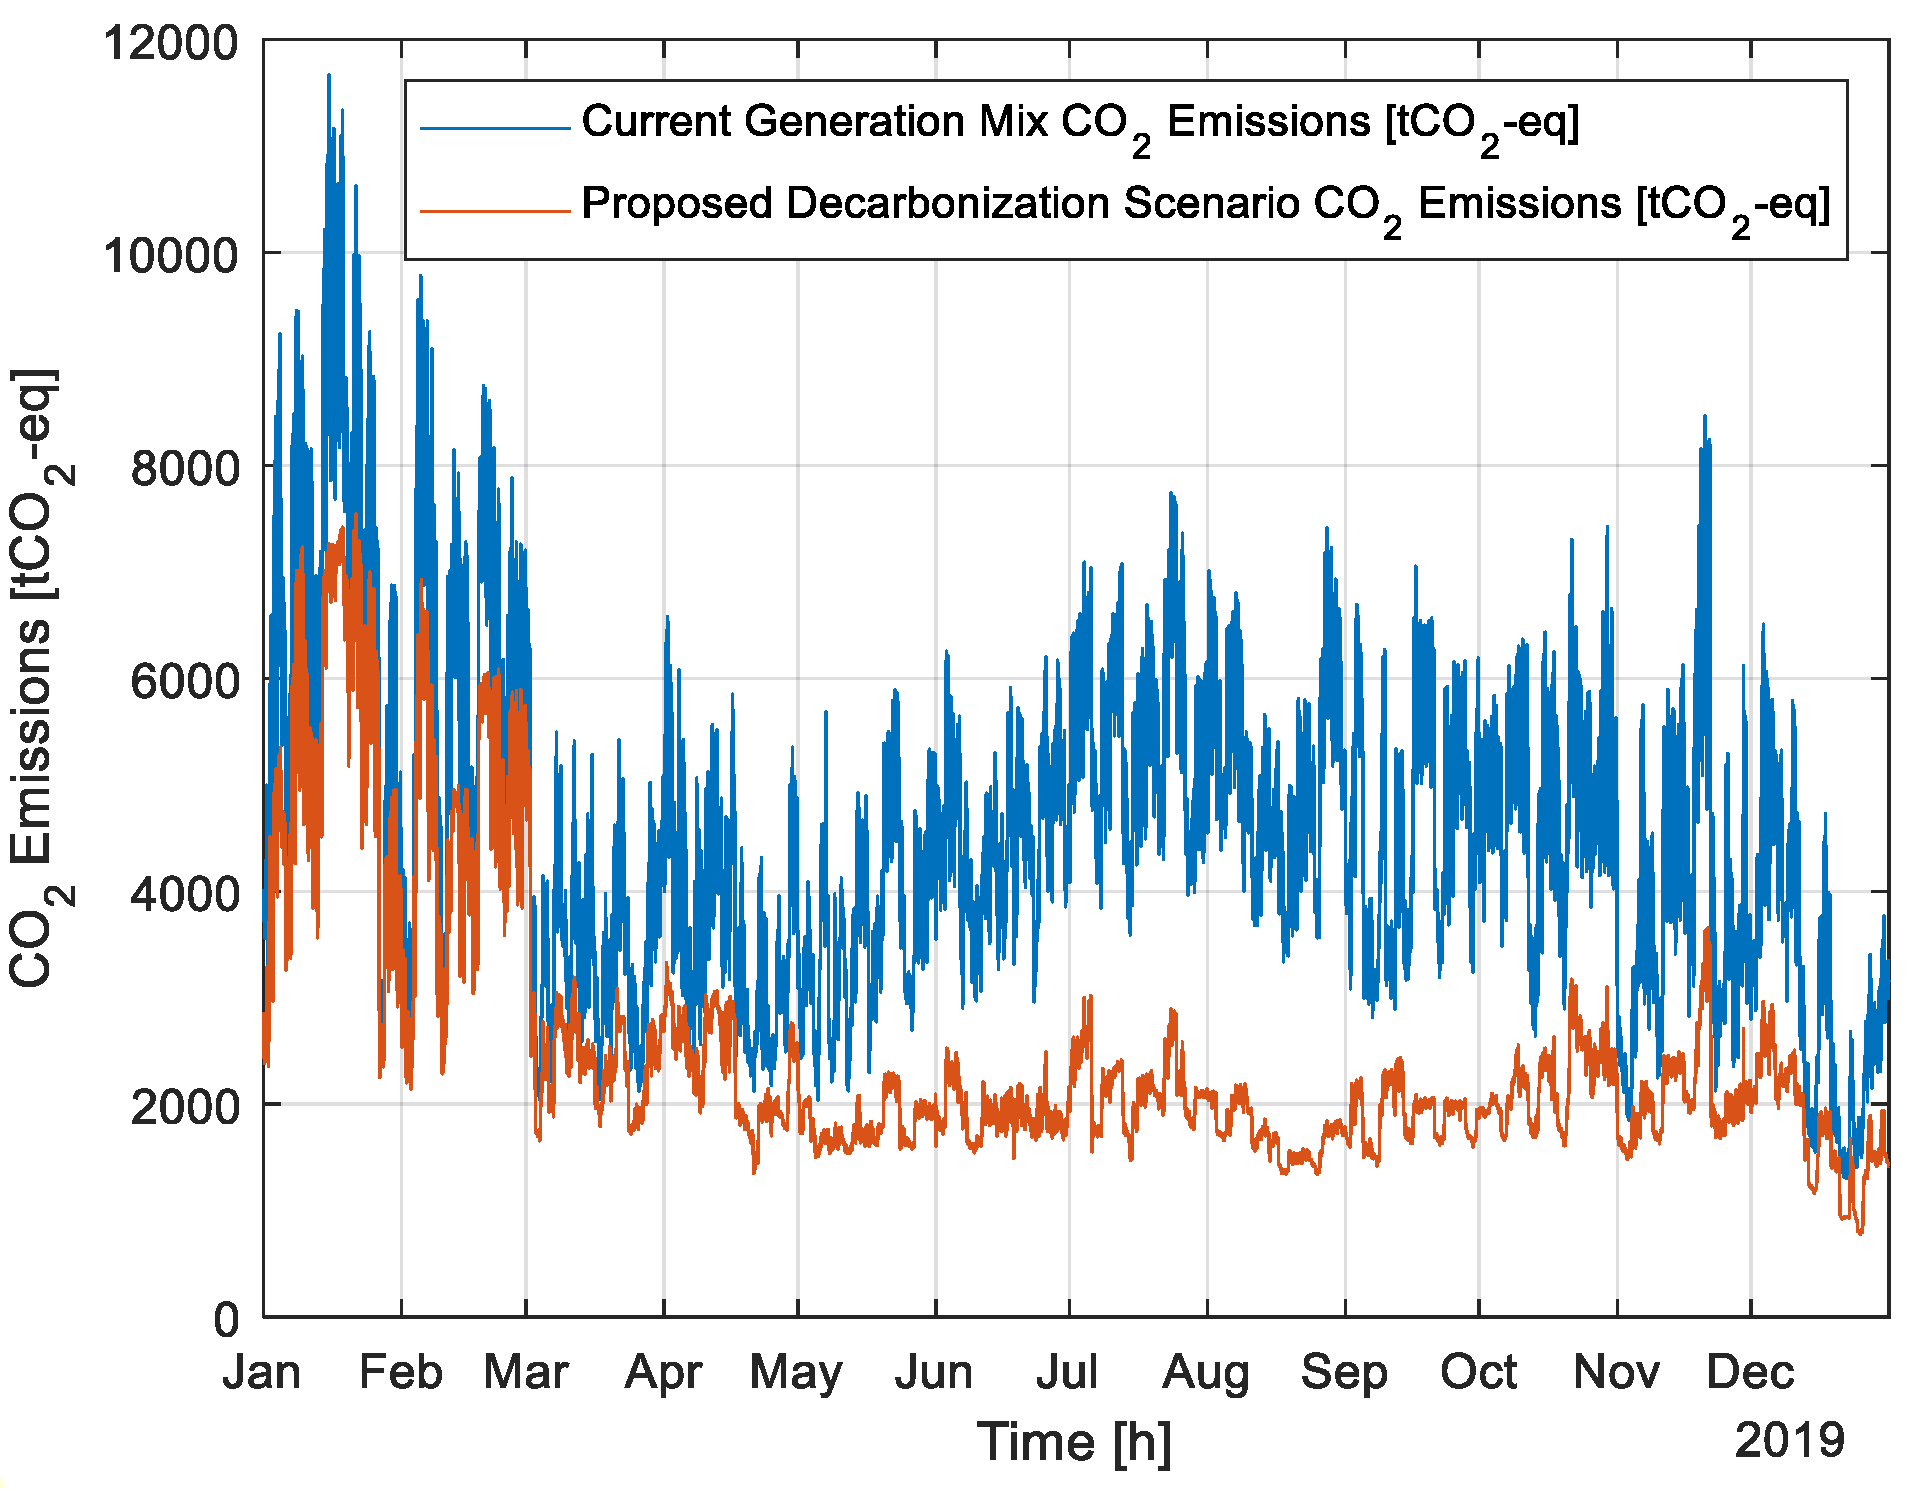
Hourly CO
2 emissions during 2019 with the current generation mix (blue) and after substituting CCGT power plants (orange) are presented in
Figure 16. In this third scenario, the annual reduction is 85.88%, reaching 22 Mt CO
2-eq.
4.4. Replacement of All CO2 Emitting Power Plants
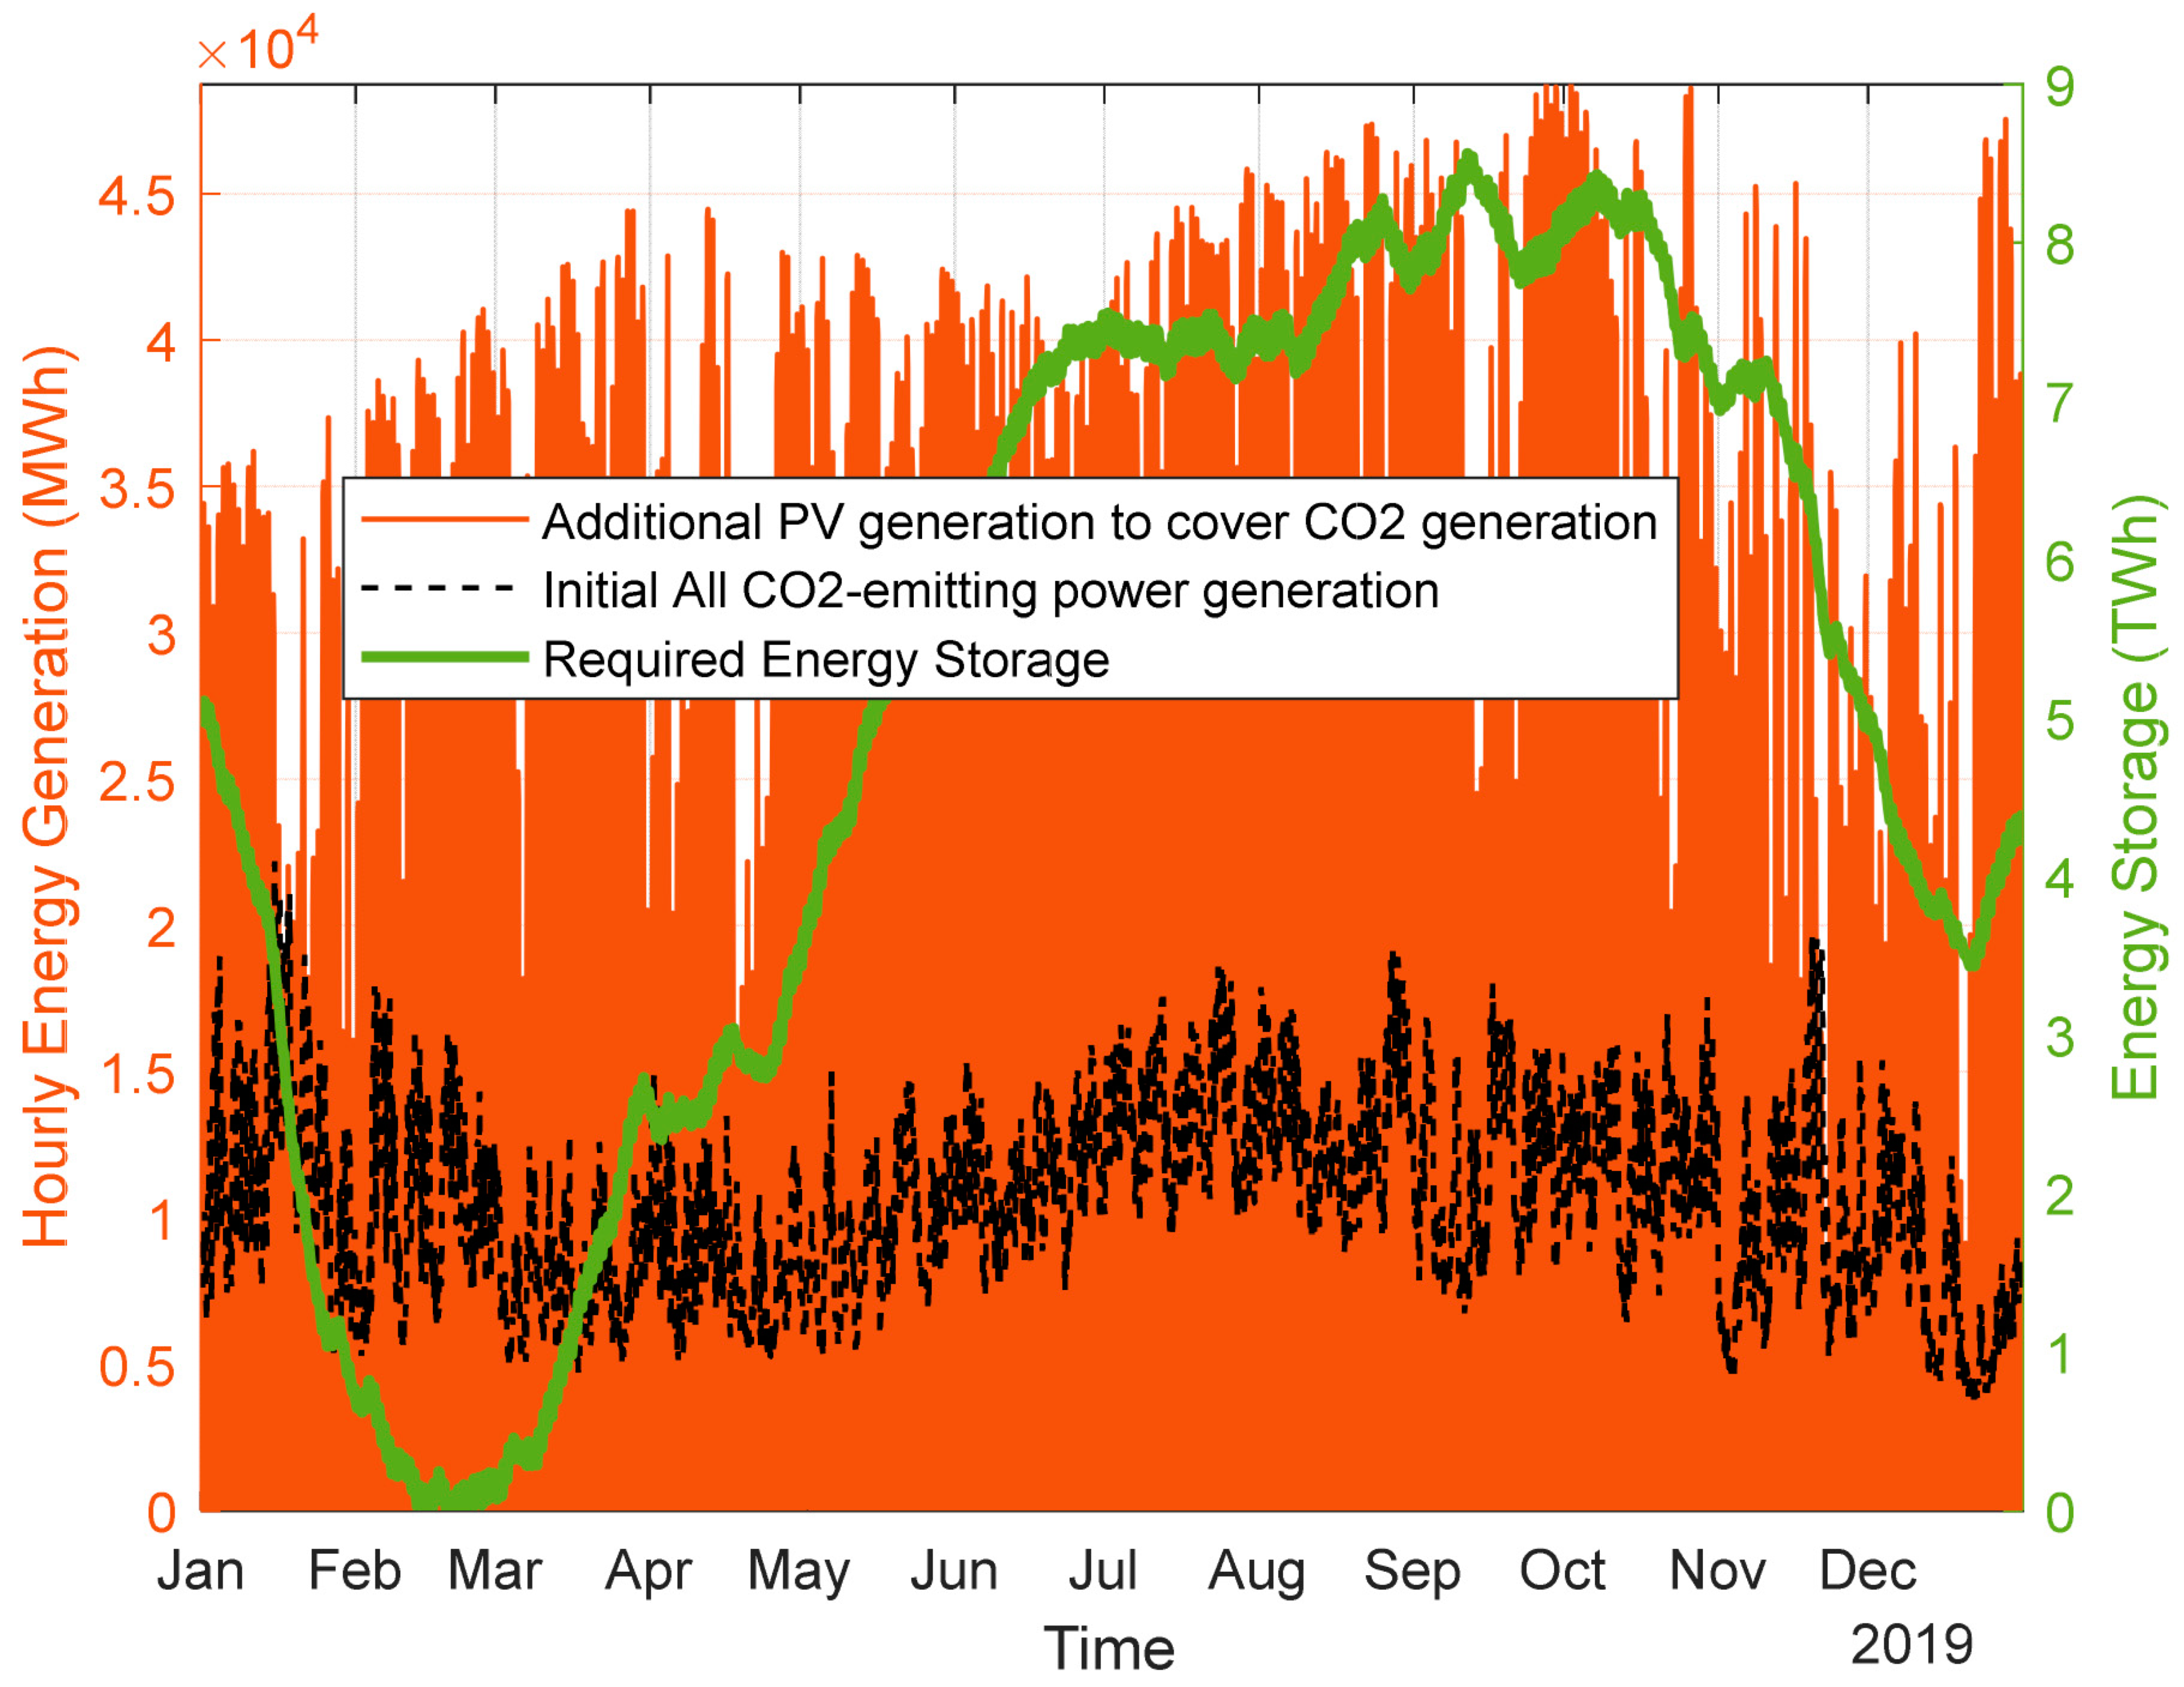
In this last scenario, all generation technologies that emit CO2 are replaced. The annual produced energy with these technologies was 95.34 TWh, thus requiring an additional PV installation of 101.24 GW, which is the current total installed capacity.
The hourly generation profile of CO
2 emitting power plants is not constant throughout the year (as it is shown in
Figure 17), varying around the mean value of 10.88 GWh. It begins with a generation increase in the first two months, decreasing in April and May, increasing again in August and September, and finally decreasing at the end of the year.
In this fourth scenario, the storage system is initialized to 5.1 TWh. The maximum value of 8.56 TWh is reached at 17:00 on 11 September 2019, and it reaches the lowest value in December.
In this final scenario, the annual CO
2 emissions reduction reaches 100%.
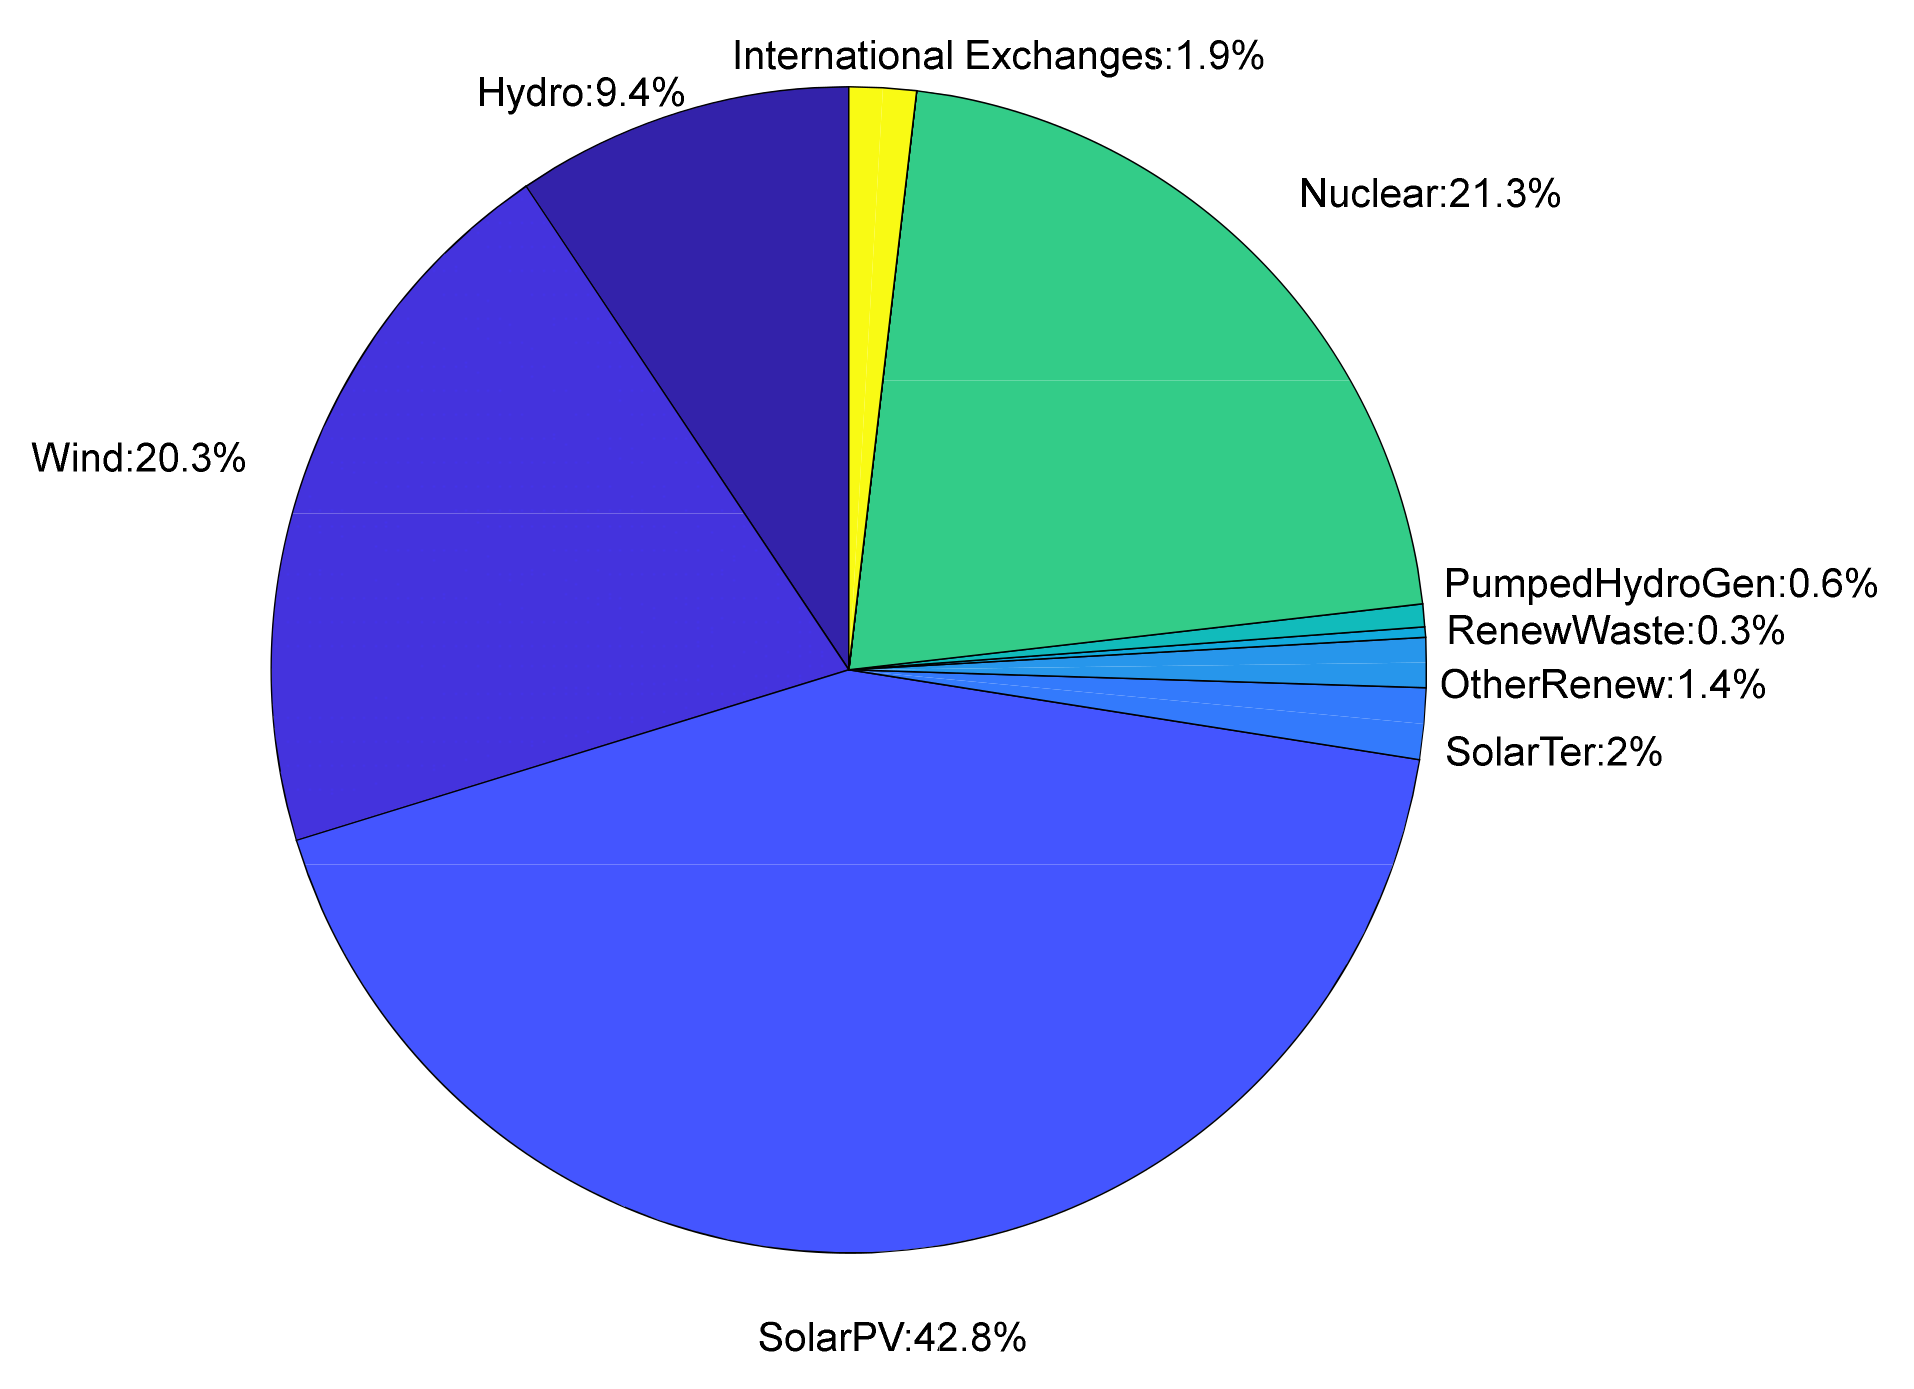
Figure 18 presents the electricity demand coverage. The final energy generated is increased to 261.7 TWh, and, under this assumption, it is observed that solar PV share will reach 42.8%, becoming the most contributor technology. Nuclear and wind energy are the second and third contributors, respectively, but with less than half of the generated energy.
Regarding the ESS, Li-ion is currently considered the most mature battery storage technology, and some further improvements in energy density, lifespan, and number of cycles are still expected. Assuming an average battery cost of
$156/kWh [
39], the required cost of the ESS from using this type of battery will vary between
$538 billion for the second scenario (substituting cogeneration power plants) and
$1.33 trillion for the last scenario, where all CO
2-emitting power plants are replaced. The main drawback of this technology is its life expectancy, with an average estimated life in the range of 5–15 years, thus making the investment less justifiable [
11,
45].
Coupling the transportation and electricity generation sectors has been proposed to reduce these storage requirements [
11]. For example, the electrification of the transportation sector can contribute to deploying additional distributed ESS capacity. According to [
47], there are more than 24 million cars in Spain. Assuming that all of these vehicles were electric, with an average battery capacity of 60 kWh, there would be a maximum storage capacity of 1.44 TWh. Assuming that these vehicles only use 25% of their nominal battery capacity to support the electric grid, this capacity would be reduced to a more realistic value of 360 GWh [
47].
PHS is another storage option. It is a very efficient and well-established technology, but due to the required civil infrastructure (two water reservoirs, a penstock and a power station with turbines, generators/motors, and pumps), the cost of an average installation is higher than other ESS. Cost is typically expressed in
$/kW, and for a 10-h 300–1000 MW plant, costs were estimated to be around
$2000/kW [
36,
44]. According to [
48], Spain has a reliable potential of PHS, between 3.5 to 9.4 TWh, which could cover the storage demand proposed in this work.
Table 4 summarizes the main results of this study.
5. Conclusions
This paper evaluated the impact of the replacement of the different CO2-emitting generation technologies by PV–ESS hybrid systems in Mainland Spain.
The current Mainland Spain electricity system was described, presenting its evolution in the last 5 years and describing the latest regulatory aspects that affect the transition to a new generation mix with a higher share of renewable sources.
A two-stage scheduling algorithm was developed to estimate the additional PV generation required, covering the annual CO2-emitting generation and the required battery storage to balance the solar daily variability. Four different scenarios were evaluated: replacing coal (first scenario), cogeneration (second scenario), CCGT (third scenario), and a combination of all CO2-emitting thermal power plants (fourth scenario).
The required additional PV generation varies from 11.4 GW (when replacing only coal power plants) to 101.24 GW (when replacing all CO2-emitting sources).
The ESS capacity will depend on the variability of the additional PV capacity and the variability of the replaced polluting technology. For example, cogeneration technology generated an annual produced energy of 29.58 TWh in 2019, while coal technology only generated 10.6 TWh in the same period (almost three times less); however, this last technology was more variable than cogeneration, requiring more ESS capacity (4.18 TWh instead of 3.45 TWh for cogeneration).
The maximum required ESS capacity is reached for the fourth scenario with 8.5 TWh. If this energy storage was implemented with Li-ion batteries, the average cost would be over $1.3 trillion.
Some solutions are proposed to reduce this cost. One option is to couple the transportation and electricity sectors, using electric vehicles as distributed energy storage solutions. The other proposed option is to increase the number of PHS installations. Despite being a much more expensive option, and with some environmental impacts, PHS produces a number of complementary benefits, such as flood control, irrigation, and water supply.


