Article

Forecasting Crude Oil Consumption in Poland Based on LSTM Recurrent Neural Network

1
Department of Electrical Engineering and Automation in Industry, Faculty of Mining, Safety Engineering and Industrial Automation, Silesian University of Technology, 44-100 Gliwice, Poland
2
Department of Safety Engineering, Faculty of Mining, Safety Engineering and Industrial Automation, Silesian University of Technology, 44-100 Gliwice, Poland
*
Author to whom correspondence should be addressed.
Energies 2022, 15(13), 4885; https://doi.org/10.3390/en15134885
Submission received: 1 June 2022 / Revised: 15 June 2022 / Accepted: 1 July 2022 / Published: 3 July 2022

Abstract

:
Primary fuels, i.e., crude oil, natural gas, and power coal, dominate the total global demand for primary energy. Among them, crude oil plays a particularly important role due to the universality of applications and the practical lack of substitutes in transport. Crude oil is also one of the main sources of primary energy in Poland and accounts for around 30% of the energy consumed. Poland covers only 3% of its needs from domestic deposits. The rest is imported from Russia, Saudi Arabia, Nigeria, Great Britain, Kazakhstan, and Norway. Due to such a high import of raw material, Poland must anticipate future demand. On the one hand, this article aims to analyze the current (2020) and future (2040) crude oil consumption on the Polish market. The study analyzes the geopolitical and economic foundations of the functioning of the energy raw-materials market, the crude oil supply, the structure of Poland’s energy mix, and assumptions about the energy policy until 2040. On the other hand, conclusions from the research were used to build a model of crude oil consumption for the internal market. It has been also shown that the consumption of crude oil on the Polish market is a nonlinear phenomenon with a small set of statistical data, which makes it difficult to build an accurate model. This paper proposes a new model based on artificial neural networks that includes long-term memory (LSTM). The accuracy of the constructed model was assessed using the MSE, Theil, and Janus coefficients. The results show that LSTM models can be used to forecast crude oil consumption, and they cope with the nonstationary and nonlinear time series. Many important contemporary problems posed in the field of energy economy are also discussed, and it is proposed to solve them with the use of modern machine-learning tools.

1. Introduction

Over the last century, there has been a significant technological development en-compassing virtually all aspects of human life. This development has resulted in a rapid improvement in living conditions in the vast majority of countries. Such a favorable development would be impossible without energy, and the growing demand for energy has led to the discovery of new sources [1,2,3,4] and the development of new energy technologies [5,6,7]. Access to energy is the basis of global economic growth and societal development [8,9,10,11,12]. The transport sector also plays a vital role in accelerating economic activity for economic development [13]. Most of the significant changes result from globalization processes. These processes have resulted in a significant increase in the interdependence between all markets [14,15,16,17], and, additionally, have influenced change in consumption patterns [18,19,20,21] and the labor market [22,23,24,25,26,27]. In addition, many countries in Europe and around the world are rebuilding their energy systems under the influence of the increasingly stronger impact of globalization processes, which include shaping national energy strategies aimed at European Union (EU) climate and energy policy, including its long-term vision of striving for EU climate neutrality by 2050, and regulatory mechanisms stimulating the achievement of such effects in the coming decades [28]. Achieving a reliable energy supply and environmental sustainability have become a global effort [29,30]. Achieving the EU’s 2020 and 2030 climate and energy goals is key to a low-carbon energy transition, and this also applies to the transport sector, which is in the process of leading shifts in an attempt to alleviate the problems of climate change and air pollution [31]. In connection with the implementation of the ambition to decarbonize, the EU is also notable regarding the trend connected with the development of entrepreneurship directed to the production of green energy [32,33,34,35,36,37,38,39,40,41,42,43]. Undoubtedly, an important role is played here by business angels and the creation of sustainable start-ups [44,45,46,47,48,49,50]. The second course of action is to focus on grassroots civic initiatives. Adequately targeted activities at the local level can play a key role in the community’s approach to develop energy production [51,52,53,54]. Renewable energy cannot replace fossil fuels in all sectors of society. Currently, barriers in the transport sector mean that crude oil will remain the dominant fuel.
As an important component of energy structure, the production and consumption of oil can drive or inhibit economic development. Poland is a strongly developing country in terms of economic growth, with changes in the structure of its consumption expenditure, but also with the development of and an increasing dependence on oil resources [55,56,57,58,59]. The imbalance of supply and demand for crude oil is becoming more and more apparent. Moreover, there are no reliable studies related to the forecasting of crude oil consumption on the Polish market. Forecasting the demand for crude oil is an important part of developing a strategy for the development of the market for this commodity, so reasonable and accurate analyses of crude oil consumption are needed, not only to protect Poland’s energy security [60] but also to effectively prevent bottlenecks in supplies and for the implementation of the Polish crude oil supply [60]. Sustainable and rapid development will have a significant impact on these processes. Rapidly growing energy consumption in Poland and structural changes still threaten the security of raw material supplies. Therefore, it is expected that effective methods of meeting the demand for crude oil will become the basis for formulating the policy of security for the energy supply and will directly affect the stability of social production and national energy security. They will also help Poland establish an independent oil- and energy-sector-forecasting mechanism, to achieve an effective market transformation. These are the main research questions that can be found in the literature on the subject, and the answers to them can be found in this article.
The demand for crude oil, which is one of the most important strategic raw materials in the world, has always been treated as a very difficult research task that has attracted the interest of scientists, practitioners, and many research institutions. The size of this demand depends on the price, supply [61,62], and irregular and unpredictable events [63]. Many factors, such as gross domestic product growth, stock levels, exchange rates, technology development, and substitute primary fuels, affect its size [64,65,66,67] and make the process non-stationary [68,69].
Most crude oil consumption is in the transport and heating sectors. Therefore, crude oil supplies must be undisturbed, and this poses a challenge to the modern management of the Polish resource economy. Forecasting oil consumption is fundamental to natural fuel management. Unfortunately, there are no studies related to forecasting crude oil consumption in the domestic and international literature. Okulski et al. [70] discussed the factors influencing the Polish and global crude oil markets. They indicated that almost all oil in Poland is imported, despite the fact that Poland has its own deposits. Kamyk et al. [71] analyzed the possibilities of domestic oil production and the directions of diversification of imports to Poland. The remaining research is related to the analysis of the primary structure of the energy mix, though the latest research comes from 2017 [72,73,74].
In order to narrow these gaps, in this article we present a model for forecasting crude oil consumption on the Polish market.
The research hypothesis adopted in this article is the development of a reliable model of crude oil consumption on the Polish market, which can be used to forecast the demand for the raw material. This model will allow for the development of credible strategies for the further development of the oil sector, as well as the energy sector.
The available forecasts will allow for effective management of the operational efficiency of the fuel sector and will contribute to the reduction in operating costs.
The novelties of this study are:
-
the development of an innovative model based on LSTM artificial neural networks used to forecast oil demand;
-
according to the authors’ knowledge, this is the first study that uses deep learning methods to forecast the demand for crude oil on the Polish market;
-
this is the first study to confirm that LSTM artificial neural networks can be used to predict mal-numerical, non-stationary statistical datasets.
The document is organized as follows: the second chapter describes the geopolitical and economic foundations of the energy-raw-materials market, the third chapter describes the supply of primary energy, the fourth chapter describes the crude oil market, and the energy structure of Poland is analyzed in chapter five.

2. Geopolitical and Economic Foundations for the Functioning of the Energy-Resources Market

The main trend in the global energy market is the increase in energy demand, as shown in Figure 1. World energy consumption is expected to increase by 29% over the period 2021–2050 [75]. The distribution of global energy demand will vary. A steady level of demand will be maintained in most European countries, Japan, South Korea, and North America, and there will be a large increase in consumption in the rest of Asia (60% of the global increase in demand), Africa, the Middle East and South America. Moreover, according to these forecasts, by 2050 the share of individual energy resources in global production is to change from the current state, in which 31.3% is crude oil [76], 27.2% hard coal, and 24.7% natural gas, to the same in which global energy production will be divided into almost equal parts between oil, natural gas, hard coal, and low-carbon energy sources. This means that demand for natural gas will grow at the fastest rate of all fossil fuels, by more than half, and the increasingly flexible global trade in liquefied natural gas (LNG) will offer some protection in the event of a supply disruption. The main regions that will increase global demand for natural gas are forecasted to be China and the Middle East, and unconventional gas is expected to account for almost 60% of global production growth. On the other hand, the use of coal in the future, despite its large resources and occurrence on all continents, may be gradually reduced due to steps being taken to tackle the problem of environmental pollution and reduce CO2 emissions. Even so, global coal demand will increase by 15% by 2040. Similarly, the global demand for oil will increase (by less than 14%).
In 2020, primary energy consumption fell by 4.5%, the first decline in energy consumption since 2009. The decline was mainly driven by oil (−9.7%), which accounted for almost three-quarters of the decline. The consumption of all fuels decreased, except for renewable energy (+9.7%) and water (+1.0%). Consumption declined in all regions, with the largest declines in North America (−8.0%) and Europe (−7.8%). The lowest decline was in the Asia-Pacific region (−1.6%) due to growth in China (+2.1%), the only country where energy consumption increased in 2020. In other regions, consumption fell by −7.8% in South and Central America and fell to −3.1% in the Middle East, as shown in Figure 2.
The presented forecasts show that despite the growing demand for energy resources, the structure of the trade in them will not change. Currently, the (net) import of energy resources on a global scale covers about 25% of the total demand for them, while the import of crude oil covers 55% of the demand for this raw material in the world, the import of natural gas covers 30% of the demand for natural gas, and the share of coal imports in the total demand for coal accounts for 18% [77].

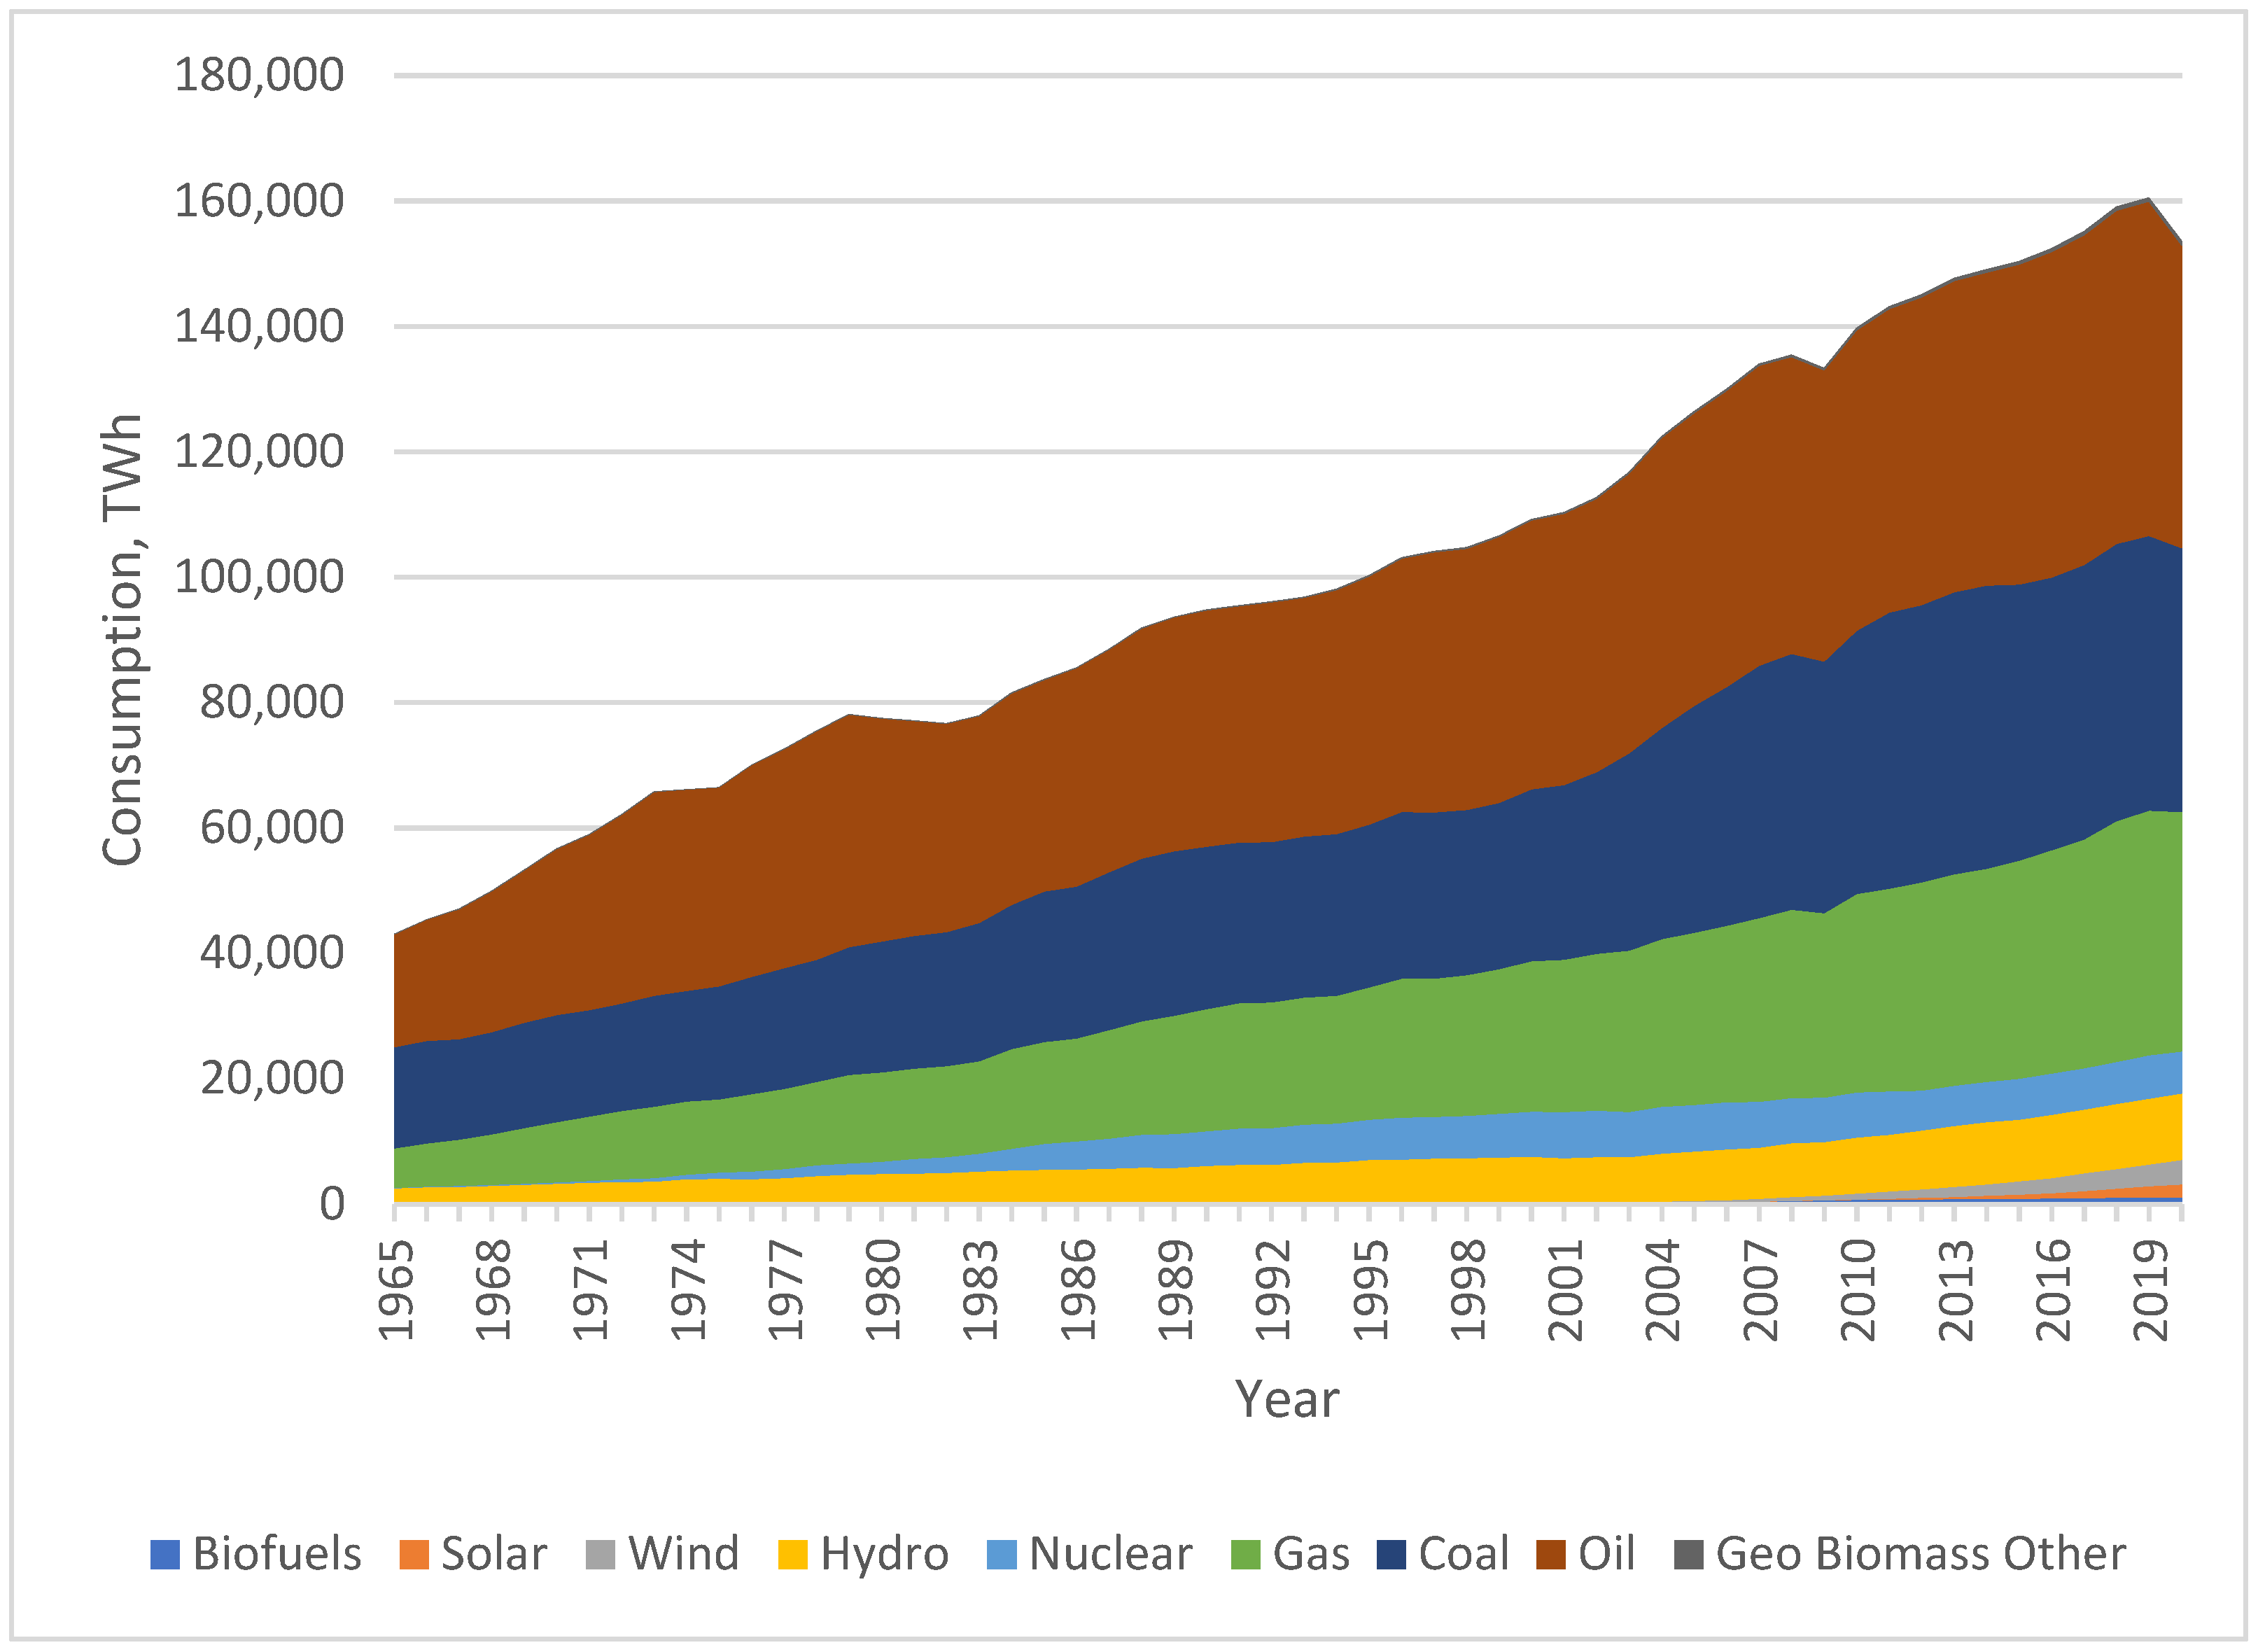
2.1. Primary Energy Supply

In the global primary energy balance, the main sources of energy are oil, coal, natural gas, nuclear energy, and renewable energy. In 2020, the world consumption of primary energy amounted to 557.10 exajoules (EJ) [77] and, compared to 1990, it increased by 52%, while compared to 2019, it decreased by 5%. The increase in the total supply of primary energy in the period 1990–2020 is mainly due to its increase (by over 90%) in non-OECD countries. In contrast, in OECD countries in the years 1990–2020, this increase was only 16%. Until 2008, a systematic increase in the total supply of primary energy in these countries could be observed, and it declined after 2008, probably due to the global economic crisis and the decline in GDP. Another factor contributing to the reduction in the demand for primary energy may be the improvement of energy efficiency. A similar tendency in the supply of primary energy could be observed in European Union countries. In 1990, the supply of primary energy was 254 EJ, in 2019—606 EJ. Table 1 presents the volume of primary-energy demand in the years 1990–2020, broken down by individual types of energy carriers. In turn, Table 2 presents the share of individual energy carriers in the total primary-energy supply in the years 1990–2020. The share of individual energy carriers in the total world demand for primary energy in 2020 was as follows: crude oil constituted the source of approx. 31% of primary energy, coal—29%, natural gas—approx. 21%, nuclear energy—approx. 5%, and renewable energy sources—around 13%.
In the years 1990–2020, the share of crude oil in the demand for primary energy decreased from 37% to 33%. This decrease concerned both non-OECD countries, OECD countries, and the European Union. However, despite the decline in the share of crude oil in the supply of primary energy, in the years 1990–2020 in non-OECD countries the demand for primary energy obtained from crude oil increased by as much as 68%. On the other hand, in the case of OECD and European Union countries, until 2008 the share of crude oil in the demand for primary energy was growing year by year, and after 2008 it was systematically dropping. On the other hand, contrary to the energy policy expressed in the Kyoto Protocol, aimed at limiting CO2 emissions, which should reduce the use of coal as a primary energy source, there has been an increase in the share of coal in the demand for primary energy. In the years 1990–2020, this share increased from 25% to 29%. However, it should be noted that the indicated increase was in countries outside the OECD area. In these countries, the share of coal as a primary energy source increased from 28% in 1990 to 37% in 2012. In 1990, the total supply of primary energy obtained from coal was 1150.1 Mtoe and increased in 2012 to 2858.6 Mtoe, i.e., by about 150%. On the other hand, in OECD countries, the share of coal in the demand for primary energy decreased from 24% in 1990 to 17% in 2020. An even greater decline in the share of coal as a primary energy source can be noticed in European Union countries: from 28% in 1990, it dropped to 14% in 2020. Nominally, the demand for primary energy from coal also decreased by about 35%, from 455.6 Mtoe in 1990 to 294 Mtoe in 2012. This is probably related to the energy policy in the European Union concerning the reduction in CO2 emissions. The share of gas as a source of primary energy in the world in the years 1990–2020 remained at a similar level and amounted to approximately 21%. In 2020, the global demand for primary energy obtained from natural gas reached 25% and increased by about 6% compared to 1990. This increase was mainly due to the increase in demand for primary energy obtained from natural gas in non-OECD countries. In OECD countries, this increase was lower, and in European Union countries, the demand for primary energy obtained from natural gas increased until 2010, to fall below the level recorded in 2000 in the last two years. As in the case of natural gas, the share of nuclear energy and energy from renewable sources in the total supply of primary energy remained at a constant level in the years 1990–2010. The share of nuclear energy was about 6%, and energy from renewable sources was 10%.

2.2. Crude Oil Market

Currently, conventional and unconventional crude oil resources are estimated at 331 trillion tons, which is only 3.4% of the world’s energy resources [78], including 161 trillion tons of conventional crude oil (1.3%) and 170 trillion tons of non-conventional oil resources (2.1%). In turn, crude oil reserves amount to 217 trillion tons, which accounts for 23.7% of the world’s reserves of energy resources, of which 168.7 trillion tons are conventional reserves (17.7%), and 47.9 trillion tons are unconventional reserves (5.0%). It was estimated in 2013 that the largest reserves of crude oil (conventional and unconventional) are located in Venezuela (17.7% of the world’s resources in 2013) [77] and in the Middle East (Saudi Arabia—15.8%, Iran—9.3%, Iraq—8.9%, Kuwait—6.0%, United Arab Emirates—5.8%, and Qatar—1.5%). This means that the Persian Gulf countries belonging to OPEC account for 47.2% of the world’s crude oil reserves, and the remaining six OPEC countries account for 24.7% of the world’s crude oil reserves. Large oil reserves in 2013 are also in Canada (10.3%) and Russia (5.5%). The group of countries where the percentage share in the world’s crude oil resources ranges from 1% to 3% includes: Libya—2.9%, the United States—2.6%, Nigeria—2.2%, Kazakhstan—1.8%, and China—1.1% [79].
World crude oil production in 1990–2020 was systematically increasing year by year (except for declines in 2002, 2007, 2009, and 2020). In 2020, it amounted to 4141 Mt and, compared to 1990, it increased by about 30%, while compared to 2000, it increased by about 14%. In the years 2000–2020, OPEC countries produced about 42–44% of global crude oil, thanks to which they had a decisive influence on the international crude oil market. On the other hand, in recent years, the production of crude oil in OECD countries was at the level of about 21–23% of world production. In 2020, US oil production (17% of global production in 2020) decreased by 3.4%, further widening the gap with Saudi Arabia as the largest oil producer, with the US producing 42% more oil than Saudi Arabia. Overall, oil production fell −8.8% in the Middle East, including −7% in Saudi Arabia, 8.6% in Russia and 14% in Nigeria. In Canada, it fell by 4.5%, but it increased by 1.6% in China and 7.1% in Brazil [80]. Figure 3 shows the volume of world oil production in particular years.
Crude oil production is concentrated in the Persian Gulf region, mainly in Saudi Arabia (16.2% in 2020) [81], Iran (9.5%), the United Arab Emirates (6%), Iraq (8.7%), and Kuwait (6%). This means that in 2020 the share, in the total production, of the five largest oil producers among the OPEC countries was approximately 30%. The top ten producers also include Russia, the United States, China, Canada, and Mexico. The total share of the 10 largest crude oil producers in the world production in 2020 was approximately 65%. This share was also at a similar level in 1990—67.5% and in 2000—61.6%. Crude oil turnover on international markets in the years 2000–2020 accounted for approximately 53–55% of the world’s crude oil supply. In 2020, the world exports of crude oil amounted to 2174.6 million tons and, compared to 1990, its value increased by 41%, and compared to 2000—only by 10%. It is worth noting here that in the years 2000–2008 an increase in exports was observed, then its decline, caused by the global financial crisis, and a renewed increase after 2010. The main oil exporters were non-OECD countries, and the volume of these countries’ exports accounted for approximately 83% of total exports. On the other hand, the recipients were OECD countries, in particular the United States, European countries and Japan. It should also be emphasized that the volume of exports of the 12 countries belonging to OPEC in the years 2000–2012 ranged from 54–58% of total exports. The main crude oil suppliers in the world in 2020 were the countries of the Persian Gulf region (Saudi Arabia—352 Mt, Iraq—195 Mt, United Arab Emirates—148 Mt, Kuwait—102 Mt). These countries mainly supplied oil to the American, Japanese, Chinese, Western European and Southeast Asian markets. The second largest exporter of crude oil was Russia (269 Mt). It supplied rope to the European, Chinese and American markets. The group of big exporters in 2020 also includes: Canada (154 Mt), Nigeria (99 Mt), Angola (63 Mt) and Kazakhstan (70 Mt). The exports of the 10 largest suppliers of crude oil in the years 1990–2020 amounted to approximately 67–70% of world exports. In turn, the largest recipients of crude oil in 2020 were China (505 Mt), India (227 Mt), the United States (202 Mt), Japan (149 Mt), and South Korea (145 Mt). European countries also had a significant share in the import of crude oil, including Germany, Italy, Spain, Great Britain, and the Netherlands.
Various types of crude oil are traded on international markets, differing in both their quality and access to markets. From the point of view of global economic (and financial) turnover, the most important are the following types of oil, which are assigned price indices: Brent, WTI, and the so-called OPEC basket, followed by Dubai Fateh and Russian crude oil. Brent crude oil consists of several types of crude oil extracted in the North Sea region. Its sulfation is slightly greater than that of WTI. This crude oil is refined in northern Europe, in the Mediterranean, and on the US East Coast. Brent’s blend is listed, inter alia, on the London LSE and the International Oil Exchange (IPE) in London, and Brent oil futures are also traded on the NYMEX New York Stock Exchange. West Texas Intermediate (WTI) is a very high quality, low sulfur crude oil. Its quality and place of occurrence (i.e., Texas) mean that it is refined in the United States. Crude oil of the WTI type is listed on the New York Stock Exchange NYMEX [82]:
The OPEC Reference Basket is the weighted average of crude oil types sourced from OPEC countries. The basket includes: Saharan Blend (Algeria), Minas (Indonesia), Iran Heavy (Iran), Basra Light (Iraq), Kuwait Export (Kuwait), Es Sider (Libya), Bonny Light (Nigeria), Qatar Marine (Qatar), Arab Light (Saudi Arabia), Murban (United Arab Emirates), and BCF 17 (Venezuela).
Dubai Fateh (Dubai Crude) is oil extracted from Dubai. Until June 2005, it was part of the OPEC basket. It is also used as a reference price for the export of raw materials to the Far East.
Ural oil is one of the four types of Russian oil. It is a mixture of deposits, mainly from Western Siberia, the Ural Mountains, and the Volga region, and is a reference point for establishing the export price of Russian crude oil. It is listed on the Russian stock exchange. The counterpart of Ural crude oil, listed on the New York Stock Exchange NYMEX, is Rebco crude oil (Russian Export Blend Crude Oil). Brent, WTI, and Dubai Fateh oil prices play a major role.

2.3. Poland’s Energy Structure

The European Union (EU) currently has (as of June 2021) greenhouse gas (GHG)-emission-reduction targets adopted in the energy and climate framework until 2030. GHG-emission-reduction targets have been set in such a way that the EU is on the on the road to a low-carbon economy, as presented by the European Commission (EC) in its Communication on a long-term vision for 2050. The EU level target of reducing GHG emissions in 2030, by at least 40% by 2030 compared to 1990, was declared as an EU contribution (NDC) under the Paris Agreement. On 12 December 2019, the European Council adopted the Communication European Green Deal (European Green Deal, EU Green Deal, EGD). In total, it covers 48 activities in various fields—from the energy sector, through agriculture and transport to society’s participation in the fight against climate change. The main goal was to achieve climate neutrality in the European Union by 2050. According to the above document, the new GHG-emission-reduction target for the European Union for 2030 should be in the range of 50% to 55% compared to 1990. Such an approach was repeated in the draft European Climate Law, published on 4 March 4 2020. During subsequent discussions in 2020 and 2021, both the Council and European Parliament increased the target value for 2030. As part of the consensus reached in April 2021, the provision on the target by 2030 says at least a 55% net emission reduction compared to 1990, clearly spelling out both emission reductions and removals. Poland, as an EU member state, on the one hand has the right to shape its energy mix in an autonomous way, while on the other hand must submit to the requirements of the energy and climate policy developed within the EU. In Poland, the key strategic document of the government that tries to reconcile these challenges is the Energy Policy of Poland (PEP), prepared on the basis of the Energy Law of 10 April 1997 (Journal of Laws of 2021, item 716, as amended) [83]. The last document of this type was adopted by the Council of Ministers in 2021. “Poland’s Energy Policy until 2040 (PEP2040)” includes in its assumptions the necessity to ensure energy security, fair transformation, sustainable development of the economy, and strengthening of its competitiveness [60]. In addition, as part of the obligation imposed on the EU Member States, the National Energy and Climate Plan for 2021–2030 (NECP) [79] was developed. The development of the NECP results from the Regulation of the European Parliament and of the Council (EU) 2018/199911.
Poland’s primary energy structure is definitely different from other European Union countries due to the significant share of coal. The most important factors that determine the shape of Poland’s energy balance are the following factors [60]:
natural—the dominance of hard coal and lignite resources;
political—no long-term coherent vision of energy policy;
systemic—fully immature market economy;
external—participation in world trade and transport of energy carriers;
economic—relatively high prices, factors of electricity;
technical and technological—an extensive mining base of solid fuels and new technologies of fuel use.
In the years 1990–2018, the production of primary energy has a moderate growing trend, as shown in Figure 4. The highest level of 104.96 Mtoe was recorded in 2018, while the lowest was 89.02 Mtoe in 2002. The current shape of the Polish energy mix is the result of socio-economic changes that were introduced after 1988 and pertained in particular to the mining sector.
The Polish resource base potential allows for domestic satisfaction of the demand for hard coal, lignite, and biomass, while the demand for natural gas and crude oil must mostly be covered by imports. Initiatives are currently underway to diversify the directions and sources of supplies, and efforts are still being made to search for domestic (also unconventional) deposits in order to replace the supply from depleted deposits. Part of the demand for crude oil and natural gas will be limited by the growing importance of biofuels and alternative fuels (including electricity, LNG, CNG, biomethane, hydrogen) [56]. Poland is to the greatest extent dependent on imported crude oil, therefore, in the short term it is necessary to ensure good conditions for crude oil reception and an efficiently functioning internal infrastructure. The possibilities of deliveries by sea will be increased thanks to the expansion of the Pomeranian Oil Pipeline and the storage bases of crude oil and liquid fuels. Deliveries of petroleum products depend on a properly developed network of pipelines, especially in the southern part of Poland, which will also be expanded, e.g., the Boronów-Trzebinia pipeline [60].

3. Materials and Methods

In the literature, many publications can be found related to forecasting the demand for fossil resources, but only a small part of the articles concern forecasting the demand for crude oil. There are many ways of forecasting the demand for energy resources, autoregressive and moving average (ARMA) models [84,85], generalized ARCH model [86], models of the stochastic effective function [87], and methods of forecasting time series through artificial neural networks [88,89,90]. Table 3 summarizes existing research on fossil fuel consumption forecasting.
Artificial neural networks were used to forecast crude oil consumption. The model was selected after statistical analysis and determination of the characteristics of the time series. The statistical data were verified with the Augmented Dickey–Fuller (ADF) test, which is a standardized unit root test, and its results are interpreted by observing the p-value of the test. If the statistic is in the range of 1–5%, the null hypothesis is rejected, i.e., there is no unit root and the series is stationary. If p is greater than 5%, the analyzed time series has a unit root, the series is non-stationary and will need to be differentiated to achieve this stationarity. The summary of the analysis is shown in Table 4. The p value for all performed tests exceeds the adopted significance level of 5%, which means that there are no grounds to reject the null hypothesis. The analyzed time series does not meet the conditions of stationarity.
The consumption of crude oil on the Polish market is also a very complex issue related to the functioning of the energy-resources market. Anticipating factors influencing this consumption require many links between the constitutive elements and many feedback loops resulting from the actions taken, e.g., economic or political decisions with specific effects. All these features are characteristic of nonlinear time series [95]. In such a situation, a dynamic description of these data is usually very difficult, and sometimes impossible [96,97]. Artificial neural networks that allow non-linearities to be fully accounted for are helpful.
Machine learning is a subset of artificial intelligence that allows to perform the process of predicting outcomes without having to program them explicitly. In machine learning, algorithms are trained to find patterns and correlations in datasets and to make the best decisions and make predictions based on the results of such analysis. Machine learning—and its components, i.e., deep learning technology and neural networks—are concentrically overlapping subsets of AI [98,99,100]. AI processes data to make decisions and make forecasts. Machine-learning algorithms allow AI to additionally learn from this data and develop intelligence without the need for additional programming. Artificial intelligence is an overarching category over all subsets of machine learning. The first subset is machine learning, the next is deep learning, and within that are neural networks. A recursive neural network (RNN) is a type of artificial neural network that uses sequence data or time series data. These deep-learning algorithms are commonly used to solve order or time problems. Recursive neural networks are used to forecast time series. They use training data for learning. They are distinguished by “memory” because they retrieve information from previous inputs to influence the current input and output. While traditional deep neural networks assume that inputs and outputs are independent of each other, the outputs of recursive neural networks depend on prior elements in the sequence. While future events would also be helpful in determining the output of a given sequence, unidirectional recursive neural networks cannot account for these events in their predictions. One variation of RNN architecture is long-term memory (LSTM), which is specifically designed to avoid long-term dependency problems. Although LSTM is similar in structure to the RNN, the vanilla LSTM has three gates (i.e., input, forget, and output), block input, single cell, output activation function, and peephole connections [96]. LSTM was the first repeating network architecture to overcome the problem of gradient disappearance and explosion. The LSTM-forgetfulness gate determines what information is to pass through or is ejected from the cell state, the input gate determines what new information should be stored in the cell state, while the output gate regulates what each cell produces. Moreover, it will depend on the cell state, regarding filtered and newly added data.
The LSTM network computes the mapping from the input sequence x = (x1, …, xT) to the output sequence y = (y1, …, yT), by computing the network unit activation using the following iterative equations from t = 1 to T [101]:
f t =   σ g ( W f x t +   U f h t   1 +   b f )
o t   =   σ g ( W o x t +   U o h t   1 +   b o )
c ¯ t =   σ h ( W c x t +   U c h t   1 +   b c )
c t =   f t × c t   1 +   i t × c ¯ t
h t =   o t ×   σ h ( c t )
where conditions W and U are weight matrices, the b conditions are polarity vectors (bi is the input gate polarization vector), σ is the activation function, and i, f, o and c are input gates, forgotten gates, output gates and cell activation vectors, respectively, all of which are the same size as the activation vector of the starting cell, i.e., the result of the vectors.
Each theoretical model built depends on three factors:
correct estimation of model parameters;
applying the appropriate inference principle;
make the right starting assumptions.
The correctness of the above-mentioned factors can be verified by assessing the accuracy and accuracy of the forecasts.
The degree of accuracy of the forecast will be measured using mean square error of ex post forecasts of formula [102]:
MSE = 1 n t   = 1 n ( y t y t ^ ) 2
n     number of observations of the forecast variable y;
y t     actual value of the y variable in the period t = 1,2, …, n;
y t ^     forecast of the variable y determined in the period t.
Absolute error of ex post forecasts [102]:
Δ t = | y t y t ^ |
Another frequently used factor to determine the quality of a prognostic model is Theil’s coefficient, which is used to calculate the total relative forecast error during the testing period. It is expressed by the following formula [102]:
I 2 = t   =   m   + 1 n ( y t y t ^ ) 2 t   =   m   + 1 n y t 2
Theil’s coefficient was broken down into factors.
The first factor informs about errors due to the bias of forecasts (failure to guess the average value of the forecast variable):
I 1 2 = ( y ¯ t y ¯ t   * ) 2 1 n     m τ   =   m   + 1 n y ¯ t · 2  
where
y ¯ l · —average of crude oil consumption volume in the verification period;
y ¯ l   * —average of the forecasted crude oil consumption volume in the verification period.
The second factor informs about errors due to insufficient flexibility (failure to guess the fluctuations of the forecast variable):
I 2 2 = ( s r   s p ) 2 1 n     m t   =   m   + 1 n y t 2
where
s r —standard deviation of the actual values within the verification interval;
s p —standard deviation of the forecast values in the verification range.
The third factor informs about errors due to insufficient compliance of the forecasts with the actual direction of changes of the forecast variable (failure to guess the direction of the development trend):
I 3 2 = 2 · s r · s p · ( 1   r w ) 1 n     m t   =   m   + 1 n y t 2
where
r w —linear correlation coefficient between the actual and forecasted value in the verification interval.
Janus coefficient [102]:
J 2 = 1 n     m t   =   m   + 1 n ( y t y t ^ ) 2 1 n t   = 1 n ( y t y t ^ ) 2
This coefficient determines the degree of adjustment of the forecasts and the model to the actual data in the verification interval. If its value is J2 ≤ 1, then it can be concluded that the current forecasts are correct and the model can be used for forecasting. The determination of the prediction errors shows that they are random variables. This means that they have their own probability distributions and their own distribution parameters.

4. Results and Discussion

In recent years, the demand for crude oil has increased along with the sustained and rapid development of the national economy in Poland. Poland does not have enough oil deposits to fully meet the demand. Since the 1990s, crude oil consumption has grown at an average annual rate of 5.77%. Oil self-sufficiency has become an important source of the imbalance between the supply and demand for crude oil in Poland.
The article analyzes the geopolitical and economic foundations of the functioning of the energy raw materials market, crude oil supplies, the structure of Poland’s energy mix and the assumptions of the energy policy until 2040. The conclusions from the research were used to build a model of crude oil consumption in the internal market.
The analysis was conducted on the annual crude oil consumption data for Poland from 1965 to 2020. Table 5 shows the descriptive statistics of the analyzed phenomenon. The average crude oil consumption for Poland is 18.51 Mtoe, and it is close to the median of 17.51 Mtoe. The analyzed phenomenon has a platokurtic distribution. The entire dataset is positively skewed.
The theoretical model of oil consumption was built on the LSTM artificial neural network, and it was used in place of the traditional recursive networks as this architecture overcomes the limitations of traditional time-series-forecasting techniques. Each LSTM block runs at a different time step and forwards its output to the next block, until the last LSTM block produces the sequential output. The core element of an LSTM network are memory blocks, which were invented to deal with fading gradients by remembering network parameters over a long period of time.
Data from 1965–2009 were used as a modeling sample. Meanwhile, in order to verify the predictive performance of the model, the actual data from 2010–2020 will be used as the comparative data for the performance of the model.
The crude oil consumption data were entered into the model as vertical vectors of the form:
X w e = [ x o x n ]
The statistical data has been divided into two sets: the training dataset and the test dataset (70%, 30%). These data were transformed into an input data matrix of the form:
training data:
X w e = [ x 0 x n     t x k   1 x n     t   +   k   1   ]           Y w y = [ x k x n     k   1 ]
test data:
X w e t = [ x n     t   + 1 x n     k x n     t   +   k x n   1   ]         Y w y = [ x n     k x n ]
where:
n—absolute number;
k—delay;
t—number of test data.
The network was implemented in the TensorFlow environment. The statistical data are entered into the LSTM network, according to the dependencies (15) and (16). The model is designed from the input LSTM and the hidden dropout to the output dense layer, according to Table 6.
The key to LSTM is the state of the “Ct” cell. This state is modified by the forget function, according to the dependence (1), and the input functions “it”, “xt”, and “c t ¯ ”, according to the dependencies (2)–(4). The cell output is derived from the cell state “ct” using the output relationship (5). The model was trained on 40 pieces of data using cross entropy and Adam’s optimization over 24 epochs. In total, 30% of the data were used for model validation. After obtaining a statistically significant match, ex post forecasts were generated. The network results were analyzed according to the dependences (7) and (8). If this stage is successful, long-term forecasts can be generated and checked for statistical correctness in accordance with the dependencies (10)–(12). Moreover, in order to relate the theoretical results to the current state of the process and relate them to a common-sense horizon, the ex post forecasts were analyzed using the Janus coefficient (Formula (13)).
Table 7 shows the program code that was written for the LSTM network. The next steps of the algorithm are presented in the left column.
Figure 5 and Figure 6 show the learning parameters of the network. Figure 5 shows the number of epochs that were used to learn the network. In total, 24 epochs were used and an error of 2% was obtained.
Figure 6 presents the reduction in the error as a result of successive iterations. We can see that this error decreases, which confirms that there has been no overfitting or reduction in the performance of the model.
The comparison of the theoretical and real values and the error distribution are shown in Figure 7.
The validity of the constructed model was assessed using the tools described in the Section 3. The average forecast error is −0.0505 Mtoe, which means that the forecasts are on average too high (overestimated). The mean absolute error of the ex post forecasts is 0.3069 Mtoe, while the root mean square error is 0.3995 Mtoe. The difference between the errors is 24%, which proves a significant variation in values. The average percentage error is 2%, which means that the model largely models the real course of crude oil consumption. The relative forecast error during the testing period is 0.16 Mtoe. The value of the Janus coefficient is 0.6, which means that the model can be used for forecasting until 2040. The forecasts generated by the model are shown in the Figure 8.
The forecast of the demand for crude oil was developed until 2040 and with assumptions resulting from external conditions, via the government project of Poland’s energy policy—PEP2040, taking into account the specificity of the domestic resources held. The forecast assumes the implementation of the main goal, which is to increase the degree of diversification of the crude oil supply sources, understood as obtaining crude oil from different regions of the world, from various suppliers using alternative transport routes, and by building warehouses with capacities to ensure the continuity of supplies. According to the forecasts prepared, the demand for crude oil is growing. This is mainly due to the fact that there are no alternative fuels in the primary-energy mix that could reduce this demand. The issue of oil demand is currently one of the most important determinants of future oil price trends. The sharp increase is visible until 2030. The level of around 39 Mktoe remains until 2035 and then declines by around 6%, reaching the level of 37 Mktoe in 2040. Developed forecasts of oil consumption will allow for a rational transformation of the Polish primary-energy mix.

5. Conclusions

Forecasting the demand for crude oil is an important part of Poland’s energy security and crude oil market-development strategy. A thorough analysis of crude oil needs can protect the country by providing an effective way to solve the oil-bottleneck problem. Taking into account the non-linear nature of the phenomenon of Polish crude oil consumption, a model based on artificial neural networks was proposed for forecasting. An LSTM structure was used, which is a type of recursive network that takes into account the time dependencies between the statistical data. As a result, these networks can be used for series forecasting. LSTM has three gates (i.e., input, forget, and output), block input, a single cell, an output-activation function, and peephole connections. LSTM is the first repeating network architecture to overcome the problem of gradient disappearance and explosion. The LSTM-forgetfulness gate determines what information is to pass through or be ejected from the cell state, and the input gate determines what new information should be stored in the cell state, while the output gate regulates what each cell produces. Moreover, it will depend on the cell state, regarding filtered and newly added data. On this basis, the consumption of crude oil in Poland in the years 1965–2040 was forecasted. The forecasts presented in this study are based on the business-as-usual scenario, meaning that the forecasts are based on the observed trend and do not take into account future changes due to the political regime. On the basis of the obtained forecast results, the demand for crude oil will increase in Poland until 2030, to 39 Mktoe. Thereafter, it will moderately decline by around 2%, reaching 37 Mktoe in 2040.

Author Contributions

Conceptualization, A.M. and A.B.; methodology, A.M. and A.B.; software, A.M.; validation, A.M. and A.B.; formal analysis, A.M. and A.B.; investigation, A.M. and A.B.; resources, A.B.; data curation, A.M. and A.B.; writing—original draft preparation, A.M. and A.B.; writing—review and editing, A.M. and A.B.; visualization, A.M. and A.B.; supervision, A.M.; project administration, A.M.; funding acquisition, A.M. and A.B. All authors have read and agreed to the published version of the manuscript.

Funding

Publication supported under the rector’s pro-quality grant, Silesian University of Technology, grant number 06/010/RGJ21/0048.

Institutional Review Board Statement

Not applicable.

Informed Consent Statement

Not applicable.

Data Availability Statement

Not applicable.

Conflicts of Interest

The authors declare no conflict of interest.

References

  1. Zinecker, M.; Doubravský, K.; Balcerzak, A.P.; Pietrzak, M.B.; Dohnal, M. The COVID-19 disease and policy response to mitigate the economic impact in the EU: An exploratory study based on qualitative trend analysis. Technol. Econ. Dev. Econ. 2021, 27, 742–762. [Google Scholar] [CrossRef]
  2. Prokop, V.; Kotkova Striteska, M.; Stejskal, J. Fostering Czech firms? innovation performance through efficient cooperation. Oecon. Copernic. 2021, 12, 671–700. [Google Scholar] [CrossRef]
  3. Markauskas, M.; Baliute, A. Technological progress spillover effect in Lithuanian manufacturing industry. Equilib. Q. J. Econ. Econ. Policy 2021, 16, 783–806. [Google Scholar] [CrossRef]
  4. Nowak, P. Cooperation of enterprises in innovative activities on the example of Polish regions. Equilib. Q. J. Econ. Econ. Policy 2021, 16, 839–857. [Google Scholar] [CrossRef]
  5. Andrijauskiene, M.; Dumciuviene, D.; Stundziene, A. EU framework programmes: Positive and negative effects on member states’ innovation performance. Equilib. Q. J. Econ. Econ. Policy 2021, 16, 471–502. [Google Scholar] [CrossRef]
  6. Ključnikov, A.; Civelek, M.; Fialova, V.; Folvarčná, A. Organizational, local, and global innovativeness of family-owned SMEs depending on firm-individual level characteristics: Evidence from the Czech Republic. Equilib. Q. J. Econ. Econ. Policy 2021, 16, 169–184. [Google Scholar] [CrossRef]
  7. Kotlebova, J.; Arendas, P.; Chovancova, B. Government expenditures in the support of technological innovations and impact on stock market and real economy: The empirical evidence from the US and Germany. Equilib. Q. J. Econ. Econ. Policy 2020, 15, 717–734. [Google Scholar] [CrossRef]
  8. Lin, M.-X.; Liou, H.M.; Chou, K.T. National Energy Transition Framework toward SDG7 with Legal Reforms and Policy Bundles: The Case of Taiwan and Its Comparison with Japan. Energies 2020, 13, 1387. [Google Scholar] [CrossRef] [Green Version]
  9. Pietrzak, M.B.; Igliński, B.; Kujawski, W.; Iwański, P. Energy transition in Poland—Assessment of the renewable energy sector. Energies 2021, 14, 2046. [Google Scholar] [CrossRef]
  10. Bluszcz, A. The emissivity and energy intensity in EU countries—Consequences for the Polish economy. In Proceedings of the Energy and Clean Technologies. Recycling, air Pollution and Climate Change, Sofia, Bulgaria, 1–7 July 2018; Volume 18, pp. 631–638. [Google Scholar]
  11. Bluszcz, A. European Economies in terms of energy dependence. Qual. Quan. 2017, 51, 1531–1548. [Google Scholar] [CrossRef] [Green Version]
  12. Strunz, S. The German energy transition as a regime shift. Ecol. Econ. 2014, 100, 150–158. [Google Scholar] [CrossRef] [Green Version]
  13. Shafique, M.; Azam, A.; Rafig, M.; Luo, X. Investigating the nexus among transport, economic growth and environmental degradation: Evidence from panel ARDL approach. Transp. Policy 2021, 109, 61–71. [Google Scholar] [CrossRef]
  14. Markandya, A.; Arto, I.; González-Eguino, M.; Román, M.V. Towards a green energy economy? Tracking the employment effects of low-carbon technologies in the European Union. Appl. Energy 2016, 179, 1342–1350. [Google Scholar] [CrossRef] [Green Version]
  15. Gielen, D.; Boshell, F.; Saygin, D.; Bazilian, M.D.; Wagner, N.; Gorini, R. The role of renewable energy in the global energy transformation. Energy Strat. Rev. 2019, 24, 38–50. [Google Scholar] [CrossRef]
  16. Ellabban, O.; Abu-Rub, H.; Blaabjerg, F. Renewable energy resources: Current status, future prospects and their enabling technology. Renew. Sustain. Energy Rev. 2014, 39, 748–764. [Google Scholar] [CrossRef]
  17. Balcerzak, A.P. Quality of Institutions in the European Union countries. Application of TOPSIS Based on Entropy Measure for Objective Weighting. Acta Polytech. Hung. 2020, 17, 101–122. [Google Scholar] [CrossRef]
  18. Gajdos, A.; Arendt, L.; Balcerzak, A.P.; Pietrzak, M.B. Future trends of labour market polarisation in Poland. Perspect. Trans. Bus. Econ. 2020, 19, 114–135. [Google Scholar]
  19. Dmytrów, K.; Bieszk-Stolorz, B. Comparison of changes in the labour markets of post-communist countries with other EU member states. Equilib. Q. J. Econ. Econ. Policy 2021, 16, 741–764. [Google Scholar] [CrossRef]
  20. Svabova, L.; Tesarova, E.N.; Durica, M.; Strakova, L. Evaluation of the impacts of the COVID-19 pandemic on the development of the unemployment rate in Slovakia: Counterfactual before-after comparison. Equilib. Q. J. Econ. Econ. Policy 2021, 16, 261–284. [Google Scholar] [CrossRef]
  21. Wosiek, M. Unemployment and new firm formation: Evidence from Polish industries at the regional level. Equilib. Q. J. Econ. Econ. Policy 2021, 16, 765–782. [Google Scholar] [CrossRef]
  22. Matuszewska-Janica, A.; Witkowska, D. Differences between determinants of men and women monthly wages across fourteen European Union states. Equilib. Q. J. Econ. Econ. Policy 2021, 16, 503–531. [Google Scholar] [CrossRef]
  23. Jankiewicz, M.; Pietrzak, M.B. Assesment of Trends in the Share of Expenditure on Services and Food in the Visegrad Group Member States. Int. J. Bus. Soc. 2020, 21, 977–996. [Google Scholar] [CrossRef]
  24. Piekut, M. Patterns of Energy Consumption in Polish One-Person Households. Energies 2020, 13, 5699. [Google Scholar] [CrossRef]
  25. Fragkos, P.; Paroussos, L. Employment creation in EU related to renewables expansion. Appl. Energy 2018, 230, 935–945. [Google Scholar] [CrossRef]
  26. Rollnik-Sadowska, E.; Dąbrowska, E. Cluster analysis of effectiveness of labour market policy in the European Union. Oecon. Copernic. 2018, 9, 143–158. [Google Scholar] [CrossRef]
  27. Chocholatá, M.; Furková, A. The analysis of employment rates in the context of spatial connectivity of the EU regions. Equilib. Quart. J. Econ. Econ. Policy 2018, 13, 181–213. [Google Scholar] [CrossRef]
  28. Manowska, A.; Rybak, A. An Analysis of Coal Products Sales with Reference to Environmental Regulations of the European Union. Energy and Fuels; Cracow University of Technology, Institute of Thermal Power Engineering: Cracow, Poland, 2018; Available online: https://www.semanticscholar.org/paper/An-analysis-of-sales-of-coal-products-with-to-of-Manowska-Rybak/42b5027332c801ebf4a17bdeee223cc8b4a49d13 (accessed on 1 July 2020).
  29. Azam, A.; Rafig, M.; Shafique, M.; Yuan, J. An empirical analysis of the non-linear effects of natural gas, nuclear energy, renewable energy and ICT-Trade in leading CO2 emitter countries: Policy towards CO2 mitigation and economic sustainability. J. Environ. Manag. 2021, 286, 112232. [Google Scholar] [CrossRef]
  30. Azam, A.; Rafig, M.; Shafique, M.; Yuan, J. Towards Achieving Environmental Sustainability: The Role of Nuclear Energy, Renewable Energy, and ICT in the Top-Five Carbon Emitting Countries. Energy Res. 2022, 9, 804706. [Google Scholar] [CrossRef]
  31. Shafique, M.; Azam, A.; Rafig, M.; Luo, X. Life cycle assessment of electric vehicles and internal combustion engine vehicles: A case study of Hong Kong. Res. Transp. Econ. 2022, 91, 101112. [Google Scholar] [CrossRef]
  32. Arabzadeh, V.; Mikkola, J.; Jasiūnas, J.; Lund, P.D. Deep decarbonization of urban energy systems through renewable energy and sector-coupling flexibility strategies. J. Environ. Manag. 2020, 260, 110090. [Google Scholar] [CrossRef]
  33. Sierpińska, M.; Bąk, P. Financial structure of mining sector companies during an economic slowdown. Arch. Min. Sci. 2020, 57, 1089–1100. [Google Scholar]
  34. Rybak, A.; Rybak, A. Possible strategies for hard coal mining in Poland as a result of production function analysis. Resour. Policy 2016, 50, 27–33. [Google Scholar] [CrossRef]
  35. Manowska, A.; Tobór-Osadnik, K.; Wyganowska, M. Economic and social aspects of restructuring Polish coal mining: Focusing on Poland and the EU. Resour. Policy 2017, 52, 192–200. [Google Scholar] [CrossRef]
  36. Jonek-Kowalska, I. Challenges for long-term industry restructuring in the Upper Silesian Basin. What has Polish coal mining achieved and failed from a twenty—Year perspective? Resour. Policy 2015, 44, 135–149. [Google Scholar] [CrossRef] [Green Version]
  37. Hąbek, P.; Wolniak, R. Assessing the quality of corporate social responsibility reports; the case of reporting practices in selected European Union member states. Qual. Quan. 2016, 50, 399–420. [Google Scholar] [CrossRef] [PubMed] [Green Version]
  38. Grabowska, S. Improvement of the heat treatment process in the industry 4.0 context. METAL 2018. In Proceedings of the 27th International Conference on Metallurgy and Materials, Brno, Czech Republic, 23–25 May 2018; pp. 1985–1990. [Google Scholar]
  39. Brzychczy, E. An overview of data mining and process mining applications in underground mining. Min. Eng. 2019, 21, 301–314. [Google Scholar] [CrossRef]
  40. Manowska, A. Forecast to determine a development strategy for the mining sector, Conference proceedings. In Ecology, Economics, Education and Legislation, Environmental Economics; STEF92 Technology: Sofia, Bulgaria, 2018; Volume 18, pp. 967–974. [Google Scholar]
  41. Bluszcz, A. Multidimensional comparative analysis as a tool for assessing the level of development of energy markets in selected European countries. In Proceedings of the World Multidisciplinary Earth Sciences Symposium WMESS, Prague, Czech Republic, 7–9 September 2020. [Google Scholar]
  42. Wang, Z.; Wang, Q.; Yang, X.; Xia, S.; Zheng, A.; Zeng, K.; Zhao, Z.; Li, H.; Sobek, S.; Werle, S. Comparative assessment of pretreatment options for biomass pyrolysis: Linking biomass compositions to resulting pyrolysis behaviors, kinetics, and product yields. Energy Fuels 2021, 35, 4. [Google Scholar] [CrossRef]
  43. Sukiennik, M.; Kowal, B. Analysis and Verification of Space for New Businesses in Raw Material Market—A Case Study of Poland. Energies 2022, 15, 3042. [Google Scholar] [CrossRef]
  44. Zinecker, M.; Skalická, M.; Balcerzak, A.P.; Pietrzak, M.B. Business angels in the Czech Republic: Characteristics and a classification with policy implications. Econ. Res.-Kenosha Istraživanja 2021, 35, 273–298. [Google Scholar] [CrossRef]
  45. Gorączkowska, J. Enterprise innovation in technology incubators and university business incubators in the context of Polish industry. Oecon. Copernic. 2020, 11, 799–817. [Google Scholar] [CrossRef]
  46. Zinecker, M.; Skalická, M.; Balcerzak, A.P.; Pietrzak, M.B. Identifying the impact of external environment on business angel activity. Econ. Res.-Ekon. Istraživanja 2021, 1–23. [Google Scholar] [CrossRef]
  47. Meluzín, T.; Zinecker, M.; Balcerzak, A.P.; Pietrzak, M.B.; Doubravský, K. Institutional Settings and their Impact on the IPO Activity: An Exploratory Study Based on Qualitative Modelling. Acta Polytech. Hung. 2021, 18, 215–235. [Google Scholar] [CrossRef]
  48. Meluzín, T.; Balcerzak, A.P.; Pietrzak, M.B.; Zinecker, M.; Doubravský, K. The impact of rumours related to political and macroeconomic uncertainty on IPO success: Evidence from a qualitative model. Transform. Bus. Econ. 2018, 2017, 148–169. [Google Scholar]
  49. Meluzín, T.; Zinecker, M.; Balcerzak, A.P.; Doubravský, K.; Pietrzak, M.B.; Dohnal, M. The timing of initial public offerings: Non-numerical model based on qualitative trends. J. Bus. Econ. Manag. 2018, 19, 63–79. [Google Scholar] [CrossRef] [Green Version]
  50. Meluzín, T.; Zinecker, M.; Balcerzak, A.P.; Pietrzak, M.B. Why do companies stay private? Determinants for IPO candidates to consider in Poland and the Czech Republic. East. Eur. Econ. 2018, 56, 471–503. [Google Scholar] [CrossRef]
  51. Carley, S.; Konisky, D.M. The justice and equity implications of the clean energy transition. Nat. Energy 2020, 5, 569–577. [Google Scholar] [CrossRef]
  52. Oehlmann, M.; Meyerhoff, J. Stated preferences towards renewable energy alternatives in Germany—Do the consequentiality of the survey and trust in institutions matter? J. Environ. Econ. Policy 2016, 6, 1–16. [Google Scholar] [CrossRef]
  53. Rogers, J.; Simmons, E.; Convery, I.; Weatherall, A. Public perceptions of opportunities for community-based renewable energy projects. Energy Policy 2008, 36, 4217–4226. [Google Scholar] [CrossRef] [Green Version]
  54. Zoellner, J.; Schweizer-Ries, P.; Wemheuer, C. Public acceptance of renewable energies: Results from case studies in Germany. Energy Policy 2008, 36, 4136–4141. [Google Scholar] [CrossRef]
  55. Hussain, H.I.; Szczepańska-Woszczyna, K.; Kamarudin, F.; Anwar, N.A.M.; Saudi, M.H.M. Unboxing the black box on the dimensions of social globalisation and the efficiency of microfinance institutions in Asia. Oecon. Copernic. 2021, 12, 557–592. [Google Scholar] [CrossRef]
  56. Bluszcz, A. Selected problems of Poland’s energy transformation in the light of the requirements of the European Green Deal. In Proceedings of the 7th World Multidisciplinary Earth Sciences Symposium (WMESS 2021), Prague, Czech Republic, 6–10 September 2021. [Google Scholar]
  57. Manowska, A. Forecasting of the share of renewable sources in the total final energy consumption for selected European Union countries. In Proceedings of the 7th World Multidisciplinary Earth Sciences Symposium (WMESS 2021), Prague, Czech Republic, 6–10 September 2021. [Google Scholar]
  58. Manowska, A. Analysis and forecasting of the primary energy consumption in Poland using deep learning. Inżynieria Miner. 2020, 21, 217–222. [Google Scholar] [CrossRef]
  59. Bluszcz, A.; Manowska, A. The use of hierarchical agglomeration methods in assessing the Polish energy market. Energies 2021, 14, 3958. [Google Scholar] [CrossRef]
  60. Ministerstwo Klimatu i Środowiska (Ministry of Assets). Polityka Energetyczna Polski do 2040 r (Poland’s Energy Policy until 2040). Available online: www.gov.pl (accessed on 15 November 2021).
  61. Hagen, R. How is the international price of a particular crude determined? OPEC Rev. 1994, 18, 145–158. [Google Scholar] [CrossRef]
  62. Stevens, P. The determination of oil prices 1945–1995. Energy Policy 1995, 23, 861–870. [Google Scholar] [CrossRef]
  63. Amin-Naseri, M.R.; Gharacheh, E.A. A hybrid artificial intelligence approach to monthly forecasting of crude oil price time, series. In Proceedings of the 10th International Conference on Engineering Applications of Neural Networks (CEUR-WS284), Salamanca, Spain, 10–12 June 2007; pp. 160–167. [Google Scholar]
  64. Cabedo, J.D.; Moya, I. Estimating oil price ‘Value at Risk’ using the historical simulation approach. Energy Econ. 2003, 25, 239–253. [Google Scholar] [CrossRef]
  65. Karakurt, I. Modelling and forecasting the oil consumptions of the BRICS-T countries. Energy 2021, 220, 119720. [Google Scholar] [CrossRef]
  66. Kang, S.H.; Kang, S.M.; Yoon, S.M. Forecasting volatility of crude oil markets. Energy Econ. 2009, 31, 119–125. [Google Scholar] [CrossRef]
  67. Wei, Y.; Wang, Y.; Huang, D. Forecasting crude oil market volatility: Further evidence using GARCH-class model. Energy Econ. 2010, 31, 1477–1484. [Google Scholar] [CrossRef]
  68. Zhang, Y.; Wahab, M.I.M.; Wang, Y. Forecasting crude oil market volatility using variable selection and common factor. Int. J. Forecast. 2022, in press. [Google Scholar] [CrossRef]
  69. Degiannakis, S.; Filis, G. Forecasting oil price realized volatility using information channels from other asset classes. J. Int. Money Financ. 2017, 76, 28–49. [Google Scholar] [CrossRef] [Green Version]
  70. Olkuski, T.; Szurlej, A.; Tora, B.; Karpiński, M. Polish energy security in the oil sector. E3S Web Conf. 2019, 108, 02015. [Google Scholar] [CrossRef]
  71. Kamyk, J.; Kot-Niewiadomska, A.; Galos, K. The criticality of crude oil for energy security: A case of Poland. Energy 2021, 220, 119707. [Google Scholar] [CrossRef]
  72. Olkuski, T.; Sikora, A.; Sikora, M.P.; Szurlej, A. The forecasted production, consumption, and net exports of energy resources in Poland. Energy Policy J. 2017, 20, 41–58. [Google Scholar]
  73. Krawczyk, A. Analysis of Energy Consumption for Heating in a Residential House in Poland. Energy Procedia 2016, 95, 216–222. [Google Scholar] [CrossRef] [Green Version]
  74. Skrodzka, W. Analysis of the Structure of Primary Energy Production in Poland Against the European Union. In Proceedings of the International Conference on European Integration, Ostrava, Czech Republic, 19–20 May 2016. [Google Scholar]
  75. Energy Information Administration, USA. 2021. Available online: www.eia.gov (accessed on 15 May 2022).
  76. World Energy Outlook 2022, IEA 2022. Available online: www.iea.org/topics/world-energy-outlook (accessed on 15 May 2022).
  77. BP. 2022. Available online: www.bp.com/en/global/corporate/investors/annual-report.html (accessed on 15 May 2022).
  78. Available online: https://yearbook.enerdata.net/crude-oil/world-production-statistics.html (accessed on 15 May 2022).
  79. World Oil Statistics—Worldometer. Available online: worldometers.info (accessed on 1 May 2022).
  80. Supply—Key World Energy Statistics 2021—Analysis—IEA. Available online: www.iea.org/reports/key-world-energy-statistics-2021/supply (accessed on 2 May 2022).
  81. Papież, M.; Śmiech, S. Modelowanie i Prognozowanie cen Surowców Energetycznych; Publishing House C.H.BECK: Warszawa, Poland, 2015. [Google Scholar]
  82. Prawo Energetyczne (Dz. U. z 2021 r. poz. 716, z zm.). Available online: www.infor.pl/akt-prawny/DZU.2021.109.0000716,ustawa-prawo-energetyczne.html (accessed on 3 May 2022).
  83. Krajowy Plan na Rzecz Energii i Klimatu na Lata 2021–2030 (KPEiK). Available online: www.gov.pl/web/klimat/projekt-krajowego-planu-na-rzecz-energii-i-klimatu-na-lata-2021-2030 (accessed on 2 May 2022).
  84. Kaliski, M.; Staśko, D. Bezpieczeństwo Energetyczne w Gospodarce Paliwowej Polski; Wydawnictwo Instytutu Surowcami Mineralnymi i Energią PAN: Kraków, Poland, 2006. [Google Scholar]
  85. Rybak, A.; Manowska, A. The forecast of coal sales taking the factors influencing the demand for hard coal into account. Resour. Manag. 2019, 35, 129–140. [Google Scholar]
  86. Cheong, C.W. Modeling and forecasting crude oil markets using ARCH-type models. Energy Policy 2009, 37, 2346–2355. [Google Scholar] [CrossRef]
  87. Wang, D.; Fang, T. Forecasting Crude Oil Prices with a WT-FNN Model. Energies 2022, 15, 1955. [Google Scholar] [CrossRef]
  88. Manowska, A. Using the LSTM network to forecast the demand for electricity in Poland. Appl. Sci. 2020, 10, 8455. [Google Scholar] [CrossRef]
  89. Manowska, A. Using the LSTM network to forecast the demand for hard coal. Miner. Resour. Manag. 2020, 36, 33–48. [Google Scholar]
  90. Manowska, A. Modeling of Changes in the Polish Energy Mix Structure Resulting from World Megatrends; Publishing House Silesian University of Technology: Gliwice, Poland, 2021; p. 191. [Google Scholar]
  91. Wu, B.; Wanga, L.; Wanga, S.; Zengb, Z. Forecasting the U.S. oil markets based on social media information during the COVID-19 pandemic. Energy 2021, 226, 1. [Google Scholar] [CrossRef]
  92. Zhang, Y.; Wang, Y. Forecasting crude oil futures market returns: A principal component analysis combination approach. Int. J. Forecast. 2022, in press. [Google Scholar] [CrossRef]
  93. Hamdi, E.; Aloui, C. Forecasting Crude Oil Price Using Artificial Neural Networks: A Literature Survey’. Econ. Bull. 2015, 35, 1339–1359. [Google Scholar]
  94. Anik, A.R.; Rahman, S. Commercial Energy Demand Forecasting in Bangladesh. Energies 2021, 14, 6394. [Google Scholar] [CrossRef]
  95. Hyndman, R.J.; Kostenko, A.V. Minimum sample size requirements for seasonal forecasting models. Foresight 2007, 6, 12–15. [Google Scholar]
  96. Ingrassia, S.; Morlini, I. Neural network modeling for small datasets. Technometrics 2005, 47, 297–311. [Google Scholar] [CrossRef] [Green Version]
  97. Pasini, A. Artificial neural networks for small dataset analysis. J. Thorac. Dis. 2015, 7, 953. [Google Scholar]
  98. Del Real, A.J.; Dorado, F.; Durán, J. Energy Demand Forecasting Using Deep Learning: Applications for the French Grid. Energies 2020, 13, 2242. [Google Scholar] [CrossRef]
  99. Ma, R.; Zheng, X.; Wang, P.; Liu, H.; Zhang, C. The prediction and analysis of COVID-19 epidemic trend by combining LSTM and Markov method. Sci. Rep. 2021, 11, 17421. [Google Scholar] [CrossRef]
  100. Wu, X.; Liu, Z.; Yin, L.; Zheng, W.; Song, L.; Tain, J.; Yang, B.; Liu, S. A Haze Prediction Model in Chengdu Based on LSTM. Atmosphere 2021, 12, 1479. [Google Scholar] [CrossRef]
  101. Hochreiter, S.; Schmidhuber, J. Long short-term memory. Neural Comput. 1997, 9, 1735–1780. [Google Scholar] [CrossRef]
  102. Zeliaś, A.; Wanat, S.; Pawełek, B. Prognozowanie Ekonomiczne; Publishing House PWN: Warszawa, Poland, 2008. [Google Scholar]
Figure 1. Consumption of energy resources in the world, own study based on [77].
Energies 15 04885 g001
Figure 2. Global energy consumption in 2020, own study based on [77].
Energies 15 04885 g002
Figure 3. World crude oil production in particular years of the period (Mt), own study based on [77].
Energies 15 04885 g003
Figure 4. Primary energy production in Poland, own study based on [77].
Energies 15 04885 g004
Figure 5. Distribution of LSTM network learning errors, own study.
Energies 15 04885 g005
Figure 6. Evaluation loss vs. iterations, own study.
Energies 15 04885 g006
Figure 7. Theoretical model of crude oil consumption with analysis of errors, own study.
Energies 15 04885 g007
Figure 8. Forecasting crude oil consumption, own study.
Energies 15 04885 g008
Table 1. Primary energy supply in particular years of the period 1990–2020.
Energy Resource [EJ]1990200020102020
Coal9396.9153162.4
Oil135.3153.6167.6187.4
Natural gas69.686.6114.4140.8
Nuclear energy2228.330.130.5
Hydro7.79.412.412.5
Biofuels and waste38.241.549.115.2
Other1.82.64.716.5
Total367.6418.9531.3568
Source: (own elaboration).
Table 2. The share of individual energy carriers in the total primary-energy supply (in %) in particular years of the period 1990–2020.
Energy Resource [EJ]1990200020102020
Coal25%23%29%29%
Oil37%37%32%33%
Natural gas19%21%22%25%
Nuclear energy6%7%6%5%
Hydro2%2%2%3%
Biofuels and waste10%10%9%3%
Other0%1%1%3%
Source: (own elaboration).
Table 3. A summary of existing studies on forecasting of natural gas consumption.
Autor(s) Goal Method
Wang et al. [87]A new method of oil price forecastingA combination of the FNN model and the stochastic time-effective function-WT-FNN
Wu et al. [91]A new method of oil price forecastingSocial media information was used in convolutional neural network, which can finely reflect oil market factors and exogenous factors, such as conflicts and political instability.
Zhang et al. [92]Predicted the predictability of market returns on oil futures A principal component analysis (PCA)
Hamdi et al. [93]They showed that the use of neural networks is the right choice due to the non-linear nature of crude oil pricesThey compared traditional methods with econometric models and with artificial neural networks.
Anik et al. [94]They forecasted the demand for primary energy, with particular emphasis on the demand for crude oil.They used the Cobb–Douglas function for forecasting.
Manowska [88,89,90]They analyzed the use of mathematical models to forecast fossil resourcesIn their works, they paid special attention to the non-stationarity of processes and the non-linear nature of their wear. They proposed the use of LSTM artificial neural net-works, which are highly effective in forecasting small-scale, non-linear data sets
Table 4. Extended Dickey–Fuller test for oil-consumption time series.
Extended Dickey–Fuller test for the crude oil consumption process
the significance of the delay from the order of 10 was tested for the AIC criterion
sample size 51
Null hypothesis: unit root a = 1 exists; process I (1)
test with constant
for an order delay of the 4th process (1-L) of the crude oil consumption series
model: (1-L) y = b0 + (a − 1) ∗ y (−1) + … + e
the estimated value of (a − 1) is: −0.0094344
Test statistic: tau_c (1) = −0.432418
asymptotic p-value = 0.9014
First-order residual autocorrelation: 0.002
delayed differences: F (4, 45) = 5.135 [0.0017]
 
with a constant and a linear trend
for the first-order process delay (1-L) of the crude oil consumption series
model: (1-L) y = b0 + b1 ∗ t + (a − 1) ∗ y (−1) + … + e
the estimated value of (a − 1) is: −0.164256
Test statistic: tau_ct (1) = −3.03071
asymptotic p-value = 0.1237
First order residual autocorrelation: −0.056
 
with a constant, linear trend and square trend
for an order 2 (1-L) delay of the crude oil consumption series
model: (1-L) y = b0 + b1 ∗ t + b2 ∗ t ^ 2 + (a − 1) ∗ y (−1) + … + e
the estimated value of (a − 1) is: −0.206229
Test statistic: tau_ctt (1) = −3.3558
asymptotic p-value = 0.1539
First-order residual autocorrelation: 0.014
delayed differences: F (2, 47) = 9.160 [0.0004]
The analysis was made in Gretl software for the adopted level of significance α = 0.05.
Table 5. Descriptive statistics.
Measures
Mean18.51
Standard error0.92
Median17.51
Standard deviation6.74
Sample variance45.42
Kurtosis−0.51
Skewness0.09
Range27.28
Minimum5.54
Maximum32.82
Quantity55.00
The largest32.82
The smallest5.54
Confidence level (95.0%)1.84
Source: (own elaboration).
Table 6. Model: “sequential”.
Layer (Type)Output ShapeParam
lstm (LSTM)(None, 3, 3)60
dropout (Dropout)(None, 3, 3)0
lstm_1 (LSTM)(None, 1)20
dense (Dense)(None, 1)2
Total params: 82; trainable params: 82; non-trainable params: 0.
Table 7. Program listing.
A Recurrent Neural Network (LSTM) Implementation Using TensorFlow Library
Loading and reading the data filefrom google.colab import files
uploaded = files.upload()
df = pd.read_csv(io.BytesIO(uploaded[‘XXX.csv’]))
df.head()
Function that sets the training vectors according (15) and (16)def univariate_data(dataset, start_index, end_index, history_size, target_size):
data = []
labels = []
start_index = start_index + history_size
if end_index is None:
end_index = len(dataset)-target_size
for i in range(start_index, end_index):
indices = range(i-history_size, i)
Reshape data from (history_size,) to (history_size, 1)
data.append(np.reshape(dataset[indices], (history_size, 1)))
labels.append(dataset[i + target_size])
return np.array(data), np.array(labels)
The amount of historical data downloaded for trainingtf.random.set_seed(13)
uni_data = df[‘Crude Oil’]
TRAIN_SPLIT = uni_data.shape [0]−1
uni_data.index = df[‘Year’]
univariate_past_history = 3
univariate_future_target = 0
uni_data.head()
print(TRAIN_SPLIT)
uni_data.plot(subplots = True)
uni_data1 = uni_data
uni_data = uni_data.values
Network trainingtrain_univariate = tf.data.Dataset.from_tensor_slices((x_train_uni, y_train_uni))
train_univariate = train_univariate.cache().shuffle(BUFFER_SIZE).batch(BATCH_SIZE).repeat()
val_univariate = tf.data.Dataset.from_tensor_slices((x_val_uni, y_val_uni))
val_univariate = val_univariate.batch(BATCH_SIZE).repeat()
simple_lstm_model = tf.keras.models.Sequential([
tf.keras.layers.LSTM(3, input_shape = (x_train_uni.shape [1],x_train_uni.shape [2]), return_sequences=True),
tf.keras.layers.LSTM(1, input_shape = (x_train_uni.shape [1],x_train_uni.shape [2]), return_sequences=False),
tf.keras.layers.Dropout(rate = 0.03),
tf.keras.layers.LSTM(1,activation = ‘relu’),
tf.keras.layers.Dropout(rate = 0.3),
tf.keras.layers.Dense(1)
])
simple_lstm_model.compile(optimizer = ‘adam’, loss = ‘mae’)
simple_lstm_model.fit(train_univariate, epochs = EPOCHS, steps_per_epoch = EVALUATION_INTERVAL, validation_data = val_univariate, validation_steps = 50, callbacks = [tensorboard_callback])
Prediction for test dataresult = []
print(“Model prediction on test data “)
for i in range(x_train_uni.shape [0]):
for j in range(univariate_past_history):
x_val_uni [0,:,0] = x_train_uni[i,:,0]
val_univariate = tf.data.Dataset.from_tensor_slices((x_val_uni, y_val_uni))
val_univariate = val_univariate.batch(BATCH_SIZE).repeat()
x,y = val_univariate.take(2)
predykcja = simple_lstm_model.predict(x [0])
wynik = np.append(wynik,predykcja [0])
print(predykcja [0])
pandaresalt = pd.DataFrame(resalt)
pandaresalt.plot(subplots = True)
uni_data2 = uni_data1[univariate_past_history:uni_data1.shape [0]−1]
uni_data2.index = pandaresalt.index
uni_data2.plot(subplots = True)
Proper predictionprint(“Proper prediction “)
for k in range(35):
for m in range(univariate_past_history−1):
x_val_uni [0,m,0] = x_val_uni [0,m + 1,0]
x_val_uni [0,univariate_past_history−1,0] = predykcja [0]
val_univariate = tf.data.Dataset.from_tensor_slices((x_val_uni, y_val_uni))
val_univariate = val_univariate.batch(BATCH_SIZE).repeat()
x,y = val_univariate.take(2)
predykcja = simple_lstm_model.predict(x [0])
resalt = np.append(resalt,predykcja [0])
print(predykcja [0])
print(“Resalt “, i + 1, “forecasting”)
pandawynik = pd.DataFrame(resalt)
pandawynik.plot(subplots = True)
Publisher’s Note: MDPI stays neutral with regard to jurisdictional claims in published maps and institutional affiliations.

