Article

Prediction of the Absolute Methane Emission Rate for Longwall Caving Extraction Based on Rock Mass Modelling—A Case Study

by
Phu Minh Vuong Nguyen
1,*,
Andrzej Walentek
1,
Krystian Wierzbiński
1 and
Marian Zmarzły
2
1
Central Mining Institute, 1 Gwarków Sq., 40-166 Katowice, Poland
2
Jastrzębska Spółka Węglowa S.A., 4 Jana Pawła II St., 44-330 Jastrzębie-Zdrój, Poland
*
Author to whom correspondence should be addressed.
Energies 2022, 15(14), 4958; https://doi.org/10.3390/en15144958
Submission received: 27 May 2022 / Revised: 4 July 2022 / Accepted: 4 July 2022 / Published: 6 July 2022
(This article belongs to the Special Issue Coal Mining)

Abstract

:
This article presents a methodology for predicting the absolute methane emission rate for longwall caving extraction based on the determination of destressing zones generated by longwall mining operations, by means of numerical modelling. This methodology was applied for the conditions of the K-2 longwall panel in the KWK Pniówek mine. The finite difference method code FLAC2D was employed as an element of the methodology to determine the destressing zones. All results including the numerical modelling results, empirical results and the measured (in situ) results were gathered in the comparative analysis. As the final results, the accuracy and reliability of the proposed methodology were evaluated.

1. Introduction

Methane hazard is a common phenomenon in hard coal mines, which intensifies with the increasing depth of the operated mining activities. Methane hazard forecasting is an auxiliary measure intended for the determination of the possible methane emissions from the rock mass to the underground working in a given area subjected to longwall mining. It can be used as the basis for decision making within the scope of: preventive measure selection for methane hazard elimination, ventilation system design and methane drainage methods.
Numerous approaches have been developed for the purpose of forecasting the absolute methane emission rate, including the following:
  • Empirical methods: Kirchgessner et al. [1] presented an equation based on the multilinear regression method, comprising the methane content emitted from a given coal seam, the coal extraction rate and the entire mine’s methane emission rate. Based on the historical data of underground mine-related methane emissions to the atmosphere in the United Kingdom, Creedy [2] summarized all the methane emissions from mines without methane drainage, from mines with drainage, from transported coal and from coal stored in stockyards on the surface. Lunarzewski [3] also proposed a function of the relationship between the coal extraction and the different variable empirical constants. The empirical method known as dynamic absolute longwall methane emission rate forecasting is commonly employed in Polish hard coal mining [4,5,6,7,8,9,10,11,12,13].
  • Analytical methods: in Australia, the employed approach is the direct desorption method, which is based on measuring the methane content in coal samples [14].
  • Statistical methods: Methane emission forecasting in China is generally based on the statistical method, which considers the historical methane emission data. The statistical approach adopts a number of assumptions concerning the geological conditions and the mining practices at the site encompassed by the forecasting [15]. Karacan and Olea [16] inferred the emission paths based on standard data obtained from the geophysical profiling of boreholes. The proposed technique was employed in the Black Warrior Basin, Alabama, using well logs from a series of boreholes aligned along a linear profile.
  • Numerical methods: Many approaches were developed using computational fluid dynamics (CFD). Ren and Edwards [17] used laboratory data for simulating the methane flow through the rock strata surrounding a longwall panel, where the permeability is significantly dependent on the stresses generated by longwall mining. Kurnia et al. [18] simulated the behaviour of air flow and methane dispersion in a working. Results of numerical modelling were used for determining the influence of the caving zone on the methane concentration at the longwall entry [19,20]. More applications of CFD can be found in a number of studies [21,22,23,24,25]. Other approaches were based on finite difference method codes (FLAC2D). Karacan et al. [26] presented the application of geomechanical models for the purposes of inspecting the influence of the longwall length on the behaviour of the rock mass, the permeability variation, the methane emission and the design and performance of boreholes for methane drainage. Whittles et al. [27] described the construction and analysis of the results obtained from two- and three-dimensional geomechanical and gas flow models around a longwall in the United Kingdom. The numerical calculation results enabled the correct design of the orientation, length and support of the boreholes for gas drainage. They proposed a functional relationship that made it possible to forecast the intrinsic bulk permeability of a sheared coal measure rock based on the confining stress. Walentek and Wierzbiński [28] defined the influence of the destressing zones on the final forecasting methane emission rate and provided assessments of the rock mass geomechanical parameters on improving the result accuracy of the absolute methane emission rate from the analysed longwall panels. Others used the finite element method (COMSOL). Teng et al. [29] observed a growth in gas sorption and coal permeability under variable temperatures. They developed a model combining heat, gas and coal and applied it to a computational simulation of the thermal recovery of coal seam methane using COMSOL and MATLAB. Li et al. [30] also used COMSOL Multiphysics to reveal the law of air leakage as well as the gas distribution in a longwall caving zone under Y-type ventilation. Some studies also utilised artificial intelligence for the purposes of methane forecasting. Felka and Brodny [31] used a neuro-fuzzy network to forecast the concentration of methane in a longwall area. They presented the possibility of using artificial intelligence (AI) for forecasting models based on measurement data. Tutak and Brodny [32] presented a methodology for forecasting the methane concentration in a given mine area by means of the artificial neural network method. The forecasting model was constructed based on a multilayer perceptron (MLP) network. Karacan [33] and Karacan and Goodman [34] proposed a model based on principal component analysis (PCA) and an artificial neural network (ANN) to forecast the methane emissions in longwall areas in the United States.
  • Combined methods: These approaches utilise one of the aforementioned methods as well as in situ measurements (monitoring) to determine the methane emission rates. Karacan [35] and Dougherty and Karacan [36] presented a “Methane Control and Prediction” software suite which was developed by means of various statistical mathematical approaches as well as artificial neural network prediction and classification methods. Dziurzyński and Wasilewski [37] carried out a computer simulation of the influence of the shearer operation and the methane flow during said operation on the dispersion of the air and methane mixture, and compared the simulation results with data recorded by automated gasometers during a measuring experiment. Dylong [38] described a proposed system enabling methane concentration measurements and forecasting in a longwall, and the application of knowledge regarding the concentrations to control the operation of the shearer. He also presented the results of a number of experimental studies that revealed the efficiency of the proposed system. Booth et al. [39] proposed a new method for methane emission forecasting that included the basic energy-related principles and computational techniques related to the degree of rock strata variation, the degree of stress variation, the failure mechanism and the degree of pressure variation with reference to space and time.
It should be noted that numerical modelling has been used increasingly often as an auxiliary tool for resolving engineering problems due to the rapid development of computer science. Numerical analyses enable precisely illustrating the specific conditions and the interaction of the studied structures with series of factors as input data, which is not possible in analytical and/or empirical analyses.
In Poland, there are two forecasting methods commonly used for coal mines—relying on the determination of the complex methane pressure, or on the determination of methane emissions by calculating the desorbed methane content [9,10]. The most known method is dynamic absolute longwall methane emission rate forecasting, developed at the Experimental Mine Barbara. It is constantly updated and incorporates the experience gained during its application [11]. In this method, the range of the destressing zone is determined simply by empirical formulas, and geomechanical parameters of the rock mass are not taken into consideration. This is one reason why the average relative error of absolute methane emission rate prediction significantly exceeds the accepted permissible value of 25% (at a level of 40–50%) [12,13].
This article presents an attempt to forecast the absolute methane emission rate of a longwall caving extraction based on the determination of a destressing zone generated by longwall mining operations, by means of numerical modelling. The numerical model was verified based on in situ measurements. The shape and range of the destressing zone around the longwall panel obtained from the numerical modelling were compared with the results of the empirical method. All the numerical calculations were performed, presenting the exact geo-mining conditions of the K-2 longwall panel in the Pniówek coal mine, using the finite difference method code FLAC2D [40]. The measured methane emissions from the studied longwall areas were used in order to evaluate the accuracy of the proposed methodology.

2. A Methodology for Forecasting the Absolute Methane Emission Rate in Longwall Caving Extraction

By using the advantages of the numerical results with an extensive underground measurement, a methodology was proposed for the purpose of predicting the absolute methane emission rate in the area of a longwall caving extraction.

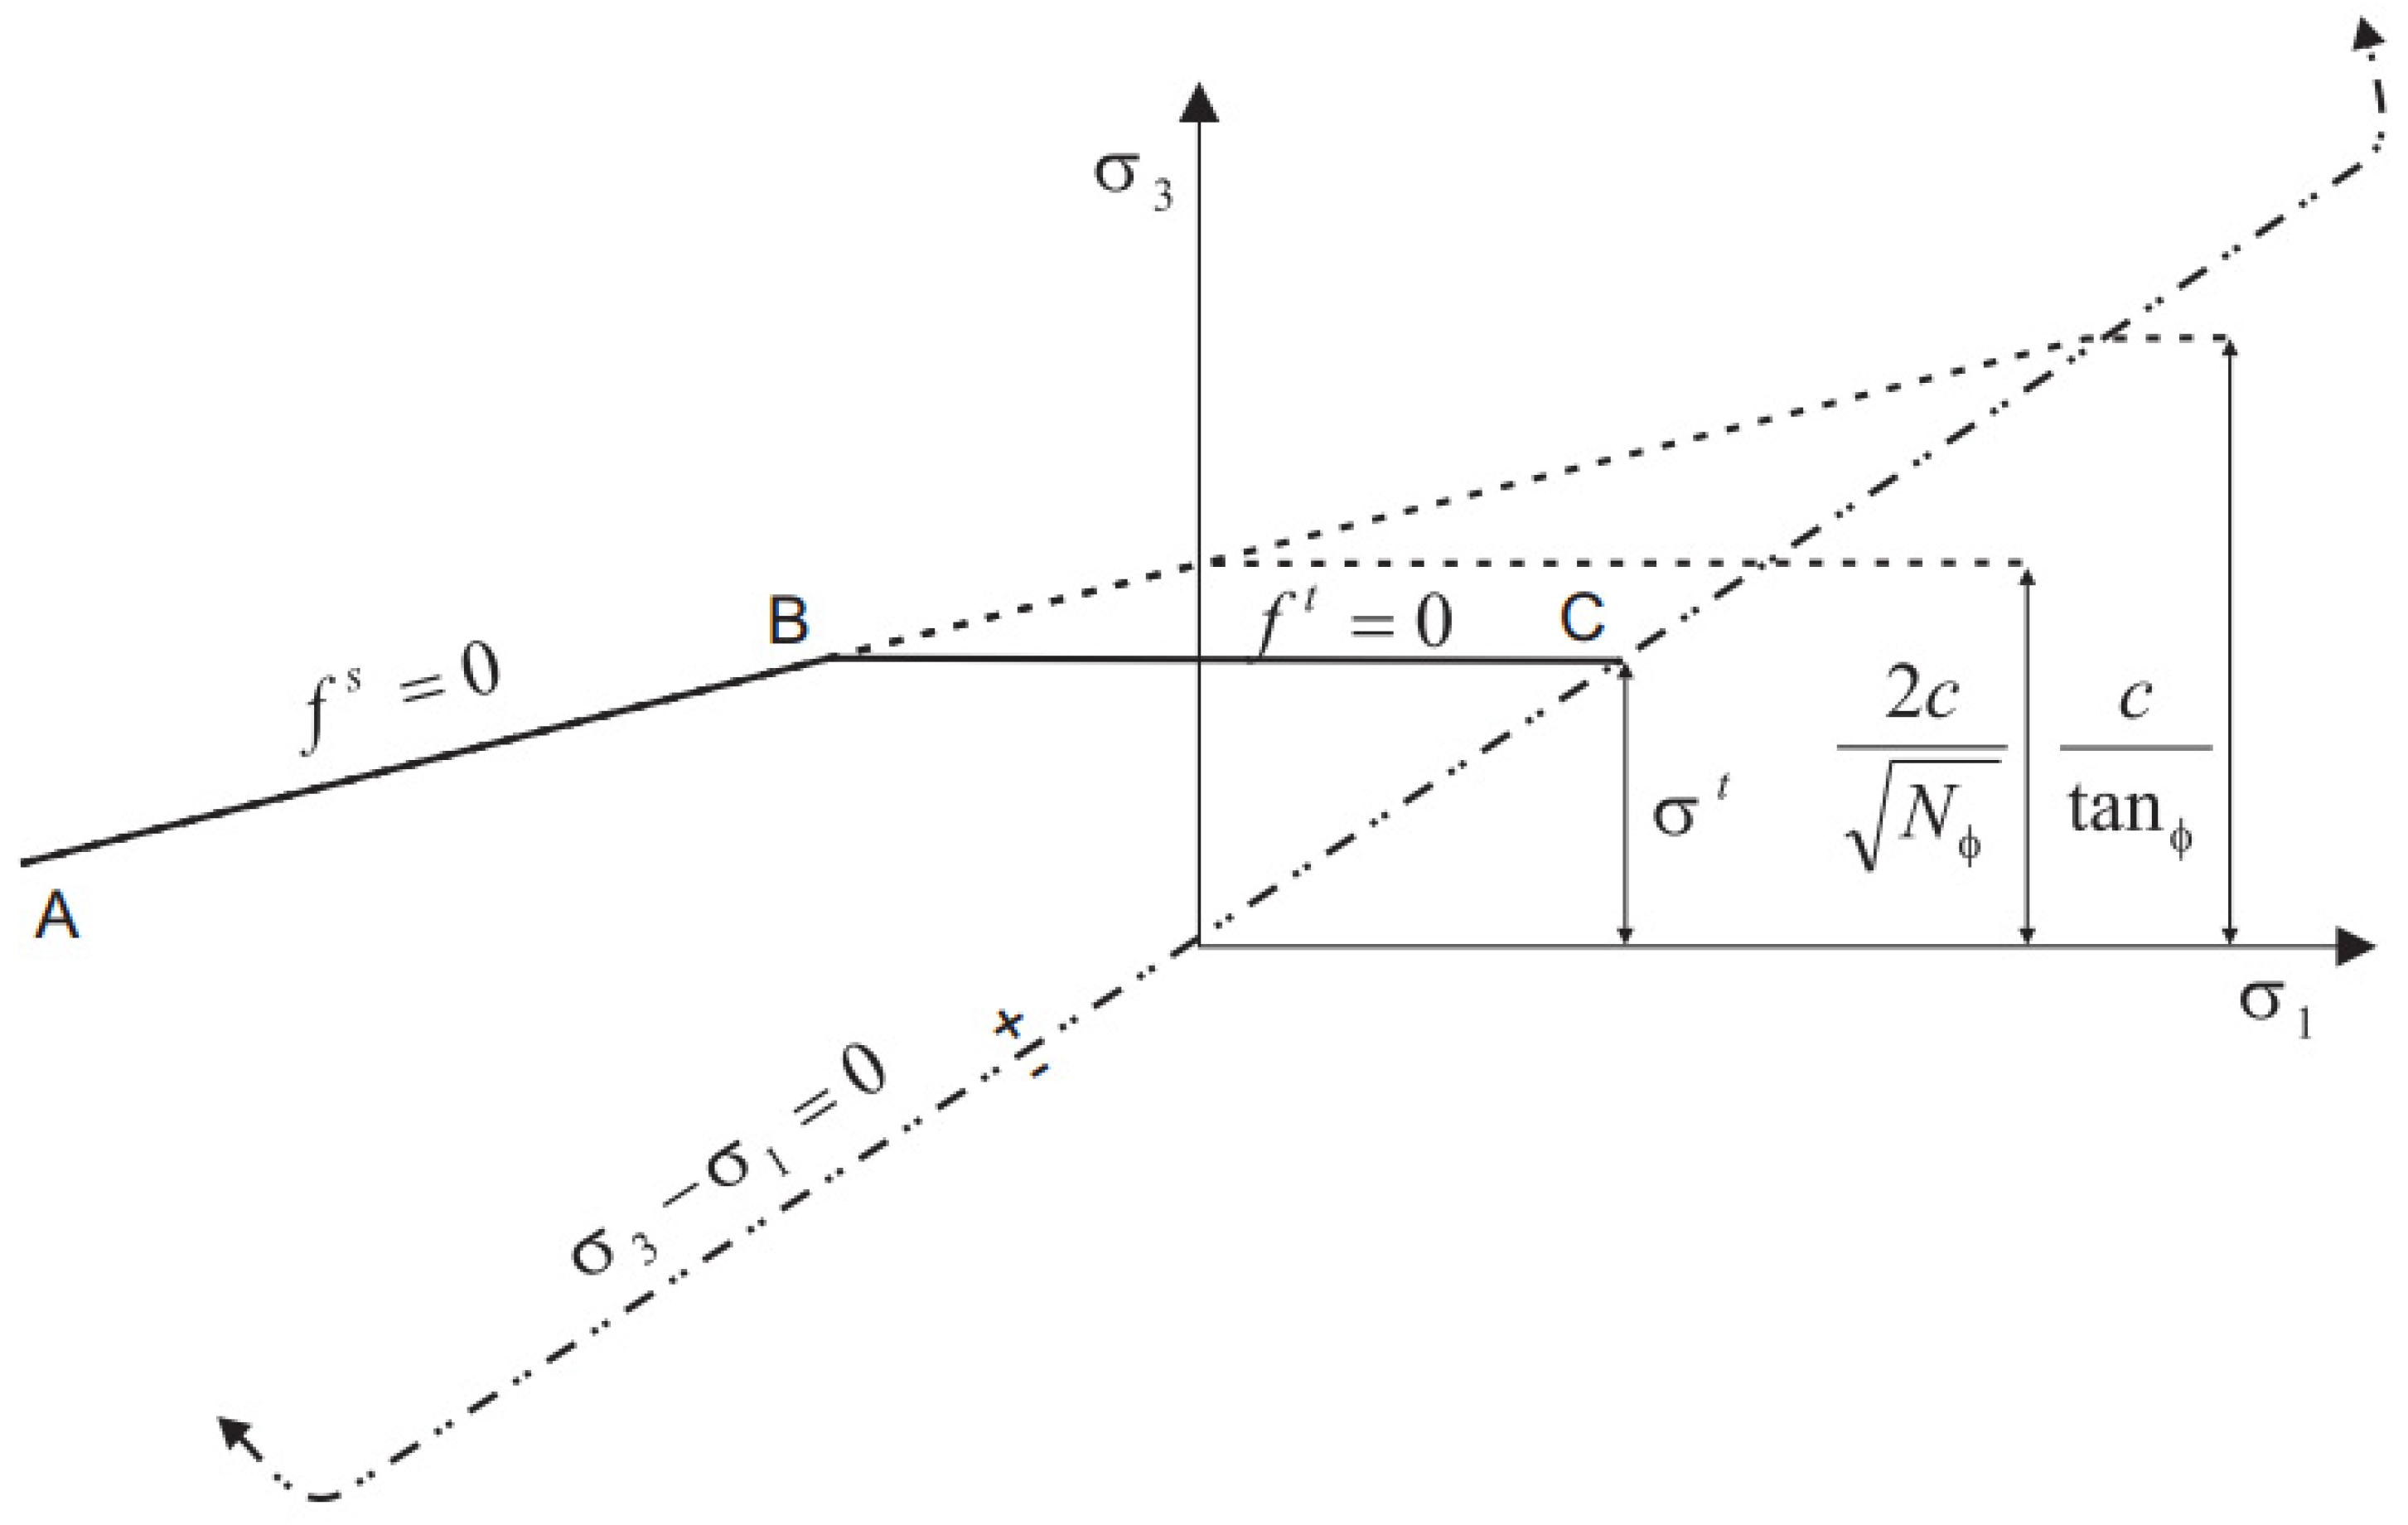
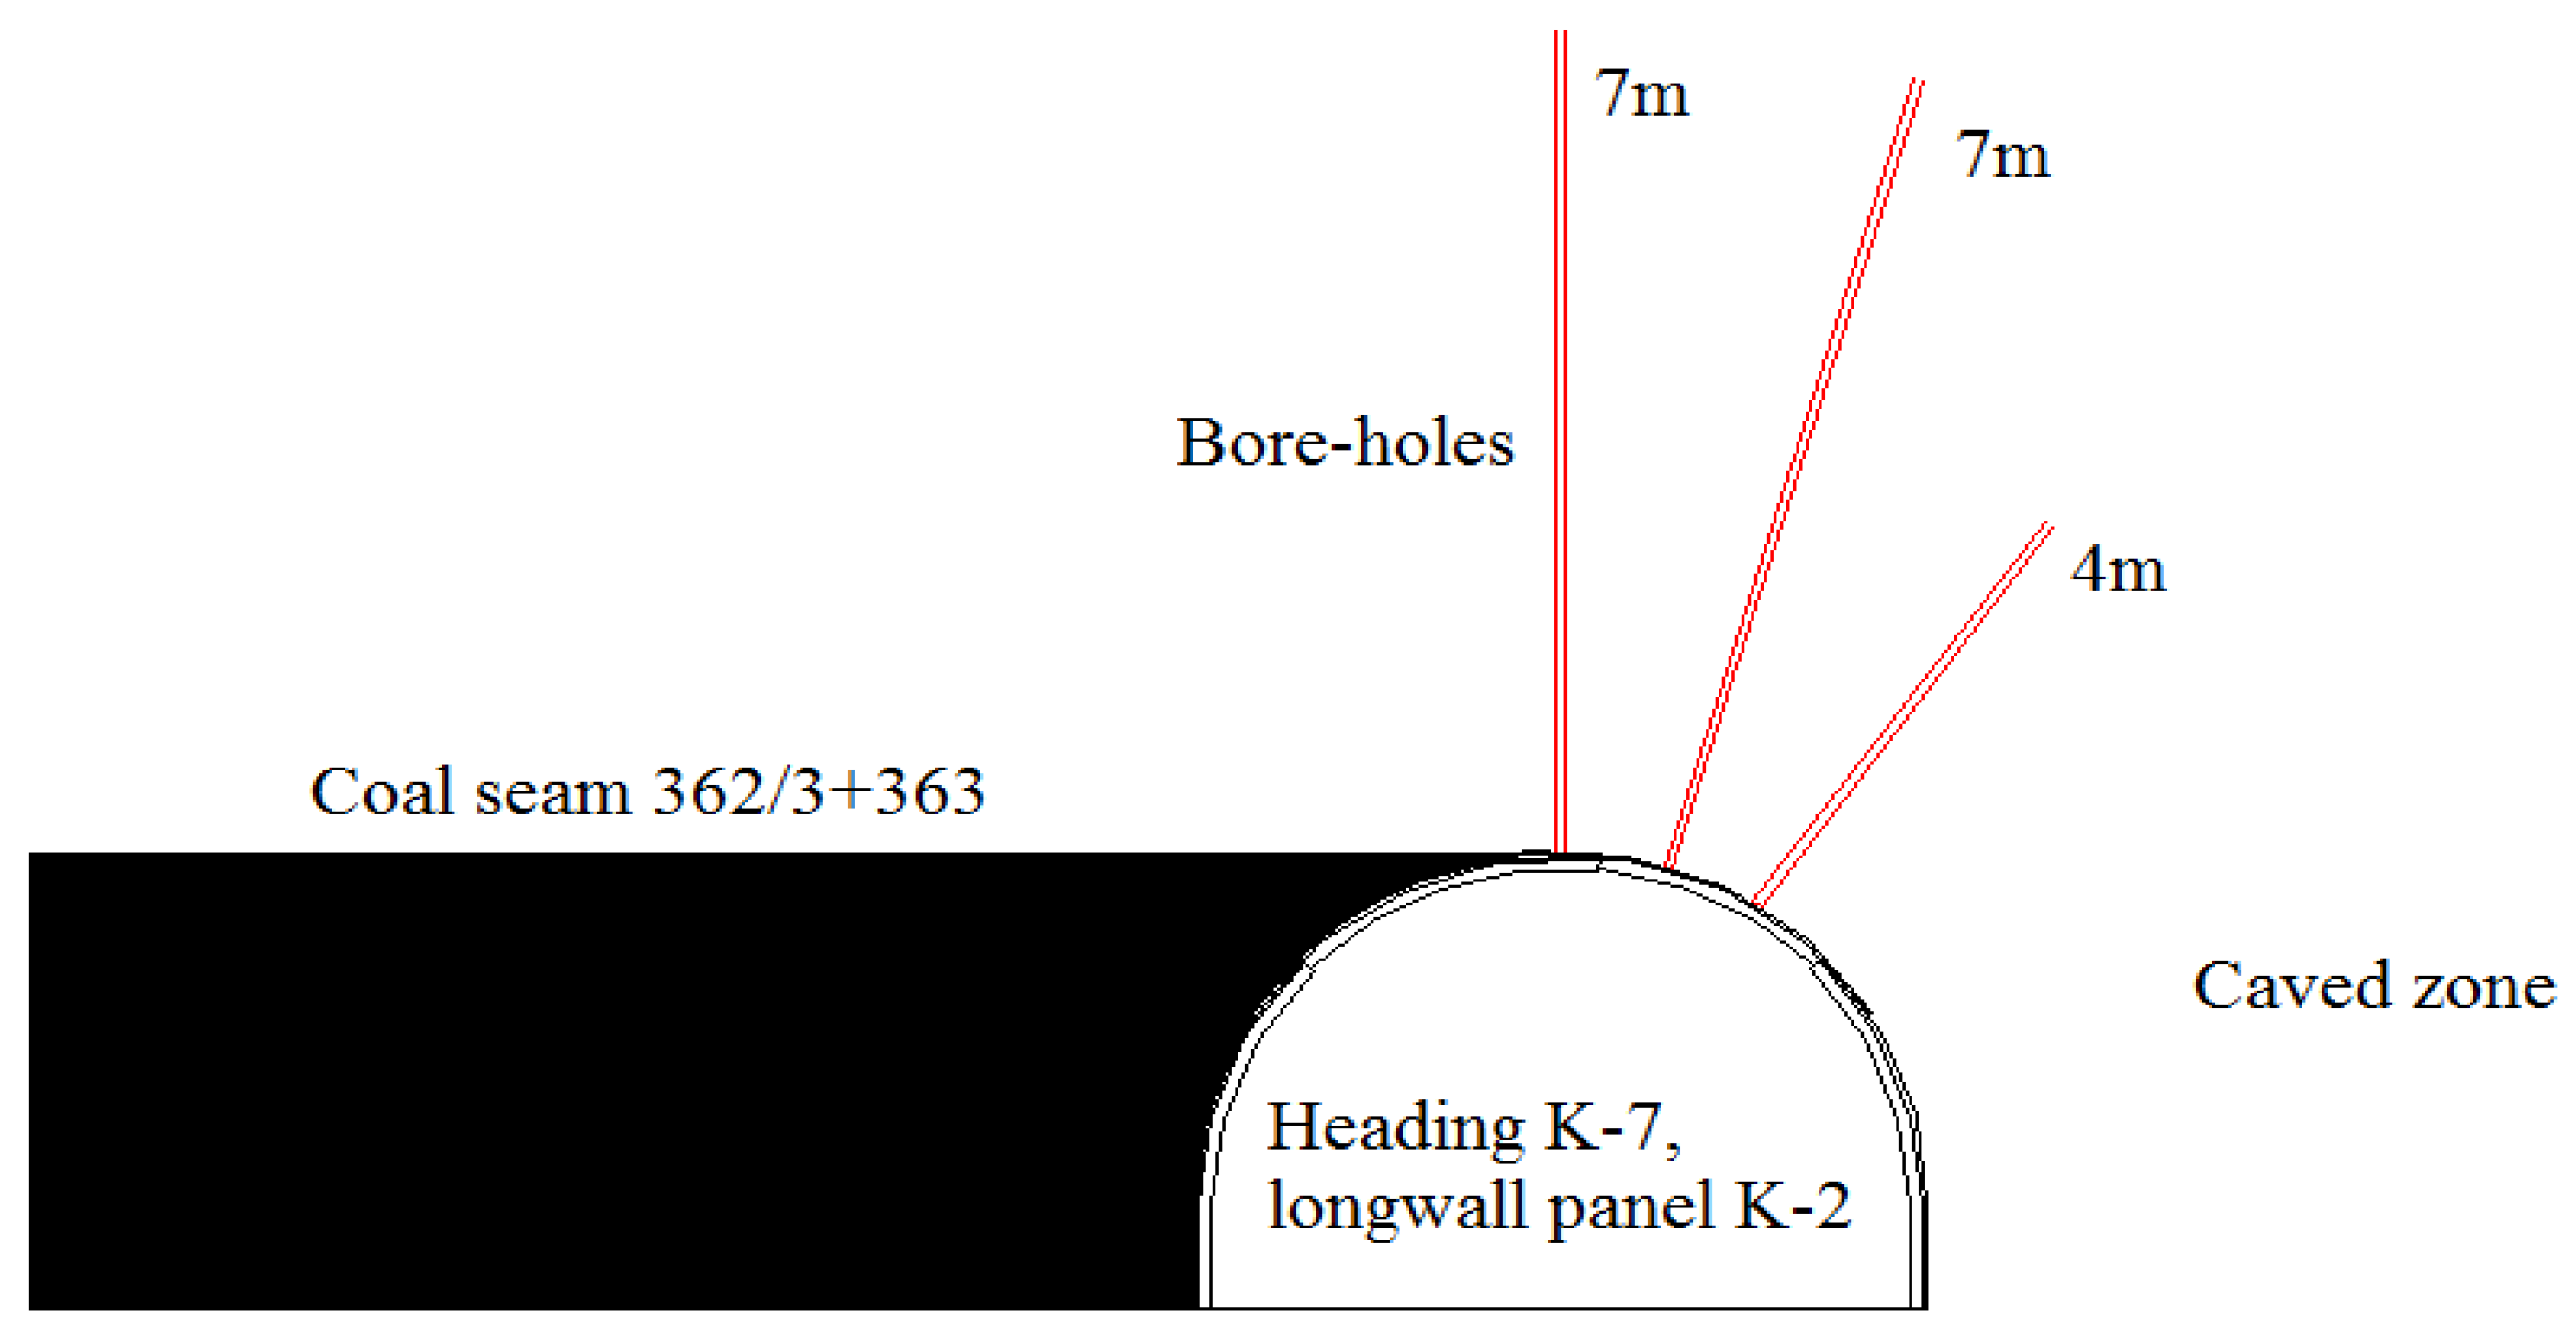
2.1. Empirical Method for Determination of Destressing Zone

The prediction method for the absolute methane emission rate that is commonly used in Polish hard coal mining is based on an algorithm developed at the Experimental Mine Barbara, GIG [10]. In this method, the empirical relationships enable defining the degasification range for rock masses below and above a longwall panel as a result of longwall mining operations, regardless of their geomechanical parameters. An upper desorption zone range (hg) is determined for rock layers located above the longwall panel, which are known as overlaying strata, while for underlaying strata, a lower desorption zone range (hd) is determined. The hg and hd parameters are presented graphically in a vertical section through a methane desorption zone from a destressed mined longwall in Figure 1.
According to the empirical method, the ranges of the upper and lower destressing zones (desorption zones) depend on the longwall length (Ls) and the longwall inclination angle (a). The ranges are defined using Equations (1) and (2):
-
For overlaying coal seams:
h g = L s G g
-
For underlaying coal seams:
h d = L s G d
where Gg and Gd are factors depending on the longwall inclination angle.
The width of the degasification zone for a coal seam within the destressing zone range (Xg, Xd) is determined using Equations (3) and (4):
-
For overlaying coal seams:
X g = L s G g · a
-
For underlaying coal seams:
X d = L s G d · b
where a and b correspond to the distance of the overlaying or underlaying coal seam from the mined coal seam, respectively.

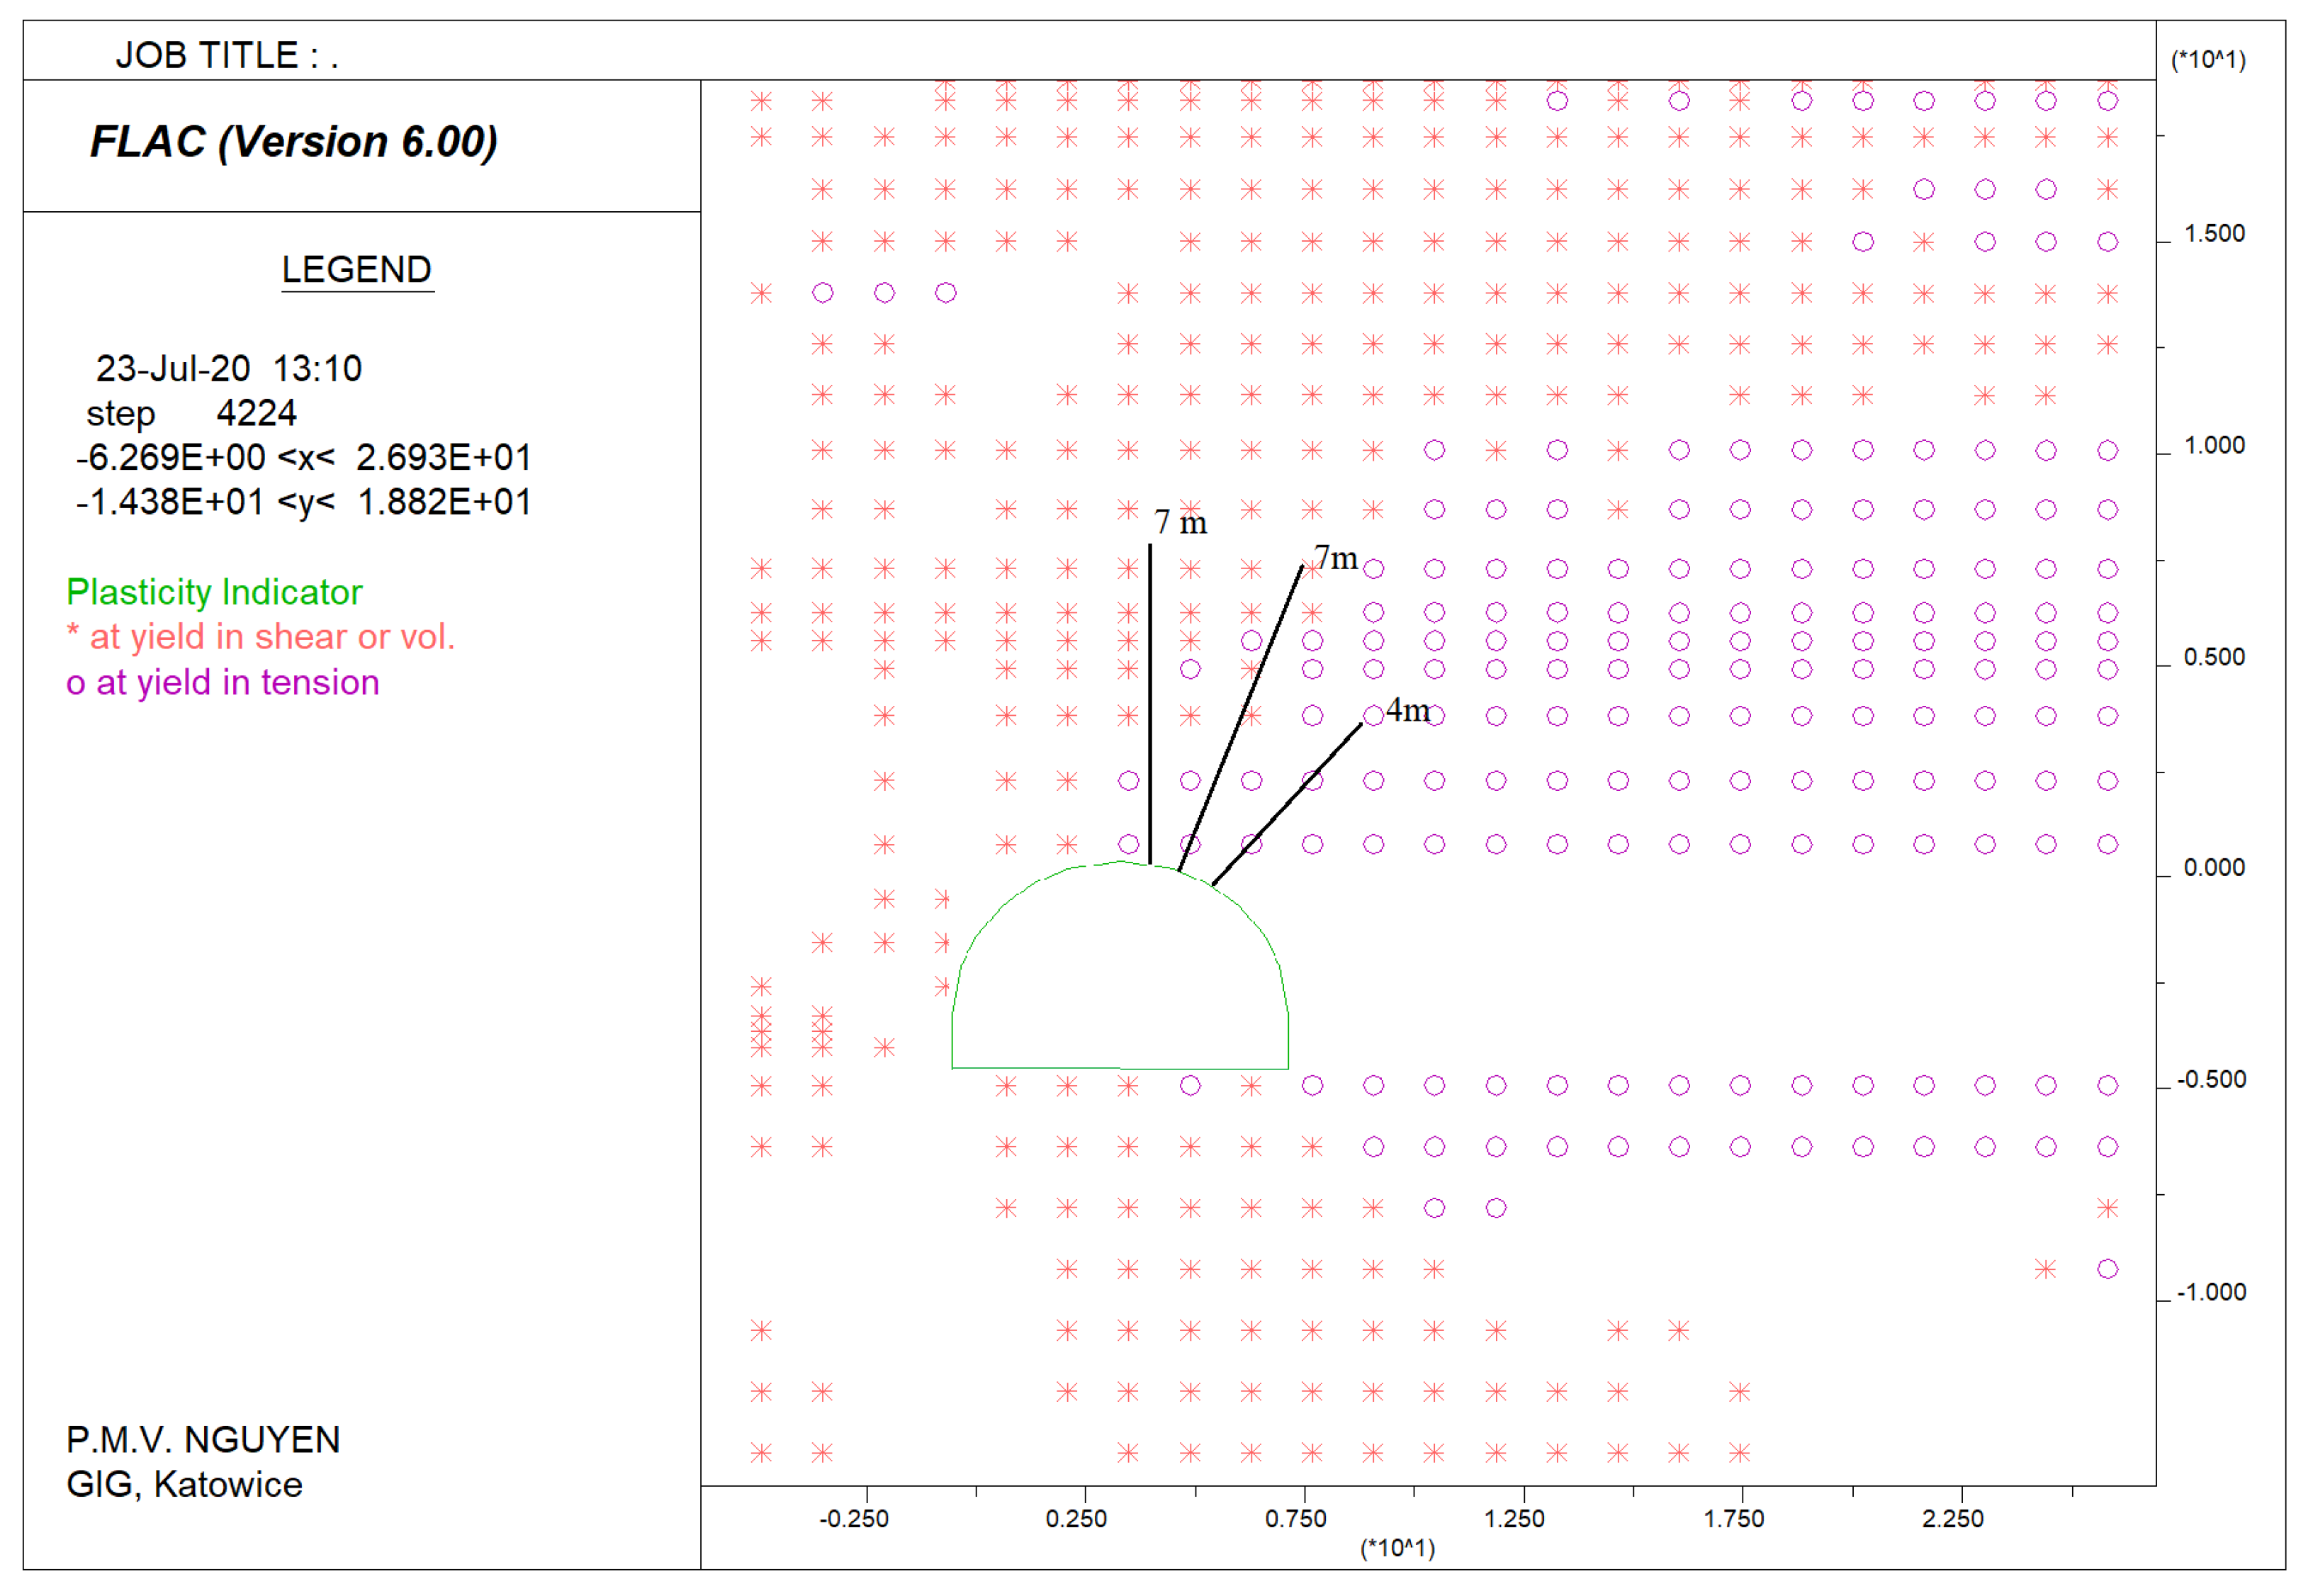
2.2. Brief Description of the FDM Software for Determination of Destressing Zone

FLAC2D is based on the finite difference method (FDM). It is one of the most commonly used codes for rock mass modelling. This code has been developed and improved over time by Itasca. All details of this code including advantages over other modelling approaches, the explicit calculation cycle, the modelling procedure, the implementation of material models and result interpretation can be found in the user’s guide [40,41,42,43,44,45,46]. For the purposes of this work, numerical calculations were carried out using the Mohr–Coulomb elastic–plastic model. The failure envelope for this model corresponds to a Mohr–Coulomb criterion (shear yield function) with a tension cut-off (tensile yield function). The failure criterion may be represented in the plane of principal stresses (σ1, σ3) as shown in Figure 2.
The failure envelope is defined from point A to point B by the Mohr–Coulomb (shear) yield function (Equation (5)) and from B to C by the tension yield function (Equation (6)).
f s = σ 1 σ 3 1 + s i n θ 1 s i n θ + 2 c 1 + s i n θ 1 s i n θ
f t = σ t σ 3
where θ is the friction angle, c is the cohesion and σ t is the tensile strength.
The destressing zone can be determined by using a numerical code such as the FLAC2D code due to the possibility of defining the potential yield occurring in individual points of the rock mass as a result of tensile and shear stresses. The model results also indicate whether stresses within a zone currently reach the yield surface, or if the zone failed earlier in the model run but now the stresses drop below the yield surface. A failure mechanism is defined if there is a contiguous line of active plastic zones that join two surfaces. It is possible that initial plastic flow can occur at the beginning of the calculation, but subsequent stress redistribution unloads the yielding zones so that their stresses no longer satisfy the yield criterion [40]. Each type of yield is designated with its own mark and colour on the map. An example of determining the destressing zone is shown in Figure 3. The shear-related yield zone is marked with an “*” in red, and the tensile-related yield zone is marked with an “o” in purple. The zone where yield had occurred earlier over the course of the model but where the stresses now drop below the level of plasticity is marked with an “X” in green.

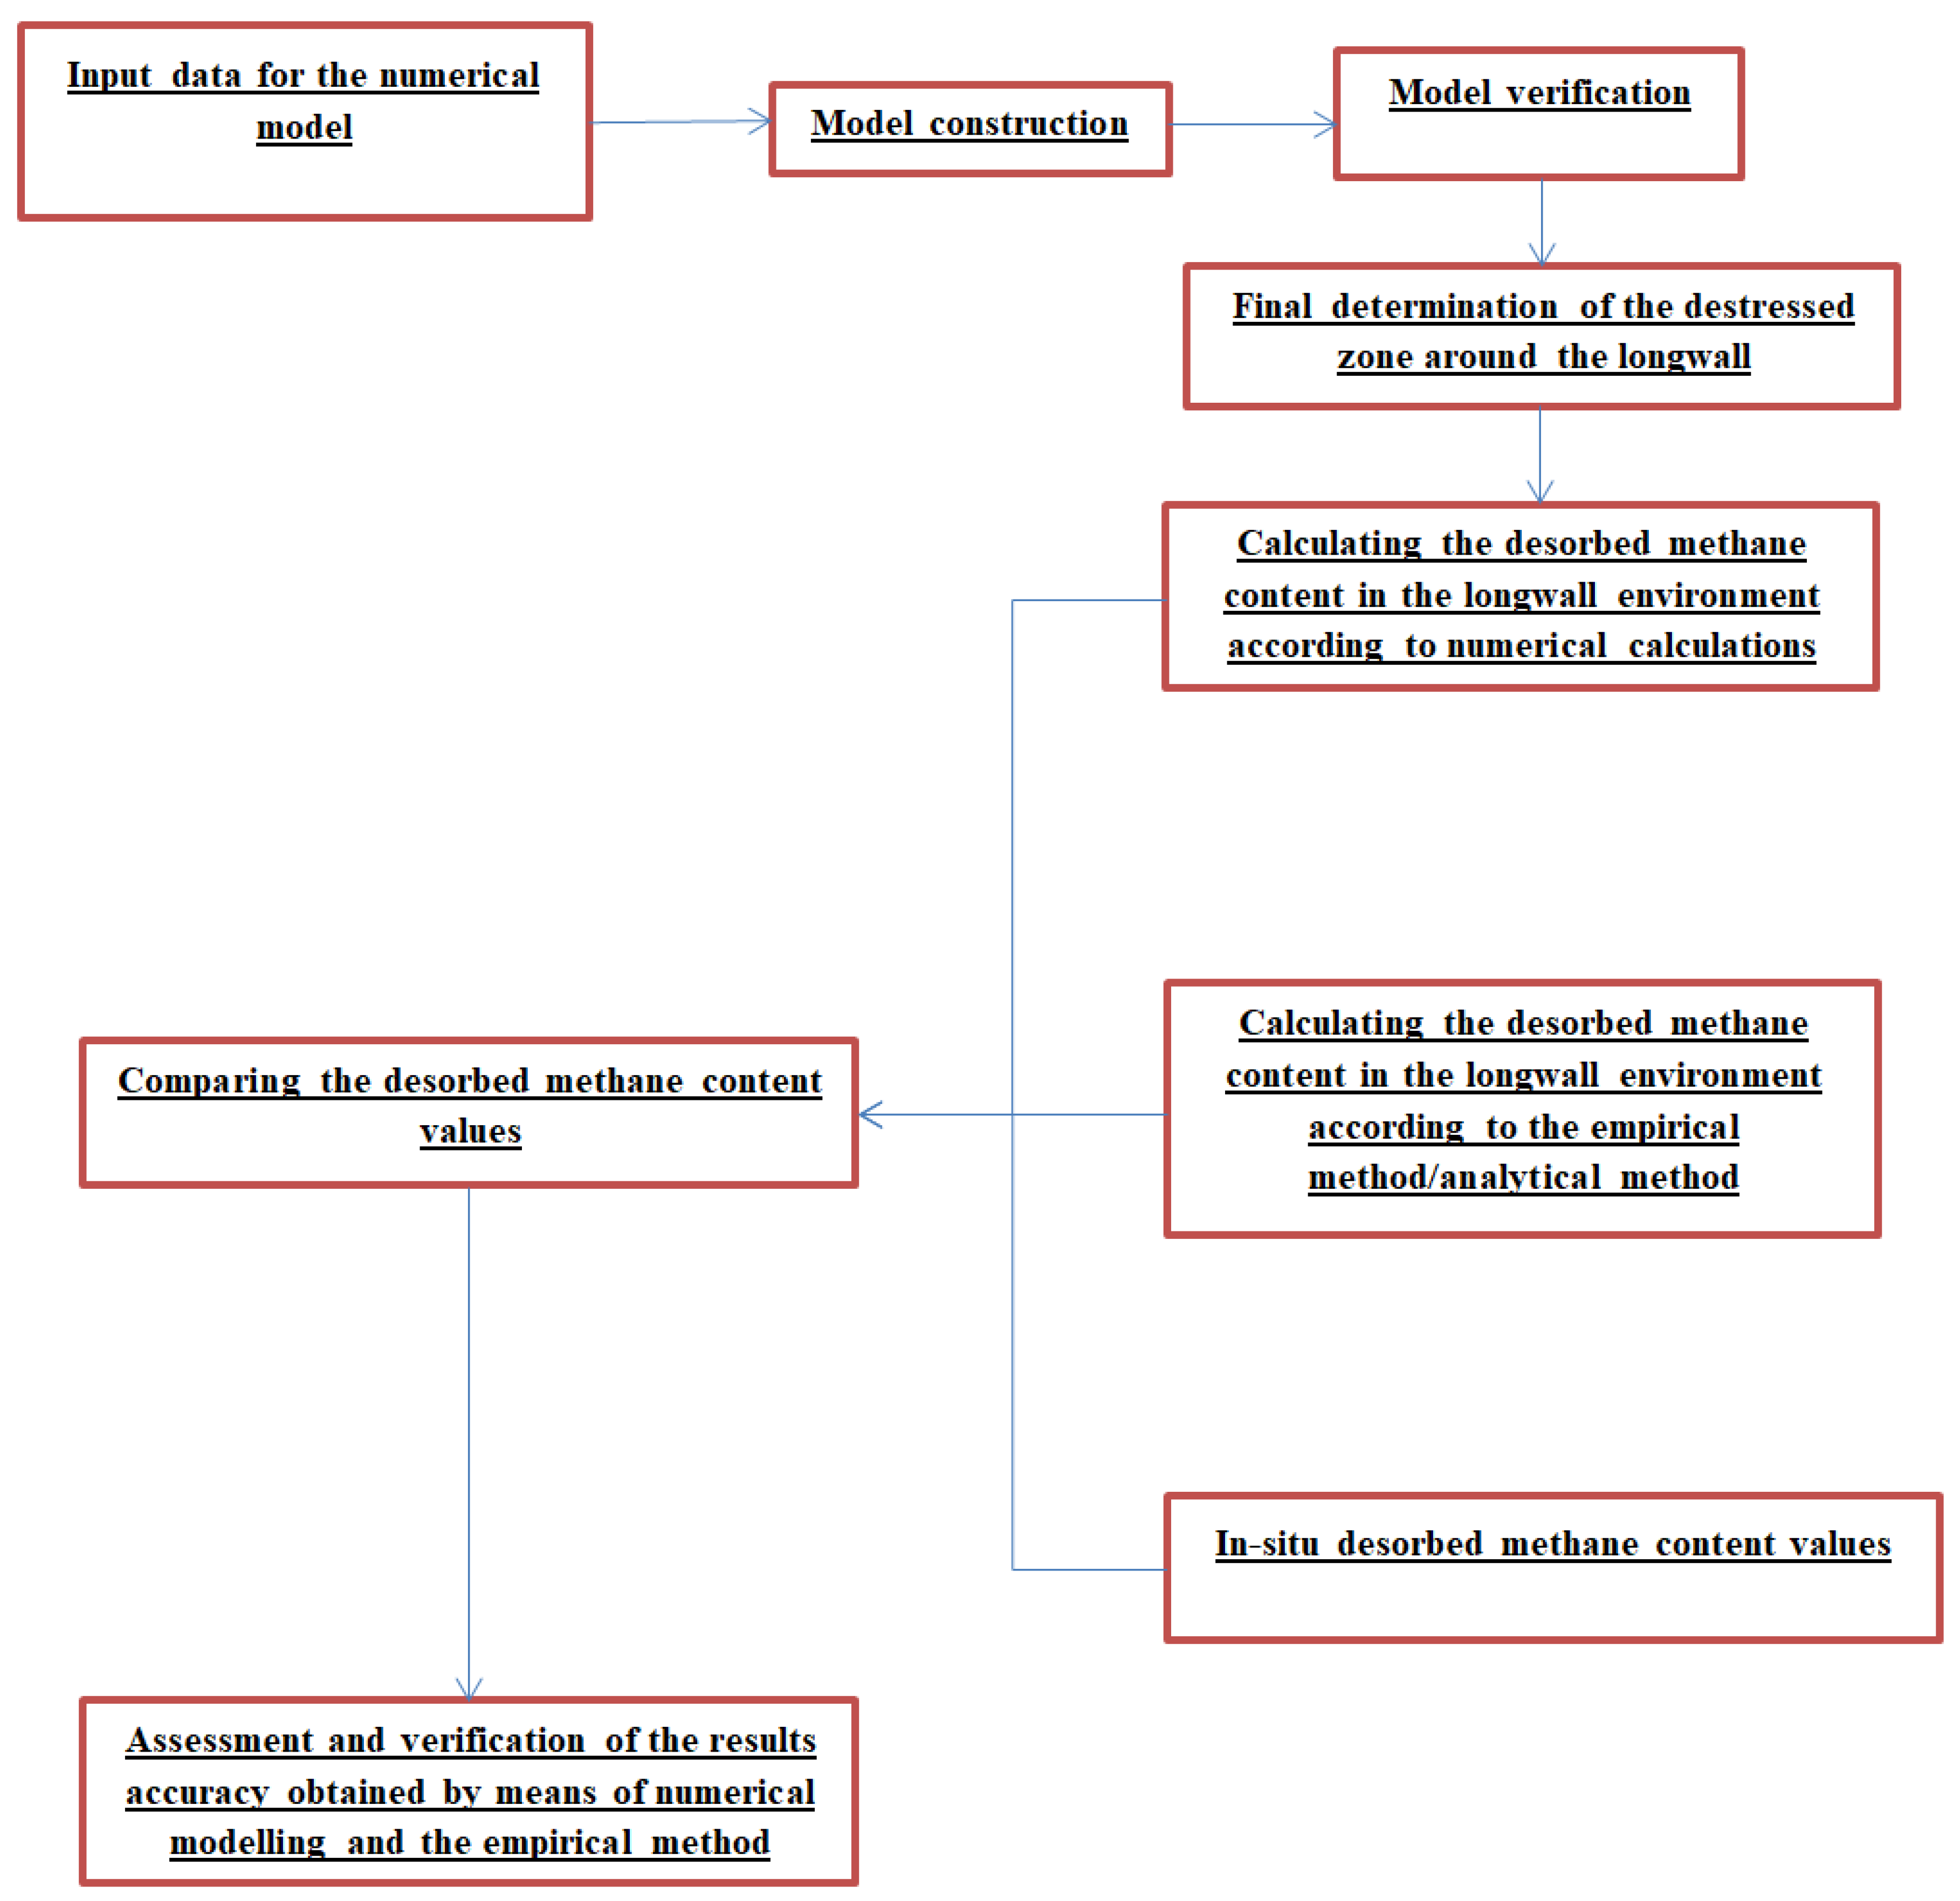
2.3. Research Methodology
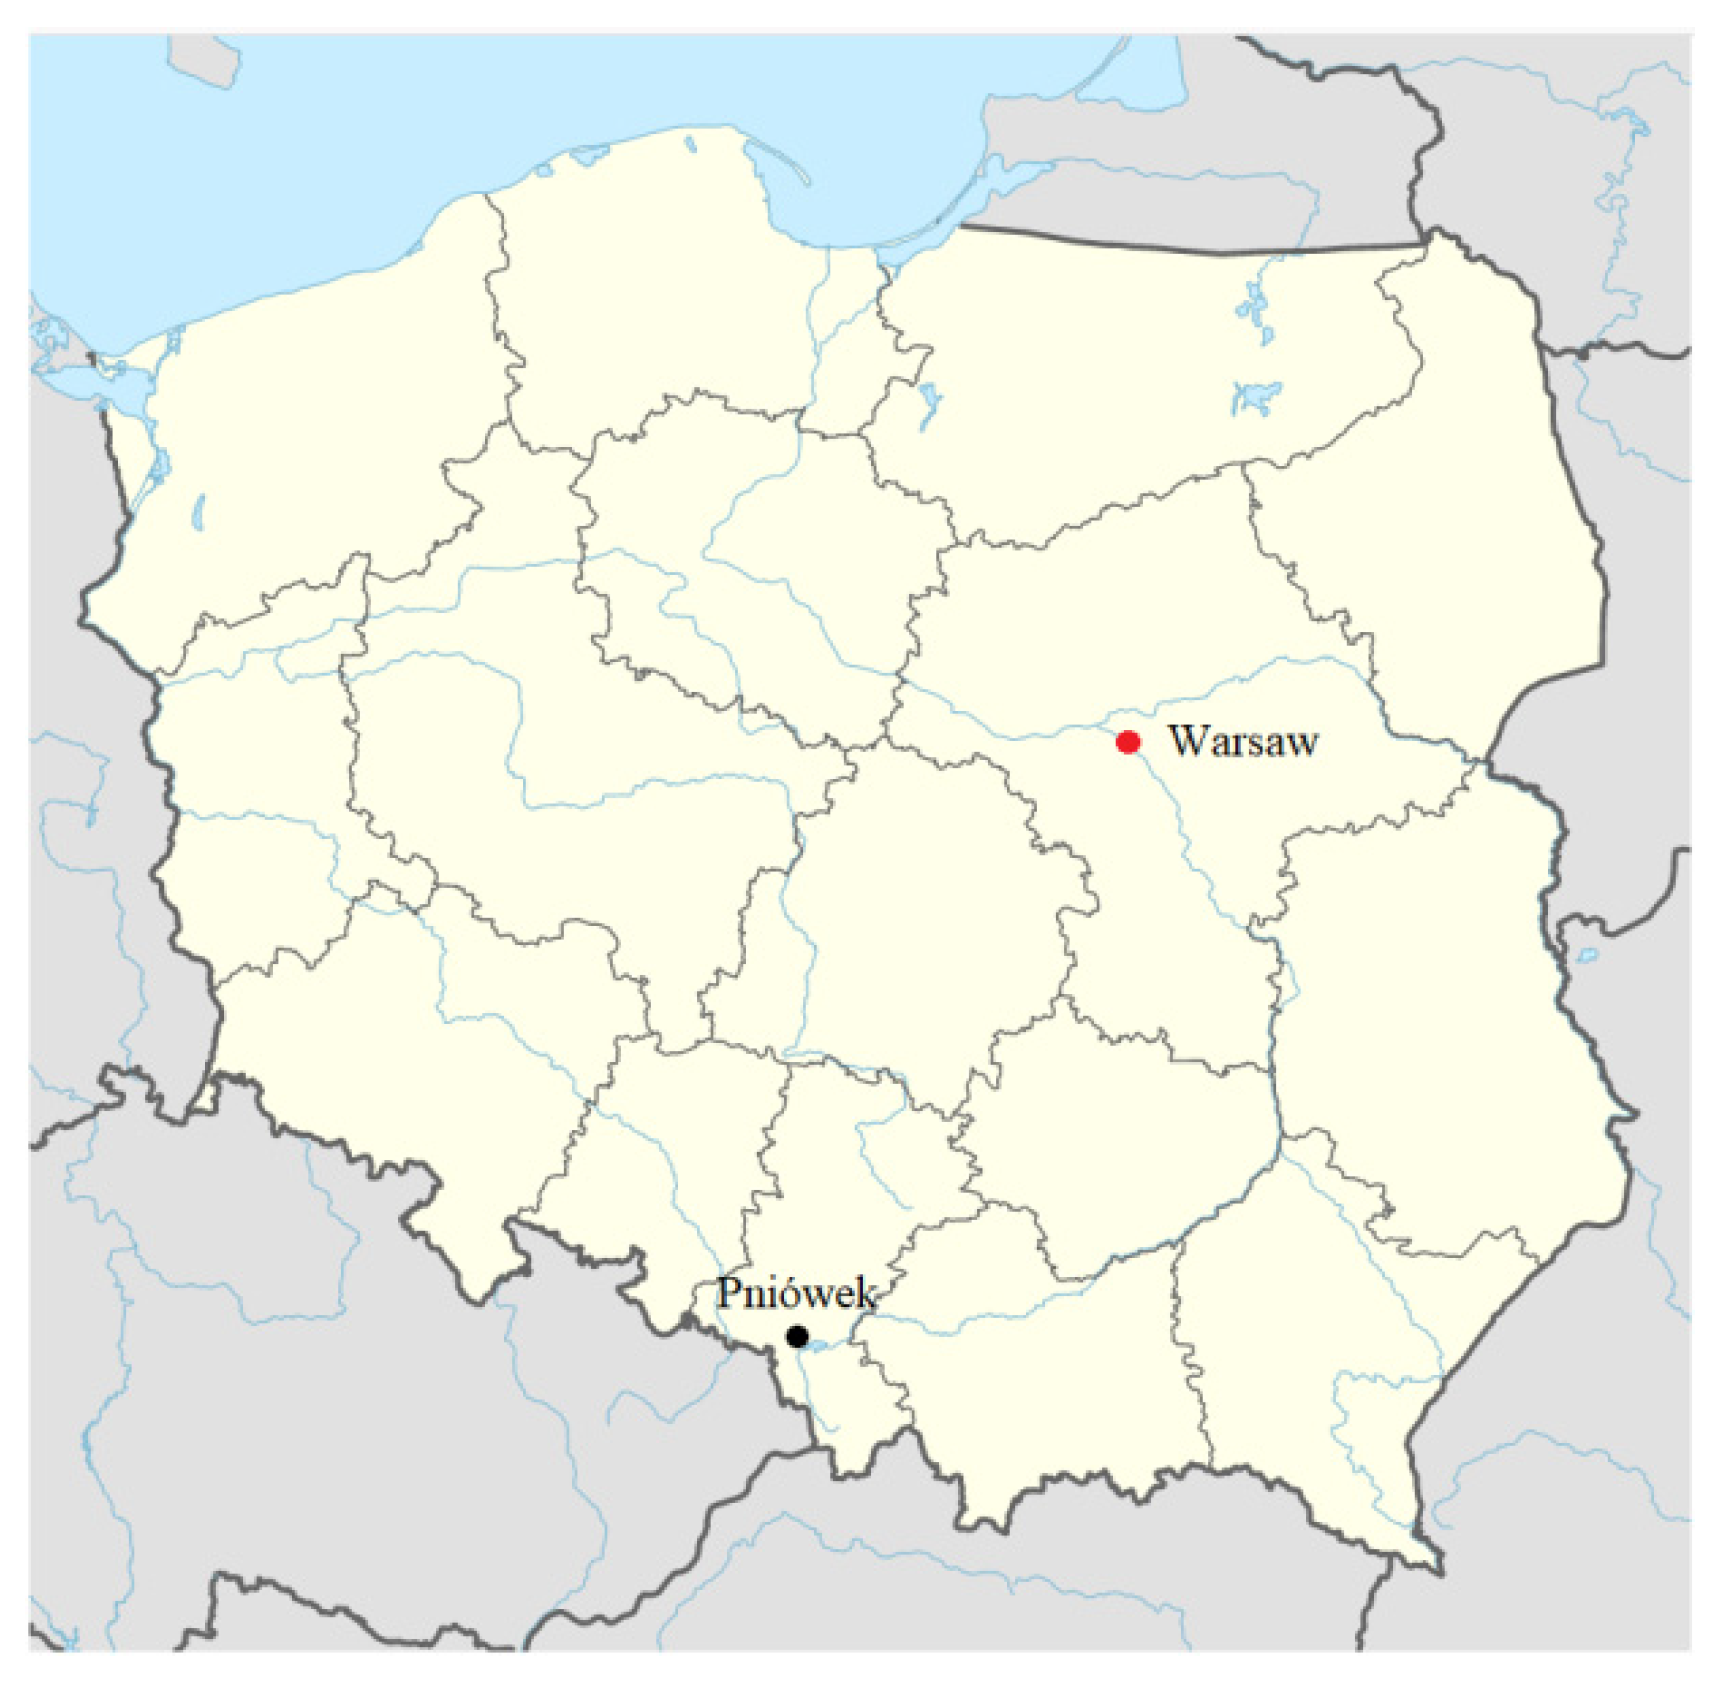
The calculation algorithm is presented in Figure 4. At first, the input data required for the numerical modelling were collected: longwall panel geometry, geological profile of the longwall region, mechanical parameters of each rock layer, etc. Then, the model was performed, representing the exact geological and mining conditions of the analysed longwall panel. The results obtained from the model were verified by in situ measurements. The desorbed methane content in the longwall environment was calculated after determining the size of the destressing zone generated by the longwall extraction. These results were compared to the results of the empirical/analytical method. Finally, the results of both methods were assessed and verified by comparing them with in situ methane measurements.

3. Case Study

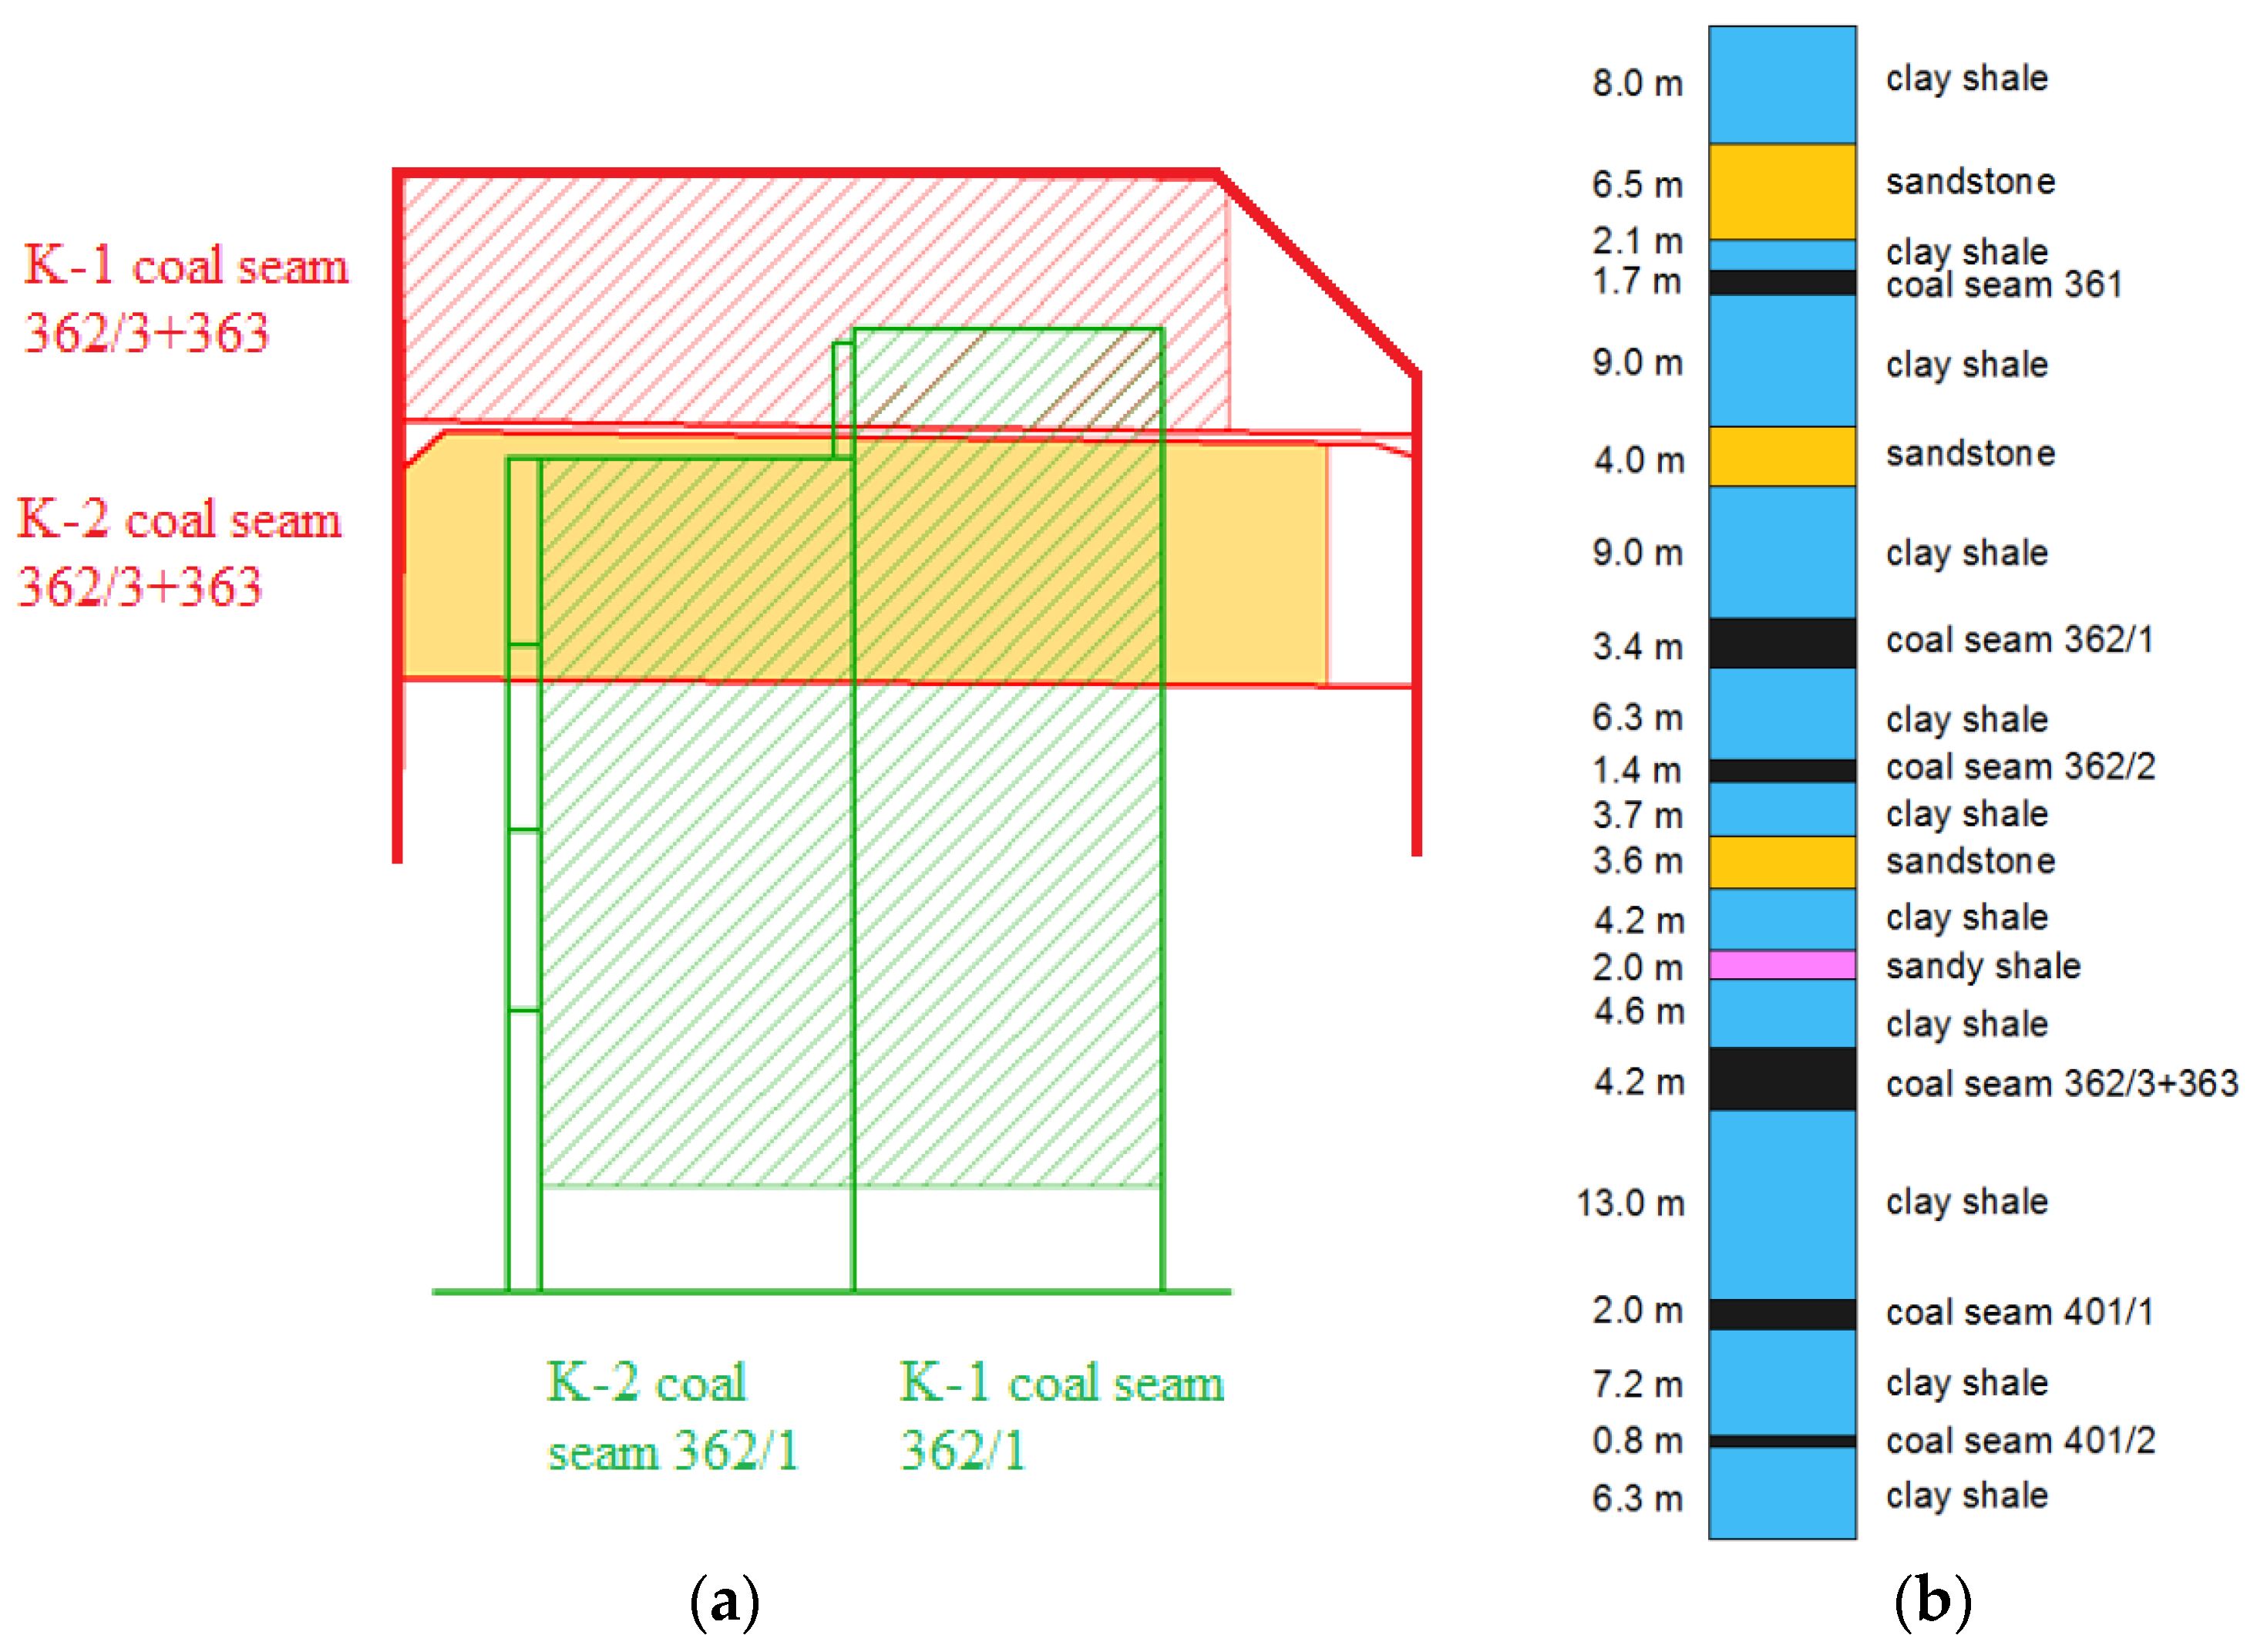
3.1. Description of the Geological and Mining Conditions of the Analysed Longwall

The KWK Pniówek hard coal mine is located in southern Poland, in the Silesian Voivodeship, about 300 km south-west of the capital city Warsaw (Figure 5). This coal mine contains one of the largest reserves of hard coal in Poland, estimated at a total of over 100 million tons of coal. The mine’s yearly output is about 5.16 million tons of coal. The longwall mining is currently conducted at a depth of 900–1000 m. The K-2 longwall is one of many active longwalls, located in the 362/3 + 363 coal seam.
Figure 6 presents the location and lithological fragment of rock mass around the analysed longwall. The lithological map shows that the analysed coal seam is surrounded by silty shale and partial sandstone.
According to the data provided by the Pniówek coal mine, the strength parameters Rc of the coal and surrounding rocks are as follows:
-
Roof rock:
Claystone—31.5–63.2 MPa;
Sandstone and mudstone—34.2–135.11 MPa;
-
Coal—3.03–11.9 MPa;
-
Floor—28.2–110.88 MPa.

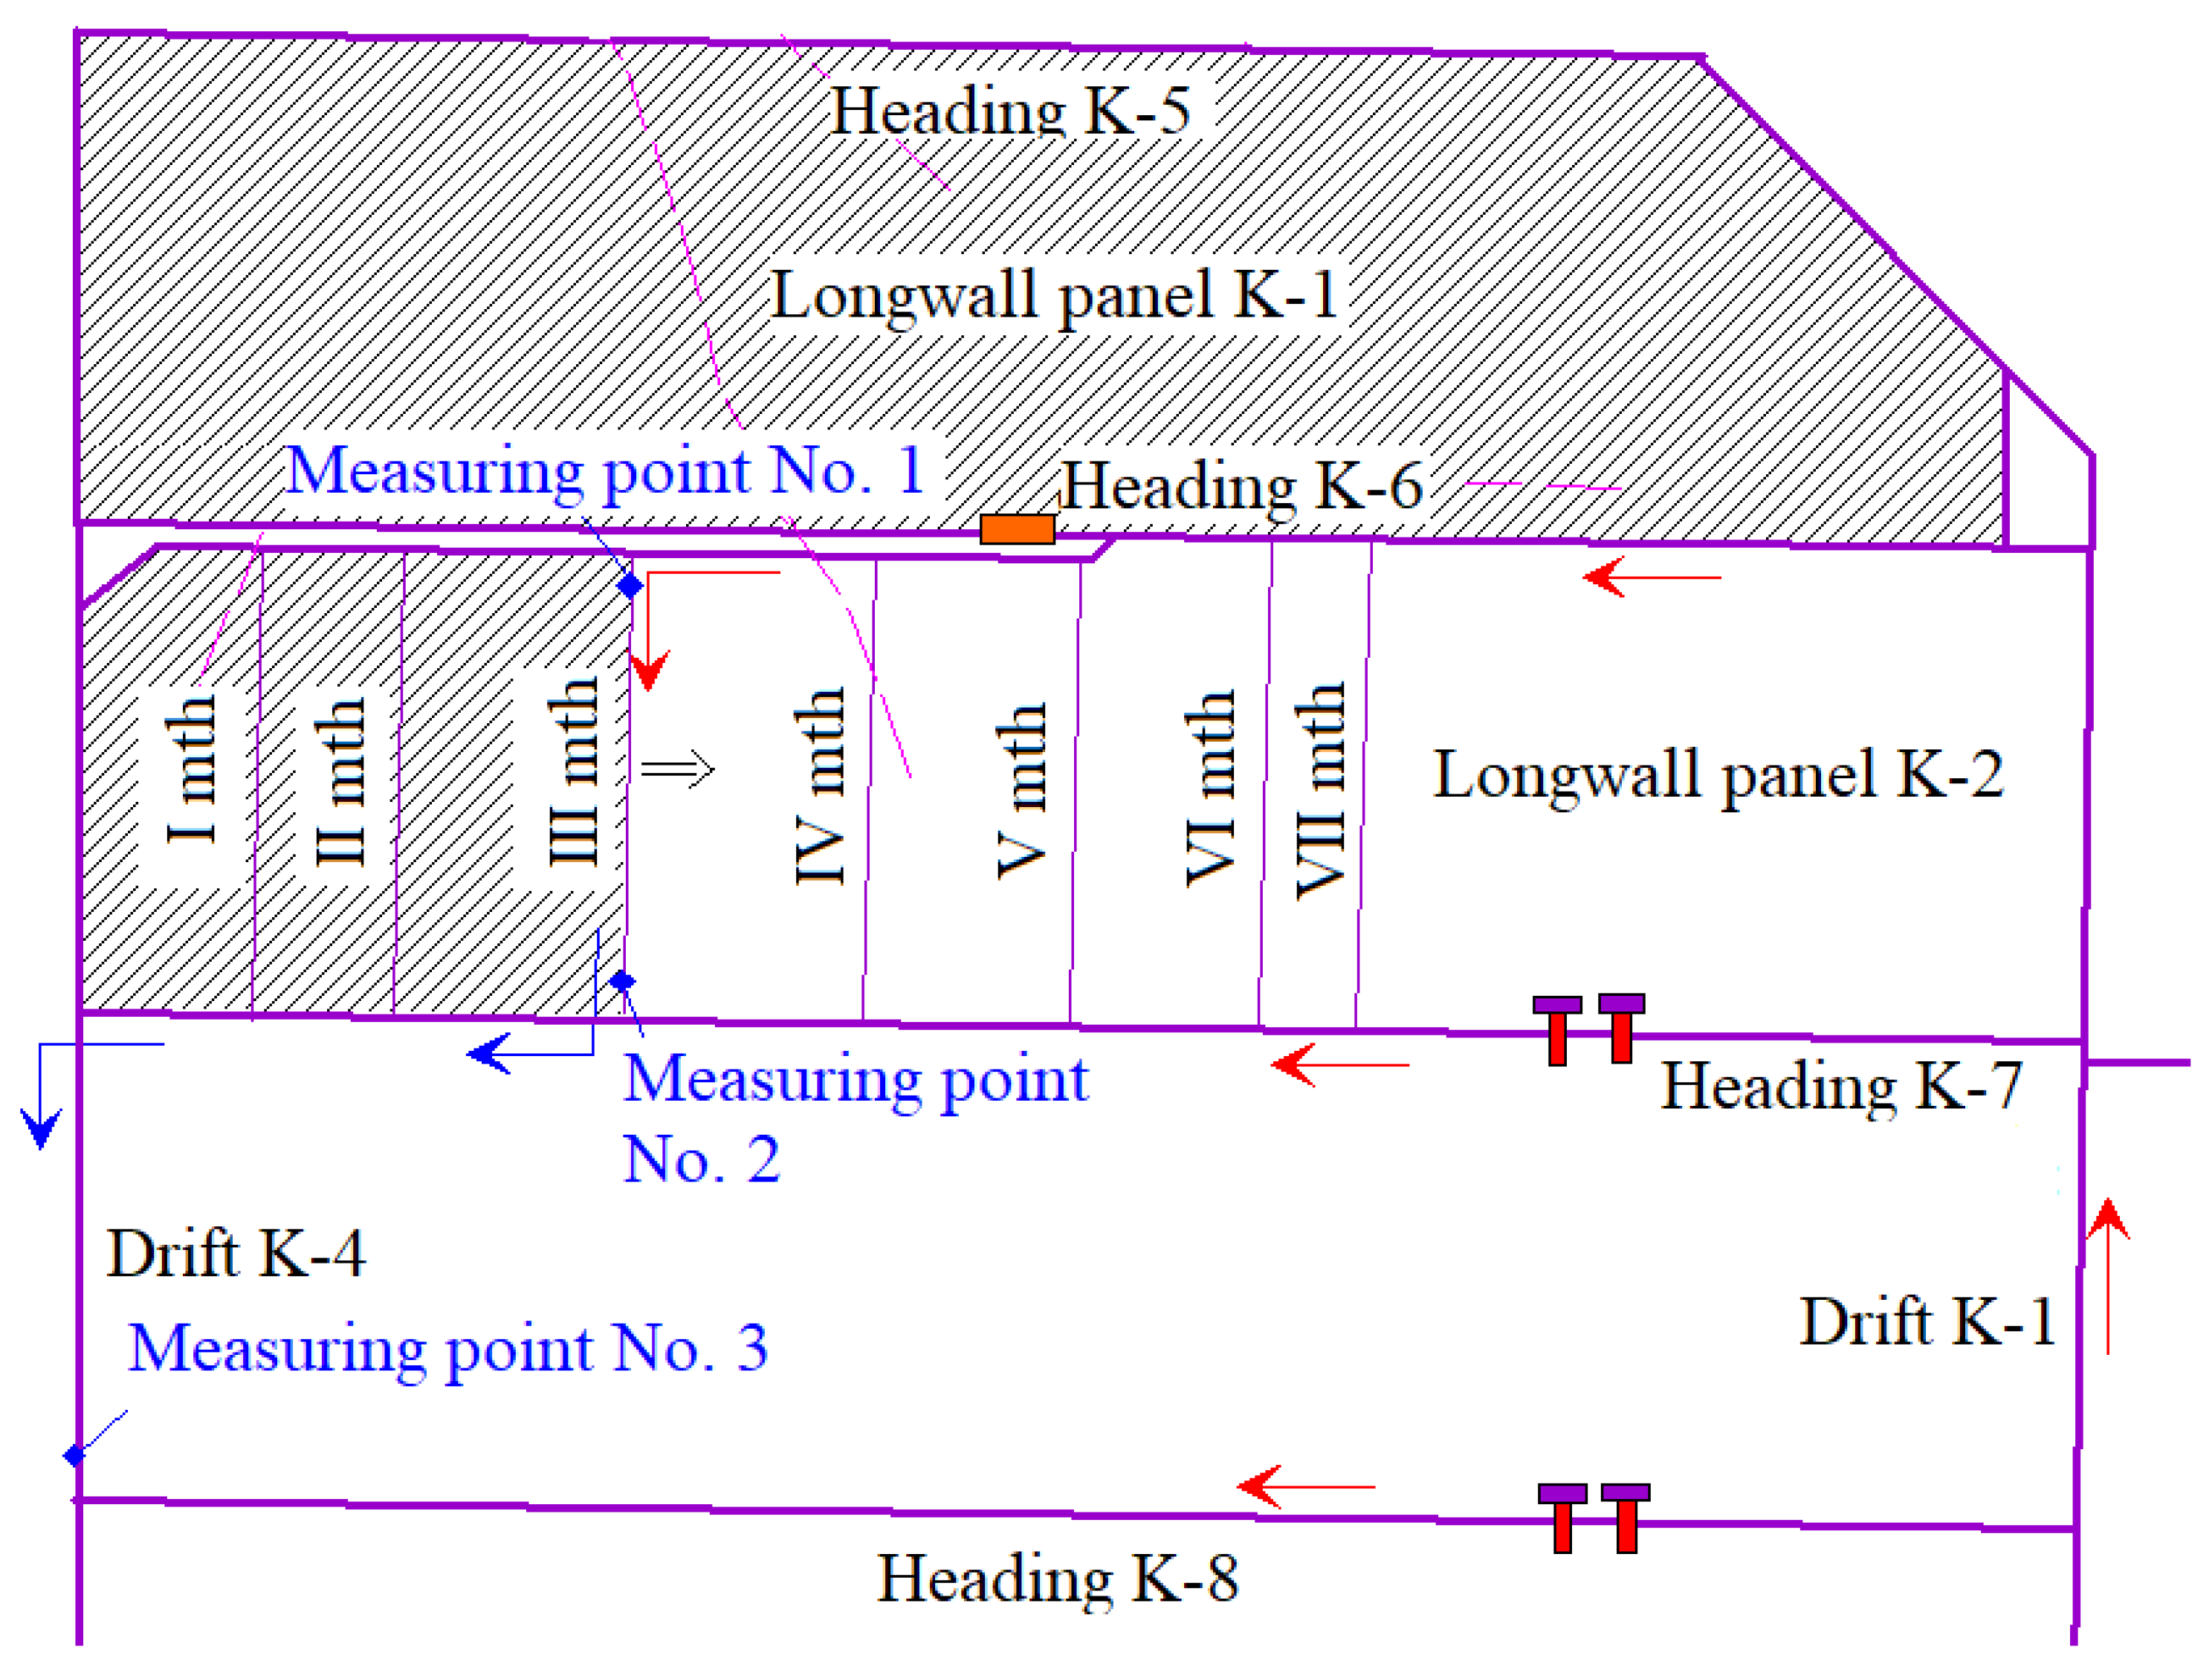
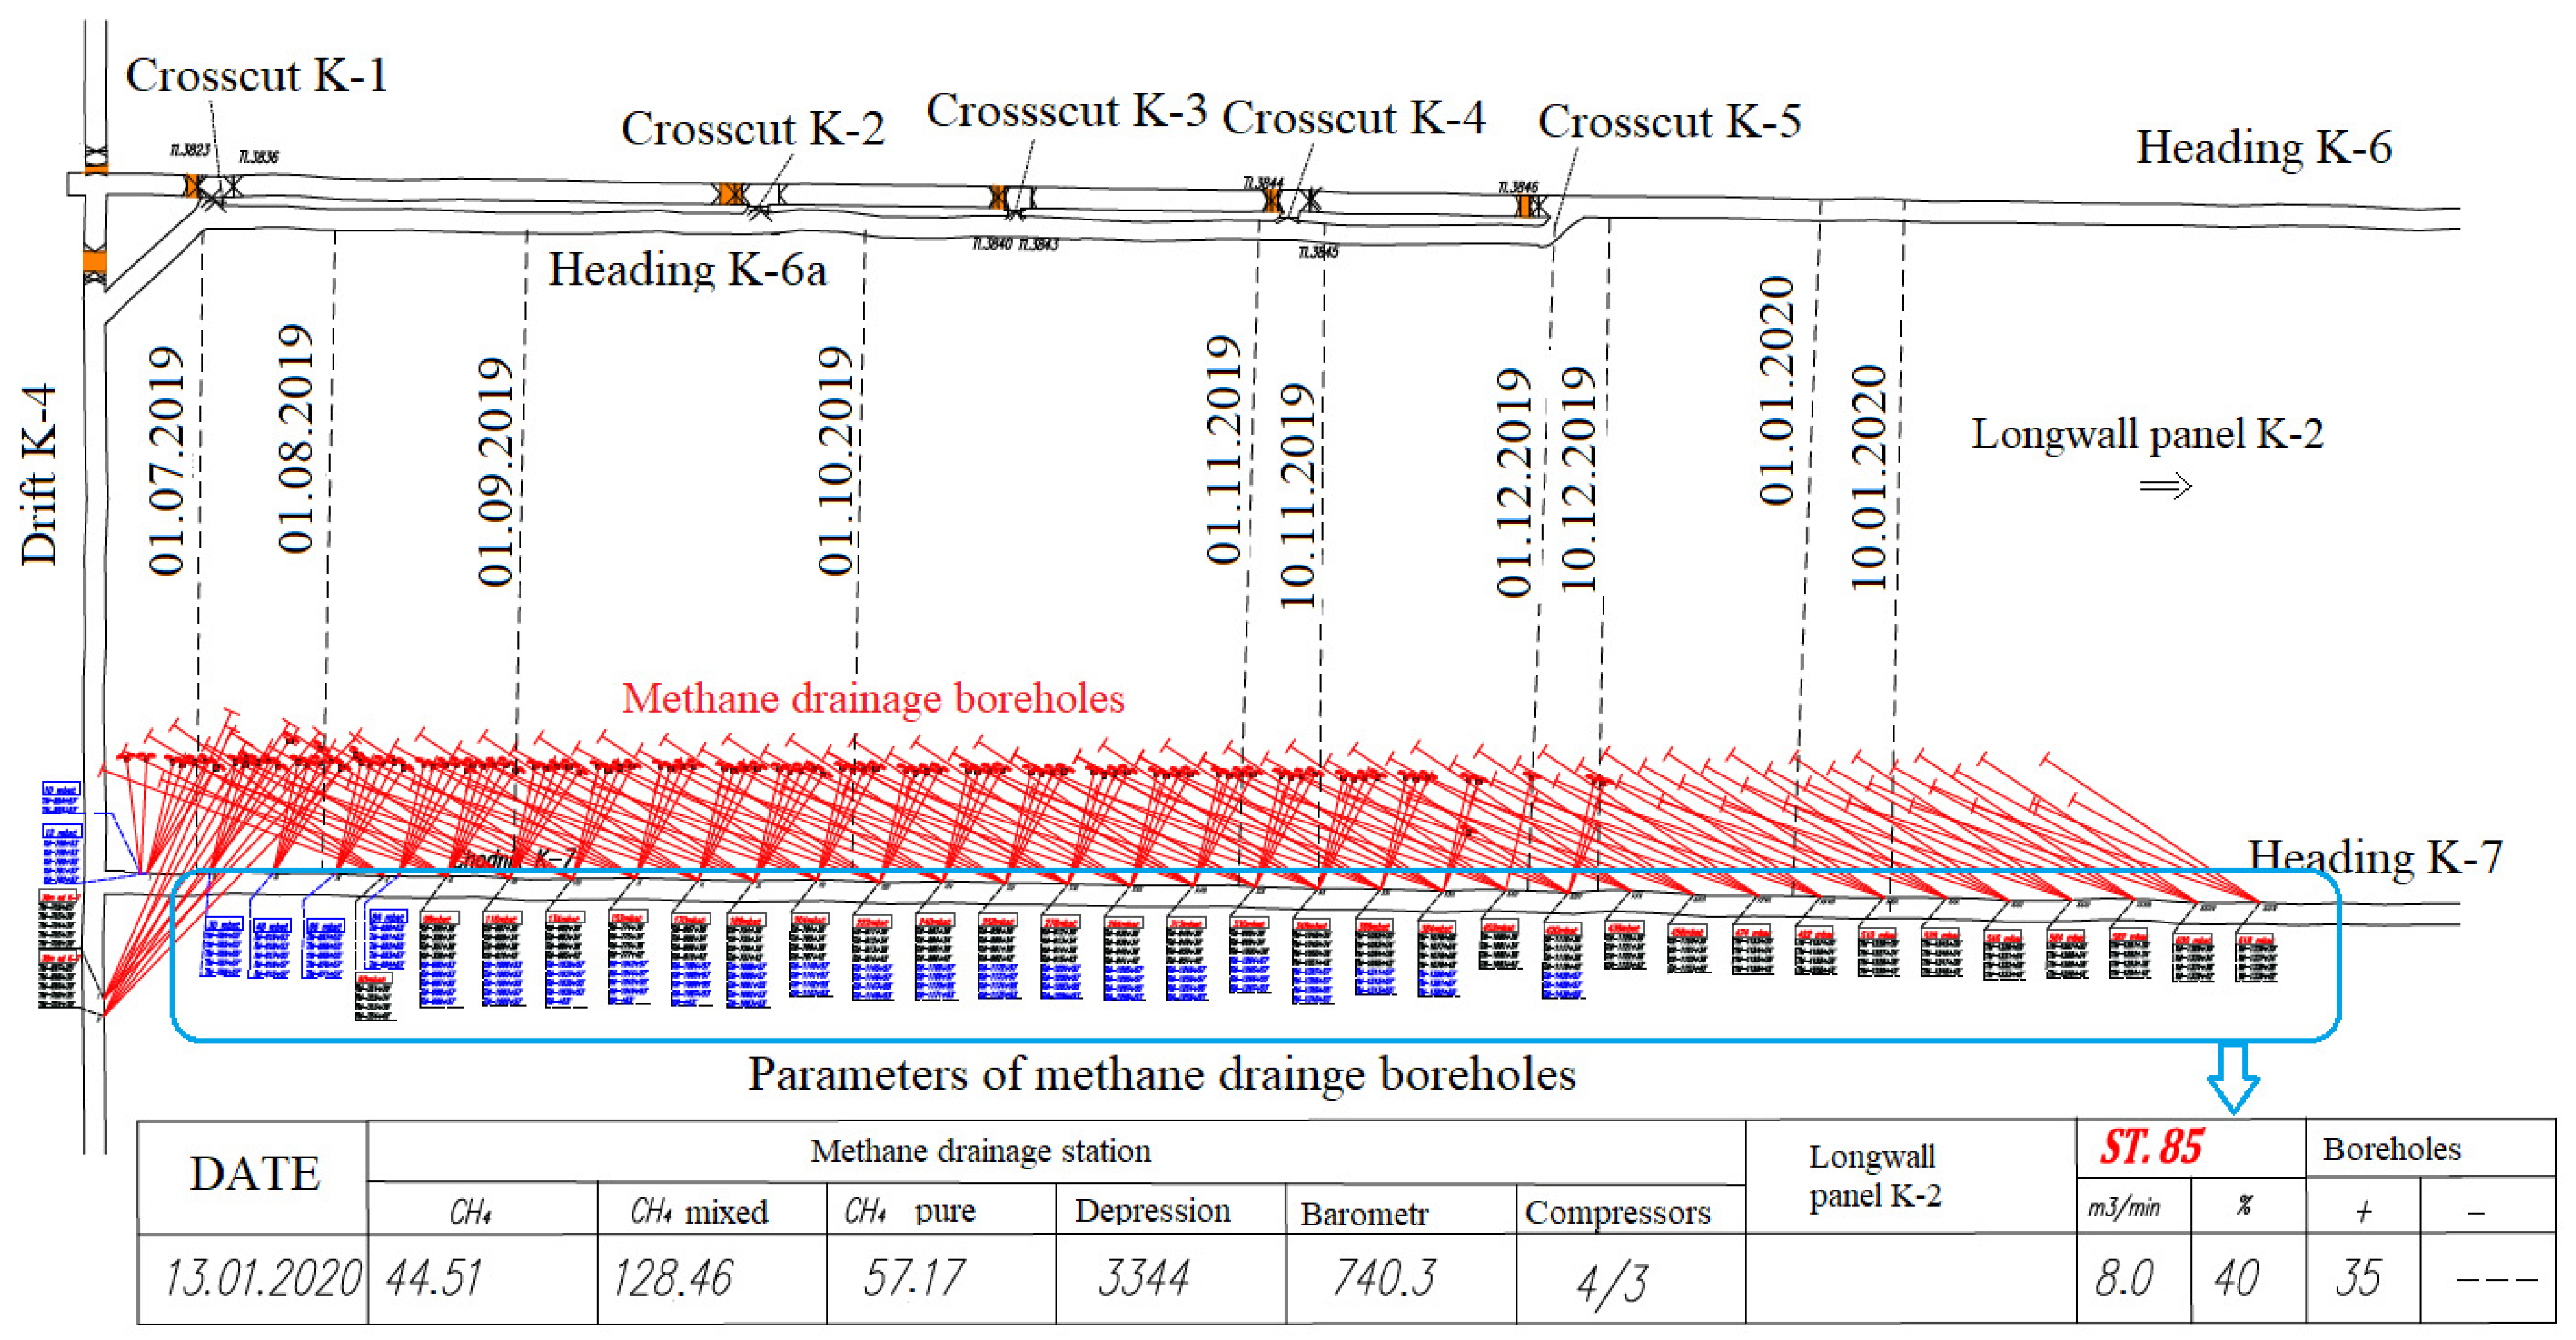
3.2. Description of the Ventilation and Methane Drainage Conditions in the K-2 Longwall, in the 362/3 + 363 Coal Seam

The K-2 longwall is ventilated using a Y-type system, with used air offtake along the gobs. This ventilation system was adopted because of the high methane hazard present in the Pniówek coal mine. The assumed volumetric air flow rates, i.e., 1350–1400 m3/min in the longwall and 1600–1650 m3/min as the reblow of the upcast air current from the longwall, enable relatively intense ventilation of the longwall environment. The K-2 longwall environment ventilation diagram together with the air flow directions is presented in Figure 7. The air velocity was measured using mAS-4 anemometers (IMG PAN) with a reduced measuring range (<0.2 m/s). The methane concentration was measured using X-am 5000 gas detectors and air testing by the pipette method for chromatographic laboratory analysis. A total of 14 measurement series were performed. The measuring point distribution was adopted in order to determine ventilation parameters such as:
-
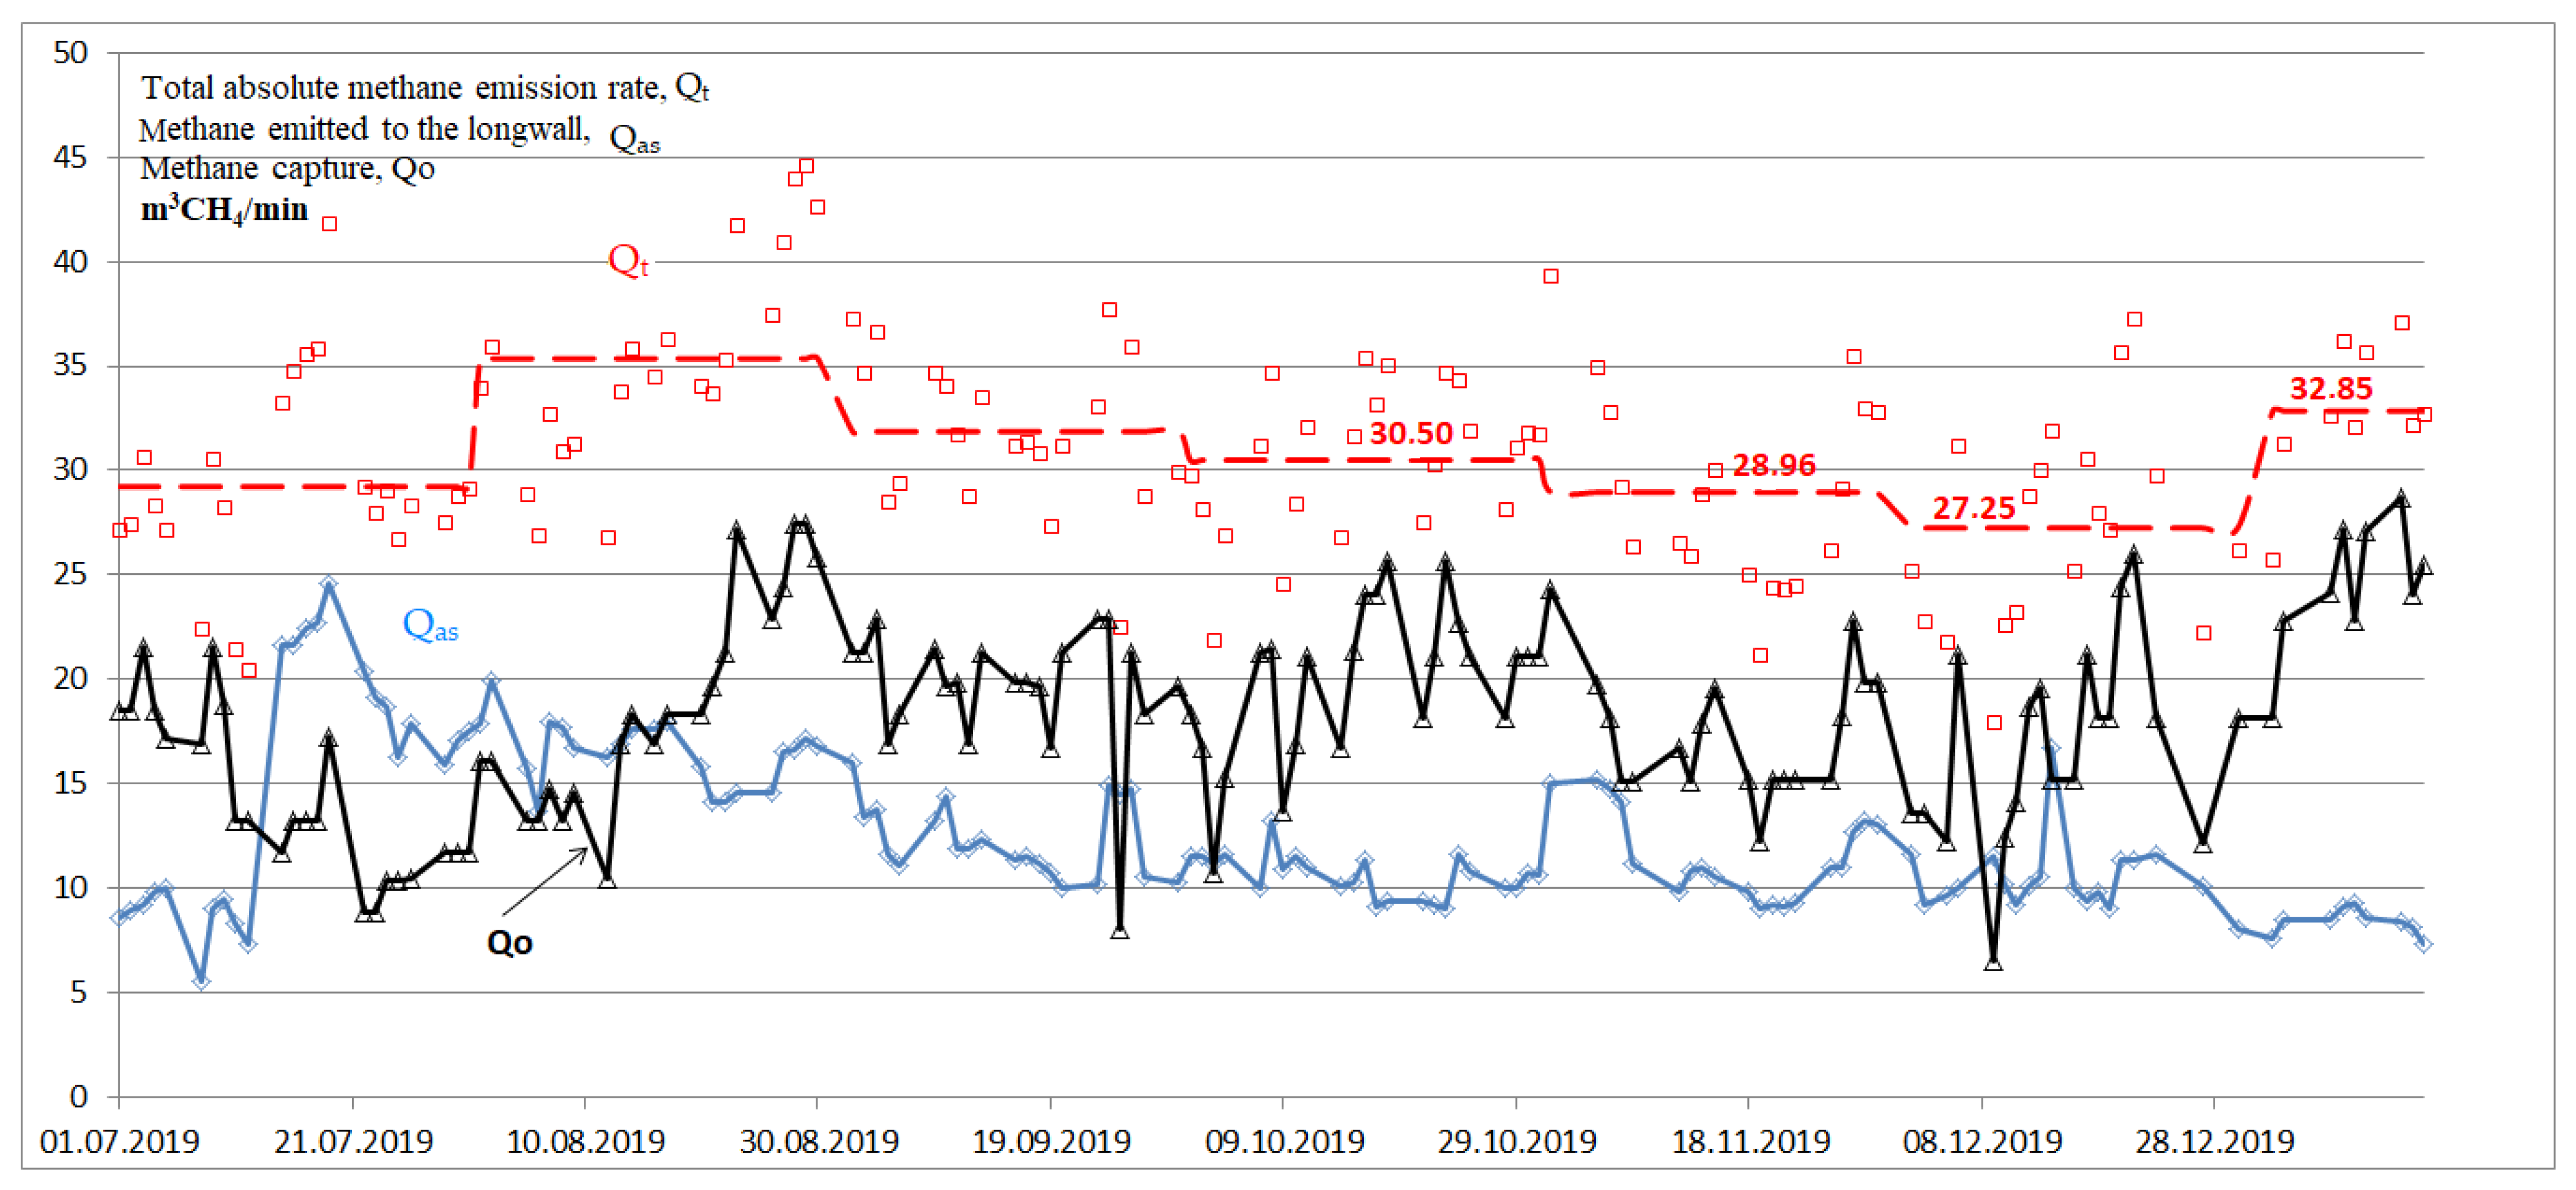
Methane emitted to the longwall environment;
-
Total absolute methane emission rate in the environment;
-
Methane flow to the longwall environment with the fresh air current;
-
Methane emissions to the longwall environment from the overlaying and underlaying deposits.
Due to the high methane hazard (total longwall methane emission rate typically above 30 m3 CH4/min), it was necessary to apply methane drainage in the longwall. The methane capture was accomplished by means of standard methane drainage boreholes, drilled in the K-7 heading. The boreholes were drilled at a distance of about 100 m in front of the longwall face, along the K-7 heading, which was maintained in the gobs. The scheme of the methane drainage boreholes along the K-7 heading in the K-2 longwall corresponds to the distribution presented in Figure 8.
The courses of the methane capture (Qo) from the K-2 longwall to the drainage network, the absolute methane emission rate (total, Qt) and the methane emitted to the longwall area (adjacent strata, Qas) are presented in Figure 9.
The data presented in the chart (Figure 9) demonstrate that:
-
The methane capture ranged from 10 m3 CH4/min to 28 m3 CH4/min;
-
The methane emitted to the longwall area ranged from 5 m3 CH4/min to 25 m3 CH4/min;
-
The total absolute methane emission rate ranged from 20 m3 CH4/min to 45 m3 CH4/min.
The analysis revealed that the applied distribution of drainage boreholes in the K-2 longwall environment provided a methane drainage efficiency ranging from 30% to 60%.

3.3. In Situ Measurements

In situ measurements were conducted in order to observe the destressing zone generated by the longwall mining [47,48,49]. The 4–7 m-long boreholes were drilled in a location about 66 m behind the longwall panel in the K-7 heading of the K-2 longwall. A diagram of these boreholes is presented in Figure 10. The boreholes were observed by means of an Introscope LM45 camera.
The results demonstrate that the rock mass was heavily fractured in all the boreholes (Figure 11, Figure 12 and Figure 13). The estimated average spacing between fractures in the diagonal boreholes was about 5–10 cm, and about 1–3 cm in the vertical hole.
Based on these results, it can be stated that the height of the caving zone above the K-7 heading was greater than 7 m.

4. Numerical Modelling

4.1. Model Description

Based on the geological profile of the K-2 longwall, numerical models of the rock mass were generated in FLAC2D. The models were built with the following dimensions: 420 × 330 m, with the 362/3 + 363 coal seam having a thickness of 4.2 m. The numerical model was divided into approximately 87,600 quadrilateral elements with a side length of less than 1.4 m. Boundary conditions for all rollers were adopted for the upper and lower edges, as well as both side edges, of the model. The model was loaded with its own weight, resulting from the Earth’s gravity (Figure 14).
The basic rock mass mechanical parameter values adopted for numerical modelling are shown in Table 1. The parameters were defined based on the laboratory tests of rocks collected in the area of the analysed longwall.
Hypothetically, the horizontal geostatic stress is equal to the vertical stress. The initial stress value was calculated according to the formula provided by Biliński [50], which describes the Polish geological and mining conditions:
q = 0.02 · H · m c · c o s α
where: q—geostatic stress, MPa; H—average panel depth, m; mc—partial rock mass stress reduction coefficient, with an adopted value of 1.0 for the area of KWK Pniówek; α—coal seam angle of dip, °.
Once the initial state of stress was obtained, the displacement and velocity vectors were reset; after that, a null model was assigned to the zones corresponding to the longwall panel, and the model was recalculated. The range of the destressing zone (rock mass fracturing and caving zone) surrounding the mined longwall panel with caving was calculated and adopted for determining the rock mass degasification range.

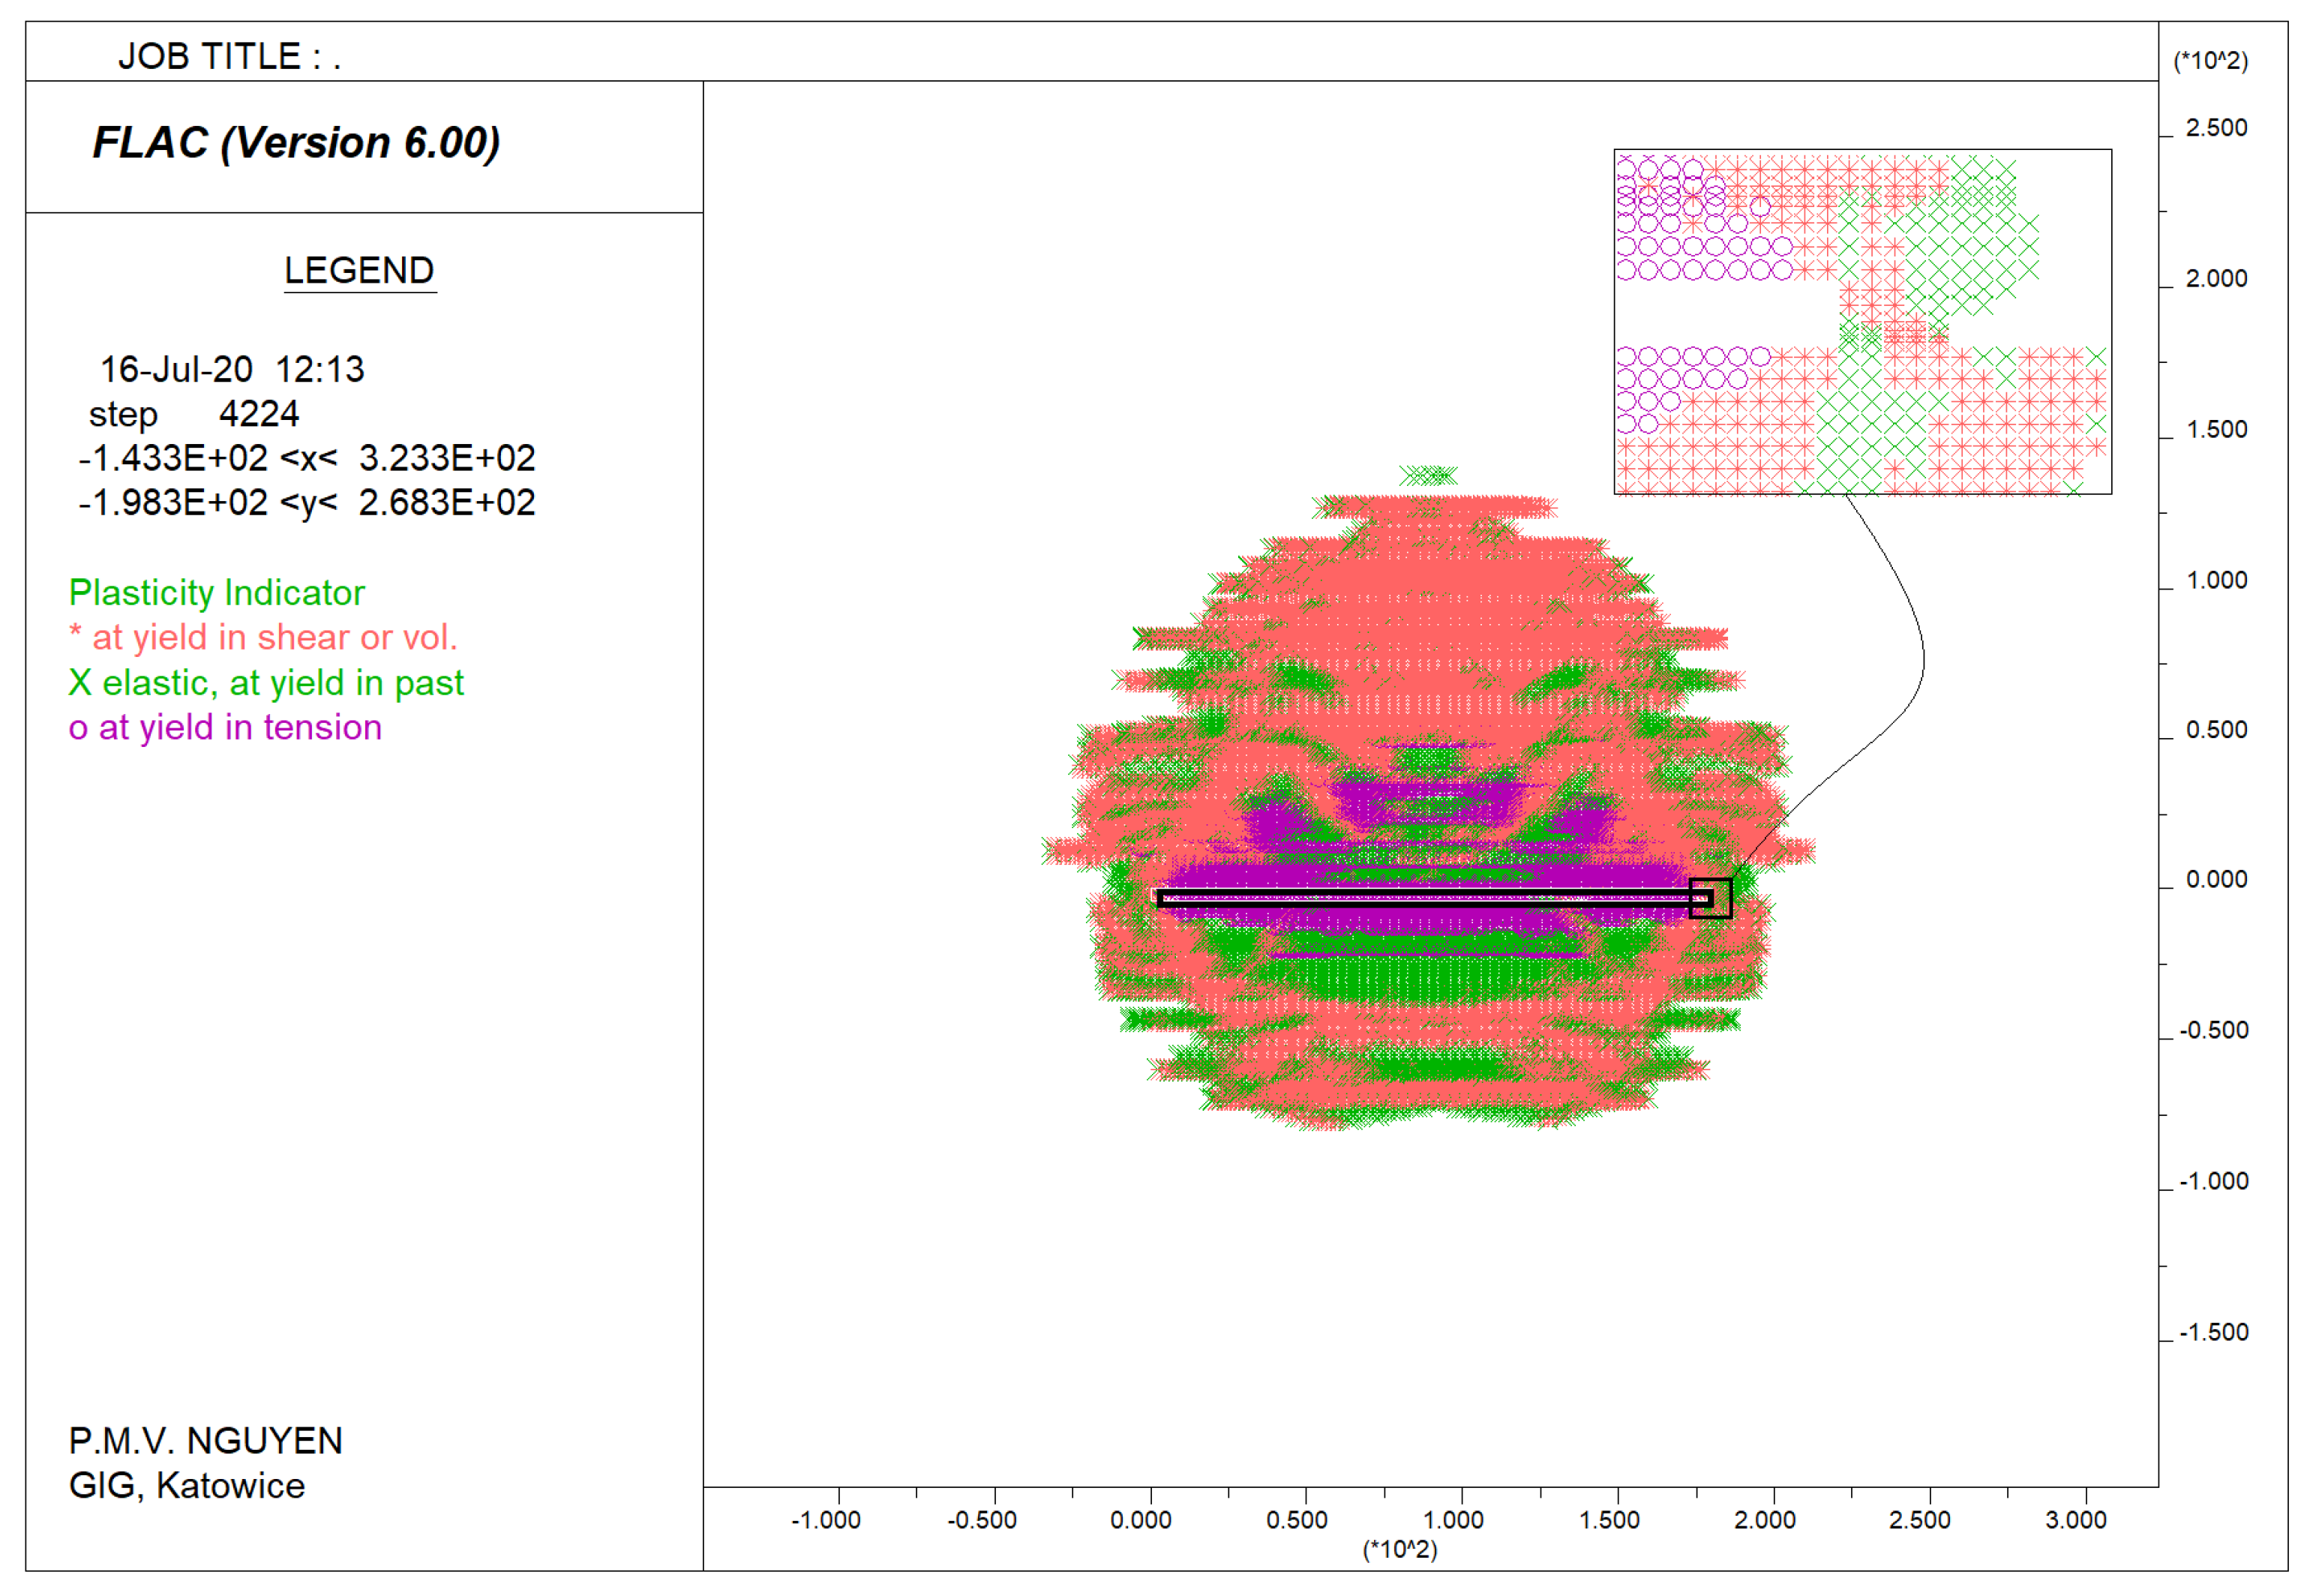
4.2. Numerical Model Verification

After a longwall panel is mined out, the rock mass surrounding the longwall tends to displace towards the cavern. The total value of the vertical roof and floor displacements cannot exceed the thickness of the extracted panel. An appropriate number of calculation steps were adopted in FLAC2D in order to ensure that the maximum values of the vertical longwall panel roof and floor displacements were not greater than the thickness of the extracted panel. Figure 15 presents an example selection of the number of calculation steps.
After 1000 calculation steps, the maximum sum of the vertical displacements was about 3.15 m, which was lower than the thickness of the extracted panel (4.2 m). However, after 1500 calculation steps, the value was about 4.5 m, which was greater than the thickness of the extracted panel (4.2 m). A total of 1000 calculation steps were thus adopted for the determination of the destressing zone range.
Furthermore, the numerical modelling results were verified on the basis of the underground measurements presented in Section 4.2, according to which the value of the caving zone was greater than 7 m. Figure 16 presents the caved zone (failure as a result of tensile stress) above the longwall working, marked in purple. The caved zone height obtained from the modelling was in good agreement with the values obtained from the underground measurements.

5. Result Analysis and Discussions

5.1. Comparison of the Destressing Zone Obtained from Numerical Calculations and the Empirical Method

The results of the numerical calculations obtained for the analysed longwall are presented in the form of rock mass plasticity indicator maps, which demonstrate the range of the failure zone surrounding the longwall (Figure 17). Boundary lines that separate the destressing zones (trapezoid shape) from the remaining part of the undisturbed rock mass are also marked. The vertical distribution of the rock mass degasification level was fitted to the obtained zones, depending on the distance relative to the mined coal seam. Equations (1) and (2) were used for this purpose.
The FDM numerical calculation results for the rock mass fracturing zone around the longwall working demonstrate that the ranges in the K-2 longwall, in the 362/3 + 363 coal seam, were hg = 133 m and hd = 72 m. Table 2 presents a comparison of the destressing zone range calculation results for the FDM calculations and the empirical method [10].
The comparative analysis demonstrates a similar value of the upper destressing zone range. However, there is a significant difference between the lower destressing zone ranges and the shape of the destressing zone obtained using FDM calculations, which consequently has an influence on the coal seam degasification zone width (Equations (3) and (4)) and ultimately on the volume of the emitted methane.

5.2. Field Measurements of Methane Emission and Comparative Analysis of Total Absolute Methane Emission Rate Forcasted by Numerical Modelling and Empirical Method

The results of the conducted measurements of methane concentrations n1, n2, n3, air flow rates Q1, Q2, Q3 and methane emission to the drainage network Qo, as well as the total absolute longwall environment methane emission rate Qt calculations obtained from the measurements, and the methane emission rates from the overlaying and underlaying strata (adjacent strata) Qas, are shown in Table 3.
Comparative result analysis of total absolute methane emission rate forecasting in the F-3 longwall and desorbed methane emission rate forecasting from adjacent strata within the destressing zones with measurement results was conducted. Based on these analysis results, the possibility of applying numerical methods in the determination of the rock mass degasification zone range for methane emission rate forecasting in longwall environments was evaluated. The analysis encompassed longwall extraction cycles where the panel length was approx. 200 m, ensuring the achievement of the full scope of the destressing zone. The sixth month was disregarded for this longwall, as it involved driving the longwall face through a zone of geological disturbances (faults), which resulted in a low daily advance, as well as the occurrence of a local source of additional methane emissions to the longwall, which should not be included in forecasting. The comparative forecasting results according to the empirical method [10] and FDM calculations, including the absolute and relative forecasting errors, are shown in Table 4 and Table 5.
The relative error of the total absolute methane emission rate predicted by both methods in comparison to the measured values is similar (25% for the empirical method, and 22% for FDM). However, the total absolute methane emission rate predicted by FDM was higher than the measured values (average 4.8 m3), while the total absolute methane emission rate predicted by the empirical method was lower than the measured values (average −7.8 m3). This means the value predicted by FDM is more advantageous than the value predicted by the empirical method in terms of methane hazard prevention. Based on the FDM results, a greater range of safety (ventilation equipment, methane hazard prevention measures) would be provided.
In the case of the methane emission rates forecasted from adjacent strata, it should be noted that the FDM forecasting results provided a low difference from the measured values (the first four results did not exceed 3.0 m3 CH4/min, and the last result did not exceed 9 m3 CH4/min), whereas such a high difference occurred in all the empirical forecasting results (11.83 in third month, 11.74 in fourth month, 11.25 in fifth month, 12.58 in sixth month and 17.68 in seventh month) (Table 5). Although the absolute methane emission rate predicted by both methods is less than the measured values, the average empirical value (13.43) is over 4 times higher than the FDM value (2.96). This means the FDM results are closer to the measured results in comparison with the empirical forecasting results. The average relative error of the empirical and FDM results was 55% and 12%, respectively. The empirical value is much higher than the permissible relative error value (25%), while the FDM value is acceptable. This means the FDM forecasting provided a higher accuracy than the empirical method.
The same tendency in the case of comparing the total captured methane emission can also be noted (from the longwall and adjacent strata combined), as shown in Table 6. The average empirical result is almost 3 times higher than the FDM result. No relative error of the FDM result exceeded the permissible relative error value (25%), while all relative errors of the empirical results were higher than the permissible value (Table 6, relative error). The average relative error of the empirical and FDM results was 39% and 13%, respectively. The empirical value is much higher than the permissible relative error value (25%), while the FDM value is acceptable. This, once again, confirms that the FDM forecasting provided a higher accuracy than the empirical method.

5.3. Discussions

The results indicate that the total absolute methane emission rate predicted by FDM was higher than the total absolute methane emission rate predicted by the empirical method and close to measured values in the case of forecasting the methane emission rates from adjacent strata. This is due to the larger range and shape of the destressing zone calculated by FDM, especially the lower destressing zone (floor), where methane emission seems to be unexpected in coal mining practice. The FDM results demonstrate an additional source of methane emission. Consequently, based on the FDM prediction, additional methane hazard prevention measures and ventilation system efficiency are required for particular longwall panels or particular regions, or even the entire mine.
The relative error of the empirical results (25%) was slightly higher than the relative error of the FDM results (22%) in the case of forecasting the methane emission rates from the longwall (Table 4), almost 5 times higher (55% to 12%) in the case of forecasting the methane emission rates from adjacent strata (Table 5) and 3 times higher (39% to 13%) in the case of forecasting the total captured methane emission (Table 6). The lower average relative error in forecasting based on FDM numerical modelling confirms that the results obtained from FDM forecasting are in better agreement with the measured results. This means the FDM forecasting provided a greater accuracy than the empirical method. It can thus be stated that the FDM-determined destressing zones increase the reliability of predicting the total absolute methane emission rates from the longwall and from the surrounding rock mass.
The destressing zone range in modelling results from geo-mining conditions that were considered in the numerical calculations, such as: geomechanical parameters of the rock mass, longwall panel geometry, coal seam inclination, mining depth, presence of water or faults. Therefore, it is necessary to conduct research in order to find new relationships that describe the impact of these factors (individual or combined) on the degasification zone ranges by means of numerical modelling.
The proposed methodology as a combined approach using numerical modelling and in situ measurements proved to be able to predict the absolute methane emission rate with high accuracy in the Pniówek coal mine. The key element of this methodology is the in situ measurements which were used to verify the rock mass model firstly and then assess the accuracy of methane emission predicted by numerical modelling. This process provides reliable results, assisting the mine to make a final decision. There is no doubt that this methodology with the following steps can be applied easily in other coal mine regions. As a result, the effectiveness of the proposed methodology can be evaluated.

6. Conclusions

An attempt was proposed to determine the absolute methane emission rate for longwall K-2 in the KWK Pniówek mine by means of numerical modelling. The finite difference method FLAC2D was employed to define the destressing zone, which relates to the absolute methane emission rate from the longwall and the surrounding rock mass. The empirical method and field measurements were also applied as auxiliary elements to verify the numerical modelling outcomes. The following conclusions can be drawn:
-
Numerical calculations based on the finite difference method (FLAC2D) can be a useful tool to determine the destressing zone, with the possibility of taking the number of geomechanical parameters into account. This method improved the accuracy of the absolute methane emission rate prediction by reducing the relative error from 55% to 12% in the case of forecasting the methane emission rates from adjacent strata, and from 39% to 13% in the case of forecasting the total captured methane emission.
-
The results confirm the key role of in situ measurements in the verification of rock mass models and assessments of the numerical modelling results.
-
The results indicate the influence of the geomechanical parameters of the rock mass on predicting the results of the total absolute methane emission rates.
-
The proposed methodology using numerical modelling and in situ measurements managed to predict the absolute methane emission rate with high accuracy for a case study in the Pniówek coal mine. It is suggested to apply the proposed calculation algorithm to various cases with various geo-mining conditions in order to confirm its efficiency.
-
Due to the influence of the longwall length and the ventilation method (arrangement of workings) on the methane emission, three-dimensional numerical modelling would achieve a higher accuracy of the results.
-
It is recommended to calibrate a general geomechanical model for a specific location (longwall panel or mined coal seam section), which may serve as the basis for the forecasting of specific issues related to the flow of methane or other gases in individual longwall panels in that particular mine.

Author Contributions

Conceptualisation, A.W. and K.W.; methodology, A.W. and P.M.V.N.; software, P.M.V.N.; validation, M.Z.; formal analysis, P.M.V.N.; investigation, P.M.V.N.; resources, M.Z.; data curation, K.W.; writing—original draft preparation, P.M.V.N.; writing—review and editing, K.W. and A.W.; visualisation, K.W. and M.Z.; supervision, A.W.; project administration, P.M.V.N.; funding acquisition, A.W. and K.W. All authors have read and agreed to the published version of the manuscript.

Funding

This research was funded by the Ministry of Science and Higher Education of Poland, grant number No. 11132029-211.

Institutional Review Board Statement

Not applicable.

Informed Consent Statement

Not applicable.

Data Availability Statement

Not applicable.

Conflicts of Interest

The authors declare no conflict of interest.

References

  1. Kirchgessner, A.D.; Piccot, S.D.; Winkler, J.D. Estimate of global methane emissions from coal mines. Chemosphere 1993, 26, 453–472. [Google Scholar] [CrossRef]
  2. Creedy, D.P. Methane emissions from coal related resources in Britain: Development of a methodology. Chemosphere 1993, 26, 419–439. [Google Scholar] [CrossRef]
  3. Lunarzewski, L.W. Gas emissions prediction and recovery in underground coal mines. Int. J. Coal Geol. 1998, 35, 117–145. [Google Scholar] [CrossRef]
  4. Badura, H. Short-Term Prediction Methods for Methane Concentration at the Outlets from Caving Longwall Areas at Coal Mines; Politechnika Śląska: Gliwice, Poland, 2013. [Google Scholar]
  5. Szlązak, N.; Obracaj, D.; Swolkień, J. Methane drainage from roof strata using an overlying drainage gallery. Int. J. Coal Geol. 2014, 136, 99–115. [Google Scholar] [CrossRef]
  6. Krause, E. Short-term predictions of methane emissions during longwall mining. Arch. Min. Sci. 2015, 60, 581–594. [Google Scholar] [CrossRef]
  7. Koptoń, H. Review and verification of methods of absolute methane content prediction of roadway workings driven by means of heading machines in hard coal mines. Res. Rep. Min. Environ. 2007, 4, 51–64. (In Polish) [Google Scholar]
  8. Krause, E.; Krzystolik, P.; Łukowicz, K. Recognition, Forecasting, Control and Combating Methane Hazard in Hard Coal Mines; GIG: Katowice, Poland, 2001. [Google Scholar]
  9. Tarnowski, J. Mine working gas content forecasting method development. Arch. Górnictwa 1981, 26, 4. (In Polish) [Google Scholar]
  10. Krause, E.; Łukowicz, K. Dynamic Prediction of Absolute Methane Emissions on Longwalls; Technical Guide; GIG: Katowice, Poland, 2000. (In Polish) [Google Scholar]
  11. Krause, E.; Łukowicz, K. Gas hazard. In Occupational Safety in Hard Coal Mines; Konopko, W., Ed.; Central Mining Institute: Katowice, Poland, 2013. (In Polish) [Google Scholar]
  12. Koptoń, H. Method of prognosing absolute methane content in dog headings driven with heading machine in coal mines. Res. Rep. Min. Environ. 2009, 8, 53–72. (In Polish) [Google Scholar]
  13. Koptoń, H. Mathematical model of prediction of methane emissions into a drift crossing a coal seam. Pr. Nauk. GIG Kwart. Górnictwo Sr. 2011, 51–64. (In Polish) [Google Scholar]
  14. AS3980-1999; Australian Standards. Guide to the Determination of Gas Content of Coal—Direct Desorption Method. Standards Australia (Standards Association of Australia): Homebush, NSW, Australia, 2013.
  15. Chen, H.; Cheng, Y.; Ren, T.; Zhou, H.; Liu, Q. Permeability distribution characteristics of protected coal seams during unloading of the coal body. Int. J. Rock Mech. Min. Sci. 2014, 71, 105–116. [Google Scholar] [CrossRef]
  16. Karacan, C.O.; Olea, R.A. Inference of strata separation and gas emission paths in longwall overburden using continuous wavelet transform of well logs and geostatistical simulation. J. Appl. Geophys. 2014, 105, 147–158. [Google Scholar] [CrossRef] [Green Version]
  17. Ren, T.X.; Edwards, J.S. Three-dimensional computational fluid dynamics modelling of methane flow through permeable strata around a longwall face. Min. Technol. 2000, 109, 41–48. [Google Scholar] [CrossRef]
  18. Kurnia, J.C.; Sasmito, A.P.; Mujumdar, A.S. CFD simulation of methane dispersion and innovative methane management in underground mining faces. Appl. Math. Model. 2014, 38, 346–3484. [Google Scholar] [CrossRef]
  19. Tutak, M.; Brodny, J. Analysis of influence of goaf sealing from tailgate on the methane concentration at the outlet from the longwall. IOP Conf. Ser. Earth Environ. Sci. 2017, 95, 042025. [Google Scholar] [CrossRef]
  20. Brodny, J.; Tutak, M.; John, A. Analysis of influence of types of rocks forming the goaf with caving on the physical parameters of air stream flowing through these gob and adjacent headings. Mechanics 2018, 24, 43–49. [Google Scholar] [CrossRef] [Green Version]
  21. Mishra, D.P.; Kumar, M.; Panigrahi, D.C. Dispersion of methane in tailgate of a retreating longwall mine: A computational fluid dynamics study. Environ. Earth Sci. 2016, 75, 475. [Google Scholar] [CrossRef]
  22. Wierzbiński, K. The use of CFD methods for predicting the three-dimensional field of methane concentration in the ventilation roadway—Development and validation of numerical models 3D. Przegląd Górniczy 2016, 2, 44–55. (In Polish) [Google Scholar]
  23. Sasmito, A.P.; Birgersson, E.; Ly, H.C.; Mujumdar, A.S. Some approaches to improve ventilation system in underground coal mines environment—A computational fluid dynamic study. Tunn. Undergr. Sp. Technol. 2013, 34, 82–95. [Google Scholar] [CrossRef]
  24. Wala, A.M.; Vytla, S.; Taylor, C.D.; Huang, G. Mine face ventilation: A comparison of CFD results against benchmark experiments for the CFD code validation. Min. Eng. 2007, 59, 1–7. [Google Scholar]
  25. Branny, M. Computer simulation of flow of air and methane mixture in the longwall-return crossing zone. Arch. Min. Sci. 2006, 51, 133–145. [Google Scholar]
  26. Karacan, C.O.; Diamond, W.P.; Esterhuizen, G.S.; Schatzel, S.J. Numerical analysis of the impact of longwall panel width on methane emissions and performance of gob gas ventholes. In Proceedings of the International Coalbed Methane Symposium, Tuscaloosa, AL, USA, 17–19 May 2005; pp. 1–28. [Google Scholar]
  27. Whittles, D.N.; Lowndes, I.S.; Kingman, S.W.; Yates, C.; Jobling, S. Influence of geotechnical factors on gas flow experienced in a UK longwall coal mine panel. Int. J. Rock Mech. Min. Sci. 2006, 43, 369–387. [Google Scholar] [CrossRef]
  28. Walentek, A.; Wierzbiński, K. Influence of rock geomechanical parameters on increased longwall absolute methane emission rate forecasting accuracy. Arch. Min. Sci. 2020, 65, 641–664. [Google Scholar] [CrossRef]
  29. Teng, T.; Wang, Y.; He, X.; Chen, P. Mathematical modelling and simulation on the stimulation interactions in coalbed methane thermal recovery. Processes 2019, 7, 526. [Google Scholar] [CrossRef] [Green Version]
  30. Li, T.; Wu, B.; Lei, B.; Huang, Q. Study on air leakage and gas distribution in goaf of Y-type ventilation system. J. Energy Sources Part A Recovery Util. Environ. Eff. 2020, 1–14. [Google Scholar] [CrossRef]
  31. Felka, D.; Brodny, J. Application of Neural-Fuzzy system in prediction of Methane hazard. In Proceedings of the International Conference on Intelligent Systems in Production Engineering and Maintenance, Wroclaw, Poland, 28–29 September 2017; pp. 151–160. [Google Scholar]
  32. Tutak, M.; Brodny, J. Predicting methane concentration in longwall regions using artificial neural networks. Int. J. Environ. Res. Public Health 2019, 16, 1406. [Google Scholar] [CrossRef] [Green Version]
  33. Karacan, C. Modelling and prediction of ventilation methane emissions of U.S. longwall mines using supervised Artificial Neural Networks. Int. J. Coal Geol. 2008, 73, 371–387. [Google Scholar] [CrossRef]
  34. Karacan, C.; Goodman, G.V. Artificial neural networks to determine ventilation emissions and optimum degasification strategies for longwall mines. In Proceedings of the 12th U.S./North American Mine Ventilation Symposium, Reno, NV, USA, 9–12 June 2008; pp. 321–329. [Google Scholar]
  35. Karacan, C.O. Methane Control and Prediction (MCP) Software (Version 2.0). 2010. Available online: https://www.cdc.gov/niosh/mining/products/product180.htm (accessed on 26 May 2022).
  36. Dougherty, H.; Karacan, C.O. A new methane control and prediction software suite for longwall mines. Comput. Geosci. 2011, 37, 1490–1500. [Google Scholar] [CrossRef]
  37. Dziurzyński, W.; Wasilewski, S. Assessment of methane outburst hazard in the area of longwalls based on gas sensing electrode and computer simulation of the flow of air-and-methane mixture. Przegląd Górniczy 2012, 12, 28–34. (In Polish) [Google Scholar]
  38. Dylong, A. A monitoring and prediction of methane emission in the longwall and possibilities to control the longwall system. Min. Inform. Autom. Electr. Eng. 2016, 54, 5–14. [Google Scholar]
  39. Booth, P.; Nemcik, J.; Ren, T. A critical review and new approach for determination of transient gas emission behaviour in underground coal mines. In Proceedings of the 16th Coal Operation’s Conference, Cape Town, South Africa, 10–12 February 2016; University of Wollongong: Wollongong, NSW, Australia; pp. 367–379.
  40. Itasca Consulting Group Inc. FLAC (2-Dimensional Finite Difference Code), Version 6.0, Minneapolis. 2008. Available online: https://www.itascacg.com/ (accessed on 5 May 2008).
  41. Rajwa, S.; Janoszek, T.; Prusek, S. Influence of canopy ratio of powered roof support on longwall working stability—A case study. Int. J. Min. Sci. and Technol. 2019, 29, 591–598. [Google Scholar] [CrossRef]
  42. Rajwa, S. The Influence of the Geometrical Construction of the Powered Roof Support on the Loss of a Longwall Working Stability Based on the Practical Experience. Arch. Min. Sci. 2020, 65, 511–529. [Google Scholar] [CrossRef]
  43. Rajwa, S.; Janoszek, T.; Prusek, S. Model tests of the effect of active roof support on the working stability of a longwall. Comput. Geotech. 2020, 118, 103302. [Google Scholar] [CrossRef]
  44. Janoszek, T. The assessment of longwall working stability based on the Mohr-Coulomb stress criterion–numerical analysis. Arch. Min. Sci. 2020, 65, 493–509. [Google Scholar] [CrossRef]
  45. Nguyen, P.M.V.; Rotkegel, M.; Do Van, H. Analysis of Behaviour of the Steel Arch Support in the Geological and Mining Conditions of the Cam Pha Coal Basin, Vietnam. Arch. Min. Sci. 2020, 65, 551–567. [Google Scholar] [CrossRef]
  46. Nguyen, P.M.V.; Olczak, T.; Rajwa, S. An investigation of longwall failure using 3D numerical modelling—A case study at a copper mine. Studia Geotech. Et Mech. 2021, 43, 389–410. [Google Scholar] [CrossRef]
  47. Majcherczyk, T.; Malkowski, P.; Niedbalski, Z. Describing quality of rocks around underground headings: Endoscopic observations of fractures. In Proceedings of the International Symposium of the International Society for Rock Mechanics, Eurock 2005, Brno, Czech Republic, 18–20 May 2005; pp. 355–360. [Google Scholar]
  48. Malkowski, P.; Majcherczyk, T.; Niedbalski, Z. Endoscopic method of rockmass quality evaluation-new experiences. In Proceedings of the 42nd U.S. Rock Mechanics 2nd U.S.-Canada Rock Mechanics Symposium, San Francisco, CA, USA, 29 June–2 July 2008. [Google Scholar]
  49. Walentek, A. Analysis of the Applicability of the Convergence Control Method for Gateroad Design Based on Conducted Underground Investigations. Arch. Min. Sci. 2019, 64, 765–783. [Google Scholar] [CrossRef]
  50. Biliński, A. Method of Selection of Longwall Face and Roadway Supports for the Panelling Conditions; Prace naukowe Monografie; CMG KOMAG: Gliwice, Poland, 2005. (In Polish) [Google Scholar]
Figure 1. Section through a methane desorption zone from a destressed mined longwall [10].
Energies 15 04958 g001
Figure 2. Mohr–Coulomb failure criterion in FLAC2D [40].
Energies 15 04958 g002
Figure 3. An example of a plasticity indicator map defining the destressing zone around the longwall panel.
Energies 15 04958 g003
Figure 4. Algorithm for absolute methane emission rate forecasting in the area of a longwall caving extraction.
Energies 15 04958 g004
Figure 5. Location of the Pniówek coal mine.
Energies 15 04958 g005
Figure 6. Outline of the K-2 longwall in coal seam 362/3 + 363 (a), and fragment of the lithological profile around the K-2 longwall (b).
Energies 15 04958 g006
Figure 7. Ventilation diagram of the K-2 longwall environment in the 362/3 + 363 coal seam (red arrow—fresh air; blue arrow—used air).
Energies 15 04958 g007
Figure 8. Distribution of methane drainage boreholes along the K-7 heading in the area of the K-2 longwall in the 362 + 363/2 coal seam.
Energies 15 04958 g008
Figure 9. Courses of the methane capture (Qo) from the longwall to the drainage network, the absolute methane emission rate (total, Qt) and the methane emitted to the K-2 longwall area (adjacent strata, Qas).
Energies 15 04958 g009
Figure 10. Diagram of test boreholes in the K-7 heading of the K-2 longwall panel.
Energies 15 04958 g010
Figure 11. Observation in the vertical borehole (7 m) at a length of (a) 1.5 m and (b) 5.9 m.
Energies 15 04958 g011
Figure 12. Observation in the 7 m diagonal borehole at a length of 3.5 m.
Energies 15 04958 g012
Figure 13. Observation in the 4 m diagonal borehole at a length of 3.5 m.
Energies 15 04958 g013
Figure 14. Numerical model of the rock mass surrounding the mined longwall K-2, in coal seam 362/3 + 363.
Energies 15 04958 g014
Figure 15. Vertical roof and floor displacements after the extraction of a 4.2 m-thick longwall at various calculation steps: (a) 1000, (b) 1500.
Energies 15 04958 g015
Figure 16. Caved zone above the longwall working after 1000 calculation steps.
Energies 15 04958 g016
Figure 17. Destressing zone range calculation results for rock strata adjacent to longwall K-2 in coal seam 362/3 + 363 using FLAC2D (longwall length, Ls = 186 m), including the implementation of rock mass degasification level distribution.
Energies 15 04958 g017
Table 1. Mechanical parameters of the rock mass in the area of the analysed longwall panel adopted for numerical calculations.
Rock TypeYoung’s Modulus E, GPaPoisson’s Ratio υTensile
Strength σ t , MPa
Cohesion
c, MPa
Angle of Internal Friction
θ, °
Coal2.500.300.0390.5424
Silty shale4.500.250.0740.7527
Sandstone10.50.220.2401.9033
Table 2. Destressing zone range results for the FDM and empirical method calculations.
Longwall Length Ls, mUpper Destressing (Desorption) Zone Range, hgLower Destressing (Desorption) Zone Range, hd
Empirical MethodFDMEmpirical MethodFDM
1861281334872
Table 3. Ventilation and methane parameter measurement results, calculated total absolute longwall environment methane emission rate Qt and methane emission rates from overlaying and underlaying strata Qas.
Measurement ResultsCalculation Results
Measurement Date, MonthLongwall Face DistanceAverage Daily Output, WdQ1n1Q2n2Q3n3QoQtQas
-mMg/dm3/min% CH4m3/min% CH4m3/min% CH4m3 CH4/minm3 CH4/minm3 CH4/min
3rd220317813700.4313700.8429700.8612.231.8526.23
4th325369813700.3013700.8929750.8010.830.4922.41
5th405300913700.2213700.5929850.6811.728.9823.92
6th485271013750.2713750.6129900.6810.627.2222.54
7th520237113750.2113750.6929850.928.332.8726.27
Table 4. Total absolute methane emission rate from the longwall panel by means of the empirical method and FDM calculations, compared to the measured total absolute methane emission rates.
MonthAverage Daily Output, WdMeasured Qc(rej)MethodForecast QtDifferenceRelative
Error, %
-Mg/dm3/min-m3/minm3/min
3rd317831.85Empirical29.29−2.568
FDM42.8410.9935
4th369830.49Empirical19.38−11.1136
FDM33.262.779
5th300928.98Empirical25.87−3.1111
FDM38.979.9934
6th271027.22Empirical20.36−6.8625
FDM31.914.6917
7th237132.87Empirical17.44−15.4347
FDM28.14−4.7314
Average error of forecastsEmpirical −7.80.25
FDM 4.80.22
Table 5. Forecasting results for emitted methane volumes desorbed from adjacent strata to the longwall environment, obtained by means of the empirical method and FDM calculations, compared to the measured methane emission rates from adjacent strata.
MonthAverage Daily Output, WdMeasured Q(des)MethodForecast QasDifferenceRelative
Error
-Mg/dm3/min-m3/minm3/min
3rd317826.23Empirical14.40−11.8345
FDM25.70−0.532
4th369822.41Empirical8.67−13.7461
FDM20.23−2.1810
5th300923.92Empirical12.67−11.2547
FDM23.56−0.361
6th271022.54Empirical9.96−12.5856
FDM19.58−2.9613
7th237126.27Empirical8.59−17.6867
FDM17.52−8.7533
Average error of forecastsEmpirical 13.420.55
FDM 2.960.12
Table 6. Total captured methane emission obtained by means of the empirical method and FDM calculations.
Total Captured Methane EmissionTotal Predicted Value of Methane Emission by Empirical MethodDifferenceRelative
Error of Empirical Results
Total Predicted Value of Methane Emission by FDMDifferenceRelative
Error of FDM Results
m3/minm3/minm3/min%m3/minm3/min%
58.0843.69−14.392568.5410.4618
52.9028.05−24.854753.490.591
52.9038.54−14.362762.539.6318
49.7630.32−19.443951.491.733
59.1426.03−33.115645.66−13.4823
Average value39 13
Publisher’s Note: MDPI stays neutral with regard to jurisdictional claims in published maps and institutional affiliations.

