Abstract
Household consumption has become an important field of carbon dioxide emissions. Urban–rural disparity in the household carbon emissions (HCEs) of residents and their influencing factors are relevant to HCE reduction. Taking Fujian as the study area, the LMDI and SDA models were used to analyze the effects of influencing factors for the direct household carbon emissions (DHCEs) and indirect carbon emissions (IHCEs) of urban and rural residents from 2006 to 2018. The HCEs continue to rise, approximately 65% from the IHCEs in 2017, and urban areas occupied 67% in 2018. The gap between urban and rural per capita HCEs is narrowing. In 2017, approximately 75% of urban per capita HCEs came from the IHCEs, while the per capita DHCEs’ occupation exceeded the IHCEs in rural areas. Per capita consumption expenditure has the largest positive effect on the DHCEs and IHCEs in urban and rural areas. With the urbanization process, the inhibition effect of rural DHCEs is larger than the positive effect of the urban DHCEs, while the positive impact on urban areas is more substantial than on rural areas in the IHCEs. Combined with regional differences, urban and rural areas should take “common but differentiated” emission reduction responsibilities.
1. Introduction
Climate change is fundamentally related to greenhouse gas emissions, such as carbon dioxide (CO2), and has become a major global issue [1,2]. Energy consumption is considered to be the major contributor to CO2 emissions [3]. Since the 1990s, the household energy consumption in some developed countries has exceeded that of the industrial sector, and researchers have begun to recognize that household carbon emissions (HCEs) are an important source of carbon emissions [4,5,6]. The impact of household consumption on energy and the environment has attracted worldwide attention [7,8,9]. Households account for three-quarters of the total energy consumption in India [10], 80% in the United States [4], and 61% in Japan [11]. Approximately 72% of global carbon emissions are attributed to household consumption [12]. Therefore, global climate mitigation cannot be achieved without reducing household emissions.
As an energy-intensive economy and the largest carbon emitter, China also produces a substantial amount of HCEs, accounting for more than 40% of national emissions [13]. Along with the rapid economic growth of China over the past two decades, household consumption has led to a rapid increase in energy demand, averaging 12.8% yearly [7]. Households consume energy not only directly in the form of electricity and natural gas but also indirectly related to the production and transportation of products. Therefore, HCEs can be divided into direct and indirect emissions accordingly [14]. Direct household carbon emissions (DHCEs) refer to carbon emissions related to direct household energy consumption (such as transportation, cooking, and warming), while indirect household carbon emissions (IHCEs) combine the life cycle and refer to carbon emissions from energy consumed in the production, transportation, and sales of commodities [14].
Household energy consumption and carbon emissions are increasing with the improvement of living standards of residents, and thus has become one of the popular research topics in recent years [15,16]. Scholars have conducted a series of studies at the national, regional, and city levels [6,17,18]. The advancement of urbanization has led to urban population growth and increased consumption of energy, resources, and electricity, resulting in additional carbon emissions [3,19]. China has a typical urban–rural dual economy despite the narrowing gap between urban and rural areas [20]. The urbanization rate of China reached 64.72% in 2021, while when China proposed reform and opening up in 1978 it was only 18%. However, the urban–rural gap in the source and usage of energy still currently exist [21]. The proportion of urban HCEs will continue to rise due to the intensification of urbanization and urban–rural shifts [22]. The analysis of urban HCEs has been the hotspot of previous research [18,23], while the rural HCEs are overlooked. However, the energy use in rural households has changed substantially considering the quantity, quality, structure, and pattern [24,25,26].
Accurate accounting is essential to clarify the difference in the HCEs between urban and rural residents. Various approaches, including emission coefficient method (ECM), input–output analysis (IOA), life cycle assessment (LCA), and consumer lifestyle analysis (CLA), have been used to quantify the HCEs [15,27]. ECM is used to evaluate DHCEs [28], while IOA and LCA are employed to analyze the IHCEs embodied in materials and services [5,29]. CLA combines ECM and IOA to calculate total HCEs, including DHCEs and IHCEs, comprehensively [13,20]. In view of the different stages of economic development between urban and rural areas, the proposed mitigation policies should be based on the influencing factors of the HCEs. Energy intensity and structure, household expenditure or income level, and population are considered as the major influencing factors affecting household energy consumption and carbon emissions [30,31]. The urbanization reflecting the changes in urban and rural populations has gradually explored due to the transformation of many rural residents into urban residents in China [32,33]. Li [34] indicated that urbanization will increase the CO2 emission of the household consumption of Chinese residents. Fan [35] observed that increasing demand for energy consumption in the household consumption sector is related to urbanization. The difference in the HCEs between urban and rural areas should be considered to facilitate the transformation of residents to a sustainable lifestyle. In addition, the HCEs vary among regions in China due to the heterogeneity of the inter-provincial energy structure, income level, population, and urbanization process [36].
Previous studies have analyzed the differences in energy consumption and carbon emissions between Chinese urban and rural areas [37,38], the DHCEs and influencing factors in the urban and rural areas in China [39], and the influencing factors of the IHCEs in urban China [40,41]. However, these studies failed to evaluate the provincial heterogeneity between the DHCEs and IHCEs and their influencing factors in urban and rural areas comprehensively, especially the effect of changes in urban–rural structure and the analysis of the reasons for the differences.
This study takes Fujian as the study area and explores the urban–rural disparity in the IHCEs and DHCEs considering characteristics, influencing factors, and regional heterogeneity to clarify whether urban and rural areas undertake “common but differentiated” responsibilities to reduce emissions and how carbon emission reduction is equitably promoted in the consumption of urban and rural residents at the provincial level. In support of prior research, this study provides the following contributions. First, this paper enriches the research at the provincial level and comprehensively explores the characteristics, compositions, change effect factors, and urban–rural disparity of consumption carbon emissions including HCEs, DHCEs, and IHCEs. Second, the valuable decomposition model (LMDI and SDA) and influencing factors selected in this paper help identify provincial emission reduction priorities, explore the urban–rural disparity, and provide a reference for other studies. Finally, emphasizing comparisons with existing research in other regions of China, this paper not only provides policy suggestions for the carbon emission reduction of Fujian province but proposes “common but differentiated” responsibility and mitigation strategies for emission reduction in urban and rural areas.
2. Study Area
Fujian province, which is located on the southeast coast of China (Figure 1), is a region with rapid economic development. In the context of the epidemic in 2020, the GDP of Fujian ranked 7th in China (CNY 43,904 billion), demonstrating a more rapid development compared with its former ranking (12th) in 2006 (CNY 844 billion). Meanwhile, its per capita GDP ranked 4th in China, next to Beijing, Shanghai, and Jiangsu.
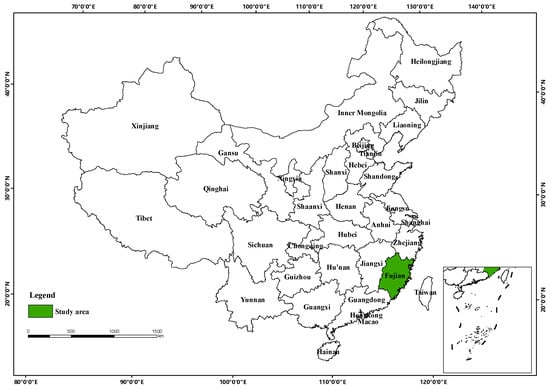
Figure 1.
Location of Fujian province in China.
Fujian province had 14,371,078 families in 2020. The urbanization rate of Fujian is 68.75%, which is higher than that of China (63.89%), thus ranking 8th overall. Compared with the sixth national census in 2010, the urban population increased by 7,492,818, the rural population decreased by 2,846,948, and the proportion of the urban population increased by 11.66%. Figure 2 shows that the urbanization rate of Fujian is in a state of gradual improvement. Therefore, the characteristics of HCEs of urban and rural residents in Fujian province under steady urbanization and rapid economic growth are worth exploring.
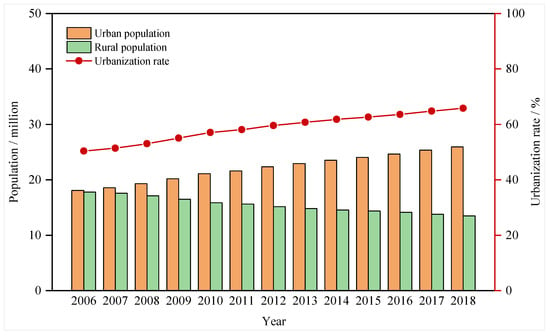
Figure 2.
Population and urbanization rate in Fujian province (2006–2018).
Fujian is far ahead of the rest of China in ecological civilization construction due to its low carbon emission and carbon intensity. The task of reducing the emissions of each province is challenging with the proposed carbon peak and carbon neutrality targets in 2020. Realizing low-carbon development has become the key point of Fujian province’s economic development and policy orientation. The analysis of the differences between urban and rural carbon emission characteristics and their influencing mechanisms can provide a reference for the government to achieve low-carbon sustainable development in the process of promoting urbanization. Fujian is currently promoting all-around high-quality development. The HCEs of urban and rural residents are worth further exploring considering green development and providing an example for China to create carbon emission reduction experiences.
3. Method
3.1. Calculation of CO2 Emissions
3.1.1. Calculation of the Total HCEs
The calculation of the total CO2 emissions () related to household consumption in the urban and rural areas in Fujian, which distinguish between direct carbon emissions () and indirect carbon emissions (), is shown as Equation (1) (tCO2) based on the CLA method.
3.1.2. Calculation of the DHCEs
DHCEs () comprise carbon emissions from fossil fuel () and electricity () as revealed in Equation (2), tCO2.
The calculation of HCEs from fossil fuel according to the IPCC Guidelines for National Greenhouse Gas Emissions Inventory is presented in Equation (3) as follows:
where refers to HCEs from fossil fuel, tCO2; is the emission factor of the fossil fuel , tCO2/t, which can be obtained by Equation (2); is the consumption of the fossil fuel , t or m3.
where is the average low calorific value of fuel , KJ/kg or KJ/m3; is the carbon content per calorific value of fuel , tC/TJ; is the carbon oxidation rate of fuel , %; and is 44/12.
The calculation of DHCEs from electricity is shown in Equation (5).
where refers to the DHCEs from electricity, tCO2; refers to household electricity consumption, kW·h; and refers to electricity CO2 emission factor, tCO2/(104 kW·h).
The Fujian Power Grid belongs to the East China Regional Power Grid, which includes Shanghai, Jiangsu, Zhejiang, Anhui, and Fujian. Therefore, the electric CO2 emission factor of Fujian province is that of electric power in the East China region obtained by calculating the energy balance sheet of the five provinces in the region.
3.1.3. Calculation of the IHCEs
The energy input–output analysis method (IO-EA-basic) is used to calculate the IHCEs of Fujian province due to its suitability in analyzing the changes in the economic system and structure in the macro-level. The calculation formula for IHCEs is as follows:
where the refers to the IHCEs, tCO2; is the carbon intensity of each industry, row vector; is the direct consumption coefficient matrix of the input–output model; is the Leontief inverse matrix, which is also known as the complete consumption coefficient matrix; and is the final consumption of each consumer product by urban and rural residents, column vector.
Drawing on CLA proposed by Wei [20], the consumption types of residents in Fujian province are divided into food, clothing, housing, household equipment and supplies, transportation and communication, education and entertainment, medical care, and other goods and services. The IHCEs of the eight categories of residents are calculated by collating and merging the energy balance sheet of Fujian province in the China Energy Statistical Yearbook and the corresponding departments in the input–output table of Fujian province. The correspondence between departments is shown in Appendix A.
3.2. Influencing Factor Model
3.2.1. LMDI Model
This study expands and transforms the Kaya identity as shown in Equation (7) considering the DHCE characteristics of the energy consumption of urban and rural residents.
where is the DHCEs; is resident category, = 1 represents urban residents, and = 2 represents rural residents; is energy category, = 1, 2, …, 6, represents six types of fossil fuels; is the CO2 emissions from the -type energy consumption of resident ; is consumption of -type energy from the residents ; is the total direct energy consumption of the resident ; is the total consumption expenditure of urban or rural residents; is the total permanent population of the urban or rural residents; is the total permanent population.
Setting , , , , and , the DHCEs decomposition expression can be converted as follows:
where is the carbon emission factor of the energy ; is the proportion of the energy consumption of the resident to the total, namely energy structure factor; is the direct energy consumption per unit expenditure of resident , namely energy consumption intensity factor; is the per capita consumption expenditure of resident , namely the per capita consumption expenditure factor; is the proportion of resident population to the total population, namely population structure factor of urban and rural; and is the total permanent population, namely the population size factor.
The DHCEs decomposition of the consumption of urban and rural residents can be expressed on the basis of the LMDI model as shown below.
where is the DHCEs in the comparison period, is the DHCEs in the base period, is the difference of the DHCEs in the comparison and the base period, is the change effect of CO2 emission factor, is the change effect of energy structure factor, is the change effect of energy consumption intensity factor, is the change effect of per capita consumption expenditure factor, is the change effect of the population urban–rural structure factor, and is the change effect of the population size factor.
The expressions of the above six aforementioned variables are as follows.
3.2.2. SDA Model
SDA decomposition takes many forms. Among these forms, the bipolar decomposition method is a mature theory with relatively wide application and intuitive expression. This method is used in this study to decompose the influencing factors of the IHCEs in Fujian. Setting , the expression of the IHCEs () can be expressed as Equation (16).
where represents the household consumption structure, that is, the proportion of consumption expenditure of urban or rural residents to the sector ; is the per capita consumption of residents; is the urban and rural population structure, that is, the proportion of urban and rural residents in the total population; is the resident population.
The superscript generally indicates the comparison period, and indicates the base period. The change effect in IHCEs can be calculated from Equation (17).
Setting the impact of changes in Xi on as , the two-level decomposition of the SDA model is expressed as follows:
The total effect of structural decomposition of the IHCEs () is expressed on the basis of the above formula as follows:
where is the change effect of the CO2 emission intensity; is the change effect of intermediate production technology; is the change effect of consumption structure of residents; is the change effect of per capita consumption; is the change effect of population urban–rural structure; is the change effect of population size. The expressions of the six aforementioned factors, see Equations (20)–(25).
3.3. Data Source
The data of energy consumption of Fujian residents are obtained from the Energy Balance Table in the China Energy Statistics Yearbook from 2007 to 2019. The population and economic data of Fujian province are collected from the Fujian Statistical Yearbook. The input–output table of Fujian province is compiled for every year ending with 2 and 7. Thus, the current study adopts the input–output table of Fujian province in 2007, 2012, and 2017. Carbon emission-related coefficients are shown in Appendix B.
4. Results
4.1. Characteristics of the HCEs
The total HCEs of Fujian province continued to rise from 6802.83 million tons in 2007 to 91.316 million tons in 2017, demonstrating a growth rate of 34.23%. Figure 3 indicates that the DHCEs and IHCEs of the urban and rural areas all showed an upward trend from 2007 to 2017. Among them, the rural IHCEs increased relatively little.
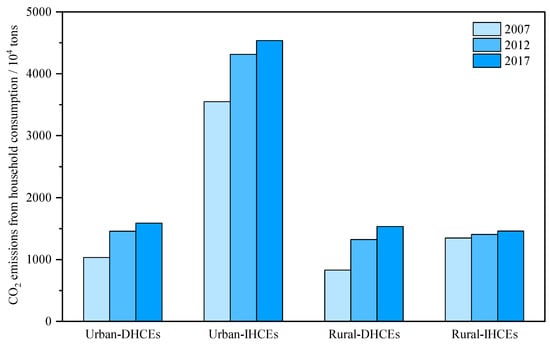
Figure 3.
Urban–rural CO2 emissions from household consumption in Fujian province.
The urban HCEs accounted for approximately two-thirds of the total HCEs in 2007, 2012, and 2017. The amount of the total HCEs is mainly comprises from the IHCEs despite their decreased proportion from 72.66% in 2007 into 65.78% in 2017. A similar trend is observed in urban areas. Meanwhile, the IHCEs occupation of HCEs in rural areas declined from 62% in 2007 to 49% in 2017. The rural DHCEs surpassed IHCEs in 2017, indicating a significant increase in rural usage of direct energy.
4.2. Characteristics of the Per capita HCEs
The per capita HCEs of urban residents (2416.88 kg CO2) was higher than that of rural residents (2173.05 kg CO2) in 2017 (Figure 4). The urban per capita HCEs has a downward trend in recent years, while the rural per capita HCEs has steadily increased, thus demonstrating a narrowing difference between urban and rural per capita HCEs in Fujian province.
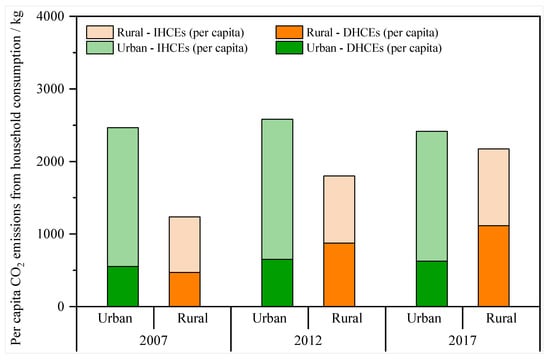
Figure 4.
Per capita CO2 emissions from household consumption in Fujian province.
The per capita HCEs for the urban areas mainly comprise the DHCEs. The per capita DHCEs in urban areas were 1790.54 kg in 2017, accounting for 74.08% of the urban DHCEs. Meanwhile, the per capita IHCEs (1113.65 kg) in the rural areas, gradually increased and surpassed the per capita DHCEs (1059.39 kg) in 2017.
4.3. Results of the DHCEs in Urban and Rural Areas
4.3.1. Comparison of the DHCEs Characteristics in Urban and Rural Areas
The DHCEs increased continuously with fluctuation yearly in urban and rural areas (Figure 5). The DHCEs of urban areas in 2018 were 1.91 times that of 2006, and those of rural areas increased 1.85 times from 2006 to 2018. In addition, the urban DHCEs (1666.24 kg) came close to the rural DHCEs (1587.18 kg) in 2018. The per capita DHCEs of rural residents have exceeded those of urban areas since 2009, demonstrating a widening gap. Combined with Figure 2 and Figure 5, per capita carbon emissions still increased despite the decline in rural population, while the urban population increased without demonstrating notable per capita DHCEs changes.
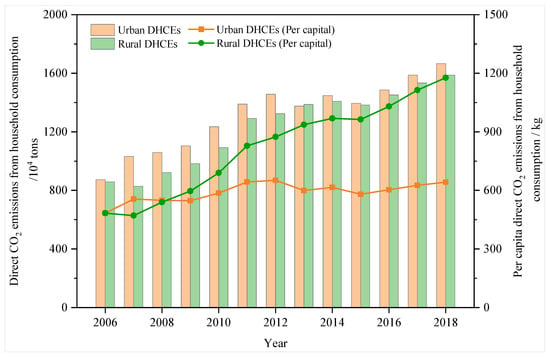
Figure 5.
Direct CO2 emissions from household consumption in Fujian province.
Furthermore, the energy structure of the DHCEs in Fujian province is identified and compared. Electricity accounted for the largest proportion of the DHCEs, rising from 61.34% in 2006 to 81.55% in 2018 (Figure 6). Oil products followed such a trend, with an average proportion of 15.48%. Since 2008, natural gas has been used in residential energy consumption in Fujian province. As a clean and commercial primary energy, natural gas contributes a small proportion of CO2 emissions (1.37% in 2018). Notably, natural gas is currently used in urban areas and is less employed in rural areas. Coal is the only energy source that decreased from 2006 (25.76%) to 2018 (1.34%). This reduction is inseparable from the sharp decline of the rural areas, that is, from 40.47% in 2006 to 2.16% in 2018. Clean energy has been promoted and applied in recent years. Thus, the energy structures of the DHCEs in both urban and rural areas of Fujian province have generally been optimized.
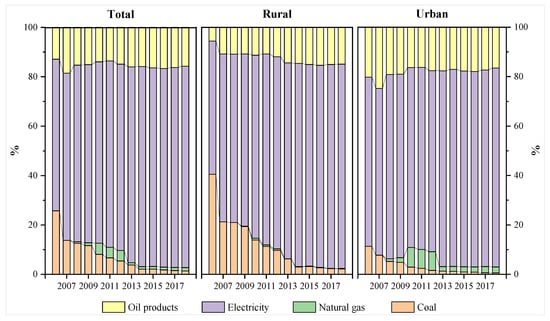
Figure 6.
Energy structure of direct CO2 emissions from household consumption in Fujian province.
4.3.2. Change Effect of Influencing Factors of DHCEs
Six influencing factors were decomposed for the DHCEs of urban and rural residents in Fujian province from 2006 to 2018 (Figure 7). The order of absolute value of relative contribution to HCEs is Per capita consumption expenditure effect (226.04%) > energy consumption intensity effect (−134.58%) > CO2 emission factor effect (−31.80%) > energy structure effect (31.75%) > population size effect (16.04%) > population urban–rural structure effect (−7.46%).
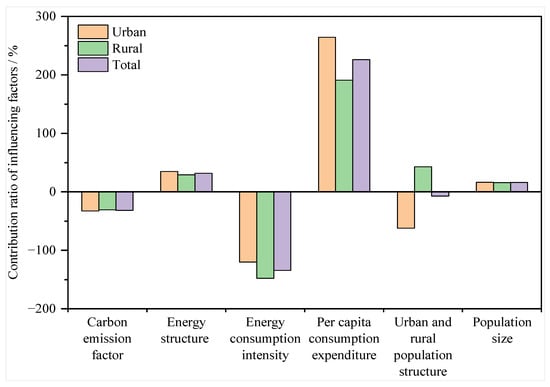
Figure 7.
Contribution of influencing factors to direct CO2 emissions from household consumption in Fujian Province from 2006 to 2018.
The growth of per capita consumption expenditure is the leading factor that promotes the growth of the DHCEs from residential consumption, and the change in energy consumption intensity has a strong inhibitory effect on the growth of the DHCEs.
The change in the urban–rural structure of the population positively and negatively contributes to the DHCEs of living consumption of urban residents and the rural areas, respectively, ultimately resulting in a slightly negative overall effect.
The negative effect of CO2 emission factor, energy consumption intensity, and urban–rural structure change is lower than the positive effect of per capita consumption expenditure, energy structure, and population size. Thus, the DHCEs in Fujian province show a growth trend overall and increased by 15.2082 million tons from 2006 to 2018.
Furthermore, the variable effects of each influencing factor are analyzed (Figure 8). The negative effect of energy CO2 emission factors has a fluctuating downward trend in the urban and rural areas. The influence of energy CO2 emission factors on the DHCEs is mainly reflected in the change of power emission factors. The CO2 emission factor of power grids in East China gradually declined from 2006 to 2018 due to the optimization of power grid generation structures. The proportion of thermal power generation decreased from 92.12 % in 2006 to 81.11% in 2018, while that of clean energy generation, such as hydropower, wind power, nuclear power, and solar power, increased. Fujian province is endowed with superior clean energy benefits within the East China Power Grid, leading in water and tidal resources in East China and the utilization of nuclear energy. Wind and nuclear power began to appear in 2014, and solar power appeared after 2015. The proportion of the three clean energy powers (hydropower, nuclear power, and wind power) in Fujian province has gradually increased in recent years, reaching more than five times the national average. With Fujian province as a representative, the East China regional power grid is developing toward a clean and low-carbon development. Vigorously upgrading clean energy power generation technologies and optimizing the grid structures are conducive to reducing the CO2 emission factor of electricity, which is of considerable importance to the reduction of the HCEs.
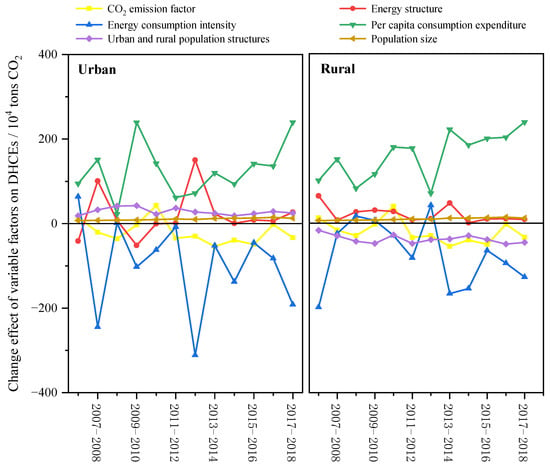
Figure 8.
Change effect of variable factors on direct carbon emissions from household consumption.
The increase in population size has promoted the growth of the DHCEs in urban and rural areas due to the consumption of additional energy. The effect of population size change is consistent with the change law of population size growth rate. The population of Fujian province will continue to grow in the future according to the current growth trend and population incentive policies, which will lead to an increase in the DHCEs.
“Energy intensity” generally refers to the ratio of energy use to economic output. The living consumption of residents is taken as the research object, and CO2 emissions in the consumption field are highlighted. Thus, replacing output value with the consumption expenditure of residents is appropriate. Therefore, “energy consumption intensity” is defined as the direct energy consumption of unit consumption expenditure in this paper. The effect of energy consumption intensity of urban and rural residents in DHCEs was principally negative from 2006 to 2018, presenting a fluctuating downward trend. A steady decline in energy consumption intensity will help to restrain the DHCEs.
The promotion in the urban–rural structure of the population has a positive and negative effect on the DHCEs of urban and rural areas, respectively. The indicator of urban–rural structural changes is closely related to the level of urbanization in Fujian province. With the advancement of the urbanization, it will lead to rising urban populations considering the population size does not decline, and the DHCEs of urban will also continue to rise. On the contrary, the DHCEs of rural areas will decrease with the increase in urbanization rates. The impact of the urban–rural structure of the population on the DHCEs of urban and rural areas shows the opposite result, which has an offsetting effect on the total amount of change. In recent years, the per capita DHCEs of rural residents is significantly higher than that of urban residents. The inhibition effect of rural population reduction on the DHCEs is larger than that of urban population increase on the DHCEs. These conditions result in a slightly negative effect (−1.1342 million tons of CO2) on the DHCEs due to changes in the urban–rural population structure under the superposition of urban–rural effects, which plays a role in promoting CO2 emission reduction.
The impact of changes in energy consumption structure on HCEs was dominated by positive effects from 2006 to 2018, and urban changes were larger than that of rural areas. The electricity consumption proportion of urban residents in Fujian province rose from 42.47% in 2006 to 61.65% in 2018, while the consumption structure of rural residents increased from 32.71% to 66.08%. The proportion of electricity consumed to replace fossil fuels, such as coal and oil, does not absolutely reduce CO2 emissions. Such a reduction depends on the amount of electricity used and the structure of electricity production. The slight increase in the consumption structure of gasoline and diesel also promoted the positive changes effect of the energy structure factors. The superposition of different energy fluctuation effects induced positive effects on the influence of the energy structure factor.
The per capita consumption expenditure factor demonstrated a positive impact on the DHCEs of urban and rural residents from 2006 to 2018. The per capita consumption expenditure in Fujian province has continued to increase, reaching 3.86 times that of 2006 in 2018. The continuous increase in consumption level has driven the improvement of the living standards of urban and rural residents. The increased number of household appliances result in the risen of the DHCEs. The ability of residents to pay for relatively efficient and clean energy, such as electricity, has also enhanced to a certain extent with the gradual improvement of living standards. Thus, reasonable guidance on a low-carbon lifestyle plays a crucial role in carbon emission reduction.
4.4. Results of the IHCEs in Urban and Rural Areas
4.4.1. Comparison of the IHCEs Composition in Urban and Rural Areas
In Fujian province, the IHCEs showed a steady upward trend from 2007 to 2017, and the urban IHCEs occupy more than 70% of the total IHCEs (Figure 3). Similarly, the urban per capita IHCEs and annual growth rate are higher than that of rural ones. Thus, the gap in IHCEs between urban and rural residents is gradually narrowing.
As Figure 9 indicates, food, transportation and communication, and residential consumption are the important sources of the IHCEs. The contribution of the transportation and communication sectors to HCEs rising from 15.25% in 2007 to 22.30% in 2017. The IHCEs of the housing sector showed a significant downward trend, from 21.44% in 2007 to 11.17 in 2017. The food sector’s share of indirect CO2 emissions has slightly changed. The IHCEs of the transportation and communication sectors of urban residents exceeded that of the food sector in 2017, ranking first in IHCEs, while the food sector of rural residents still occupied an absolute advantage overall. The share of IHCEs from the culture, education, entertainment, and healthcare sectors continued to rise, with their share rising from 10.87% in 2007 to 20.56% in 2017. The IHCEs generated by the consumption of clothing and household equipment and supplies department are low and remained unchanged.
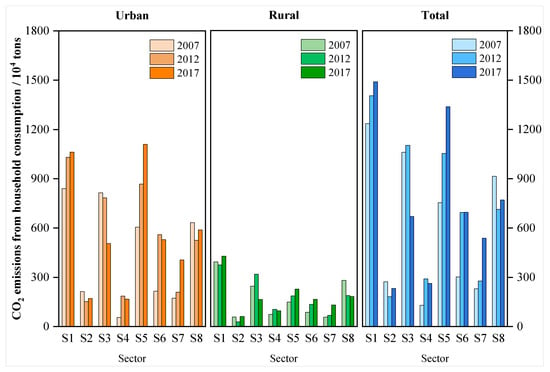
Figure 9.
Structure of indirect CO2 emissions from household consumption in Fujian province. Note: S1 is the food sector; S2 is the clothing sector; S3 is the housing sector; S4 is the household equipment and supplies sector; S5 is the transportation and communication sector; S6 is the education and entertainment sector; S7 is the medical care sector; S8 is other goods and services sector.
The change characteristic of the IHCEs reflects the upgrading and transformation of the household consumption structure of urban and rural residents from “clothing, housing, and use” to “travel, entertainment, and health care”. The IHCEs caused by subsistence consumption gradually decreased or slowly grew, while those caused by developmental consumption rapidly increased.
4.4.2. Change Effect of the Influencing Factors of the IHCEs
The influencing factors of the urban and rural IHCEs during 2007–2012, 2012–2017, and 2007–2017 were decomposed (Table 1). The decomposition order according to the absolute value of relative contribution is as follows: CO2 emission intensity effect (−611.28%) > per capita consumption effect (609.13%) > population urban–rural structure effect (43.43%) > population scale effect (39.29%) > intermediate production technology effect (34.01%) > resident consumption structure effect (−14.58%).

Table 1.
Decomposition result of influencing factors of IHCEs in Fujian province.
The growth of per capita consumption expenditure is the dominant factor that promotes the growth of the IHCEs, while the reduction of CO2 emission intensity has a strong inhibitory effect (Figure 10). Intermediate production technology and resident consumption structure contributed positively to the IHCEs of urban and rural residents in 2007–2012, and both turned negative during 2012–2017. Results illustrate the optimization of intermediate production technology and resident consumption structure. Compared with the significant positive effect of per capita consumption level, the impact of population size is minimal. Thus, population growth is currently not the main source of IHCEs in Fujian province. The factors of urban and rural population structures show opposite effects, that is, positive and negative effects in urban and rural areas, respectively.
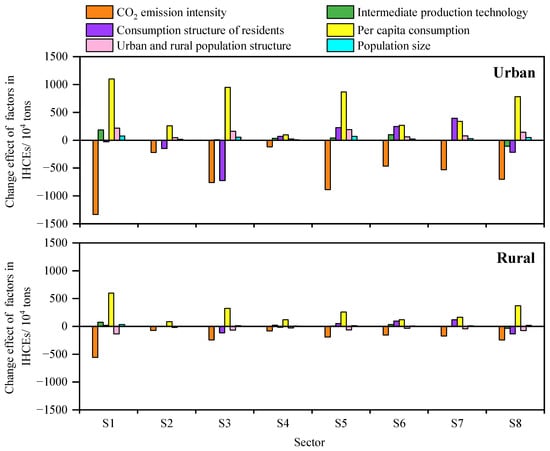
Figure 10.
Change effect of influencing factors to IHCEs in Fujian province from 2007 to 2017. Note: S1 is the food sector; S2 is the clothing sector; S3 is the housing sector; S4 is the household equipment and supplies sector; S5 is the transportation and communication sector; S6 is the education and entertainment sector; S7 is the medical care sector; S8 is other goods and services sector.
Considering the change effects of all factors in each sector, the changes in carbon emission intensity of all sectors presented negative effects, while per capita consumption and population size demonstrated positive effects on all sectors of rural and urban areas.
The contribution of the urban household equipment and supplies sector to the per capita consumption of residents is lower than that of the rural, while the effects are reverse in other sectors. The effect of the intermediate input factor lies in the positive effects of the seven other types of sectors, with the exception of the negative effects of other commodity and service sectors.
Three sectors include food sector, transportation, communication sector, and housing sector have most changes effect in carbon emission intensity, urban and rural population structure, per capita consumption, and population size. The largest effect of consumption structure change factor is residence sector, followed by medical care and entertainment sector. The sectors with the most contributions to the intermediate input factor are food and culture sector as well as education and entertainment sector. Therefore, the low carbonization of the food and housing sectors should be emphasized. Advocating a low-carbon lifestyle, encouraging rational consumption and improving production efficiency, and reducing energy consumption produced by various sectors will help to reduce the IHCEs.
5. Discussion
5.1. Urban–Rural Disparity of the HCEs Influencing Factor
Furthermore, decomposition results of the influencing factors of the urban and rural IHCEs and DHCEs in Fujian province from 2006 to 2018 are summarized and compared in Table 2.

Table 2.
Summary of the impacts of the urban and rural DHCEs and IHCEs.
The comparison indicates the per capita consumption expenditure factor has the most influential positive effect on both DHCEs and IHCEs whether in urban or rural areas. The largest negative effect for the DHCEs is from energy consumption intensity factor, while that of the IHCEs is from carbon emission intensity factor.
The urban–rural demographic structure factor has a positive and negative impact on the urban and rural HCEs, respectively. This illustrates that urbanization processing promoted the urban HCEs from 2007 to 2017 but reduced the rural HCEs.
The total effect of the DHCEs and IHCEs demonstrated negative and positive impacts, respectively. The restraining effect of the DHCEs in rural areas during this period is larger than the promotion effect of urban areas, while the positive impact of the IHCEs in urban areas is larger than that in rural areas. Therefore, reducing indirect carbon emissions in urban and rural areas must be emphasized.
Comparing with the other factors, the population has a positive impact but a minimal influence on the DHCEs and IHCEs in urban and rural areas. This is not only related to the slowdown in population growth but also confirms the substantial increase in the living standards of residents. With the increase of population, energy consumption should no longer be a simple superposition but a phenomenon of resource sharing, thus contributing to the reduction of per capita HCEs.
Combining the comparison results of urban and rural HCEs and disparity in influencing factors, carbon emission mitigation responsibilities and directions in urban and rural should be “common but differentiated”. Urban and rural areas should make efforts to reduce carbon emission intensity, adjust energy structure, and reduce per capita consumption expenditure. However, the difference lies in the intensity of carbon emission reduction and the focus on the aspects of the DHCEs and IHCEs.
5.2. Regional Similarities and Differences of the HCEs in Urban and Rural Areas
5.2.1. Emissions Characteristics
Industrial structure and resource endowments vary greatly among provinces in China because Of the huge territory [42]. Results of Liu [13] indicate that HCEs continued to grow from 1992 to 2007 for China. The HCEs of China continued to grow in 2012 compared with 2007 [43]. Shi [36] illustrates that the DHCEs of China has the characteristics of higher urban than rural areas. Urban residents with higher incomes need additional goods and services to address their demands due to the income gap between urban and rural residents [13]. Similarly, the IHCEs of China also manifested that urban areas are higher than rural areas, and this gap is widening [44]. Furthermore, Feng [38] reveals that indirect energy consumption and the IHCEs in China were far larger than direct ones. The current study revealed that the overall trends and characteristics of Fujian province are basically the same as China. Fujian province showed growth from 2006 to 2018, with urban areas higher than rural areas, and the IHCEs exceeded DHCEs in 2007, 2012, and 2017.
Fujian province is similar to the southeast coastal areas, such as Guangdong province, considering per capita carbon emissions; both areas have lower per capita DHCEs in urban areas than in rural areas, while per capita IHCEs are higher in urban areas than in rural areas. However, Guangdong province has a large urban–rural gap in indirect CO2 emissions per capita with a ratio of 3.35, far exceeding that of Fujian province (1.69).
5.2.2. Energy Structure
The main energy used in urban areas is natural gas and electricity, while most rural residents still use many traditional biomass fuels, such as stalks and firewood, in their daily lives [45,46]. Natural gas is uncommon in rural areas [38]. However, the structure of direct energy use in rural areas has become diversified. Coal and electricity are still the main energy sources for Fujian province, and the composition of electricity has become clean.
Guo [47] demonstrates that differences in geographic location and climate zone will affect energy consumption patterns through heating and cooling demands. In addition, Wu [48] illustrates the heating energy consumption of rural households in the north is higher than that in the south. The rural energy consumption in Fujian province is significantly lower than that in the northern rural areas, further verifying the result. The rural areas of north China should avoid the usage of coal in inefficient traditional stoves considering their copious amounts of air pollutants [23].
5.2.3. Emission Sectors
Food, housing, and transportation are the three major sectors of IHCEs worldwide, accounting for 20%, 19%, and 17%, respectively [12]. Housing sector is considered most indirect energy consumption in China, followed by the food, transportation, and clothing sectors [49]. Consistent with global and national research results, the food, housing, and transportation sectors are also the three major sectors of the IHCEs in Fujian province. These three sectors include food, housing, and transportation, which accounted for 24.86%, 17.05%, and 18.93% of the IHCEs in 2017, respectively, demonstrating their strong potential for emission reduction.
Compared with the western region, the transportation sector in Fujian province gradually takes up a large proportion of carbon emissions, which is related to the construction of a dense road network and the frequent residents travel of residents. On the contrary, the CO2 emission from the housing sector in the western region is prominent due to the heating demand. The CO2 emissions of the relevant sectors of the electricity, heat, and gas production and supply are relatively high [50].
5.2.4. Effect of Population Urbanization and Consumption Pattern
Shigetomi [51] analyzed the impact of the DHCEs on 47 prefectures in Japan and proposed that population growth is a key influencing factor. Many scholars have indicated that population is crucial in the growth of the DHCEs in the urban and rural areas of China [52]. However, studies in Guangdong province [53] and Guizhou province [54] including Fujian province, have recently shown that the impact of consumer expenditures and patterns has gradually exceeded the size of the population, thus becoming a crucial driving force to promote the urban and rural DHCEs. The difference is that the impact of population size on Guangdong province follows per capita consumption expenditure, while its impact on Fujian province is already at a relatively low level. This finding is relevant to the continuous surge in population in Guangdong province, and the restraining effect of Fujian province considering energy consumption intensity is observed. In addition, Zha [55] indicated that energy intensity and population contribute more to the decline of urban DHCEs than rural areas, which is similar to Fujian province.
Wang and Yang [44] reveal that rather than population, energy intensity, and income, consumption structure has become the major influencing factor of the urban and rural IHCEs of China, which is the same as that of Fujian province. They also indicated that large differences in urban and rural lifestyles lead to variations in the IHCEs. Cao [32] represents that the urbanization level in China promoted the growth of the HCEs, in which urban households played a more substantial role than rural households. Similarly, the absolute value of the positive effect of urbanization on the urban areas in Fujian province is larger than the negative effect of rural areas in this study. Comparisons between provinces are not performed because of the limited research on the analysis of the IHCEs influencing factors from urban and rural areas.
6. Conclusions and Implications
This study quantitatively analyzes the trends, characteristics, and influencing factors of direct and indirect carbon emissions from the household consumption of urban and rural residents and compares the results with previous studies. The major conclusions are presented as follows.
- (1)
- The DHCEs, IHCEs, and total HCEs in Fujian province were increasing from 2006 to 2018. The urban HCEs accounted for approximately two-thirds of the total HCEs, and the HCEs are dominated by the IHCEs (over 65%) The gap between urban and rural is narrowing in the DHCEs and per capita HCEs. In 2017, approximately 75% of urban per capita HCEs came from the IHCEs, while the per capita IHCEs occupation exceeded the DHCEs in rural areas.
- (2)
- The direct energy consumption structure of urban and rural residents has gradually become efficient and diversified. The consumption structure has transformed from “clothing, housing, and use” to “travel, entertainment, and health care”. The major sectors of urban and rural IHCEs are food, transportation, and housing.
- (3)
- Per capita consumption expenditure is the largest positive effect of DHCEs and the IHCEs for urban and rural HCEs in Fujian province. The most negative effect on the DHCEs and IHCEs is energy consumption intensity and carbon emission intensity, respectively. The restraining effect of the DHCEs in rural areas is larger than the positive effect of urban areas with the advancement of urbanization, while the positive impact of the urban IHCEs is larger than that in rural areas. Thus, urbanization has negative and positive effects on the overall DHCEs and IHCEs, respectively. The population has a positive impact on the DHCEs and IHCEs in urban and rural areas.
- (4)
- The trend of the HCEs in Fujian province is similar to China and most regions. However, regional differences in the energy structure of the DHCEs between north and south are found. The key sectors of the IHCEs are also different in the eastern and western regions. The influencing factors of the HCEs vary among regions.
Overall, urban and rural areas have similarities and differences in emission characteristics and influencing factors. Therefore, these areas must take “common but differentiated” emission reduction responsibilities. The results of the characteristics of urban and rural HCEs reveal that the government must guide consumers in choosing clean energy through energy plans and policies, especially the energy use in rural areas. Meanwhile, improving energy efficiency in the housing sector will continue to be an effective measure to reduce carbon emissions. Encouraging residents to take public transportation and develop more environmentally friendly travel habits will help reduce carbon emissions from urban and rural areas. The decomposition results of influencing factors indicate that the per capita consumption expenditure has the largest positive effect, and its impact on urban areas is higher than that on rural areas. Therefore, the government should continue to focus on the low-carbon transformation of consumption patterns of urban and rural residents, extensively guide residents to choose green and low-carbon consumption patterns, reduce the proportion of high-intensity commodity consumption, and choose clean energy and energy-saving appliances, especially urban households. Simultaneously, urbanization increasingly promotes the migration of rural residents to urban areas. The government should promote the sharing of resources and energy by urban and rural residents to achieve an equitable distribution of resources and reduce the HCEs effectively.
Author Contributions
J.C.: conceptualization, methodology, data curation, visualization, writing—original draft. Y.L.: investigation, methodology, data curation, formal analysis, visualization, writing—review and editing. X.W.: data curation, visualization, writing—review and editing. B.M.: formal analysis, writing—review and editing. L.P.: conceptualization, supervision, writing—review and editing, funding acquisition. All authors have read and agreed to the published version of the manuscript.
Funding
This work was supported by Social Science Foundation of Fujian Province, China (Grant No. FJ2020B031).
Institutional Review Board Statement
Not applicable.
Informed Consent Statement
Not applicable.
Data Availability Statement
All data generated or analyzed during this study are included in this published article.
Acknowledgments
The authors also appreciate the editor and anonymous reviewers for their helpful and constructive comments.
Conflicts of Interest
The authors declare no conflict of interest.
Abbreviations
| HCEs | household carbon emissions |
| DHCEs | direct household carbon emissions |
| IHCEs | indirect household carbon emissions |
| LMDI | logarithmic mean divisia index |
| SDA | structural decomposition analysis |
Appendix A. Categories of Household Consumption and Related Industries
| Consumption Categories | Related Industries |
| Food | Agriculture, forestry, animal husbandry and fishery; Food manufacturing; Alcoholic beverages and refined tea manufacturing; Tobacco; |
| Clothing | Textile; Clothing accessories; Leather, fur, shoes, etc.; |
| Housing | Construction; Production and supply of electricity, heat, gas, and water; Non-metallic mineral products; Petroleum processing coking and nuclear fuel processing; |
| Household equipment and supplies | Wood processing and wood, bamboo, rattan, palm, and grass products; Furniture manufacturing; Electrical machinery and equipment manufacturing; Metal products; Metal smelting and calendaring processing; |
| Transportation and communication | Transport, storage and post; General, special equipment manufacturing; Transportation equipment manufacturing; Computer, communications, and other electronic manufacturing; |
| Education and entertainment | Papermaking and paper products; Reproduction of printing and recording media; Culture, education and entertainment, arts and crafts, and sports goods manufacturing; Instrument manufacturing; |
| Medical care | Chemical raw materials and chemical products manufacturing; Pharmaceutical manufacturing; Chemical fiber manufacturing; Rubber and plastic products; |
| Other goods and services | Wholesale, retail trade and hotel, restaurants; Repair of metal products, machinery, and equipment; Comprehensive utilization of waste resources; Others. |
Appendix B. Summary of Parameters Related to Fossil Fuels
| Energy Resource | Low Calorific Value (kJ/kg or kJ/m3) | Carbon Content (tC/TJ) | Oxidation Ratio | CO2 Conversion Factor | Emissions Coefficient (kg/CO2/kg) |
| Coal | 20,908 | 26.37 | 0.94 | 3.667 | 1.9003 |
| Coke | 28,435 | 29.42 | 0.93 | 3.667 | 2.8527 |
| Raw petroleum | 41,816 | 20.08 | 0.98 | 3.667 | 3.0172 |
| Gasoline | 43,070 | 18.9 | 0.98 | 3.667 | 2.9251 |
| Kerosene | 43,070 | 19.6 | 0.98 | 3.667 | 3.0334 |
| Diesel | 42,652 | 20.2 | 0.98 | 3.667 | 3.0959 |
| Fuel oil | 41,816 | 21.1 | 0.98 | 3.667 | 3.1705 |
| Liquefied petroleum gas | 50,179 | 17.2 | 0.98 | 3.667 | 3.1013 |
| Natural gas | 38,931 | 15.32 | 0.99 | 3.667 | 2.1650 |
References
- Tan, X.; Lin, S.; Liu, Y.; Xie, B. Has the inter-regional transmission expansion promoted the low-carbon transition of China’s power sector? Comput. Ind. Eng. 2022, 168, 108059. [Google Scholar] [CrossRef]
- Hanmer, C.; Wilson, C.; Edelenbosch, O.; van Vuuren, D. Translating Global Integrated Assessment Model Output into Lifestyle Change Pathways at the Country and Household Level. Energies 2022, 15, 1650. [Google Scholar] [CrossRef]
- Verma, P.; Kumari, T.; Raghubanshi, A.S. Energy emissions, consumption and impact of urban households: A review. Renew. Sustain. Energy Rev. 2021, 147, 111210. [Google Scholar] [CrossRef]
- Bin, S.; Dowlatabadi, H. Consumer lifestyle approach to US energy use and the related CO2 emissions. Energy Policy 2005, 33, 197–208. [Google Scholar] [CrossRef]
- Zhu, Q.; Peng, X.; Wu, K. Calculation and decomposition of indirect carbon emissions from residential consumption in China based on the input–output model. Energy Policy 2012, 48, 618–626. [Google Scholar] [CrossRef]
- Jiang, L.; Ding, B.; Shi, X.; Li, C.; Chen, Y. Household energy consumption patterns and carbon emissions for the megacities—Evidence from Guangzhou, China. Energies 2022, 15, 2731. [Google Scholar] [CrossRef]
- Zhang, J.; Li, F.; Sun, M.; Sun, S.; Wang, H.; Zheng, P.; Wang, R. Household consumption characteristics and energy-related carbon emissions estimation at the community scale: A study of Zengcheng, China. Clean. Responsible Consum. 2021, 2, 100016. [Google Scholar] [CrossRef]
- Chen, G.; Wu, X.; Guo, J.; Meng, J.; Li, C. Global overview for energy use of the world economy: Household-consumption-based accounting based on the world input-output database (WIOD). Energy Econ. 2019, 81, 835–847. [Google Scholar] [CrossRef]
- Ivanova, D.; Büchs, M. Household Sharing for Carbon and Energy Reductions: The Case of EU Countries. Energies 2020, 13, 1909. [Google Scholar] [CrossRef] [Green Version]
- Pachauri, S.; Spreng, D. Direct and indirect energy requirements of households in India. Energy Policy 2002, 30, 511–523. [Google Scholar] [CrossRef]
- Nansai, K.; Kagawa, S.; Kondo, Y.; Suh, S.; Nakajima, K.; Inaba, R.; Oshita, Y.; Morimoto, T.; Kawashima, K.; Terakawa, T.; et al. Characterization of economic requirements for a “Carbon-Debt-Free Country”. Environ. Sci. Technol. 2012, 46, 155–163. [Google Scholar] [CrossRef] [PubMed]
- Hertwich, E.; Peters, G. Carbon footprint of nations: A global, trade-linked analysis. Environ. Sci. Technol. 2009, 43, 6414–6420. [Google Scholar] [CrossRef] [PubMed] [Green Version]
- Liu, L.; Wu, G.; Wang, J.; Wei, Y. China’s carbon emissions from urban and rural households during 1992–2007. J. Clean. Prod. 2011, 19, 1754–1762. [Google Scholar] [CrossRef]
- Feng, W.; Cai, B.; Zhang, B. A Bite of China: Food consumption and carbon emission from 1992 to 2007. China Econ. Rev. 2020, 59, 100949. [Google Scholar] [CrossRef]
- Chen, C.; Liu, G.; Meng, F.; Hao, Y.; Zhang, Y.; Casazza, M. Energy consumption and carbon footprint accounting of urban and rural residents in Beijing through Consumer Lifestyle Approach. Ecol. Indic. 2019, 98, 575–586. [Google Scholar] [CrossRef]
- Anser, M.K.; Alharthi, M.; Aziz, B.; Wasim, S. Impact of urbanization, economic growth, and population size on residential carbon emissions in the SAARC countries. Clean Technol. Environ. Policy 2020, 22, 923–936. [Google Scholar] [CrossRef]
- Allinson, D.; Irvine, K.N.; Edmondson, J.L.; Tiwary, A.; Hill, G.; Morris, J.; Morris, J.; Bell, M.; Davies, Z.; Firth, S.K.; et al. Measurement and analysis of household carbon: The case of a UK city. Appl. Energy 2016, 164, 871–881. [Google Scholar] [CrossRef] [Green Version]
- Long, Y.; Yoshida, Y.; Dong, L. Exploring the indirect household carbon emissions by source: Analysis on 49 Japanese cities. J. Clean. Prod. 2017, 167, 571–581. [Google Scholar] [CrossRef]
- Debone, D.; Leite, V.P.; Miraglia, S.G.E.K. Modelling approach for carbon emissions, energy consumption and economic growth: A systematic review. Urban Clim. 2021, 37, 100849. [Google Scholar] [CrossRef]
- Wei, Y.; Liu, L.; Fan, Y.; Wu, G. The impact of lifestyle on energy use and CO2 emission: An empirical analysis of China’s residents. Energy Policy 2007, 35, 247–257. [Google Scholar] [CrossRef]
- Zheng, X.; Wei, C.; Qin, P.; Guo, J.; Yu, Y.; Song, F.; Chen, Z. Characteristics of residential energy consumption in China: Findings from a household survey. Energy Policy 2014, 75, 126–135. [Google Scholar] [CrossRef]
- Zhang, C.; Cao, X.; Ramaswami, A. A novel analysis of consumption-based carbon footprints in China: Unpacking the effects of urban settlement and rural-to-urban migration. Glob. Environ. Chang. 2016, 39, 285–293. [Google Scholar] [CrossRef]
- Li, C.; Ye, K.; Mawusi, S.; Zhang, W.; Xu, Y.; Xu, J.; Zhou, W.; Li, J.; Jiao, M.; Shrestha, P.; et al. A 24-h real-time emissions assessment of 41 uncontrolled household raw coal combustion stoves in four provinces of Northern China. Atmos. Environ. 2020, 235, 117588. [Google Scholar] [CrossRef]
- Niu, S.; Li, Z.; Qiu, X.; Dai, R.; Wang, X.; Qiang, W.; Hong, Z. Measurement of effective energy consumption in China’s rural household sector and policy implication. Energy Policy 2019, 128, 553–564. [Google Scholar] [CrossRef]
- Yao, C.; Chen, C.; Li, M. Analysis of rural residential energy consumption and corresponding carbon emissions in China. Energy Policy 2012, 41, 445–450. [Google Scholar] [CrossRef]
- Hubacek, K.; Feng, K.; Chen, B. Changing lifestyles towards a low carbon economy: An IPAT analysis for China. Energies 2012, 5, 22–31. [Google Scholar] [CrossRef]
- Zhang, X.; Luo, L.; Skitmore, M. Household carbon emission research: An analytical review of measurement, influencing factors and mitigation prospects. J. Clean. Prod. 2015, 103, 873–883. [Google Scholar] [CrossRef] [Green Version]
- Wang, Z.; Yin, F.; Zhang, Y.; Zhang, X. An empirical research on the influencing factors of regional CO2 emissions: Evidence from Beijing city, China. Appl. Energy 2012, 100, 277–284. [Google Scholar] [CrossRef]
- Meng, F.; Liu, G.; Yang, Z.; Hao, Y.; Zhang, Y.; Su, M.; Ulgiati, S. Structural analysis of embodied greenhouse gas emissions from key urban materials: A case study of Xiamen City, China. J. Clean. Prod. 2017, 163, 212–223. [Google Scholar] [CrossRef]
- Liu, J.; Murshed, M.; Chen, F.; Shahbaz, M.; Kirikkaleli, D.; Khan, Z. An empirical analysis of the household consumption-induced carbon emissions in China. Sustain. Prod. Consum. 2021, 26, 943–957. [Google Scholar] [CrossRef]
- Rong, P.; Zhang, Y.; Qin, Y.; Liu, G.; Liu, R. Spatial differentiation of carbon emissions from residential energy consumption: A case study in Kaifeng, China. J. Environ. Manag. 2020, 271, 110895. [Google Scholar] [CrossRef]
- Cao, Q.; Kang, W.; Xu, S.; Sajid, M.J.; Cao, M. Estimation and decomposition analysis of carbon emissions from the entire production cycle for Chinese household consumption. J. Environ. Manag. 2019, 247, 525–537. [Google Scholar] [CrossRef] [PubMed]
- Zhao, P.; Zhang, M. The impact of urbanisation on energy consumption: A 30-year review in China. Urban Clim. 2018, 24, 940–953. [Google Scholar] [CrossRef]
- Li, Y.; Zhao, R.; Liu, T.; Zhao, J. Does urbanization lead to more direct and indirect household carbon dioxide emissions? Evidence from China during 1996–2012. J. Clean. Prod. 2015, 102, 103–114. [Google Scholar] [CrossRef]
- Fan, J.; Zhang, Y.; Wang, B. The impact of urbanization on residential energy consumption in China: An aggregated and disaggregated analysis. Renew. Sustain. Energy Rev. 2017, 75, 220–233. [Google Scholar] [CrossRef]
- Shi, Y.; Han, B.; Han, L.; Wei, Z. Uncovering the national and regional household carbon emissions in China using temporal and spatial decomposition analysis models. J. Clean. Prod. 2019, 232, 966–979. [Google Scholar] [CrossRef]
- Chen, G.; Zhu, Y.; Wiedmann, T.; Yao, L.; Xu, L.; Wang, Y. Urban-rural disparities of household energy requirements and influence factors in China: Classification tree models. Appl. Energy 2019, 250, 1321–1335. [Google Scholar] [CrossRef]
- Feng, Z.; Zou, L.; Wei, Y. The impact of household consumption on energy use and CO2 emissions in China. Energy 2011, 36, 656–670. [Google Scholar] [CrossRef]
- Wang, S.; Sun, S.; Zhao, E.; Wang, S. Urban and rural differences with regional assessment of household energy consumption in China. Energy 2021, 232, 121091. [Google Scholar] [CrossRef]
- Liu, X.; Wang, X.; Song, J.; Wang, H.; Wang, S. Indirect carbon emissions of urban households in China: Patterns, determinants and inequality. J. Clean. Prod. 2019, 241, 118335. [Google Scholar] [CrossRef]
- Xia, Y.; Wang, H.; Liu, W. The indirect carbon emission from household consumption in China between 1995–2009 and 2010–2030: A decomposition and prediction analysis. Comput. Ind. Eng. 2019, 128, 264–276. [Google Scholar] [CrossRef]
- Song, C.; Zhao, T.; Wang, J. Analyzing driving forces of China’s carbon emissions from 1997 to 2040 and the potential emission reduction path: Through decomposition and scenario analysis. Clean Technol. Environ. Policy 2022, 24, 1219–1240. [Google Scholar] [CrossRef] [PubMed]
- Zhang, J.; Yu, B.; Wei, Y. Heterogeneous impacts of households on carbon dioxide emissions in Chinese provinces. Appl. Energy 2018, 229, 236–252. [Google Scholar] [CrossRef]
- Wang, Z.; Yang, L. Indirect carbon emissions in household consumption: Evidence from the urban and rural area in China. J. Clean. Prod. 2014, 78, 94–103. [Google Scholar] [CrossRef]
- Fan, J.; Liao, H.; Liang, Q.; Tatano, H.; Liu, C.; Wei, Y. Residential carbon emission evolutions in urban–rural divided China: An end-use and behavior analysis. Appl. Energy 2013, 101, 323–332. [Google Scholar] [CrossRef]
- Morales-Máximo, M.; Rutiaga-Quiñones, J.G.; Masera, O.; Ruiz-García, V.M. Briquettes from Pinus spp. residues: Energy savings and emissions mitigation in the rural Sector. Energies 2022, 15, 3419. [Google Scholar] [CrossRef]
- Guo, J.; Wu, S.; Hu, J.; Wei, C. Modeling energy intensity of residential space heating. Energy Effic. 2019, 12, 921–931. [Google Scholar] [CrossRef]
- Wu, S.; Zheng, X.; You, C.; Wei, C. Household energy consumption in rural China: Historical development, present pattern and policy implication. J. Clean. Prod. 2019, 211, 981–991. [Google Scholar] [CrossRef]
- Ding, Q.; Cai, W.; Wang, C.; Sanwal, M. The relationships between household consumption activities and energy consumption in China—An input-output analysis from the lifestyle perspective. Appl. Energy 2017, 207, 520–532. [Google Scholar] [CrossRef]
- Wang, X. Study on the Carbon Emission from Residential Living Consumption and Influencing Factors in Western China; Yunnan University: Kunming, China, 2017. [Google Scholar]
- Shigetomi, Y.; Matsumoto, K.; Ogawa, Y.; Shiraki, H.; Yamamoto, Y.; Ochi, Y.; Ehara, T. Driving forces underlying sub-national carbon dioxide emissions within the household sector and implications for the Paris Agreement targets in Japan. Appl. Energy 2018, 228, 2321–2332. [Google Scholar] [CrossRef]
- Ren, W.; Geng, Y.; Xue, B.; Fujita, T.; Ma, Z.; Jiang, P. Pursuing co-benefits in China’s old industrial base: A case of Shenyang. Urban Clim. 2012, 1, 55–64. [Google Scholar] [CrossRef]
- Xie, Z. Study on Calculation, Prediction and Evaluation of Carbon Emissions from Residens’ Consumption in Guangdong Province; South China University of Technology: Guangzhou, China, 2018. [Google Scholar]
- Li, X. Analysis of carbon emission from direct household energy consumption in Guizhou Province and its influencing factors. Environ. Sci. Technol. 2018, 41, 184–191. (In Chinese) [Google Scholar] [CrossRef]
- Zha, D.; Zhou, D.; Zhou, P. Driving forces of residential CO2 emissions in urban and rural China: An index decomposition analysis. Energy Policy 2010, 38, 3377–3383. [Google Scholar] [CrossRef]
Publisher’s Note: MDPI stays neutral with regard to jurisdictional claims in published maps and institutional affiliations. |
© 2022 by the authors. Licensee MDPI, Basel, Switzerland. This article is an open access article distributed under the terms and conditions of the Creative Commons Attribution (CC BY) license (https://creativecommons.org/licenses/by/4.0/).