Article

Real-Time Charging Scheduling and Optimization of Electric Buses in a Depot

1
MOBI-EPOWERS Research Group, ETEC Department, Vrije Universiteit Brussel (VUB), Pleinlaan 2, 1050 Brussel, Belgium
2
Flanders Make, Gaston Geenslaan 8, 3001 Heverlee, Belgium
3
Products Innovation & Systems Verification (PI&SV) Team, Powerdale (PWD), Witte Patersstraat 4, 1040 Brussel, Belgium
*
Author to whom correspondence should be addressed.
Energies 2022, 15(14), 5023; https://doi.org/10.3390/en15145023
Submission received: 31 May 2022 / Revised: 5 July 2022 / Accepted: 7 July 2022 / Published: 9 July 2022
(This article belongs to the Special Issue Sustainable Public Transport)

Abstract

:
To improve the air quality in urban areas, diesel buses are getting replaced by battery electric buses (BEBs). This conversion introduces several challenges, such as the proper control of the charging process and a reduction in the operational costs, which can be addressed by introducing smart charging concepts for BEB fleets. Therefore, this paper proposes a real-time scheduling and optimization (RTSO) algorithm for the charging of multiple BEBs in a depot. The algorithm assigns a variable charging current to the different time slots the charging process of each BEB is divided to provide an optimal charging schedule that minimizes the charging cost, while satisfying the power limitations of the distribution network and maintaining the operation schedule of the BEBs. A genetic algorithm is used to solve the formulated cost function in real time. Several charging scenarios are tested in simulation, which show that a reduction in the charging cost up to 10% can be obtained under a dynamic electricity price scheme. Furthermore, the RTSO is implemented in a high-level charging management system, a new feature required to enable smart charging in practice, to test the developed algorithm with existing charging infrastructure. The experimental validation of the RTSO algorithm has proven the proper operation of the entire system.

1. Introduction

In Europe, almost a quarter of the greenhouse gas (GHG) emissions can be attributed to road transport. Electrification of this sector plays an important role in reducing these emissions and reaching the targets set by the European Commission, i.e., a reduction in GHG emissions with 60% by 2050 [1]. As a result, public transport operators (PTOs) of European cities are looking at battery electric buses (BEBs) to replace their current diesel fleet [2]. This transition however presents several challenges which must be overcome, such as the rescheduling of the vehicle operations due to the limited range of BEBs, reducing the total cost of ownership (TCO) and improving the power quality [3].
Looking at operational feasibility, BEBs require charging at regular time intervals. The most prominent charging concepts are depot charging, where BEBs are charged when they are not in operation (e.g., overnight) and opportunity charging, where BEBs are charged in several minutes at bus stops or at the end stations of their route. Depending on the existing bus routes, PTOs must investigate which charging concept is most suited and reliable for their specifications. Additionally, a vehicle scheduling problem emerges, where the aim is to optimally allocate the BEBs on the routes to accomplish the timetable, while minimizing the fleet size, the number of chargers and the total operational costs, and to accordingly size the battery capacity of the BEBs and the charging power rate of the charging infrastructure. This problem was intensively studied in [4,5,6,7], but is not given further consideration in this research. BEBs also have a higher total cost of ownership (TCO) than diesel buses. Jefferies et al. [8] and Lajunen [9] both performed a TCO analysis. They show that the TCO of BEBs is 15–30% higher than their diesel counterpart. The highest share is related to the capital costs of the vehicle and the battery, but also the operational cost which is composed of the maintenance, the electricity and the staff costs plays an important role. Another challenge of introducing BEB fleets in cities is the impact charging has on the local distribution network. Mohamed et al. [10] investigated the impact of the different charging concepts on the grid and concluded that depot charging is the best configuration.
Depot charging currently stills happens in an uncoordinated way, where BEBs are charged with the maximum allowed power from the moment they arrive back at the depot until they are fully charged. However, it has the advantage that smart charging can be introduced. BEBs are available in the depot for a long time and so the charging process can be managed in a way that is beneficial for the PTO and the distribution network operator (DSO). Furthermore, because of the increasing amount of renewable energy resources (RERs) and their contribution in the electricity mix, the electricity price will become variable in the near future, especially for industrial consumers such as PTOs [11]. This leaves room to reduce the operational costs of BEBs. Moreover, RERs such as photovoltaic panels can even be installed at the depot to use locally generated energy to charge BEBs.
Because of these advantages, scheduling of the charging process of BEBs at depots recently gained interest. In [12], the authors used a mathematical model to determine an optimal charging plan for a fleet of BEBs where the goal is to minimize the energy cost of the charging station based on a 3-stage time-of-use (TOU) rate schedule. Their results show that the controlled charging model can sharply reduce the charging station energy cost. In [13], the authors also investigate optimal charging for BEBs to achieve minimum operating cost for the bus company considering a TOU electricity price. They use a wavelet neural network to predict the power consumption and observed a reduction of approximately 10% in charging costs. Raab et al. [14] developed an enhanced charging strategy, based a mixed-integer linear programming (MILP), to integrate a BEB fleet into the energy management of a power plant portfolio. They adjusted the charging schedules in day-ahead and intraday operations to efficiently supply the energy demand for the fleet within a multi-period optimization process. The results show that the proposed methodology is capable of fully integrating BEB fleets in the operation of the power plant portfolio and providing economic benefits. In [15], the authors proposed a bi-level model where the upper level is a vehicle scheduling problem to minimize the operating cost and the carbon emissions, while the lower level is a charging scheduling, based on dynamic programming, to minimize the charging cost. They managed to reduce the charging cost by 8–13% compared to uncoordinated charging. The authors of [16] formulated a MILP model to develop a limited BEB charge scheduling algorithm for a depot equipped with photovoltaics (PV) and an energy storage system (ESS) to maximize the profit for the bus depot operator and minimize the overloading on the grid feeder. They conclude that the installation of PV and ESS together with their algorithm provides a complete charging solution for BEBs that generates revenue for the operator. Jahic et al. [17] developed a greedy and heuristic algorithm for the charging scheduling of large-scale bus depots in the city of Hamburg with the goal to minimize the peak load. They were able to reduce the peak demand and flatten the peak load at the bus depot within the range of 24–43%, depending on the covered scenario. Houbbadi et al. [18] introduced an optimal scheduling strategy using a non-linear programming technique to manage overnight charging of a BEB fleet aiming to minimize the battery aging cost in order to extend its lifetime. They concluded that with their strategy it is possible to use the battery packs for almost 20 years.
The aforementioned papers mainly use more conventional mathematical programming methods to show the benefits of optimally scheduling the charging process of BEBs. However, these methods can have long computation times which make them appropriate for day-ahead scheduling, but less suitable for solving real-time charging scheduling problems [19,20]. This is important to enable smart charging in real-world applications such as bus depots and is currently missing in the scientific literature. Some authors already addressed real-time scheduling, but they focused mainly on regular electric vehicles (EVs). One of the difficulties with real-time scheduling of regular EVs is that there is a big uncertainty about when they will arrive at a charging station, making it difficult to provide an optimal planning in terms of cost and grid impact [21]. BEBs used in public transportation drive following a detailed timetable which means it is approximately known when they will return to the depot and as a consequence when they can be charged. This strongly reduces the uncertainty factor and enables to propose a fully optimal charging scheduling where even near-future charging actions can be considered to satisfy the constraints for both bus and distribution network operator. Still, the research that was carried out for real-time charging scheduling of EVs gives a good overview on which optimization techniques can be used. In [22], the authors proposed an online optimal charging scheme for EVs that minimizes the total system energy cost and operates in a time-receding manner with the latest system information. The charging problem is solved with a distributed model predictive control and modified convex relaxation technique. Yao et al. [23] used a simple on–off strategy for EV charging scheduling, leading to the formulation of a computationally expensive binary optimization problem. To reduce the computational complexity, they developed a modified convex relaxation method which can be used in real time. However, using such convex relaxation techniques can lead to large errors which can result in non-optimal solutions [24]. Other researchers used learning-based techniques to implement real-time smart charging scheduling algorithms. Frendo et al. [25] proposed a data-driven approach to integrate a machine learning regression model in a smart charging algorithm. Their model was trained on a large historical dataset of charging processes to predict the power drawn by an EV over the course of the charging process. However, such a large real-world dataset is often not available and cannot be easily obtained. Therefore, in [26], the authors developed a deep reinforcement learning (RL)-based approach to determine an optimal strategy for a real-time charging scheduling problem which does not require any system model information. Wang et al. [27] also proposed a model-free RL method for charging station pricing and scheduling strategies that deal with time-varying continuous state and action spaces. In [28], the authors developed an online actor–critic-based smart charging algorithm to schedule EV charging and customized it to improve the computational efficiency at the cost of a less optimal charging schedule. Still, with RL-based techniques it is not easy to achieve a robust algorithm that can operate properly under a high versatility of charging conditions. Another type of optimization technique which has also been used for real-time smart charging scheduling are metaheuristics. In [29], the authors developed an improved grey wolf optimizer to solve a charging scheduling problem of EVs with short-term PV power production in real time and to reduce the electricity costs. Su et al. [30] proposed a rolling horizon scheduling approach based on a genetic algorithm (GA) which deals with the online optimal scheduling problem of aggregated EVs in the energy exchange market. Metaheuristics are able to find (near)-global solutions within a reasonable amount of time without the need of training data and can easily adapt to different conditions because they can explore a large search space at once [31,32,33].
Finally, the integration of the developed real-time algorithms with real-world charging infrastructure and their experimental validation is still lacking. This has only been covered in [34] for AC (slow) chargers but can only be used for regular EVs. For DC off-board chargers dedicated for BEBs, this has not been investigated yet.
Therefore, this paper proposes a real-time scheduling and optimization (RTSO) algorithm for BEB charging in a depot, aiming to minimize the charging cost for PTOs, while satisfying the power limitations of the distribution network and the energy requirements and timetable of each BEB. GA, a metaheuristic optimization technique, is used to solve the predetermined scheduling problem. This paper also considers charging with a variable charging rate, which is often neglected in the scientific literature. Finally, this paper also addresses the integration and validation of the developed RTSO algorithm, implemented in a high-level charging management system (HL-CMS), with existing charging infrastructure.
The remaining of the paper is organized as follows. Section 2 gives information about the high-level charging management system, an additional feature required for smart charging of BEBs. Section 3 describes the methodology of the RTSO algorithm, including the objective function and the constraints. In Section 4, the simulation and experimental results are shown and discussed. Finally, the main conclusions of the proposed algorithm are drawn in Section 5.

2. High-Level Charging Management System

A basic depot for BEBs typically consists of off-board chargers directly connected to the grid, where the built-in power electronic converter (PEC) converts the AC power from the grid side to DC power in order to charge the battery of the BEB, regardless of the charging interface (either pantograph or plug-in), as shown in Figure 1. A low-level controller operates the switches of the PEC to adjust the voltage and current level to what the BEB can accept. Still, the available charging points can only charge the BEBs in a conventional uncoordinated way.
To introduce smart charging concepts in the charging process an additional feature is required. This feature is a HL-CMS, which can be included in an internet-of-things (IoT) cloud-based monitoring platform and will be a crucial part of the next generation of charging infrastructures. It adds an additional control layer on top of the existing configuration. In the HL-CMS, smart charging algorithms, such as the developed RTSO algorithm in this paper, can be implemented to schedule an optimal charging plan for single or multiple charging points in terms of cost, peak load, battery ageing, etc. Therefore, the HL-CMS will need to gather information from the DSO about the real-time grid limitations and tariffs, and from the PTO about the BEB charging status and requirements. When the embedded smart algorithm has generated the charging schedules, it can be communicated with each charging point through the Open Charge Point Protocol (OCPP), a standard open protocol for communication between charging points and a central system. An overview of the complete BEB depot charging architecture, including the HL-CMS and the information flow between the different systems, is shown in Figure 1.

3. Methodology

3.1. Problem Formulation and Assumptions

One of the most important challenges for PTOs is to reduce the operation costs of its BEB fleet. This can be achieved by optimizing a depot charging scheduling problem in terms of the charging costs. The difficulty in solving such an optimization problem is that the charging process also involves other factors that need to be satisfied. BEBs operate following a detailed timetable, so their departure time from the depot should be maintained. Furthermore, the local distribution network cannot be overloaded as this could lead to high additional charges for the PTO. As charging an entire BEB fleet requires a power level in the range of MW, this implies that the BEBs cannot all charge at the same time and that the charging needs to be scheduled over a longer period. Finally, it is also important that the charging scheduling occurs in real time as BEBs can return to the depot later than expected or with less energy in their battery because of traffic and weather conditions.
This research starts from the assumption that the PTO operator already has a BEB fleet up and running, meaning that the entire planning on how to operate a BEB fleet has been carried out considering the energy consumption, that the BEB type (standard 12 m or articulated 18 m buses), the charging technology (conductive or wireless), the charging interface (pantograph, plug-in or ground-based), etc., are already fixed, that a detailed operation schedule of the BEBs exists, that the depot is already equipped with the necessary charging infrastructure and that the BEBs are properly positioned in the depot and connected to a charging system with enough charging power to cover the charging requirements. In fact, the proposed RTSO algorithm can be used for every BEB type that needs to be charged in the depot, regardless of the charging technology, the charging interface or the charging power. Information about the routes the BEBs covered before coming to the depot is neglected as this is insignificant information for charging scheduling algorithms. However, it is assumed that the BEBs are connected to the monitoring platform of the PTO to track valuable data of the BEBs in operation. This allows the PTO to accurately know the state of charge (SoC) of a BEB when it returns to the depot. The SoC is an important battery parameter as it indicates by how much a BEB should get charged to fulfil its next trip and is closely linked to the covered routes and the energy consumption of the BEB.
Furthermore, accurate real-time electricity pricing and short-term load forecasting, which are both essential in the deployment of urban smart grids, are considered. Real-time electricity pricing charges consumers with a price that varies with time based on the electricity generation in a particular time interval. With the increasing penetration of RERs into the distribution system, it is expected that such a pricing scheme will be implemented very soon. Short-term load forecasting is used to predict the energy requirements on an hourly basis based on forecasted data, weather conditions and, closely linked with that, availability of the RERs [35]. Load forecasting is especially important when the charging infrastructure is added to already existing networks, which are not designed to deal with the additional load that comes with BEB charging and which is often the case in cities.

3.2. Real-Time Scheduling and Optimization Algorithm

The proposed RTSO algorithm divides the charging time of each BEB into several smaller time slots and assigns a specific variable current level to each of these time slots, aiming to minimize the charging costs without violating the operation schedule or overloading the distribution network. The core of the RTSO algorithm is a GA, which is a metaheuristic optimization technique that belongs to the class of evolutionary or nature-inspired algorithms. It searches for an optimal solution based on reproduction and natural selection, in line with Darwin’s theory of evolution. It is adopted in this research because it has the ability to find (near) global optimal solutions. Since GA is population-based, it can explore and exploit the search space more effectively, escape local minima to find the best solution in a reasonable computation time and easily adapt to changing conditions. Furthermore, constraints can be handled in an easy and straightforward manner by using penalty functions [31].
Figure 2 shows the flowchart of how the RTSO algorithm works. When a BEB returns to the depot, the necessary information from the different stakeholders needs to be acquired to enable the RTSO to compute a charging current level profile. From the DSO, an accurate forecast of the grid limitation and the electricity price is required. This information is usually sent to the PTO on regularly basis (e.g., every 4 h). From the BEB itself, the SoC and the voltage of the battery pack should be acquired. Based on the remaining SoC, the type of BEB that returned to the depot and the operation schedule it has for the next hours or day, the PTO can provide the exact driving range and departure time of the BEB to the HL-CMS at the start of the charging process. Furthermore, based on the timetable, the PTO can also provide an estimation of the arrival time, the required driving range and the voltage level of BEBs that will return to the depot in the near future, together with their departure time, and include them already in the optimization process to avoid possible conflicts later on. With all these data, the RTSO computes a charging current profile in function of time for each BEB that needs charging. Then, the current level values are communicated with the specific charging point and the charging process is started or resumed. The charging information for each bus, i.e., how far the charging process has progressed, is remembered by the HL-CMS to use the updated charging requirements when a next BEB returns to the depot. This way, the scheduling of the BEBs happens in real time and makes the RTSO algorithm robust to BEBs that arrive later than expected due to unforeseen traffic conditions.

3.3. Objective Function

The GA will minimize a cost function that computes the total charging cost for all BEBs together as described in Equation (1). The decision variables in the GA are the current levels that the charger should send to the BEB during the different time slots the charging process is divided in. These time slots coincide with the electricity tariff and grid limitation forecast intervals, except for the first and the last time slot in case the arrival or the departure time lies within such an interval.
C charging , tot = i n I charging i , n V BEB i Δ t n   C electricity n
where C charging , tot   is   the total charging cost of the i BEBs that needs to be charged [EUR], I charging I , n is the current level with which BEB i is charged during the time slot n [A], V BEB i is the voltage of BEB i [V], Δ t n   is the length of the time slot n [h] and C electricity n is the price of the electricity during the time slot n [EUR/Wh].
Each decision variable is subject to some hard constraints, which means that they cannot be violated at any time because this will create negative effects for the stakeholders. When they are violated, a high penalty cost is applied to the cost function to exclude the solution from the optimization process. The hard constraints compel that the current level at time slot n cannot exceed the maximum current limit of the charging point, as expressed in Equation (2), that the sum of the current levels for BEBs i at time slot n cannot exceed the limit of the grid at that time slot, as expressed in Equation (3) and that the demanded energy by the PTO for BEB i needs to be satisfied, as expressed in Equation (4).
0     I charging i , n   I charging   point max
0   i I charging i , n   I grid   limitation n
( n I charging i , n Δ t n ) V BEB i     E demand i
where E demand i can be easily calculated by multiplying the required range with the average consumption of the BEB [kWh/km].
Furthermore, there is also a soft constraint applied to each decision variable, which can be violated if needed. When this happens, a smaller penalty cost, depending on how much the constraint is violated, is applied. This soft constraint declares that the GA should try to keep the current level above 60% of the maximum current of the charging point, as expressed in Equation (5). It is applied to enhance the efficiency of the charging process and the operation of the PEC because below approximately 60%, the efficiency of a PEC drops drastically, resulting in huge power losses.
I charging i , n     0 . 6   I charging   point max  
An additional constraint which says that the current cannot return to zero before the charging requirements are met is also applied. This is to prevent the charging process from getting interrupted without the BEB being completely charged.

3.4. Initial Population

A clever initialization of the GA population will decrease the chance that the algorithm does not find an optimal solution because the search space is reduced. However, it is still important to give the algorithm enough freedom to explore the search space. Accordingly, the initial population should contain many different individuals. Sets of decision variables, representing the different current levels I charging i , n with which a BEB will get charged, make up each individual. As a result, the total number of decision variables is the sum of the decision variables in each set, which equals the number of time slots that are assigned to the charging process of a specific BEB that requires charging. Since for this charging scheduling problem the required range, and thus the energy demand, for each BEB is known in advance, as it is an input to the RTSO algorithm, an initial population can be built where all sets and individuals already comply with the constraint given by Equation (4). Therefore, a function was developed that assigns a random value to each decision variable of each set, such that the sum of these random values equals the required energy demand of a specific BEB. For some sets, the decision variables are then ordered in descending order, ascending order or a combination of both, to imitate the behavior of the electricity tariff and grid limitation profile for small portions of the day. Finally, each individual is built up from a combination of these ordered and random sets, to constitute the initial population. Such an initial population allows the GA to quickly find some initial good solutions, while the randomness of the values ensures optimality at the end of the optimization process.

3.5. Parameters

The performance of the GA also greatly depends on several parameters. The population size, which specifies how many individuals there are in the population, cannot be too small because in this case only a small area of the search space will be explored. On the other hand, if the population is too big, the time to find the global solution will increase and the RTSO algorithm slows down. As presented in Table 1, the population size depends on the number of decision variables. If the number of decision variables increases because more BEBs return to the depot to get charged, or some BEBs require a longer charging time than others, the population size will also increase. This is needed to give the GA a larger search space and to find an optimal solution for every BEB that needs charging.
Other important parameters are the elite count, the crossover ratio and the mutation rate. These parameters affect how the next generation of the population is created. The elite count specifies the number of the best individuals that will survive the next generation. The crossover ratio determines how many individuals of the next generation, other than the elites, are produced by crossover, where the genes of two parent individuals are combined, and which are produced by mutation, where random changes to the individuals are applied. In general, crossover will be applied to the largest part of the population to exploit the good genes of the parent individuals, while mutation is used to prevent the GA from getting trapped in a local optimum. The mutation rate specifies how many of the decision variables of an individual are tweaked.
Finally, some stopping criteria can also be applied to end the GA when the maximum number of generations has been reached, or when there has been no significant improvement in the cost function for a number of iterations. Table 1 provides an overview of the values of these parameters used in this research. They have been determined by trial and error, as they are problem-specific, to ensure an acceptable solution and a reasonable computation time. A flowchart illustrating how the GA works is shown in Figure 3.

4. Results and Discussions

4.1. Simulation Results

To show the benefits of the RTSO algorithm, a case study where three BEBs are charged at the depot is examined. It is considered that the power supply of the charging equipment is shared with other loads in the depot or even a light-rail network, which means that it will not always be feasible to draw the maximum possible power from the distribution grid. The fluctuations in the available power for charging are based on the typical daily load profiles in Belgium. For the electricity prices, hourly data from the Belpex spot market are used, at which a fixed cost of 0.15 EUR/kWh, representing network cost and charges, has been added.
For the simulation, BEBs operating in Brussels Capital Region are considered. It concerns standard buses of the brand Bluebus with a length of 12 m. The average energy consumption of the BEBs is assumed to be 1.4 kWh/km [17]. They have a battery capacity of 272 kWh with a nominal voltage of 600 V [36]. Furthermore, it is assumed that the BEBs reach the depot with a SoC of 10%. The maximum power of the depot chargers is fixed at 100 kW which results in a maximum current of 118 A (considering a maximum operating voltage of 850 V, which is common for this type of off-board charger).

4.1.1. Overnight Charging at Depot

Overnight charging is crucial for BEBs because at the end of the day they will all return with an almost fully discharged battery. It has the advantage that during the nighttime, electricity prices and load demand are lower. Table 2 shows the charging specifications of three BEBs. It is assumed that two BEBs arrive back at the depot after the rush hours of the evening, while one remains in operation until midnight. Furthermore, it is assumed that all of them need to be charged with 252 kWh (which equals to 180 km of autonomy) to be able to operate the next day.
Figure 4 shows how the BEBs are charged overnight: (a) depicts the hourly changing electricity price, where it can be observed that the price drops throughout the night; (b) and (c) and (d) show the charging current of each BEB, respectively; and (e) represents the total charging current drawn from the distribution grid and the grid limitation. It can clearly be seen that by using the RTSO algorithm, the charging happens mostly during the time intervals with a low electricity price. This is to be expected since the objective of the algorithm is to minimize the charging cost for the PTO. In fact, in this scenario, the RTSO algorithm applies delayed charging, because the grid allows the maximum charging current to be drawn from it.
It can be noticed that for BEB2 (Figure 4c), there is a small peak at the start of the charging process. The RTSO algorithm initially set a higher current, but at the arrival of BEB3 at the depot, a new schedule is computed where the current is lower. This is due to the GA, which is stochastic and therefore only provides a near-optimal solution which can change every time the RTSO algorithm is run.
It is interesting to study how high the cost savings are by using the proposed RTSO algorithm compared with uncoordinated or uncontrolled charging for the same scenario. Because of the stochastic nature of the GA, every simulation will result in a slightly different cost. Therefore, 25 recurrences of the considered scenario were executed and averaged. The results are shown in Figure 5. First, it can clearly be observed that the charging cost is significantly lower when the BEBs are charged with the RTSO algorithm than in an uncoordinated way. With the RTSO algorithm, the average cost for each bus is EUR 42.29, EUR 43.53 and EUR 41.80, respectively (instead of EUR 46.66, EUR 47.59 and EUR 43.54). This means that for BEB 1 and 2, the cost reduction goes towards almost 10%. For BEB 3, which arrives back at the depot the latest, the reduction is still 4%. This clearly shows the benefits of charging with a smart RTSO algorithm for the entire BEB fleet. Secondly, it can be seen that the average cost for each BEB, which value is represented by the orange bar, lies close to the lower end of the black error bar. This illustrates that most of the solutions proposed by the RTSO algorithm are close to the optimal one. However, it should be noticed that the values of the cost reduction can differ depending on the charging specifications, as already shown in Figure 5 where the cost reduction ranges from 4% to 9.4%. Another parameter that can influence the reduction in the costs is the dynamic electricity pricing scheme itself. In a scenario where there is a larger difference between the highest and the lowest hourly electricity price, it is probably possible to achieve a higher cost reduction. This can be realized when a higher share of RERs enters the distribution network.

4.1.2. Charging at the Depot during the Day

Although BEBs are mainly charged overnight, it can happen that some of them also need to return to the depot during the day to get charged. This will be the case for buses that are used during the rush hours in the morning and need to be ready for the rush hours of the evening. Of course, this also depends on the on-board battery capacity of the bus, the length of the trajectory and the bus frequency. In the studied scenario, three buses are again considered for charging. The charging time is limited since the buses follow a schedule and are therefore only charged with 140 kWh (100 km autonomy). Their specifications are summarized in Table 3. Furthermore, it is assumed that there is a limitation of the current that can be drawn from the distribution grid because the total available power at the grid node is also shared with other loads in the depot.
In Figure 6, the results for charging BEBs during the day are shown. (e) now also depicts the current profile of uncoordinated charging to illustrate the difference between charging with and without the RTSO algorithm. It can be clearly noticed that uncoordinated charging violates the grid limitation while this is not the case for the proposed algorithm, since it allows one to control the DC current of the off-board charger (as illustrated in (b), (c) and (d)). Moreover, the fact that future charging actions are included satisfies both the grid limitations and the PTO requirements. Without, the current profile of BEB2 would show a peak around 14:00, when the electricity price is low, but it would be impossible to charge all three buses together without violating the limitation of the distribution grid. This shows the added value of the RTSO algorithm for both the PTO and the DSO. Compared with uncoordinated charging, there is no cost reduction in this scenario due to the heavy grid limitation that is imposed. Nevertheless, by satisfying the limitation, PTOs will not be charged an additional fee and may thus save money in this way.

4.2. Experimental Results

To verify how the RTSO algorithm behaves in a real-world charging scenario, experimental tests are performed on an existing charger. For practical reasons, they are executed with only one conventional EV (passenger car), instead of three BEBs as used in the simulations. However, the obtained experimental results remain relevant for charging BEBs in a depot because of the following reasons. First of all, it should be emphasized that a conventional EV generally has a lower battery capacity (<100 kWh) and voltage (<500 V) compared with a BEB and requires a lower charging power (<100 kW). This has an impact on the charging current and the charging time, but because battery degradation is not (yet) included in the RTSO algorithm, these different parameters do not change anything regarding its main functioning. The RTSO algorithm is still able to find an optimal charging schedule with these input parameters. Secondly, the main contribution of the experimental testing is to establish the communication between the HL-CMS and the charging infrastructure via OCPP to actually send the optimal charging profile, computed by the RTSO algorithm to the EV, and not to exactly reproduce the simulation results. Finally, and most importantly, an off-board charger, which directly provides DC current to the battery of the EV, is used for the experimental testing. This is the dedicated charging technology for BEBs, since they are not equipped with an on-board AC charger such as conventional EVs [37]. The off-board charger has a CCS Combo 2 connector which needs to be plugged in into the EV and which is also the standard charging connector for BEBs in depots. Furthermore, for both conventional EVs and BEBs the communication with the off-board charger is established using ISO 15118. Therefore, the term EV hereafter also refers to BEBs.
To be compatible with the HL-CMS, the developed RTSO algorithm is first translated from MATLAB to a Python-based framework running on a Linux operating system. The HL-CMS uses OCPP 1.6J to communicate with the charger. OCPP 1.6J allows the HL-CMS to initiate the control of the charger with a charging schedule using JSON over web sockets. The charging schedule is basically a list of time slots with their maximum charge power or current, and some values to specify the time period and recurrence of the schedule. There are three different types of charging profiles that can be sent using OCPP:
  • ChargePointMaxProfile, where the charger has one or more local charging profiles that limit the current to be shared by all connectors.
  • TxDefaultProfile, where the default schedules for new transactions are used as the charging profiles.
  • TxProfile, where the schedule constraints that apply to a transaction are determined by merging the ChargePointMaxProfile with the TxProfile or the TxDefaultProfile.
The HL-CMS uses TxProfile to send the charging schedule to the charger. The sequential information flow between the EV, the charging station and the HL-CMS is shown in Figure 7. When an EV (or BEB) has been connected to and authorized by the charger, the power is switched on and the charging of the EV starts. The communication between the EV and the charger happens via the standardized protocol ISO 15118. Next, the HL-CMS receives a start of transaction request and runs the embedded RTSO algorithm which computes the optimal charging profile. This profile is then sent back to the charger which accepts it and provides the charging current to the EV. Every time slot, this current gets updated. During charging, the optimal schedule can be updated when new information of the DSO becomes available. When the EV is fully charged, a disconnection request is sent to the charger which ends the charging, switches off the power and sends a request to stop the transaction to the HL-CMS.
The experimental test setup is depicted in Figure 8. The EV is not directly connected to the off-board charger with the CCS Combo 2 connector, but with a measurement unit in between. This device can measure the DC voltage of the EV’s battery, the DC charging current that is applied and also read the communication messages that are sent between the EV and the charger. This identifies the causes of charging failures. To enable smart charging via OCPP, an ethernet connection is established between the charger and the HL-CMS with the embedded RTSO algorithm. The details of the downscaled experimental setup are provided in Table 4.
Two identical tests are performed. As an input for the RTSO algorithm, a range of 180km and a charging time of 2 h are selected. A similar dynamic electricity tariff profile as for the overnight simulation scenario is used. To have enough decision variables during the optimization process, it is assumed that the tariff changes every 15 min instead of every hour as used in the simulations. The charger has a maximum current of 90 A. The results of the experimental tests are shown in Figure 9 in blue and orange, respectively.
The charging process is first started in an uncontrolled way, where the maximum current of 90 A is provided to the EV. After 150 s, smart charging with the HL-CMS begins. For a better perceptibility, the charging current is updated every minute instead of every 15 min. It can be noticed that the profiles sent by the HL-CMS have a similar behavior as in the simulation scenarios since both are proposed by the RTSO algorithm. This confirms the proper implementation of the RTSO and of the communication between the HL-CMS and the charger.
The charging status, which gives information about when the EV is ready to accept current, is also shown in Figure 9 in yellow. It can be observed that it takes approximately 30 s between the start of the communication between the EV and the charger, i.e., the Signal Level Attenuation Characterization (SLAC) phase, and the actual current demand from the charger by the EV. This is important information as it indicates the time the HL-CMS has to run the RTSO algorithm and schedule the charging session. In this particular test scenario with one EV, the RTSO algorithm (in Python, but with the same settings as provided in Table 1) managed to provide a solution within 10 s. This shows that the algorithm can also schedule the charging session of multiple vehicles within the connection time of an EV with the charging infrastructure.

5. Conclusions

The transition from diesel to battery electric buses brings several challenges with it. One of them is to efficiently charge the buses without affecting their operational schedule, violating grid limitations and avoiding load peaks at a minimal charging cost. To deal with this challenge, smart charging algorithms need to be applied to the charging process of BEBs in a depot. This requires the introduction of a HL-CMS, which adds an additional control layer to the charging infrastructure where algorithms can be implemented to control the charging rate in real time. This real-time implementation with variable charging rate for BEBs is currently lacking in scientific literature. Therefore, in this paper, an RTSO algorithm, based on a GA, is developed. It not only aims to minimize the charging cost for the PTO, but it also considers the constraints of the grid operator, the operation schedule of the BEBs and the efficiency of the charging process.
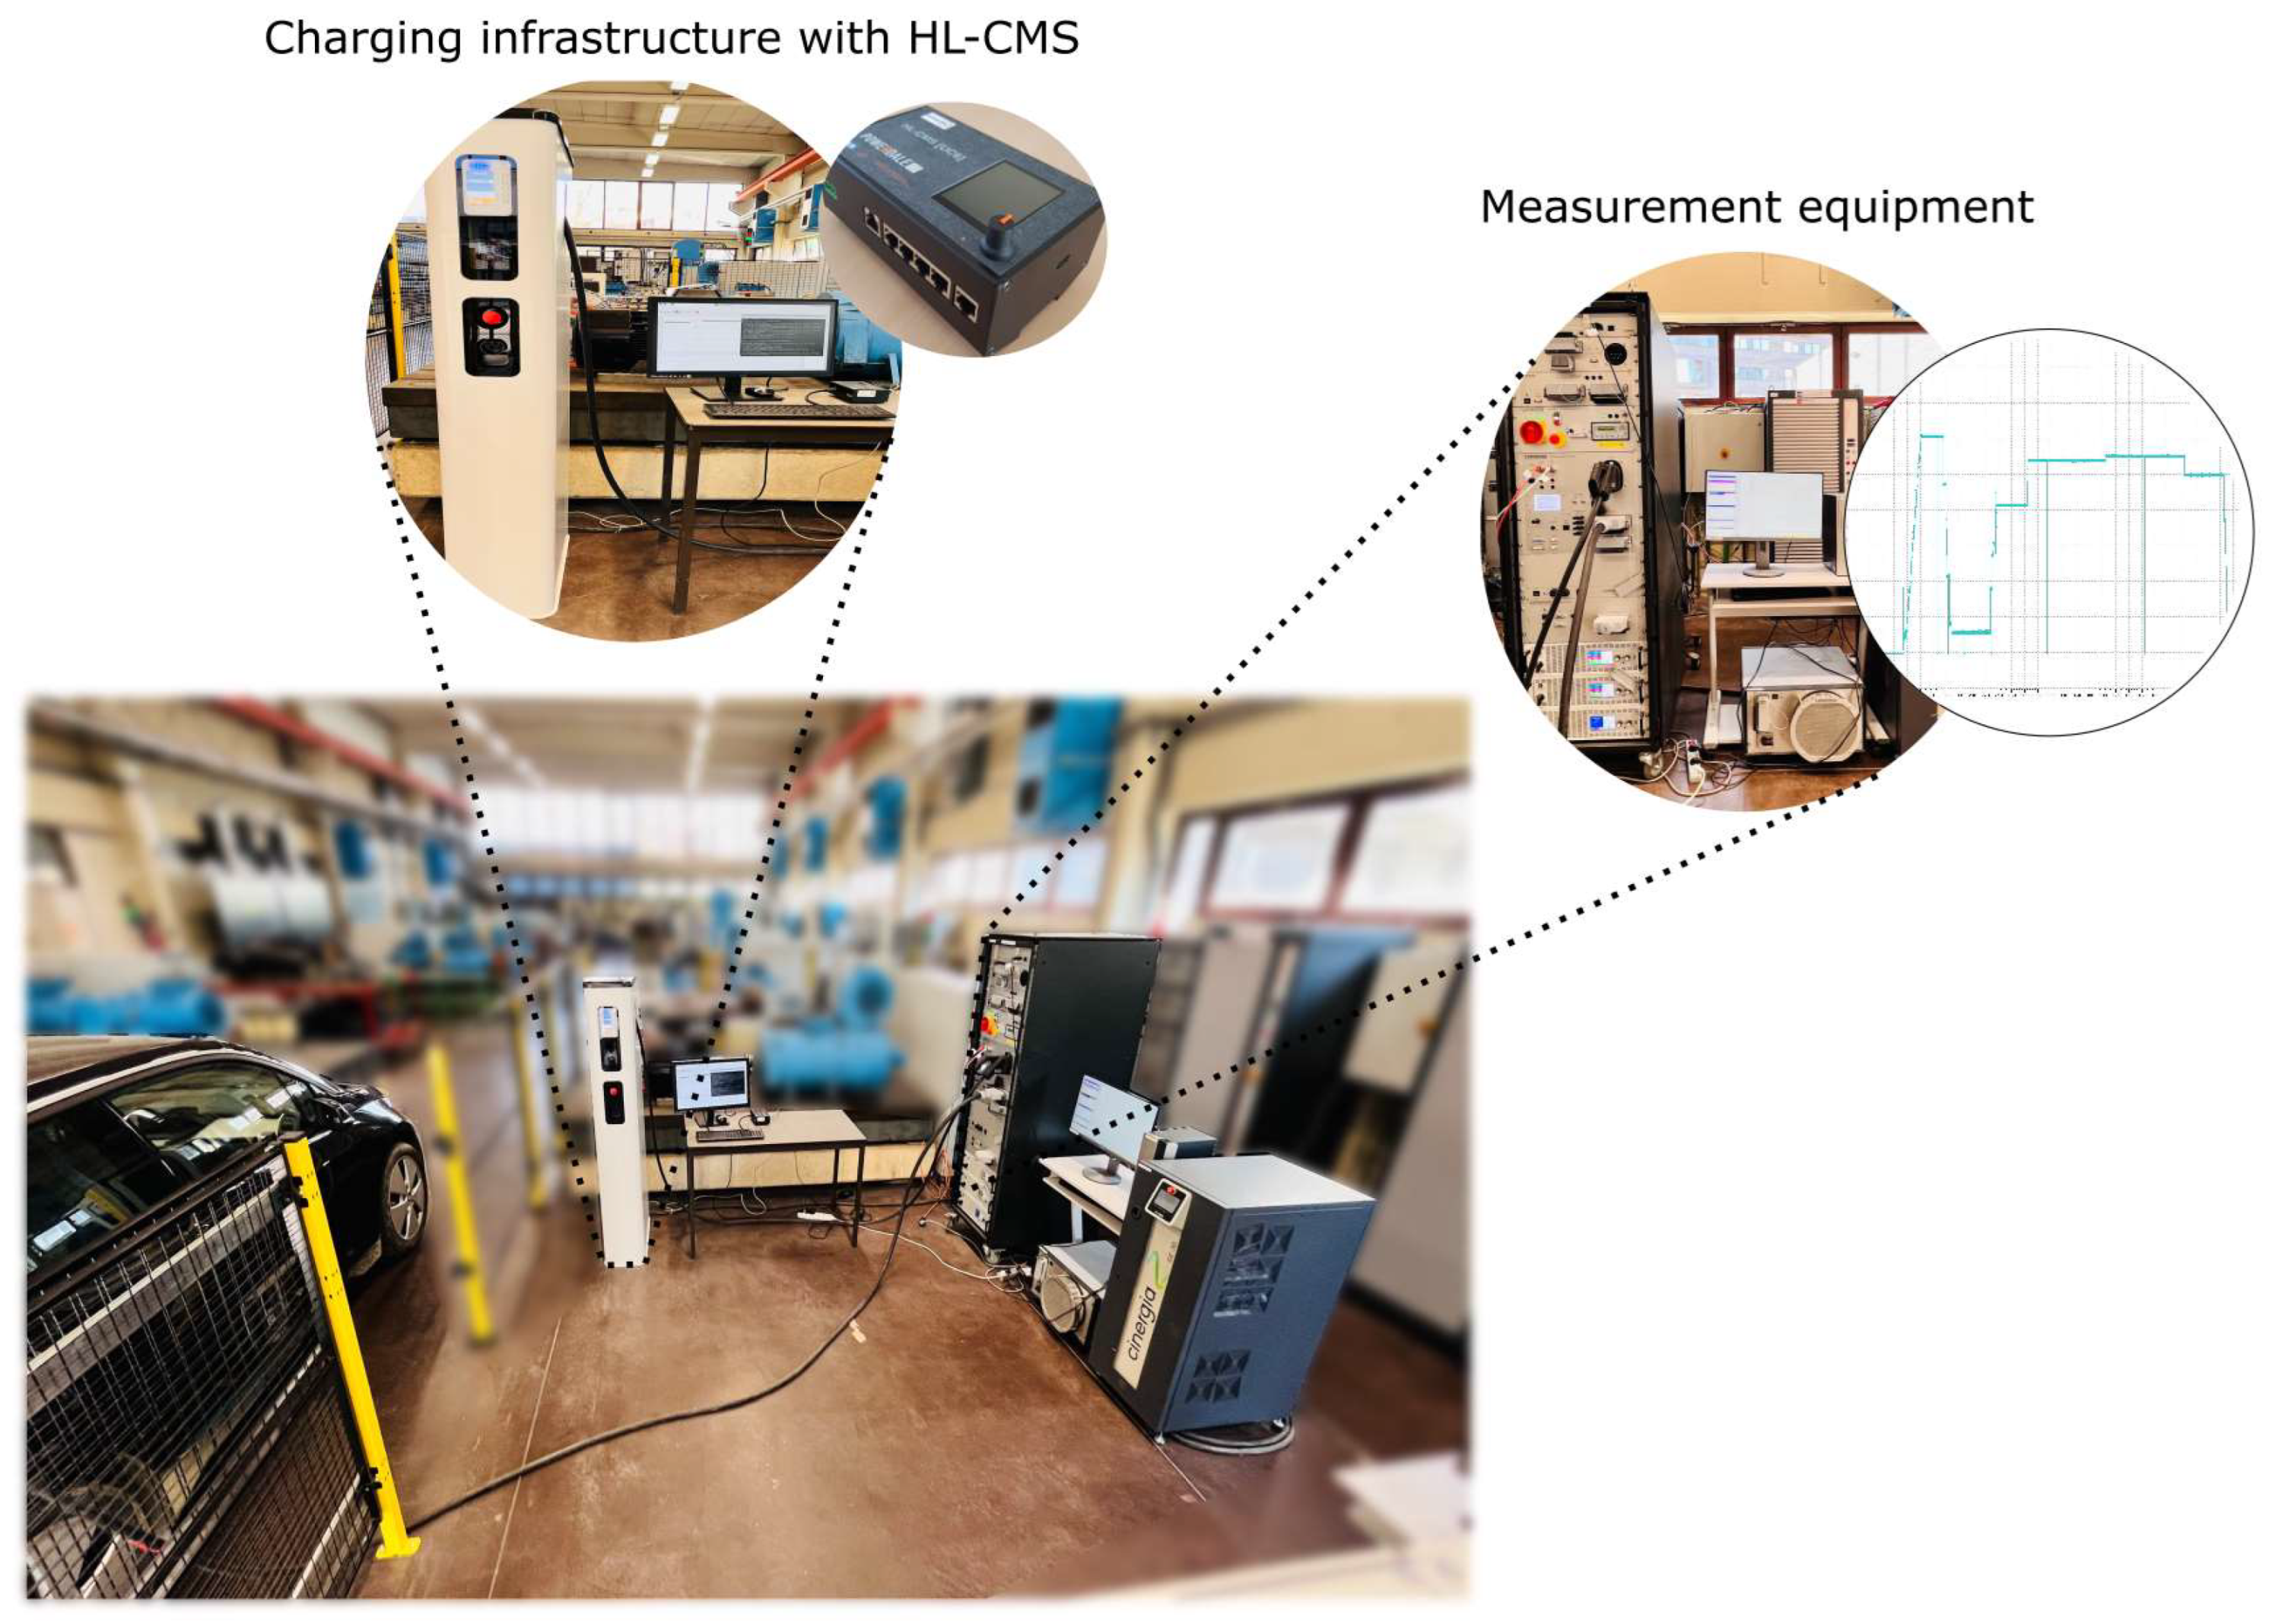
Several simulation scenarios were tested to validate the developed RTSO algorithm. For the considered scenarios, the RTSO algorithm managed to reduce the charging cost up to 9.4% compared with uncoordinated charging and satisfy the grid limitations where uncoordinated charging could not. Furthermore, the developed RTSO algorithm was implemented in a HL-CMS and real-time communication with existing off-board charging infrastructure was established. The experimental validation demonstrated the correct operation of the RTSO algorithm for a real-world use case, where it was observed that the execution time of the developed algorithm was lower than the time for the charging infrastructure and the EV to exchange the communication messages at the start of the charging process.
Still, further improvements to the RTSO algorithm are possible and will be considered in the future. First of all, bus-to-grid (B2G) functionalities can be included, which implies that the charging current can also become negative and that the BEBs are discharged to support the grid. This is especially useful in depots where a lot of power is potentially available for grid services [38]. Secondly, the cost function can be upgraded with battery and charger parameters to extend their lifetime. Finally, upscaling and implementing the RTSO algorithm for an entire fleet of BEBs should also be considered. In such a case, the GA that is now used as the core of the RTSO algorithm will probably not be able to find a satisfactory solution within the connection time, even when using parallelized computing. Learning-based algorithms will in this case need to replace the GA. However, the GA can be used to create a complete database, which can then be used to train the learning-based algorithms.

Author Contributions

Conceptualization, B.V.; methodology, B.V.; software, B.V. and A.M.R.; validation, B.V., A.M.R. and M.A.-M.; formal analysis, B.V.; investigation, B.V.; writing—original draft preparation, B.V. and A.M.R.; writing—review and editing, H.R., M.A.-M., T.G., M.E.B. and O.H.; visualization, B.V.; supervision, O.H. All authors have read and agreed to the published version of the manuscript.

Funding

This research was supported by the project HiEFFICIENT. This project has received funding from the ESCEL joint undertaking (JU) under grant agreement no. 101007281. The ESCEL JU receives support from the European Union’s Horizon 2020 research and innovation programme and Austria, Germany, Slovenia, Netherlands, Belgium, Slovakia, France, Italy and Turkey.

Institutional Review Board Statement

Not applicable.

Informed Consent Statement

Not applicable.

Data Availability Statement

No new data were created or analyzed in this study. Data sharing is not applicable to this article.

Acknowledgments

The authors acknowledge Flanders Make for supporting our research group.

Conflicts of Interest

The authors declare no conflict of interest.

Abbreviations

BEBbattery electric bus
B2Gbus to grid
DSOdistribution system operator
ESSenergy storage system
EVelectric vehicle
GAgenetic algorithm
GHGgreenhouse gas
HL-CMShigh-level charging management system
IoTinternet of things
MILPmixed-integer linear programming
OCPPopen charge point protocol
PECpower electronic converter
PTOpublic transport operator
PVphotovoltaic
RERrenewable energy resource
RLreinforcement learning
RTSOreal-time scheduling and optimization
SLACsignal level attenuation characterization
SoCstate of charge
TCOtotal cost of ownership
TOUtime of use

References

  1. European Environment Agency (EEA). Decarbonising Road Transport—The Role of Vehicles, Fuels and Transport Demand. 2022. Available online: https://www.eea.europa.eu/publications/transport-and-environment-report-2021 (accessed on 6 July 2022).
  2. UITP. ZeEUS eBus Report #2: An Updated Overview of Electric Buses in Europe. 2017. Available online: https://zeeus.eu/publications (accessed on 6 July 2022).
  3. Verbrugge, B.; Hasan, M.M.; Rasool, H.; Geury, T.; el Baghdadi, M.; Hegazy, O. Smart integration of electric buses in cities: A technological review. Sustainability 2021, 13, 12189. [Google Scholar] [CrossRef]
  4. Xylia, M.; Leduc, S.; Patrizio, P.; Kraxner, F.; Silveira, S. Locating charging infrastructure for electric buses in Stockholm. Transp. Res. Part C Emerg. Technol. 2017, 78, 183–200. [Google Scholar] [CrossRef]
  5. Rogge, M.; van der Hurk, E.; Larsen, A.; Sauer, D.U. Electric bus fleet size and mix problem with optimization of charging infrastructure. Appl. Energy 2018, 211, 282–295. [Google Scholar] [CrossRef] [Green Version]
  6. Rinaldi, M.; Picarelli, E.; D’Ariano, A.; Viti, F. Mixed-fleet single-terminal bus scheduling problem: Modelling, solution scheme and potential applications. Omega 2020, 96, 102070. [Google Scholar] [CrossRef]
  7. Liu, T.; Ceder, A. Battery-electric transit vehicle scheduling with optimal number of stationary chargers. Transp. Res. Part C Emerg. Technol. 2020, 114, 118–139. [Google Scholar] [CrossRef]
  8. Jefferies, D.; Göhlich, D. A Comprehensive TCO Evaluation Method for Electric Bus Systems Based on Discrete-Event Simulation Including Bus Scheduling and Charging Infrastructure Optimisation. World Electr. Veh. J. 2020, 11, 56. [Google Scholar] [CrossRef]
  9. Lajunen, A. Lifecycle costs and charging requirements of electric buses with different charging methods. J. Clean. Prod. 2018, 172, 56–67. [Google Scholar] [CrossRef]
  10. Mohamed, M.; Farag, H.; El-Taweel, N.; Ferguson, M. Simulation of electric buses on a full transit network: Operational feasibility and grid impact analysis. Electr. Power Syst. Res. 2017, 142, 163–175. [Google Scholar] [CrossRef]
  11. Rupp, M.; Rieke, C.; Handschuh, N.; Kuperjans, I. Economic and ecological optimization of electric bus charging considering variable electricity prices and CO2eq intensities. Transp. Res. Part D Transp. Environ. 2020, 81, 102293. [Google Scholar] [CrossRef]
  12. Leou, R.C.; Hung, J.J. Optimal charging schedule planning and economic analysis for electric bus charging stations. Energies 2017, 10, 483. [Google Scholar] [CrossRef] [Green Version]
  13. Gao, Y.; Guo, S.; Ren, J.; Zhao, Z.; Ehsan, A.; Zheng, Y. An electric bus power consumption model and optimization of charging scheduling concerning multi-external factors. Energies 2018, 11, 2060. [Google Scholar] [CrossRef] [Green Version]
  14. Raab, A.F.; Lauth, E.; Strunz, K.; Göhlich, D. Implementation schemes for electric bus fleets at depots with optimized energy procurements in virtual power plant operations. World Electr. Veh. J. 2019, 10, 5. [Google Scholar] [CrossRef] [Green Version]
  15. Zhou, G.J.; Xie, D.F.; Zhao, X.M.; Lu, C. Collaborative optimization of vehicle and charging scheduling for a bus fleet mixed with electric and traditional buses. IEEE Access 2020, 8, 8056–8072. [Google Scholar] [CrossRef]
  16. Arif, S.M.; Lie, T.T.; Seet, B.C.; Ahsan, S.M.; Khan, H.A. Plug-in electric bus depot charging with PV and ESS and their impact on LV feeder. Energies 2020, 13, 2139. [Google Scholar] [CrossRef]
  17. Jahic, A.; Eskander, M.; Schulz, D. Charging schedule for load peak minimization on large-scale electric bus depots. Appl. Sci. 2019, 9, 1748. [Google Scholar] [CrossRef] [Green Version]
  18. Houbbadi, A.; Trigui, R.; Pelissier, S.; Redondo-Iglesias, E.; Bouton, T. Optimal scheduling to manage an electric bus fleet overnight charging. Energies 2019, 12, 2727. [Google Scholar] [CrossRef] [Green Version]
  19. Liu, K.; Gao, H.; Liang, Z.; Zhao, M.; Li, C. Optimal charging strategy for large-scale electric buses considering resource constraints. Transp. Res. Part D Transp. Environ. 2021, 99, 103009. [Google Scholar] [CrossRef]
  20. Frendo, O.; Gaertner, N.; Stuckenschmidt, H. Real-Time Smart Charging Based on Precomputed Schedules. IEEE Trans. Smart Grid 2019, 10, 6921–6932. [Google Scholar] [CrossRef]
  21. Zheng, Y.; Shang, Y.; Shao, Z.; Jian, L. A novel real-time scheduling strategy with near-linear complexity for integrating large-scale electric vehicles into smart grid. Appl. Energy 2018, 217, 1–13. [Google Scholar] [CrossRef]
  22. Zheng, Y.; Song, Y.; Hill, D.J.; Meng, K. Online Distributed MPC-Based Optimal Scheduling for EV Charging Stations in Distribution Systems. IEEE Trans. Ind. Inform. 2019, 15, 638–649. [Google Scholar] [CrossRef]
  23. Yao, L.; Lim, W.H.; Tsai, T.S. A Real-Time Charging Scheme for Demand Response in Electric Vehicle Parking Station. IEEE Trans. Smart Grid 2017, 8, 52–62. [Google Scholar] [CrossRef]
  24. Papadimitrakis, M.; Giamarelos, N.; Stogiannos, M.; Zois, E.N.; Livanos, N.A.I.; Alexandridis, A. Metaheuristic search in smart grid: A review with emphasis on planning, scheduling and power flow optimization applications. Renew. Sustain. Energy Rev. 2021, 145, 111072. [Google Scholar] [CrossRef]
  25. Frendo, O.; Graf, J.; Gaertner, N.; Stuckenschmidt, H. Data-driven smart charging for heterogeneous electric vehicle fleets. Energy AI 2020, 1, 100007. [Google Scholar] [CrossRef]
  26. Wan, Z.; He, H.L.H.; Prokhorov, D. Model-Free Real-Time EV Charging Scheduling Based on Deep Reinforcement Learning. IEEE Trans. Smart Grid 2018, 10, 5246–5257. [Google Scholar] [CrossRef]
  27. Wang, S.; Bi, S.; Zhang, Y.A. Reinforcement Learning for Real-Time Pricing and Scheduling Control in EV Charging Stations. IEEE Trans. Ind. Inform. 2021, 17, 849–859. [Google Scholar] [CrossRef]
  28. Cao, Y.; Wang, H.; Li, D.; Zhang, G. Smart Online Charging Algorithm for Electric Vehicles via Customized Actor-Critic Learning. IEEE Internet Things J. 2022, 9, 684–694. [Google Scholar] [CrossRef]
  29. Jiang, W.; Zhen, Y. A Real-Time EV Charging Scheduling for Parking Lots with PV System and Energy Store System. IEEE Access 2019, 7, 86184–86193. [Google Scholar] [CrossRef]
  30. Su, J.; Lie, T.T.; Zamora, R. A rolling horizon scheduling of aggregated electric vehicles charging under the electricity exchange market. Appl. Energy 2020, 275, 115406. [Google Scholar] [CrossRef]
  31. Maier, H.R.; Razavi, S.; Kapelan, Z.; Matott, L.S.; Kasprzyk, J.; Tolson, B.A. Introductory overview: Optimization using evolutionary algorithms and other metaheuristics. Environ. Model. Softw. 2019, 114, 195–213. [Google Scholar] [CrossRef]
  32. Reddy, A.K.V.K.; Narayana, K.V.L. Meta-heuristics optimization in electric vehicles -an extensive review. Renew. Sustain. Energy Rev. 2022, 160, 112285. [Google Scholar] [CrossRef]
  33. García-Álvarez, J.; González, M.A.; Vela, C.R. Metaheuristics for solving a real-world electric vehicle charging scheduling problem. Appl. Soft Comput. J. 2018, 65, 292–306. [Google Scholar] [CrossRef]
  34. Frendo, O.; Gaertner, N.; Stuckenschmidt, H. Open Source Algorithm for Smart Charging of Electric Vehicle Fleets. IEEE Trans. Ind. Inform. 2021, 17, 6014–6022. [Google Scholar] [CrossRef]
  35. Khan, A.R.; Mahmood, A.; Safdar, A.; Khan, Z.A.; Khan, N.A. Load forecasting, dynamic pricing and DSM in smart grid: A review. Renew. Sustain. Energy Rev. 2016, 54, 1311–1322. [Google Scholar] [CrossRef]
  36. Bluebus. The Bluebus 12 m. Available online: https://www.bluebus.fr/en/bluebus-12-m (accessed on 24 June 2022).
  37. Al-Saadi, M.; Patkowski, B.; Zaremba, M.; Karwat, A.; Pol, M.; Chelchowski, L.; van Mierlo, J.; Berecibar, M. Slow and Fast Charging Solutions for Li-Ion Batteries of Electric Heavy-Duty Vehicles with Fleet Management Strategies. Sustainability 2021, 13, 10639. [Google Scholar] [CrossRef]
  38. Rafique, S.; Nizami, M.S.H.; Irshad, U.B.; Hossain, M.J.; Mukhopadhyay, S.C. A two-stage multi-objective stochastic optimization strategy to minimize cost for electric bus depot operators. J. Clean. Prod. 2022, 332, 129856. [Google Scholar] [CrossRef]
Figure 1. BEB depot charging architecture with HL-CMS.
Energies 15 05023 g001
Figure 2. Flowchart of the real-time scheduling and optimization (RTSO) algorithm.
Energies 15 05023 g002
Figure 3. Flowchart of the genetic algorithm (GA).
Energies 15 05023 g003
Figure 4. Simulation results of three BEBs charging overnight with (a) electricity tariff, (bd) charging current of each BEB and (e) total charging current and grid limitation.
Energies 15 05023 g004
Figure 5. Cost comparison of charging with RTSO and without.
Energies 15 05023 g005
Figure 6. Simulation results of three BEBs charging during the day with (a) electricity tariff, (bd) charging current of each BEB and (e) total charging current and grid limitation.
Energies 15 05023 g006
Figure 7. Sequence of the OCPP communication protocol between the EV, the charging point and the HL-CMS.
Energies 15 05023 g007
Figure 8. Overview of the experimental test setup.
Energies 15 05023 g008
Figure 9. Experimental test results of the HL-CMS with the embedded RTSO algorithm.
Energies 15 05023 g009
Table 1. Overview of the important parameters of the GA and their values.
ParameterValue
Population size100 × number of decisions variables
Elite count0.05 × population size
Crossover ratio0.8
Mutation rate0.02
Stopping criteria 50
(Number of iterations without improvement in the cost function)
Table 2. Charging specifications of the BEBs overnight.
BEBArrival Time (h)Departure Time (h)Range (km)
BEB 121:0005:00180
BEB 219:3004:00180
BEB 300:1506:30180
Table 3. Charging specifications of the BEBs during the day.
BEBArrival Time (h)Departure Time (h)Range (km)
BEB 112:1515:30100
BEB 211:3014:40100
BEB 313:0016:45100
Table 4. Details of the experimental test setup.
ElementDetails
DC chargerNexxtender Direct45 kW
Measurement unitcomemso charging analyzer/
EVBMW i342 kWh
Publisher’s Note: MDPI stays neutral with regard to jurisdictional claims in published maps and institutional affiliations.

