Article

Calculation Model for Progressive Residual Surface Subsidence above Mined-Out Areas Based on Logistic Time Function

1
School of Surveying and Land Information Engineering, Henan Polytechnic University, Jiaozuo 454000, China
2
College of Geoscience and Surveying Engineering, China University of Mining & Technology, Beijing 100083, China
3
School of Mining & Geomatics, Hebei University of Engineering, Handan 056038, China
4
Jizhong Energy Fengfeng Mining Group Co., Ltd., Handan 056107, China
*
Authors to whom correspondence should be addressed.
Energies 2022, 15(14), 5024; https://doi.org/10.3390/en15145024
Submission received: 7 June 2022 / Revised: 2 July 2022 / Accepted: 5 July 2022 / Published: 9 July 2022

Abstract

:
The exploitation of underground coal resources has stepped up local economic and social development significantly. However, it was inevitable that time-dependent surface settlement would occur above the mined-out voids. Subsidence associated with local geo-mining can last from several months to scores of years and can seriously impact infrastructure, city planning, and underground space utilization. This paper addresses the problems in predicting progressive residual surface subsidence. The subsidence process was divided into three phases: a duration period, a residual subsidence period, and a long-term subsidence period. Then, a novel mathematical model calculating surface progressive residual subsidence was proposed based on the logistic time function. After the duration period, the residual subsidence period was extrapolated according to the threshold of the surface sinking rate. The validation for the proposed model was estimated in light of observed in situ data. The results demonstrate that the logistic time function is an ideal time function reflecting surface subsidence features from downward movement, subsidence rate, and sinking acceleration. The surface residual subsidence coefficient, which plays a crucial role in calculating surface settling, varies directly with model parameters and inversely with time. The influence of the amount of in situ data on predicted values is pronounced. Observation time for surface subsidence must extend beyond the active period. Thus back-calculated parameters with in situ measurement data can be reliable. Conversely, the deviation between predictive values and field-based ones is significant. The conclusions in this study can guide the project design of surface subsidence measurement resulting from longwall coal operation. The study affords insights valuable to land reutilization, city planning, and stabilization estimation of foundation above an abandoned workface.

1. Introduction

It is inevitable that underground mineral deposit exploitation has degraded the environment in spite of substantial attempts to mitigate such impact [1]. One of the typical forms of such changes is land subsidence induced by longwall coal operation. The corresponding research resulting from the published literature indicates that the surface subsidence process can last several months to several dozen or even several hundred years after the end of coal mining activities [2,3,4]. Furthermore, the thicker the cover of the coal seam, the longer the duration of residual surface subsidence. It depends on the individual features of depth of excavation, extracted coal seam thickness, the behavior of surrounding rock masses, etc. Some objects sensitive to residual subsidence, e.g., resident buildings, railways, or high voltage cable towers, can be unavoidably subjected to impairment, which affects land reutilization, urban planning, as well as foundation stabilization significantly above mine-out abandon areas. Therefore, more and more attention from worldwide countries has been drawn to conducting measurements over residual subsidence [5]. In Poland, for instance, it was assumed that the effect ends when the annual increment in subsidence was no more than 10 mm; in Russia, the last series of observations was implemented provided that the overlapping subsidence did not exceed 10 mm within 6 months; while in Germany, it was reportedly up to 3 years before the effect terminated after the end of mining operations.
China is one of the largest coal-producing and -consuming countries in the world. According to the China Bureau of Statistics and BP Statistical Review of World Energy, the average coal production of China was approximately 3700 million tons per annum over the past decade [6,7]. Massive coal resource exploitation breaks the balance of the initial mechanical status of overlying strata, which ultimately triggers a series of mining-induced subsidence phenomena (e.g., downward land movement, crops production reduction, groundwater head drop, and building devastation) [8,9,10,11]. Currently, under the constraints of environmental protection, carbon emission, and coal production capacity, in China, the ratio of coal consumption to total energy consumption has gradually dropped from 70% in 2011 to 58% in 2019 [7]. By the end of 2020, the number of coal pits in China had dropped below 4700, with 5500 collieries closed during the past decade [12].
Moreover, the closed pits were primarily located in resource-rich cities in mid-eastern China [4,13]. Under the Plan of Sustainable Development for resource-rich cities of China (2013–2020) issued by the state council, there were 262 source-based cities. There were at most 57 coal resource-rich cities, accounting for about 25% of the total [14,15]. The closure of so many pits generated a large number of sunken and mined-out areas. The superposition of land residual subsidence above mined-out gobs could seriously damage buildings and underground facilities [16]. As urbanization continues, land repurposing and assessment of foundation stabilization within mining-induced subsidence areas will become increasingly important. Therefore, it is necessary to determine a practical methodology for calculating time-dependent surface residual subsidence above abandoned mined-out goaf.
During longwall coal operation, subsidence of a surface point P followed the advancing workface. For example, as shown in Figure 1, subsidence appears when the face arrives at site a, and then continues to sink promptly from position P-a to P-b after the face passes it (e.g., point b). Then deceleration of the point comes with the face advancing gradually. In the wake of the face stop at the site c, the point continues to sink from P-c to the final position P-d. The whole time-dependent movement and deformation process over surface point P were associated with a series of consequences (e.g., the lithological properties of overlying strata, coal seam thickness, and mining depth) [17,18]. The surface maximum subsidence point (MSP) within a subsidence trough is the point that takes the longest to move and has the greatest subsidence. According to the evolution of its subsidence velocity, the timeline of the entire surface subsidence process can be divided into three phases: duration time, residual period, and long-term period. The duration can also be divided into three time slices: initial period, active period, and weakening period [16,19,20], as noted in Figure 2. The initial period was when the surface began to subside to when the surface subsidence rate reached 1.67 mm/d. The active period occurred when the surface subsidence rate surpassed 1.67 mm/d. Generally, the cumulative surface subsidence during the initial and active periods exceeds 85% of the total surface subsidence. Therefore, most articles have concentrated on these two periods [21,22,23,24,25,26,27,28]. A weakening followed the active period. The weakening period was determined to have ended when the cumulative surface subsidence remained less than 30 mm for six successive months.
Residual subsidence generally followed the weakening period. Peng determined that residual subsidence could best be defined as the interval from when the face stopped moving until the quasi-stable surface subsidence is reached [17]. However, it is difficult to accurately identify the moment of quasi-stable subsidence and calculating its value. In the specification for coal mining under surface buildings, water bodies, and railways in China (referred to as ‘the under three’), the surface residual subsidence period was the time within 50 years after mining operations were stopped [29]. It was impossible to determine the duration of residual surface subsidence because of such long-time span. Combined with the data of InSAR (Interferometric Synthetic Aperture Radar) and GRACE (Gravity Recovery and Climate Experiment) in the eastern Xuzhou coalfield from January 2005 to June 2017, Zheng determined the internal correlation between coal mining activities, surface deformation, and underground water storage variation [30]. After the closure of the mine, the surface deformation mainly depends on two factors: the residual subsidence and the groundwater storage change. The recovery of groundwater will result in the surface uplift, which may also cause the goaf activation and accelerate the residual subsidence. However, how to quantitatively determine the amplitude of surface residual subsidence induced by longwall coal mining? The authors did not mention. In terms of the procedures of residual surface subsidence investigations, according to time-series measurements from InSAR and levelling technology, Modeste considered that surface displacements during the residual phase were dominated by vertical displacements [31]. The assessed beginning date of the residual phase corresponds to the date when displacements from levelling measurements deduced and InSAR results become consistent. However, the method to determine end time of surface residual subsidence was not given by the authors. Guéguen utilized the technology of DInSAR (Differential Interferometric Synthetic Aperture Radar) and PSI (Persistent Scatterer Interferometry) to evaluate surface displacement of the Nord/Pas-de-Calais coal basin North of France during a 15-year period after the end of coal extraction [32]. For longwall coal mining with block caving adopted for management of roof layers, he considered that the process of surface subsidence should be classified into three phases: initial phase, main phase, and residual subsidence phase. At a certain point within the subsidence basin, residual subsidence begins when the point is located above the coal extraction area and at the edge of the mining extraction influence cone, and ends with the final subsidence stabilization. However, the theoretical formulae to calculate beginning date and end data of surface residual subsidence were not constructed. Thus, the time span of residual subsidence period was still ambiguous and the corresponding residual subsidence value was unable to be determined precisely. Bazaluk designed a type of geodynamic test site for the organization of long-term measurement over the earth’s surface deformation process during large-scale development of the field [33]. Combined with GPS (Global Positioning System) measurements, geometric levelling method, together with permanent forced centering stations, he put forward an integrated monitoring methodology to improve the accuracy of centering, as well as to increase the efficiency of observations. Although it is applicable in practice that the methodology can be utilized to observe residual surface subsidence triggered by underground working face operation, it is somewhat labor-intensive.
Researchers measured the long-term surface subsidence above abandoned gobs, which followed residual subsidence (as noted in Figure 2) by applying modern procedures, such as the continuously operating reference system and remote sensing [2,3,34,35]. The results suggested that the long-term subsidence induced by coal excavation was complicated and that the downward or uplift movement of the surface still occurred after mining was stopped for many years. Nevertheless, this surface movement was too small to cause any problems to surface structures [17]. This study concentrates on the spatiotemporal evolution of surface subsidence within the duration and residual subsidence periods.
In practice, it is hard to determine the cut-off point between the weakening phase and residual subsidence phase accurately. This problem was alleviated by implementing observations, which generally are labor- and time-intensive. To calculate duration time, China’s in situ specification of the ‘under three’ empirical formula was recently used for deep mines regardless of other factors, such as coal panel size and face advancing rate [29]. However, the calculated value formula usually did not agree with the in situ measurement data [36]. To clarify the influence of geo-mining conditions on surface subsidence, Peng and Li put forward different types of empirical formulas to predict duration time [19,36]. However, a problem arose in applying two formulas, in that field measurement data could not be fully used, causing calculations to be imprecise. The predictive precision of such two formulas needs to be adapted and improved. Considering the hypothesis of the extreme residual subsidence coefficient, Cui established a mathematical model to calculate residual subsidence duration, but the two problems remained [16]. The inference that surface subsidence was less than 60 mm in the last year of the weakening period was not strictly correct. The other problem was the lack of rigor of the presumption of a linear monotonic decrease of residual subsidence versus time. Therefore, we assumed that the process of surface subsidence from beginning to end was a unified integral whole. The residual subsidence period would follow the weakening period instead of applying Cui’s hypothesis. However, the theory for calculating residual surface subsidence needs to be further studied.
Because residual surface subsidence due to longwall coal mining was a time-dependent process, published reports provided a series of time functions to predict dynamic surface movement. In 1952, Polish scholar Knothe advocated a classical time function (the Knothe function), used extensively worldwide today [37]. However, the subsidence rate and sinking acceleration curves for this time function could not fully represent the evolution of a surface movement. Thus, corrected Konthe time functions were put forward to predict time-dependent subsidence [38,39]. However, the parameters of these functions lost their association with physical entities. Sroka put forward the Sroka–Schober time function, also called the dual-parameter time function [40], but its lithological parameters were difficult to obtain.
Gonzalez developed a normal distribution time function to depict the dynamic process induced by longwall coal mining with a large dip angle of the coal seam [41]. However, it was a complex piecewise function with several parameters that were not easily determined. Other researchers have proposed other time functions [42,43,44], most of which were not rational time functions or could not characterize the essential features of surface movement caused by coal exploitation. A rational time function forecasting surface kinematic residual settlement should meet the following conditions:
(1)
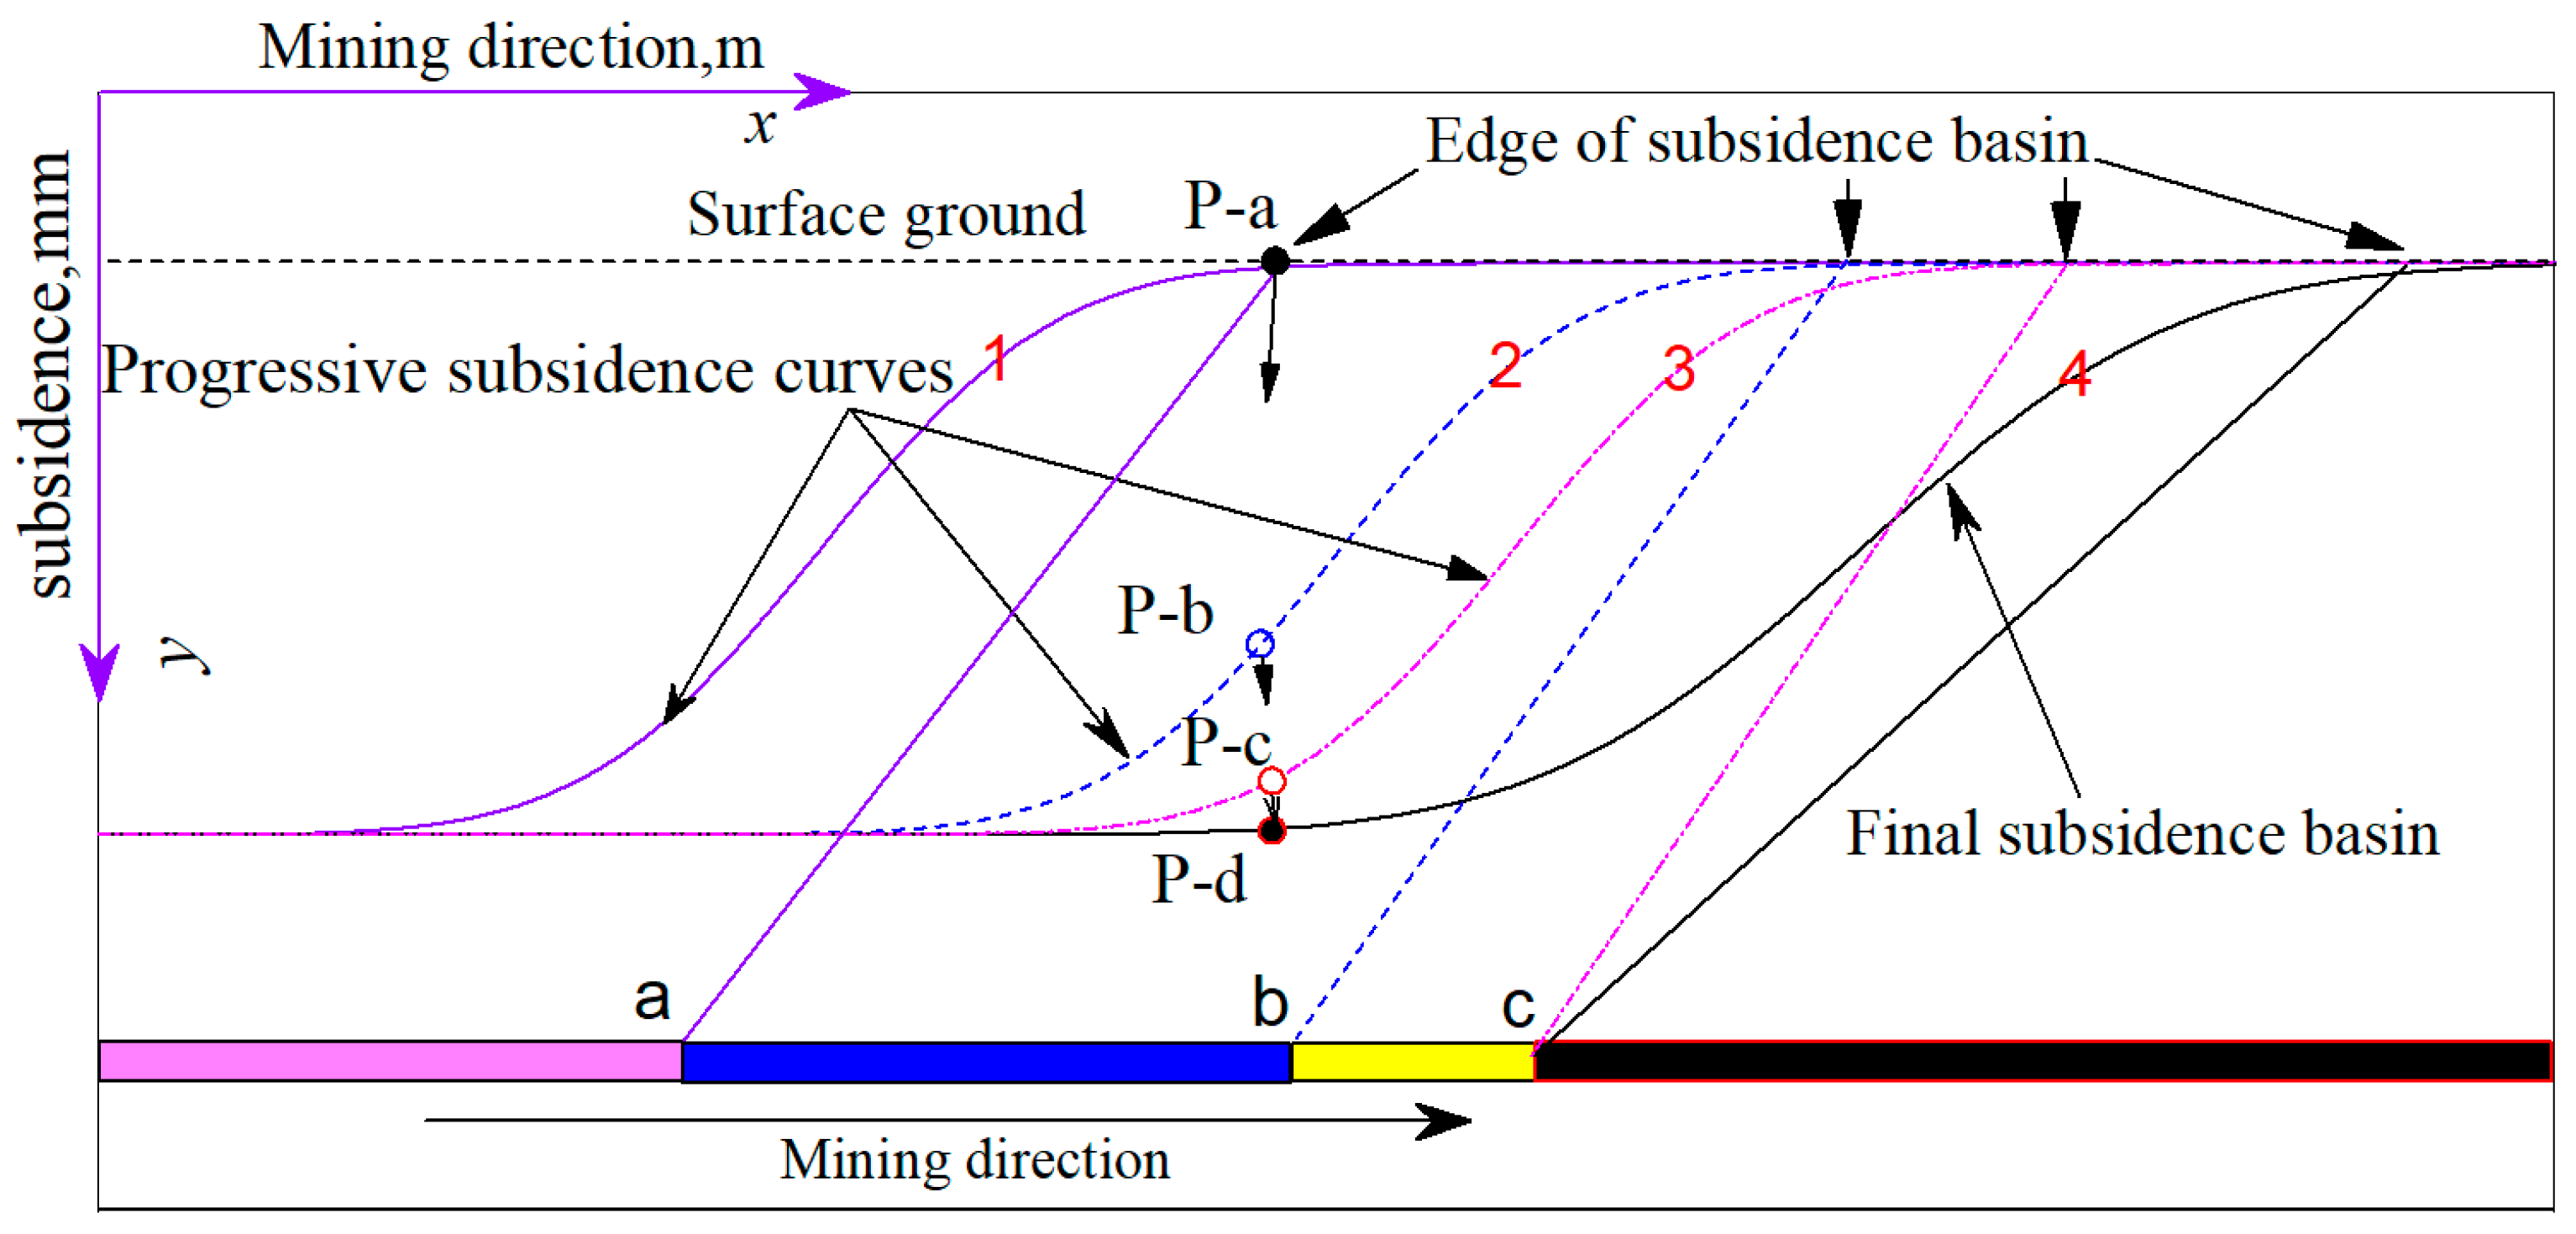
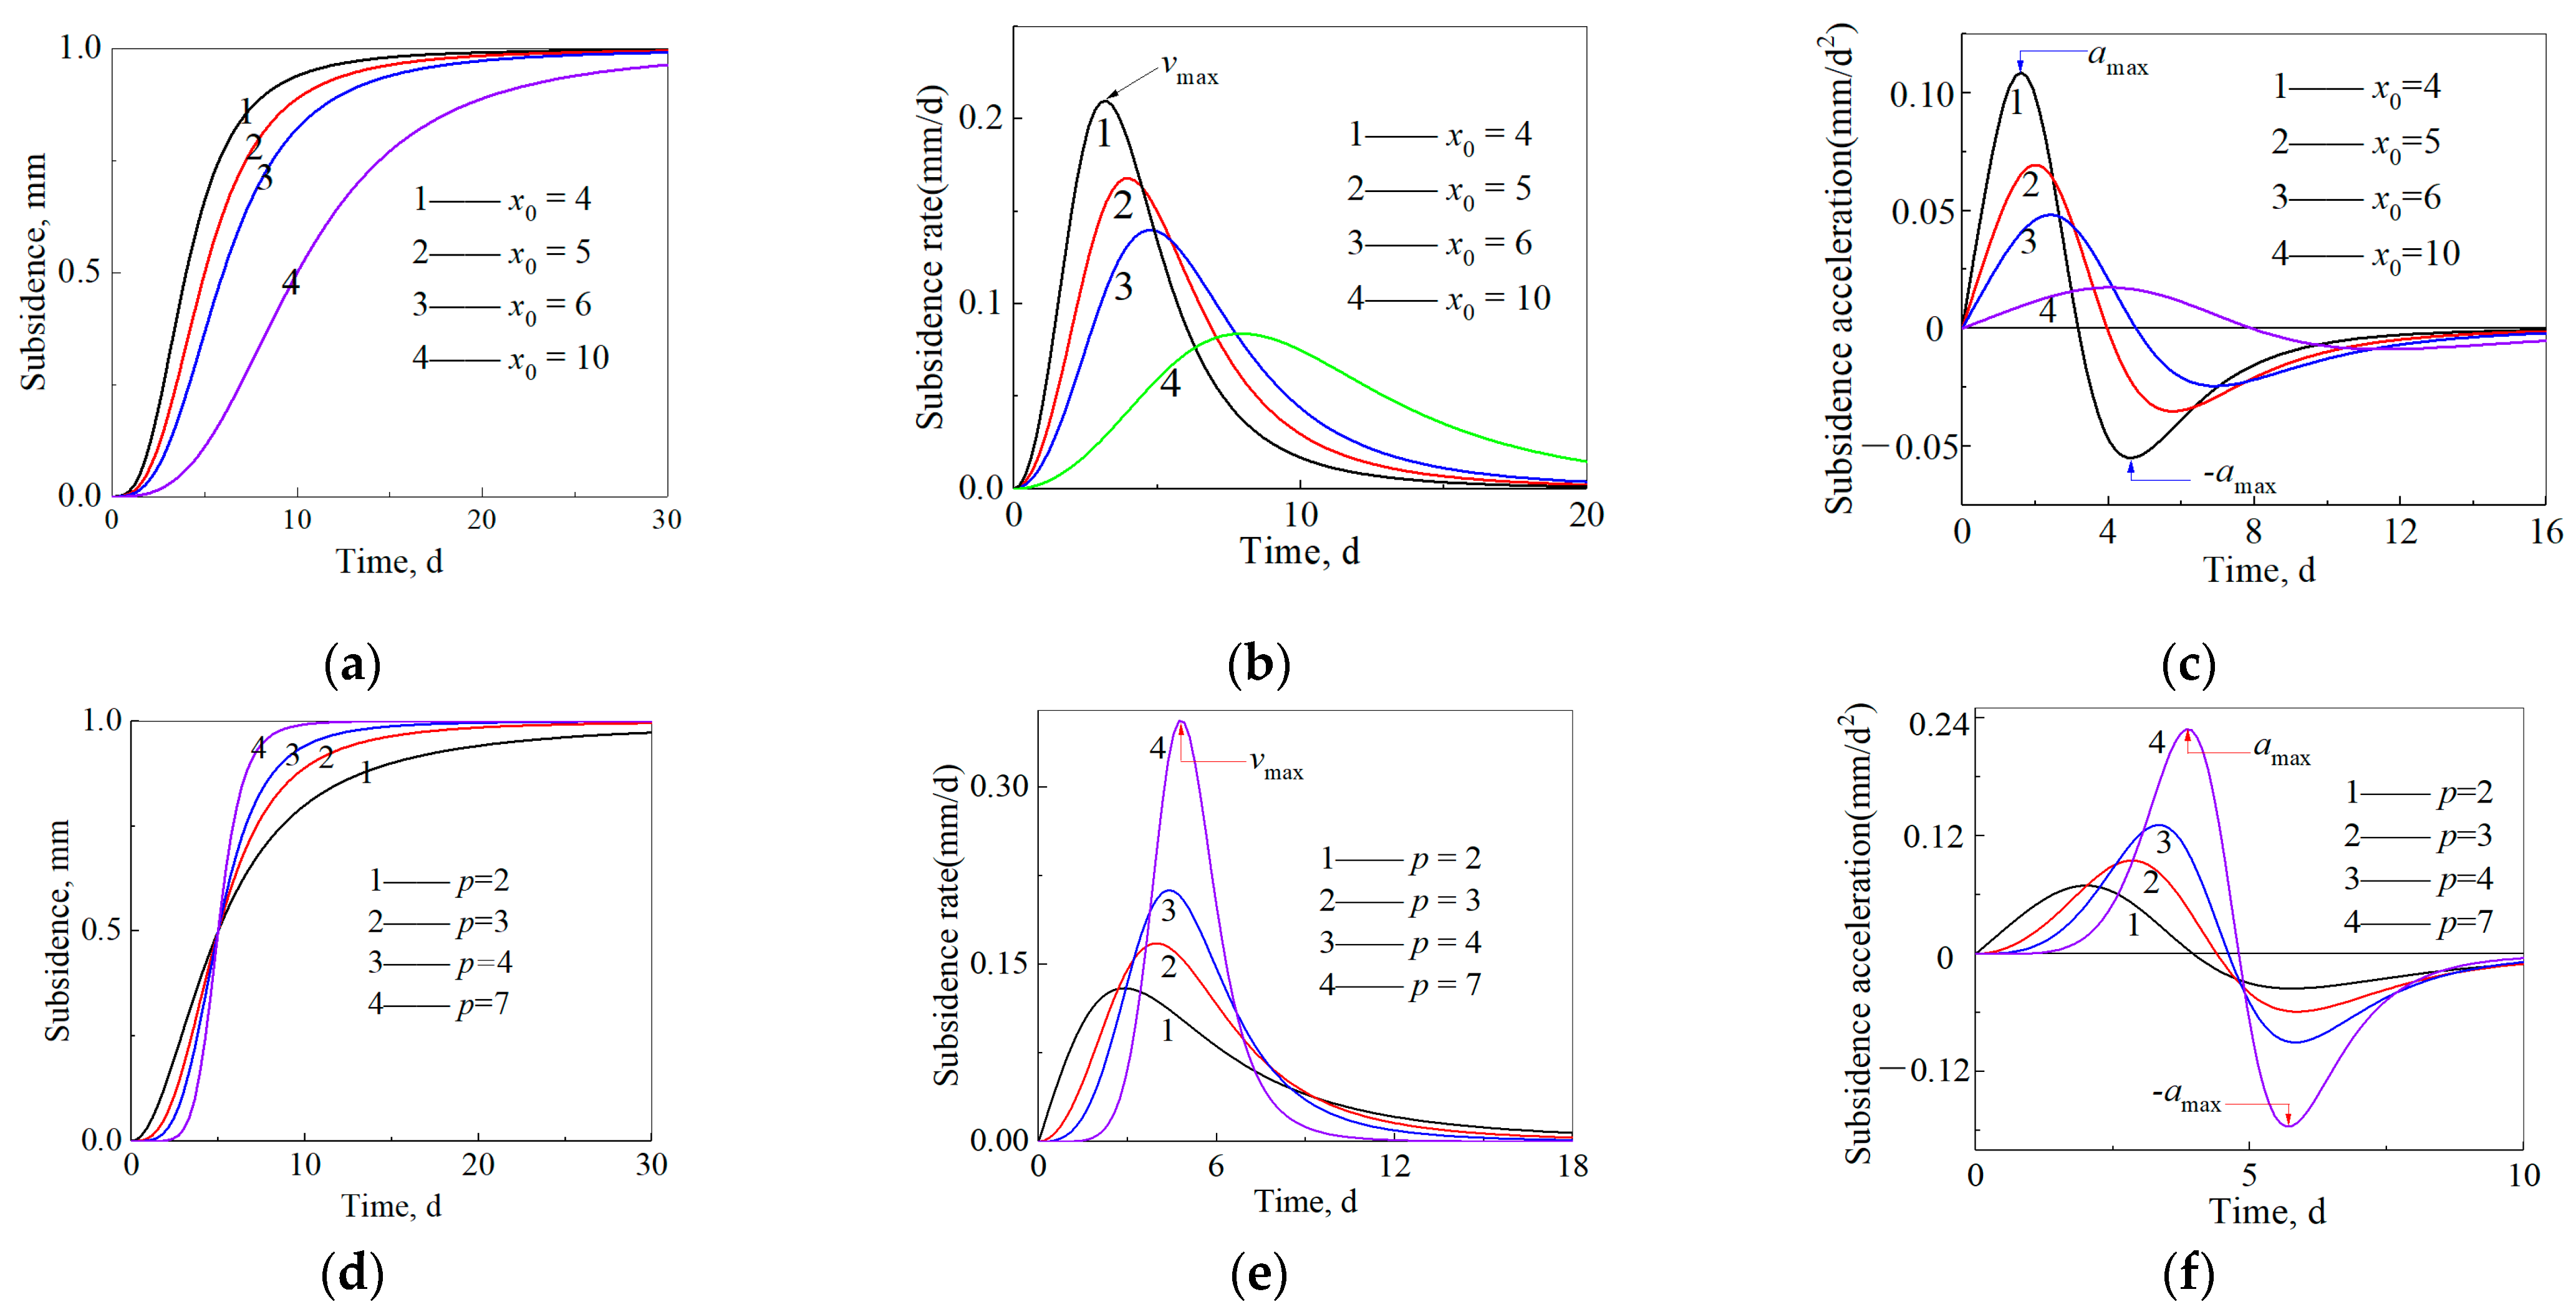
Variation of surface subsidence should reflect the fundamental evolution of surface subsidence. This would consider the subsidence from 0 to its maximum value Wmax, the subsidence rate from 0 to the maximum rate Vmax then back to 0, and the subsidence acceleration from 0 to the maximum positive acceleration +amax, then to the maximum negative acceleration −amax, and eventually to 0, as caused by longwall coal mining.
(2)
Evolution of the curve of surface subsidence rate should embody the features consistent with observed in situ subsidence rate.
In this paper, the tasks are to construct the logistic time function combined with boundary conditions, as well as to build the theoretical model to calculate the surface dynamic residual subsidence. The aims are to apply the model into practice and assess its validation in accordance with different geo-mining conditions. We first establish a new time function based on the logistic time function incorporating reasonable boundary conditions of movement and propose a methodology to determine the surface duration time and residual subsidence period more accurately. Using the new time function, we put forward a novel mathematical model to calculate surface dynamic residual subsidence induced by longwall coal operation. Further, the proposed mathematical models were validated in two in situ investigations from a unique perspective of geo-mining conditions. Finally, the spatiotemporal integrity of the logistic time function and variable features over the residual subsidence factor is discussed.

2. Materials and Methods

2.1. Construction of the Logistic Time Function

The logistic time function is a mathematical growth model that has been used extensively in economics, ecology, and demography. It efficiently characterizes the whole process of an entity from initiation through development then to maturation. The prototype of general logistic time function can be expressed Equation (1):
ϕ ( t ) = A 2 + ( A 1 A 2 ) / ( 1 + ( t / x 0 ) p )
where ϕ (t) is the logistic time function, t is the duration, x0 and p are parameters linked with the lithology of overlying strata, and A1 and A2 are constants.
For the time function to predict dynamic surface subsidence, the following boundary constraints must be satisfied:
As t +   ϕ ( t ) = 1 ; when t = 0, ϕ ( t ) = 0 , namely,
lim t + ϕ ( t ) = lim t + ( A 2 + ( A 1 A 2 ) / ( 1 + ( t / x 0 ) p ) = A 2 = 1
ϕ ( t ) = ϕ ( 0 ) = A 1 = 0 ,
We can insert Equations (2) and (3) into Equation (1) to convert the logistic time function into Equation (4):
ϕ ( t ) = 1 1 / ( 1 + ( t / x 0 ) p )
Suppose the surface subsidence extremum induced by longwall coal mining over MSP within the sinking basin is We, the time-dependent surface subsidence Wm(t) for this point at any time t can be calculated by Equation (5):
W m ( t ) = W e φ ( t ) = W e [ 1 1 / ( 1 + ( t / x 0 ) p ) ]
where We = mqecosα, m refers to the coal seam thickness, qe is the surface extreme subsidence coefficient, and α stands for the coal seam dip angle.

2.2. Model for Calculating the Surface Dynamic Residual Subsidence

Coal mining-induced surface progressive movement is closely associated with the geo-mining conditions. The deeper the mining, the longer the surface progressive subsidence period lasts. Further, the softer the lithology of overlying strata is, the shorter surface dynamic subsidence time. The converse is also true. Consequently, the duration of surface movement can be several months to dozens of years. Therefore, it is usually challenging to obtain integral subsidence data from the beginning of the process to the stability of the surface movement through in situ measurement. It is much easier to access temporal series data of surface subsidence within a limited time after coal operations are stopped.
The weakening period (Figure 2) is normally defined with the period ending when overlapping subsidences move no more than 30 mm within six consecutive months [16,29]. Assuming 30 days in a month, the surface subsidence rate at the end of the weakening period can be derived according to Equation (6).
d W m ( t ) d t = v m ( t ) = p x 0 p t p 1 ( x 0 p + t p ) 2 w e = 1 / 6
Rearranging Equation (6) yields
t 2 p + 2 x 0 p t p 6 w e p x 0 p t p 1 + x 0 2 p = 0
The duration of surface subsidence can be obtained by solving Equation (7) (suppose that the value deduced is td). By substituting t = td into Equation (5), the maximum subsidence over MSP within the duration time can be calculated through Equation (8):
W m ( t d ) = m q e c o s α [ 1 1 / ( 1 + ( t d / x 0 ) p ) ]
If surface superposition subsidence does not exceed 1 mm per year (i.e., the subsidence rates are no more than 1/360 mm per day), the surface above mined-out voids is in stabilization [45]. Given that vm(t) is 1/360 mm/day, then
v m ( t ) = p x 0 p t p 1 ( x 0 p + t p ) 2 w e = 1 / 360
Equation (9) can be rearranged as
t 2 p + 2 x 0 p t p 360 w L p x 0 p t p 1 + x 0 2 p = 0
Thus, the sum of duration of time and the residual subsidence period can be derived by solving Equation (10). Given the coefficient of surface subsidence in terms of MSP within duration time is q, then
q = q e [ 1 1 / ( 1 + ( t d / x 0 ) p ) ]
Dynamic residual subsidence Wr(t) for MSP at any time can be expressed by Equation (12).
W r ( t ) = W ( t total ) W ( t ) = m q e cos α [ 1 / ( 1 + ( t / x 0 ) p ) 1 / ( 1 + ( t total / x 0 ) p ) ]   t d t t total
where ttotal stands for the sum of duration time and the residual subsidence period. The dynamic residual subsidence coefficient qr can be subsequently expressed by Equation (13):
q r = q e [ 1 / ( 1 + ( t / x 0 ) p ) 1 / ( 1 + ( t total / x 0 ) p ) ]   t d t t total

2.3. Parameter Inversion

The parameters of the model of surface dynamic residual subsidence can dramatically influence calculation precision. This study reports the theory of probability as applied to deriving their optimum values. The subsidence data observed over MSP within the sinking basin were selected to back-calculate the parameters. The field measurements for the time-series array over MSP are [ t i , w maxp i ] , where i equals 1, 2, 3,…, n; n is the number of observations over surface landmarks; and w maxp i is the surface subsidence value of MSP observed for the ith time. The least-squares adjustment was applied to calculate the optimum parameter values. This method is a mathematical and statistical technique for dealing with the optimal combination of redundant observations and the assessment of unknown parameters. When the sum of the squares of the residual errors between observed and theoretical values reaches a minimum, the parameter values deduced from Formula (14) are optimal, that is,
Q = i = 1 n [ ( 1 1 / ( 1 + ( t i x 0 ) p ) ) W e w maxp i ] 2 min
where Q is the residual sum of squares.

2.4. Two Studied Areas

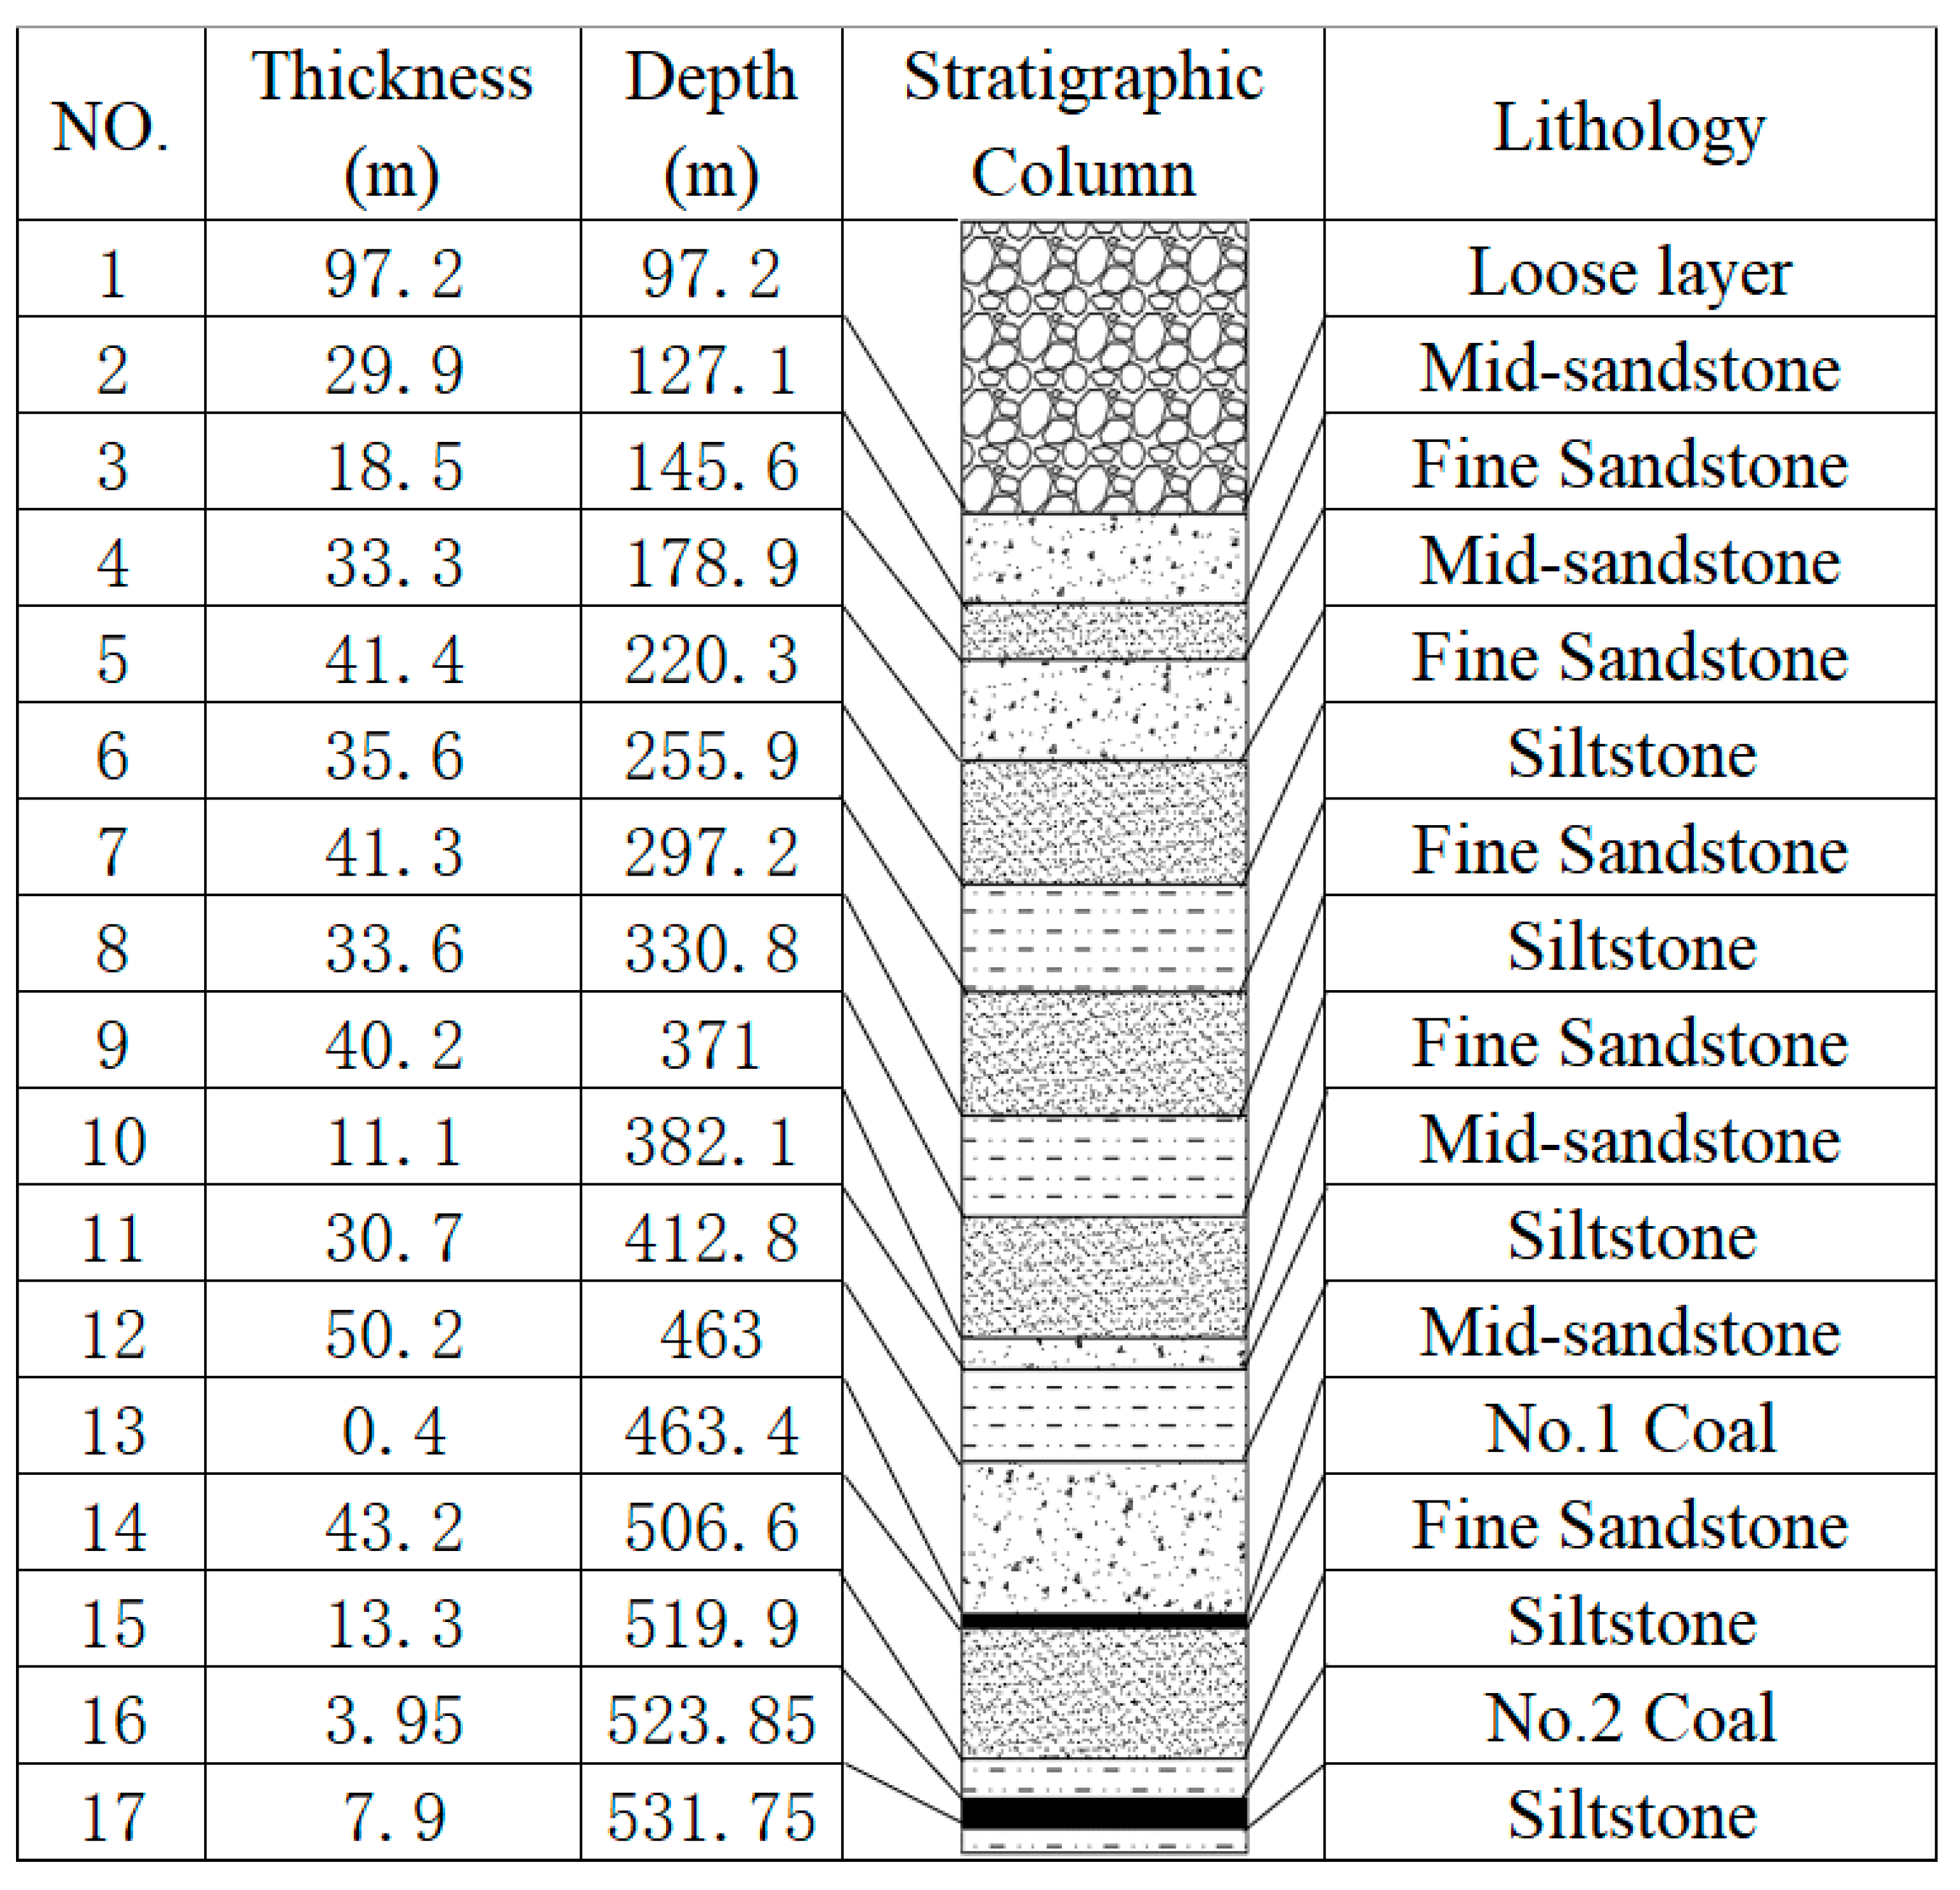
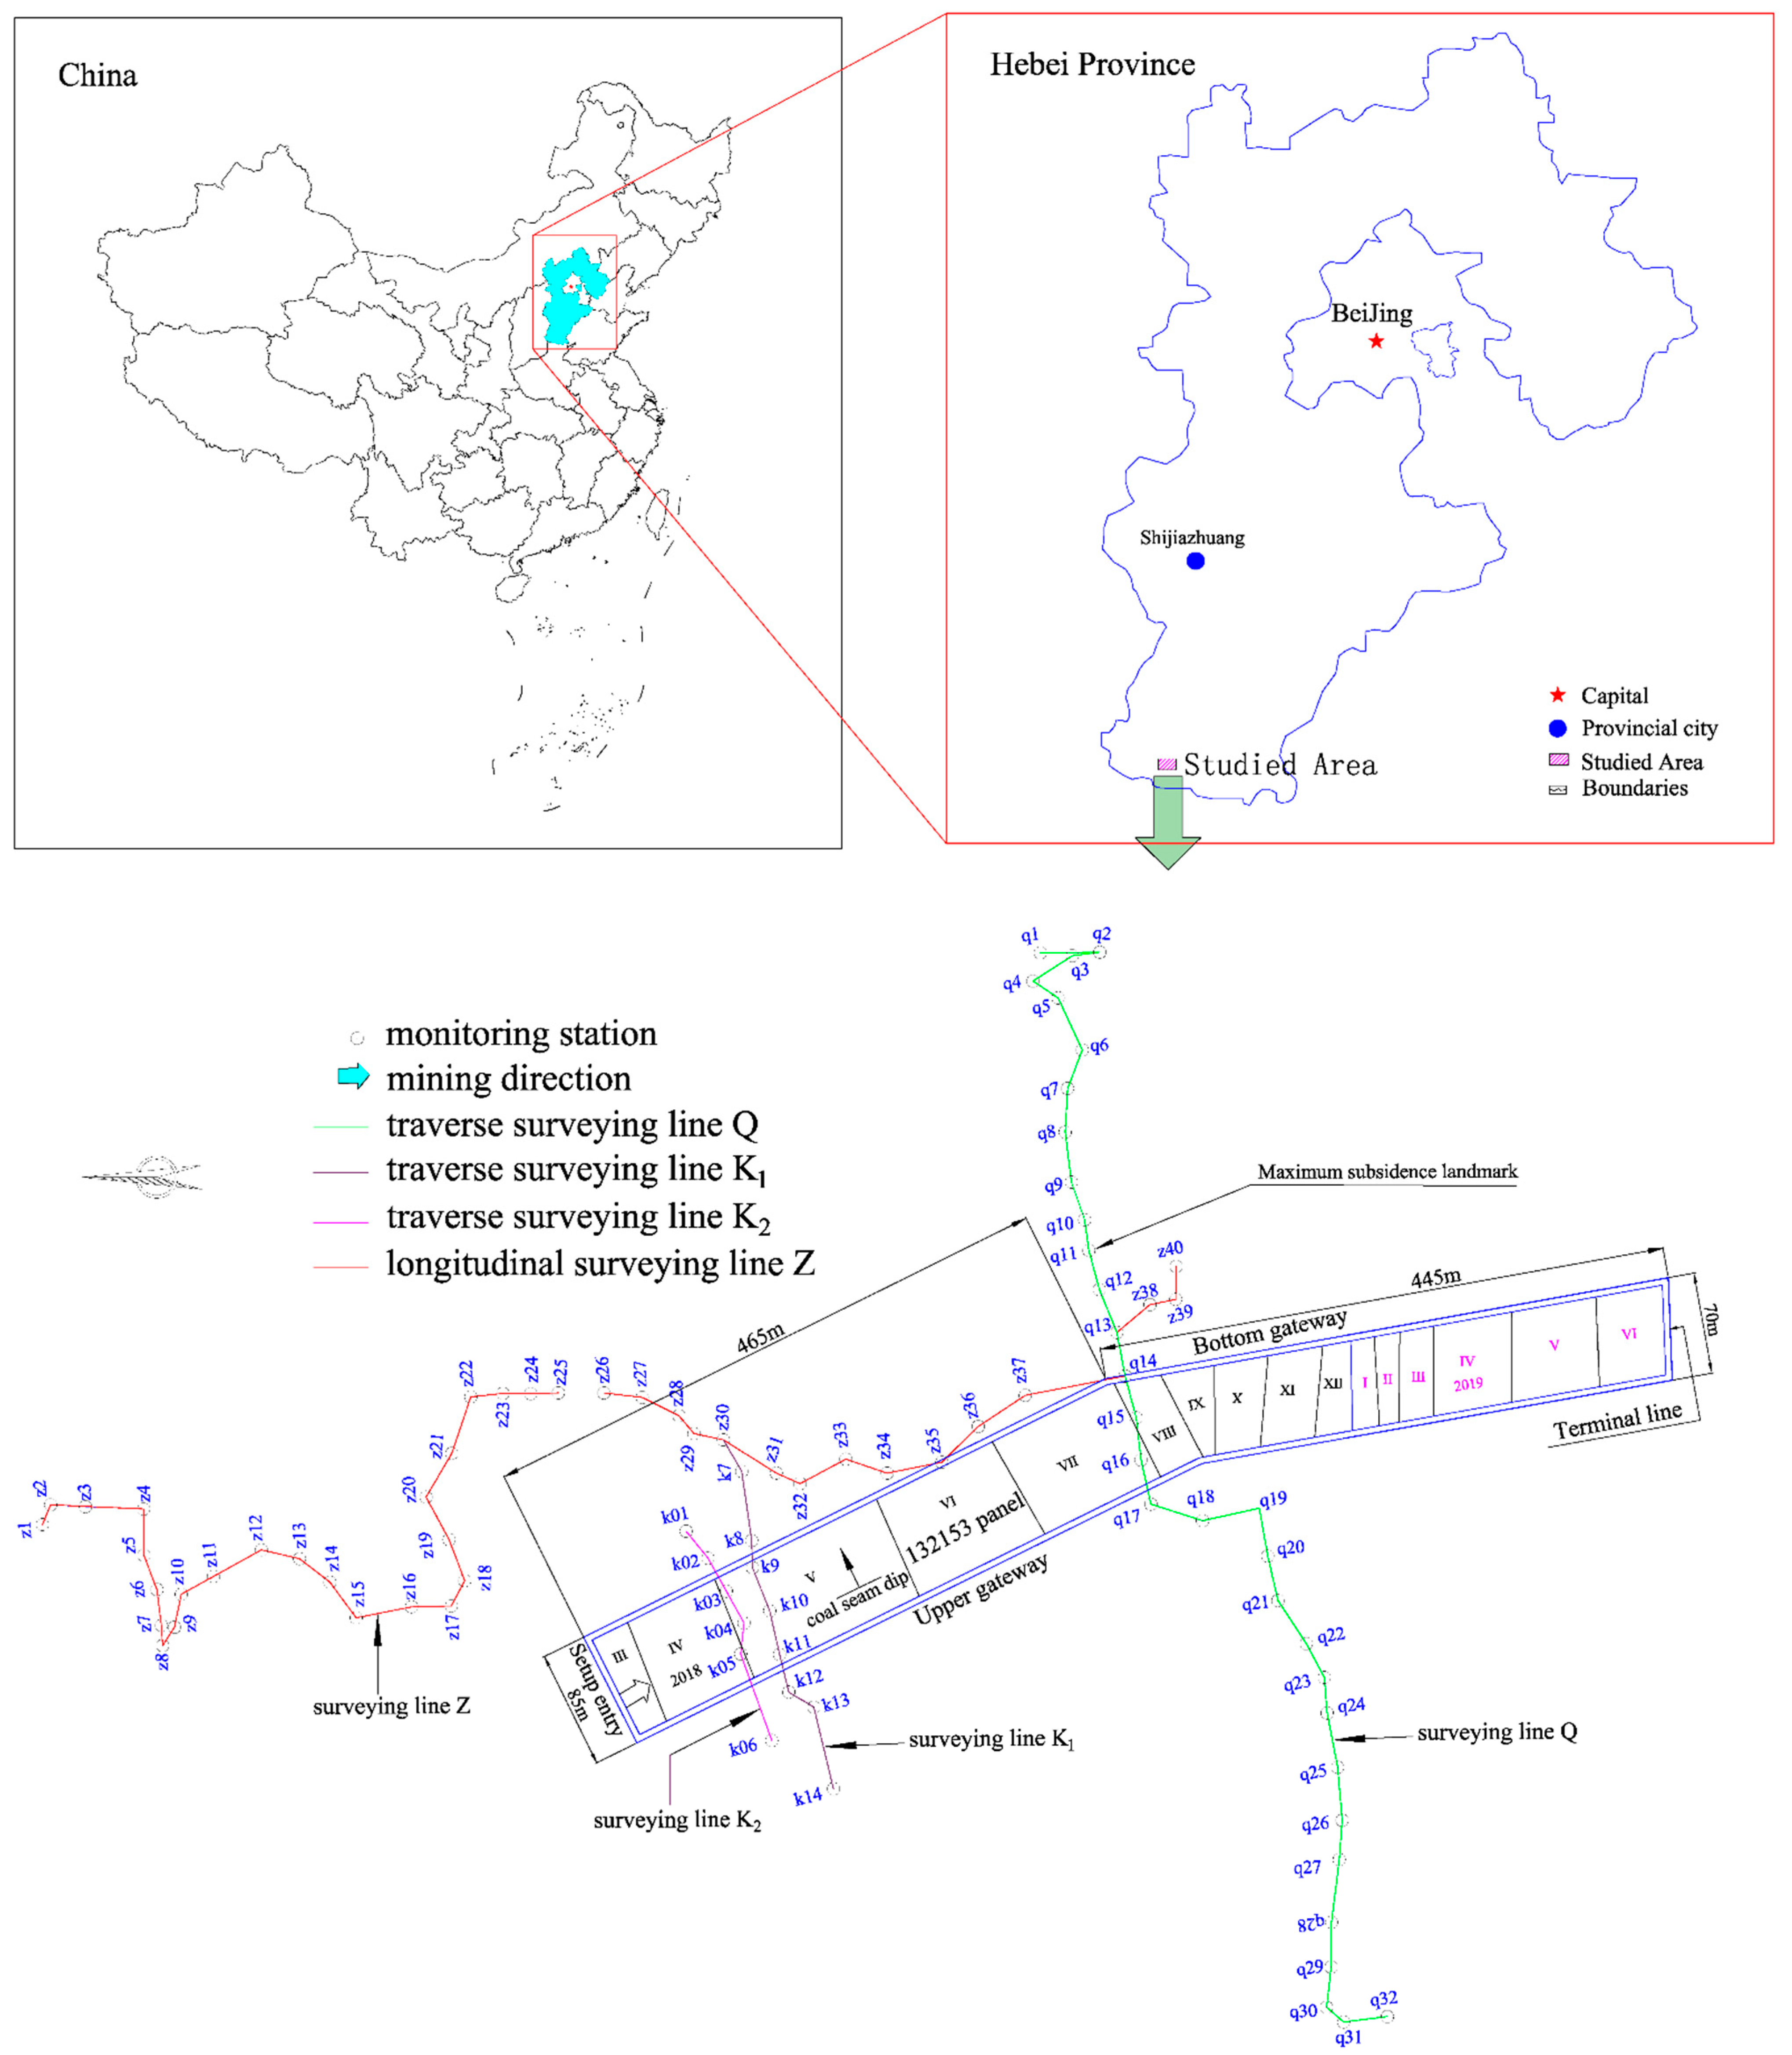
2.4.1. Geological Setting and Mining Conditions over Subcritical Mining

The Wannian colliery was located in the Fengfeng area in northern China’s Hebei Province. The geological setting parameters of 132153 longwall coal panel were: a 4.0 m average mined coal seam thickness, an 85 m transverse width, and a 465 m in length from setup entry to the first half portion of the panel. The second half was 445 m in length, 70 m in transverse width, and a 528 m average mining depth. The worked coal seam of the panel was no. 2 with a dip angle of 23°. The aquifers over coal seam from top to bottom involve three slice aquifers: Cenozoic porous aquifer, sandstone-fractured aquifer Ⅰ, and sandstone-fractured aquifer Ⅱ. Cenozoic porous aquifer mainly consists of gravel coupled with loess, whose maximum thickness is of 25.0 m. Sandstone-fractured aquifer Ⅰ is located in the intermediate section of the overlying strata. The distance from the roof of the coal seam is about 240 m. Sandstone-fractured aquifer Ⅱ composed of silt sandstone is adjacent to the roof layer of coal seam with normal thickness being 15 m, but the specific yield is below 0.1 L/(m.s). The influence of aforementioned three slice aquifers on coal seam extraction is neglectable due to thick aquiclude strata and small specific yield. A fully mechanized coal excavation method was applied, and the geological tectonics were simple; a completely caving method was adopted to manage the roof layer. The stratigraphic sequence graph for the panel 132153 are represented in Figure 3. The degree of development toward a fully developed surface subsidence basin could be expressed by the mining degree coefficient (MDC) (Peng, 1992), which was the ratio of the length or width of the longwall coalface to seam mining depth. The MDC over face 132153 was 0.15, so it was virtually a subcritical mining panel.
Four surveying lines were laid out above the panel to study the evolution of progressive surface subsidence before mining, performed from March 2018 to Jun 2019. A schematic diagram of pit location and surface movement monitoring stations are shown in Figure 4. There were 41 monitoring stations longitudinally (surveying line Z), whose serial numbers were assigned z1 to z41. The other three surveying lines (surveying lines Q, K1, and K2, with serial numbers q1 to q32, k1 to k6, and k7 to k14, respectively) involved 52 surveying stations in the traverse direction above the panel.

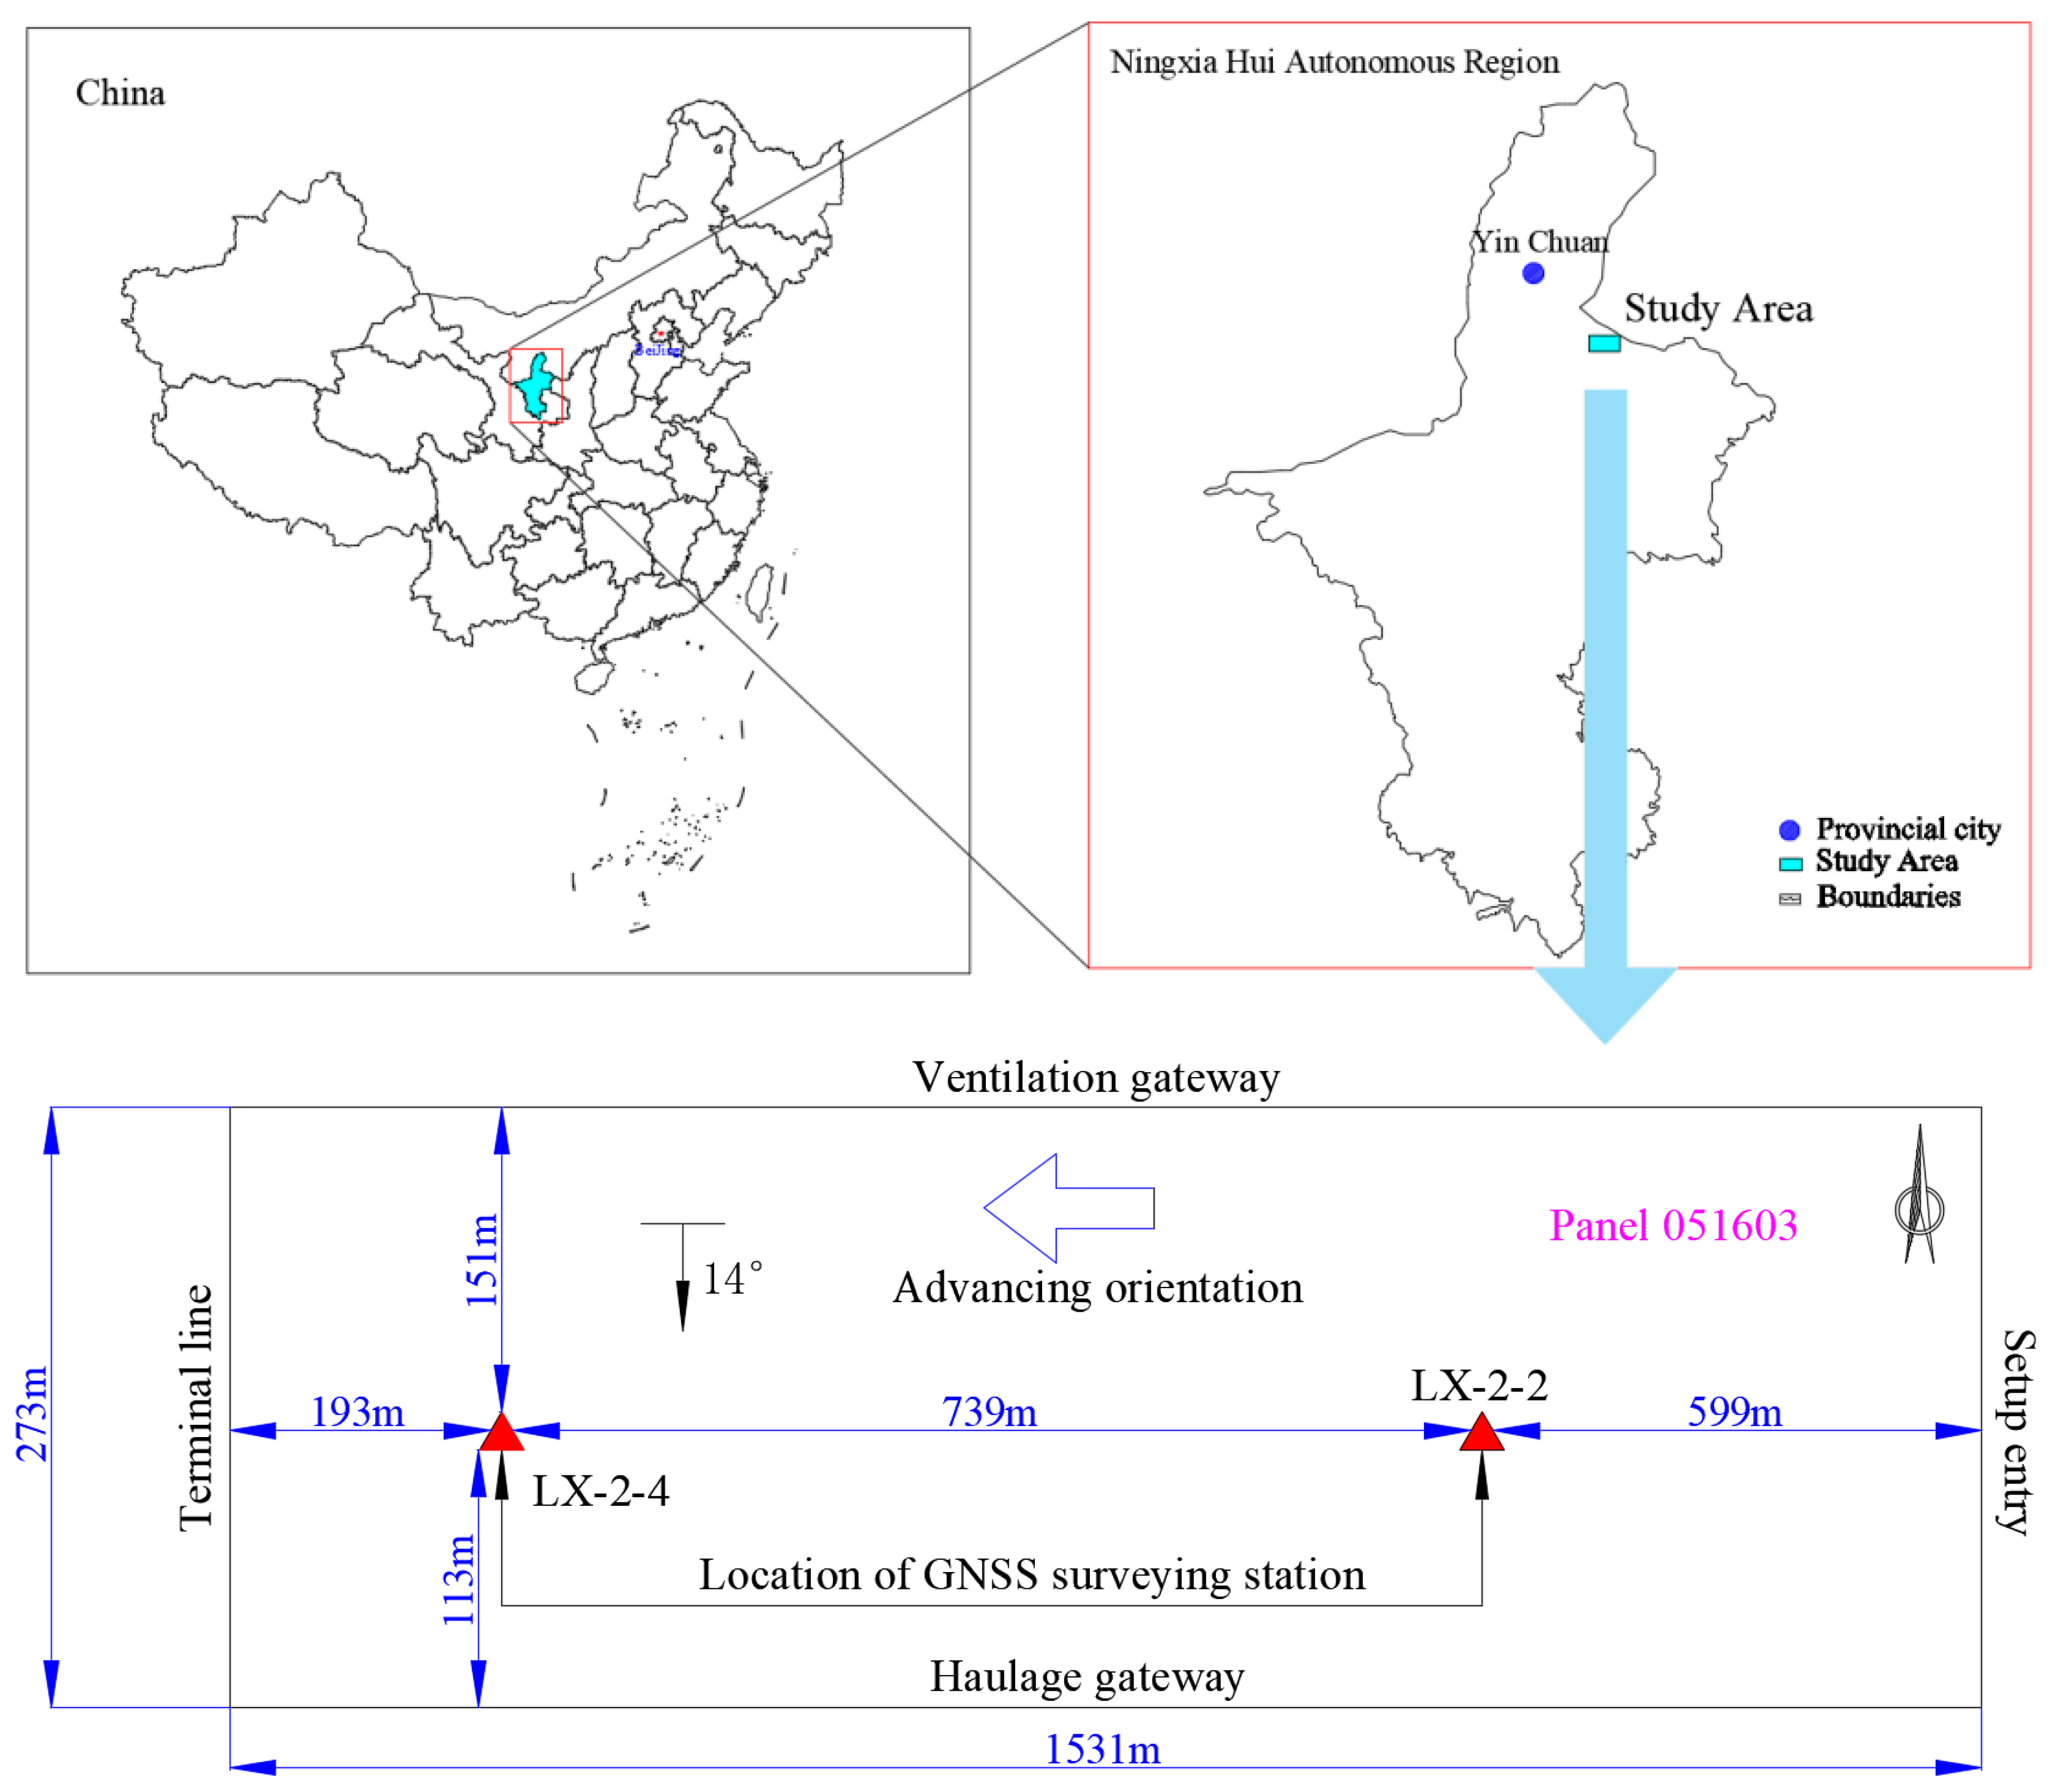
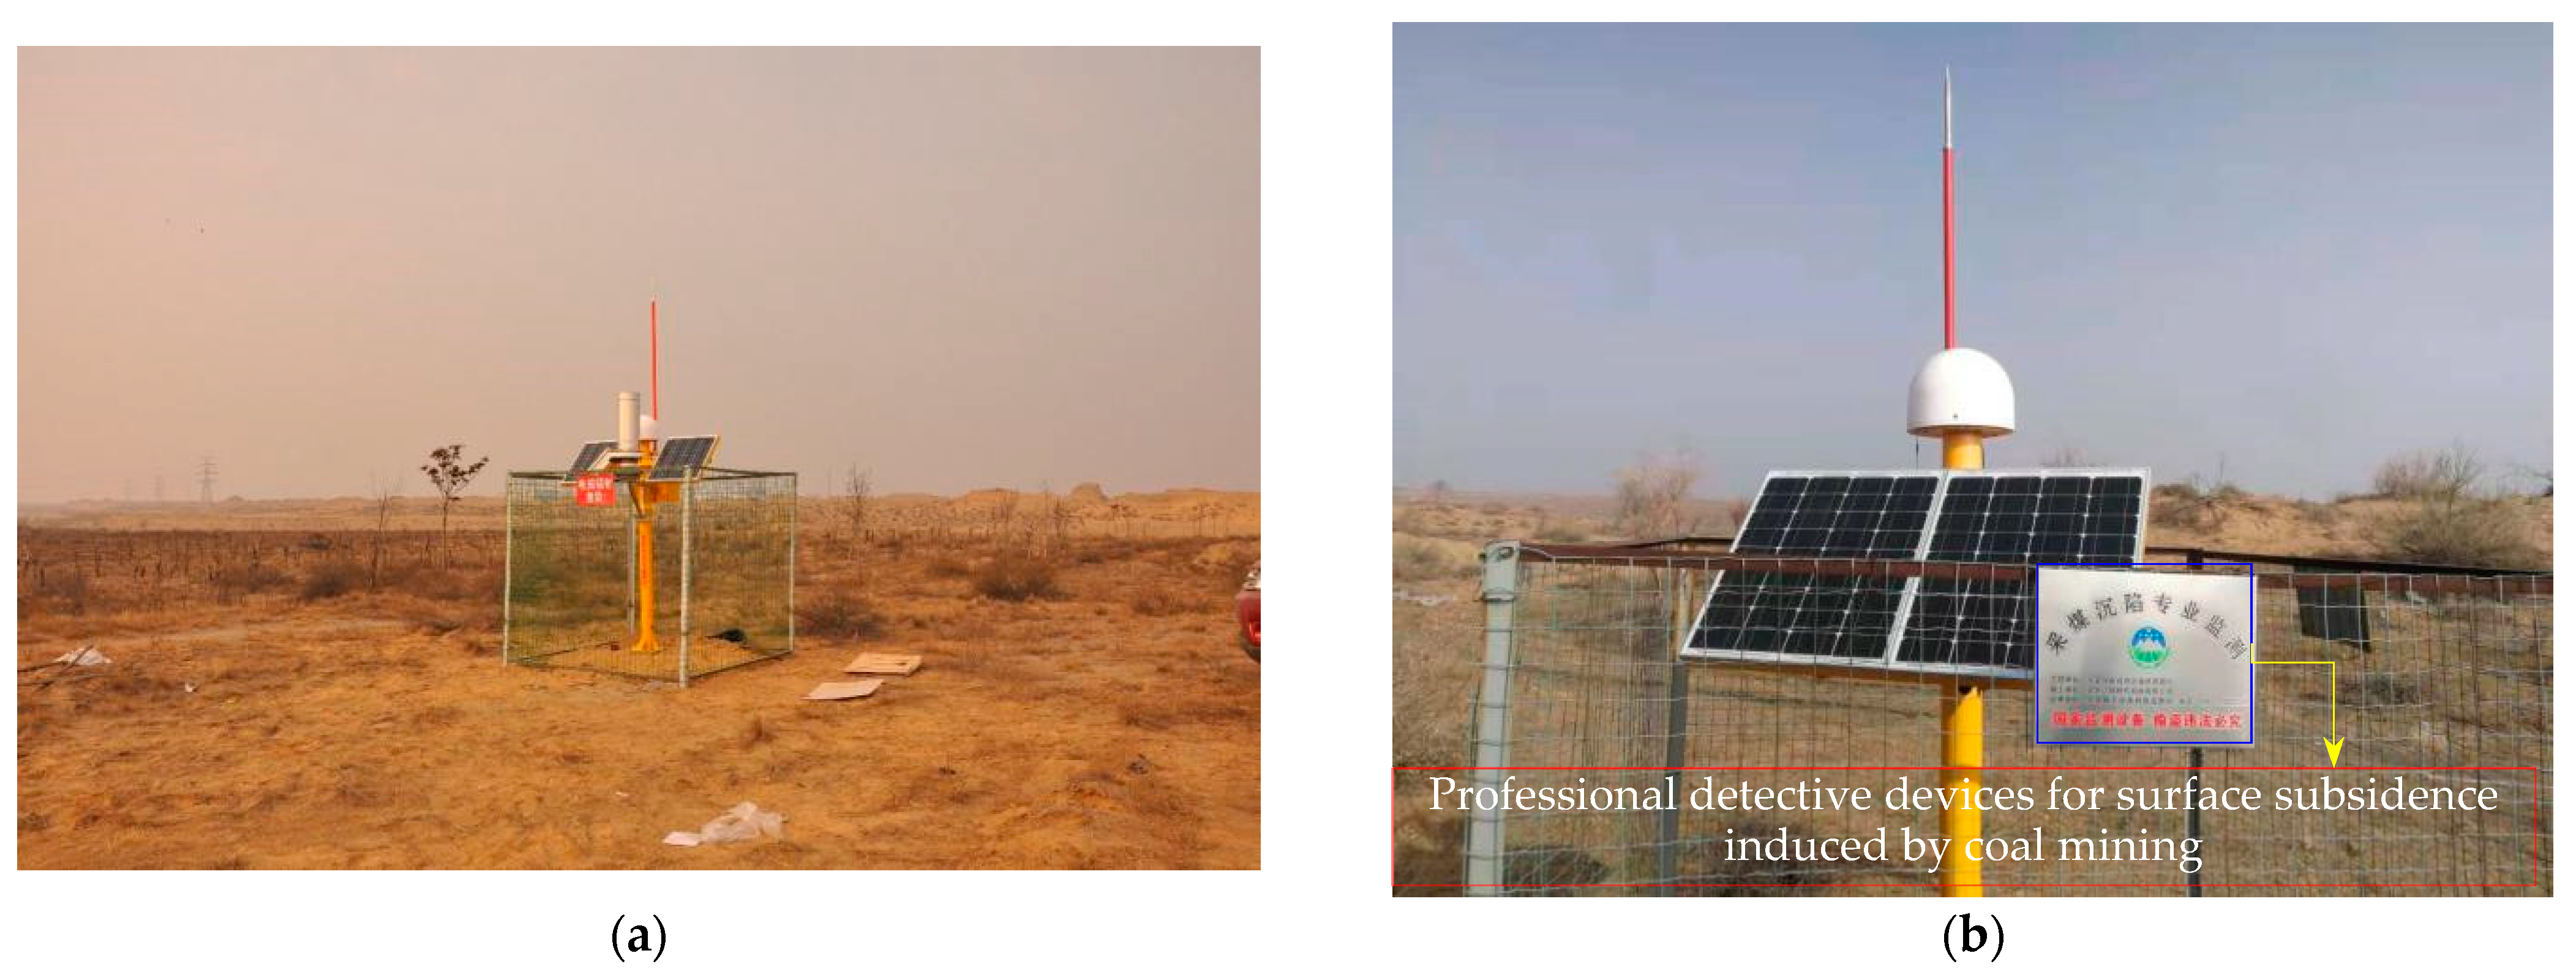
2.4.2. Geo-Mining Settings and Field Measurement over Supercritical Mining

The studied area is Lingxin colliery located in Lingwu county, about 60 km northwest of Yinchuan in China’s Ningxia Hui Autonomous Region (Figure 5). The colliery is on the brink of Mu Us Desert with the climate being arid and semi-arid. According to geological report of the colliery, underground aquifers above the coal working panel from top to bottom are classified into two types: Cenozoic porous aquifer and porous-fractured aquifers. The former exists in alluvium from Quaternary System composed of sand soil, fine sand, as well as sand gravel. While the latter occurs in sandstone and mudstone strata from the Jurassic and Triassic periods. Both kinds of aquifer belong to aquitard. The coal-mining operation was implemented on panel 051603 from March 2014 to June 2015 with an average mining rate of 4.2 m/d. The longitudinal length of the panel was 1531 m with a dip width of 273 m. The mined-out coal seam thickness was 3.0 m, and the coal seam dip angle was 14° with a mining depth of 162 m. The observation system of surface subsidence was composed of one global navigation satellite system (GNSS) reference station and two work stations whose field photographs are shown in Figure 6. The measurement precision for this system was 3 mm horizontally and 5 mm vertically. The two working stations, numbered LX-2-2 and LX-2-4, were laid out above the panel noted in Figure 5 to study the process of surface movement. The surface subsidence measurements were taken from 7 February 2015 to 28 July 2018. Observation data were collected automatically approximately once a week. The measured sinking curves of two GNSS stations are shown in Figure 7.
The panel for 051603 was extracted about 700 m before observation station LX-2-2 was laid out, so the data measured at this station did not represent the actual surface subsidence. Surveying landmark LX-2-4 was initially observed from 7 February 2015, when the distance from the operating face to the surveying station was 639 m. Therefore, we believed that the data from this station would represent its true downward settlement and could be used to analyze the evolution of surface subsidence induced by longwall coal mining. During the subsequent subsidence process, both stations were influenced by the mining operation of adjacent dip-side coalface at different times. We can see clearly from Figure 7 that resettlement appears at 578 d (when LX-2-2 observation station is influenced) and 669 d (the LX-2-4 station presently affected) with maximum resettlements of 113 mm and 78 mm, respectively. Based on the above analysis, the LX-2-4 data covered day 0 to day 669 (from 7 February 2015 to 7 December 2016) and were chosen for process analysis of surface subsidence.

3. Results

3.1. Prediction of Surface Dynamic Residual Subsidence over Subcritical Mining

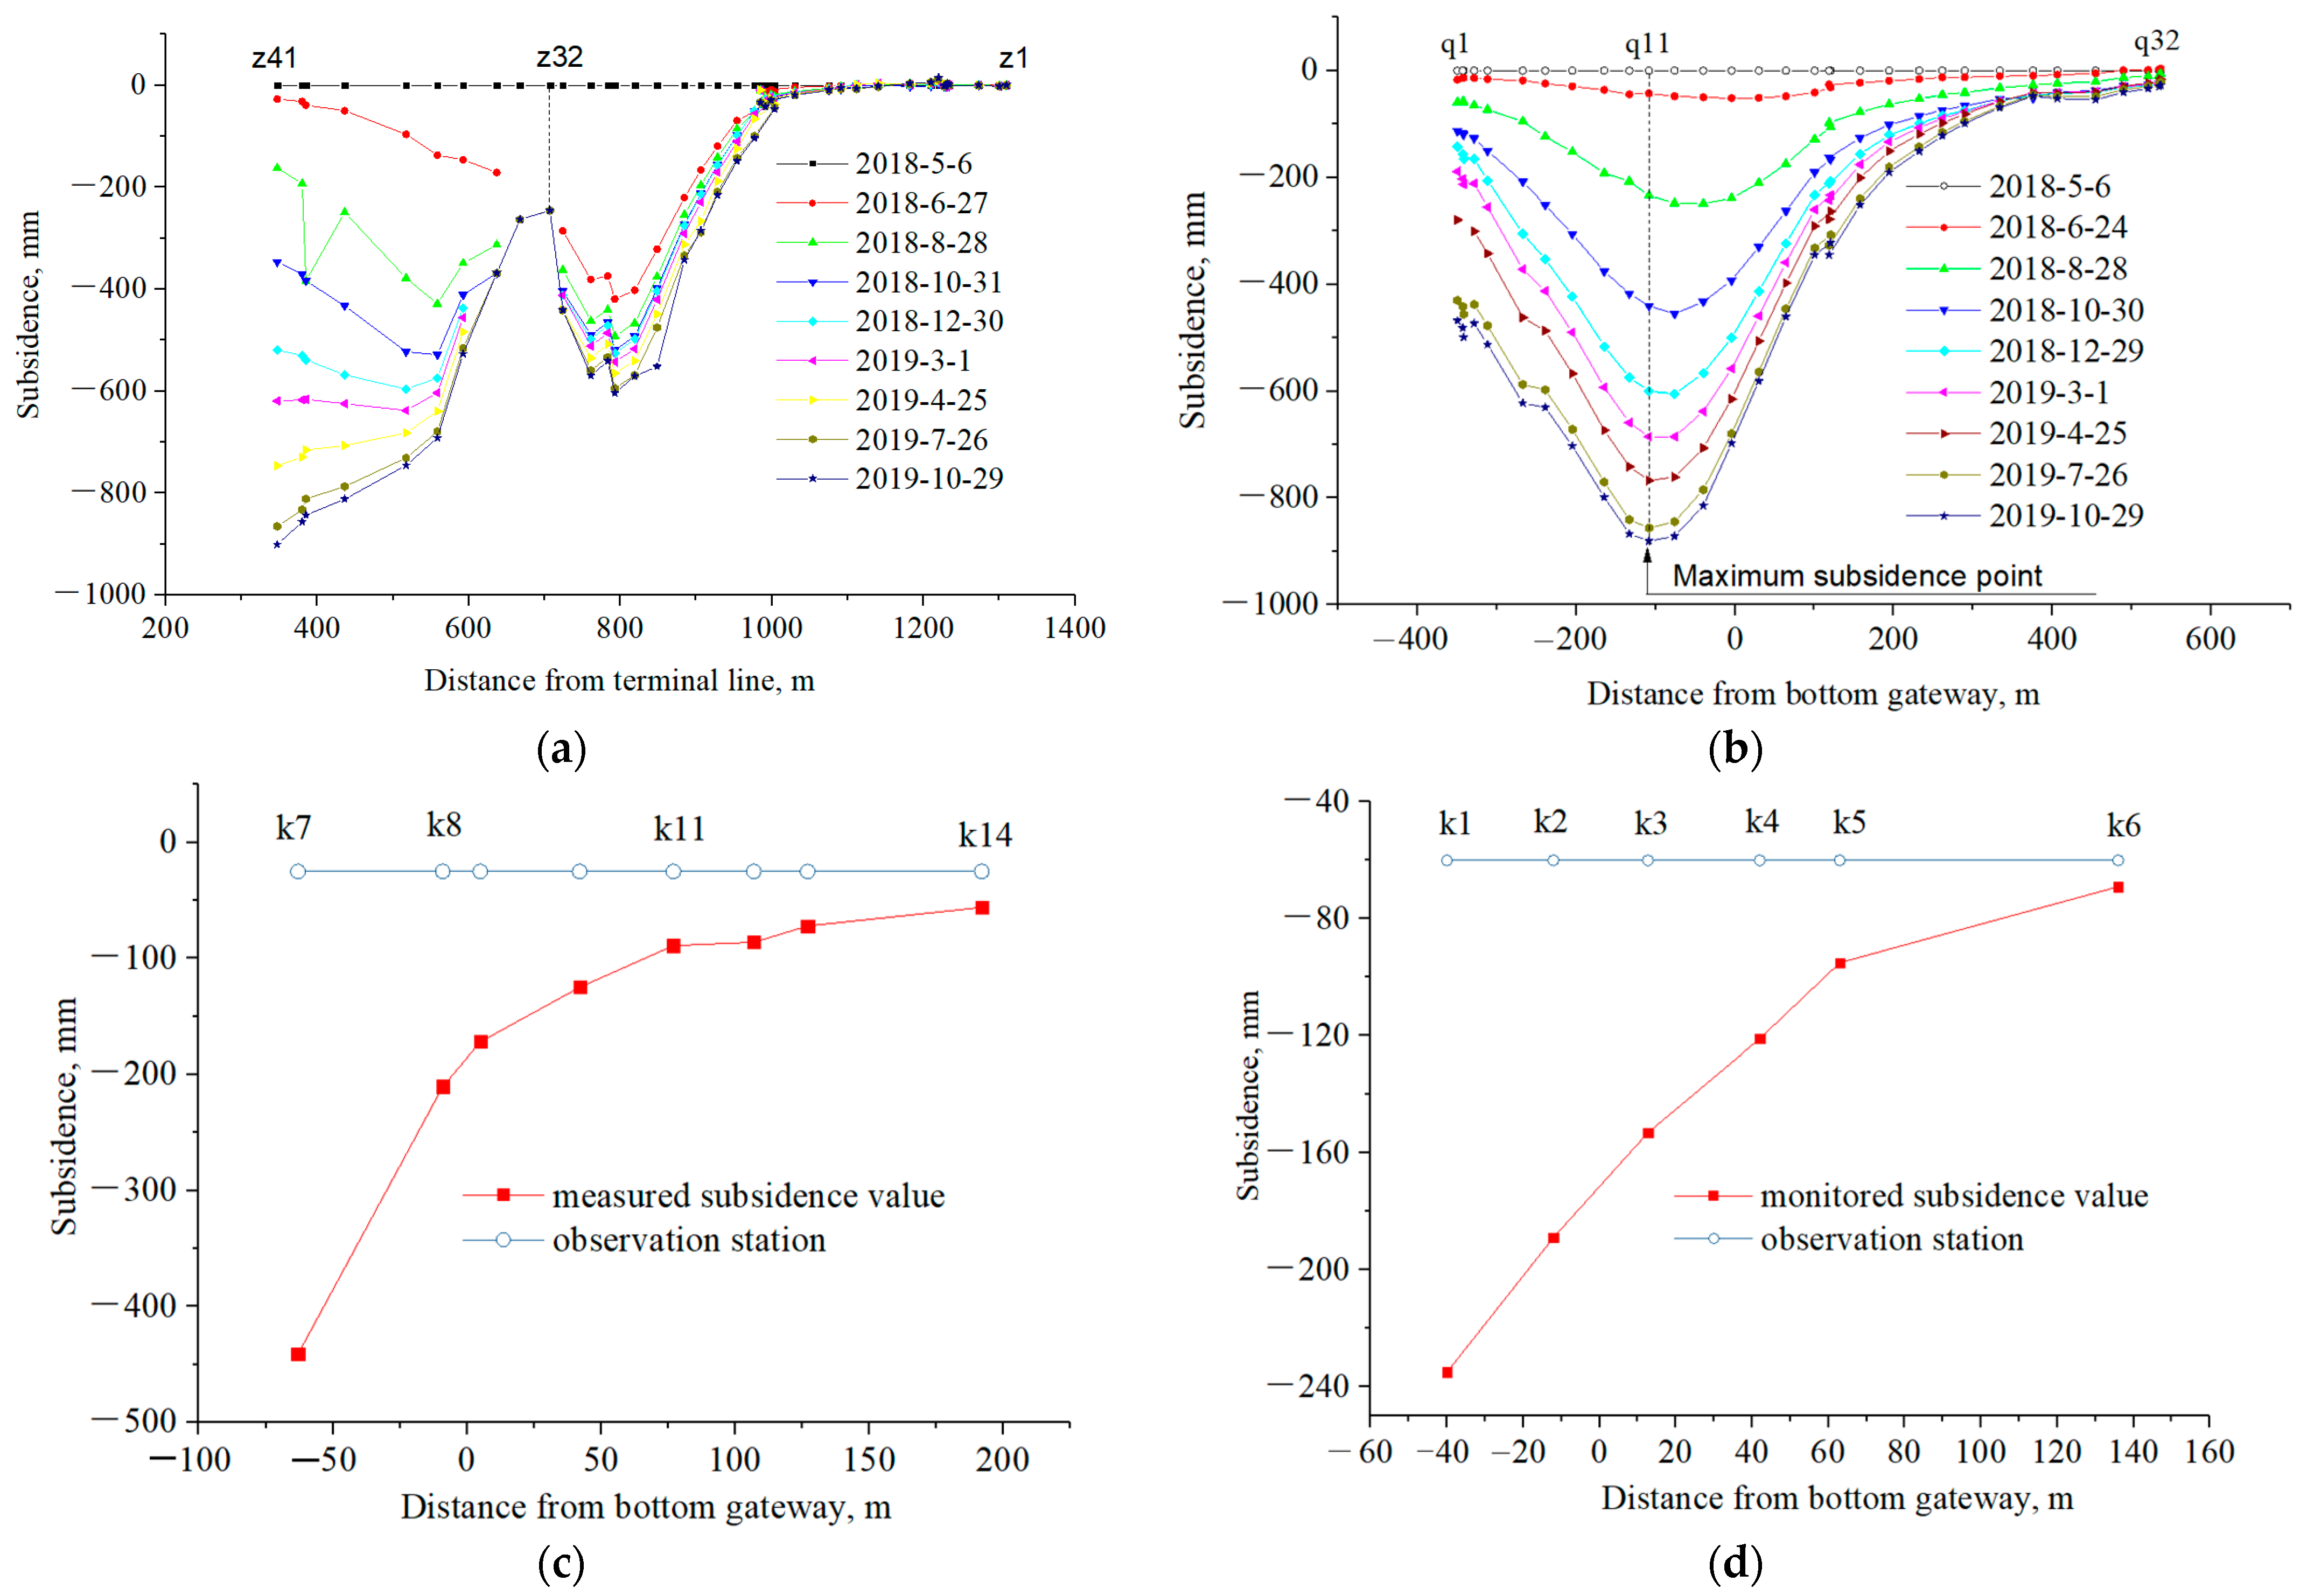
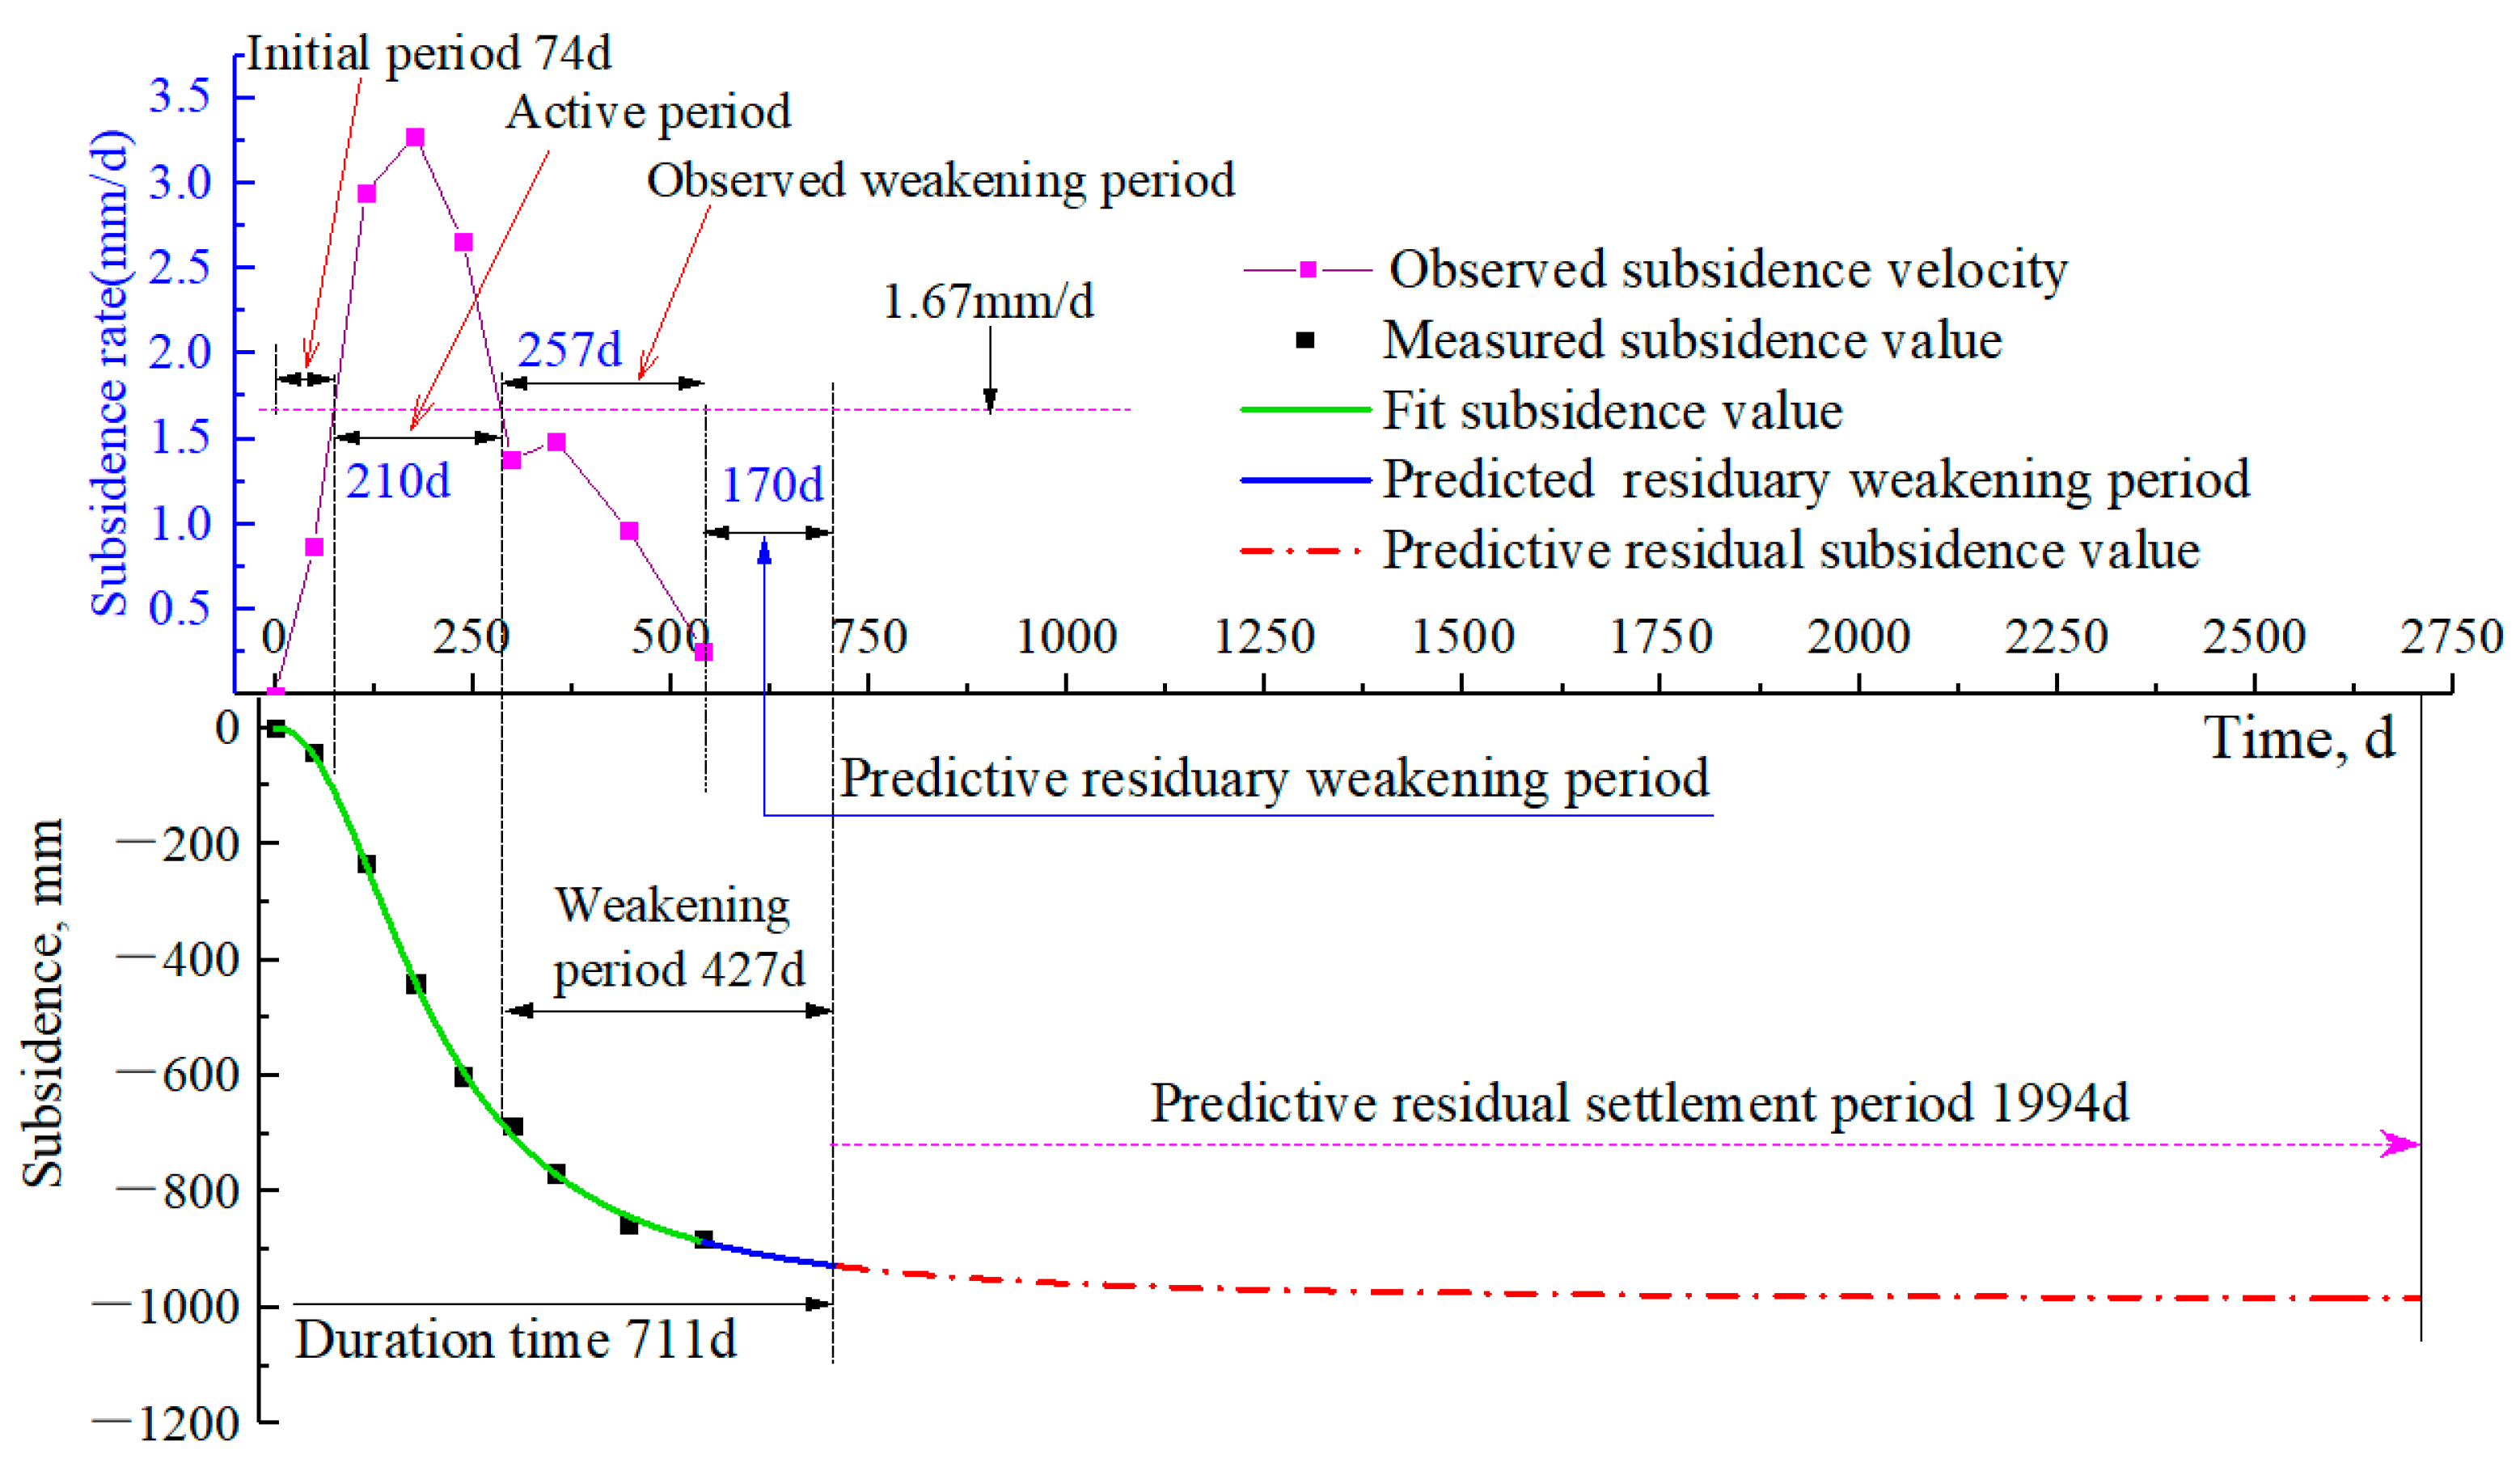
3.1.1. The Features of Surface Subsidence Based on In Situ Investigation

During longwall coal mining, periodical surface subsidence investigations were performed, with eight surface downward movement measurements implemented from 6 May 2018 to 29 October 2019 for surveying lines Z and Q (shown in Figure 4). The method conducted for periodical surface subsidence investigations is spirit levelling. The root mean square error of the results obtained was ±10 mm for the levelling route length of one kilometer. We can see from Figure 8a,b that the amount of surface subsidence and its extended scope of the trough gradually increased as the working face mining advanced. As surveying line Z was non-linearly laid out along surface countryside road, the subsidence curves fluctuated noticeably. In situ observed MSP is z40 with a subsidence value of 900 mm. Compared with surveying line Z, the shape for traverse surveying line Q is approximately linear, and monitored MSP is q11 with a subsidence value of 881 mm. In addition, the dynamic subsidence troughs are relatively gentle, with point q11 deviating toward decreasing direction of coalface. Figure 8c,d are subsidence curves of surveying lines K1 and K2, respectively, which indicates that subsidence values of observation stations increase gradually from west to east with a maximum subsidence value of 441 mm (point k7). Because of subcritical mining of the coalface, all the subsidence values are relatively small, regardless of the strike or dip surveying lines, and the surface subsidence ratio of maximum subsidence value to coal seam thickness is just 0.24.

3.1.2. Predictive Result of Dynamic Residual Subsidence

According to the time-series subsidence values at MSP q11 above the 15235 coal face, Equations (5) and (14) can be applied to back-calculate model parameters. The optimum values obtained for x0, p alongside qe are 196.643, 2.146, and 0.268. After inserting these parameter values into Equation (7), the duration of the surface subsidence was found to be 711 d, as shown in Figure 9.
It can be seen from Figure 9 that the initial period is relatively short, lasting 74 d. The corresponding subsidence increment is approximately 110 mm, accounting for 11.85% of the field observed maximum subsidence value. Meanwhile, the active period lasted for nearly 210 d and was much longer than the initial phase, the subsidence increment is 570 mm, accounting for 61.42% of the measured maximum subsidence. The monitored weakening period was about 257 d with a subsidence increment of 201 mm, accounting for 21.66% of the maximum subsidence. According to the value calculated within the duration, the predictive weakening period was 170 d with a surface settlement increment of 47 mm, accounting for 5.07% of the maximum subsidence. Substitute parameter values of x0, p alongside qe into Equation (10); the calculated value of ttotal is 2750 d. Therefore, the predictive residual subsidence period is 1994 d, approximately 5.54 years. Insert the three parameters obtained into Equations (11) and (12), and the surface subsidence coefficient and residual subsidence can be expressed via Equations (15) and (16):
q = 0.268   [ 1 1 / ( 1 + ( t / 196.643 ) 2.146 ] ( t 711 d )
W r ( t ) = 987   [ 1 / ( 1 + ( t / 196.643 ) 2.146 ) 3.467 e 3 ] ( 711 d < t 2750 d )
Without in situ measurement data during the residual subsidence period over surveying station q11, we cannot estimate the predictive precision of the model proposed in this study.

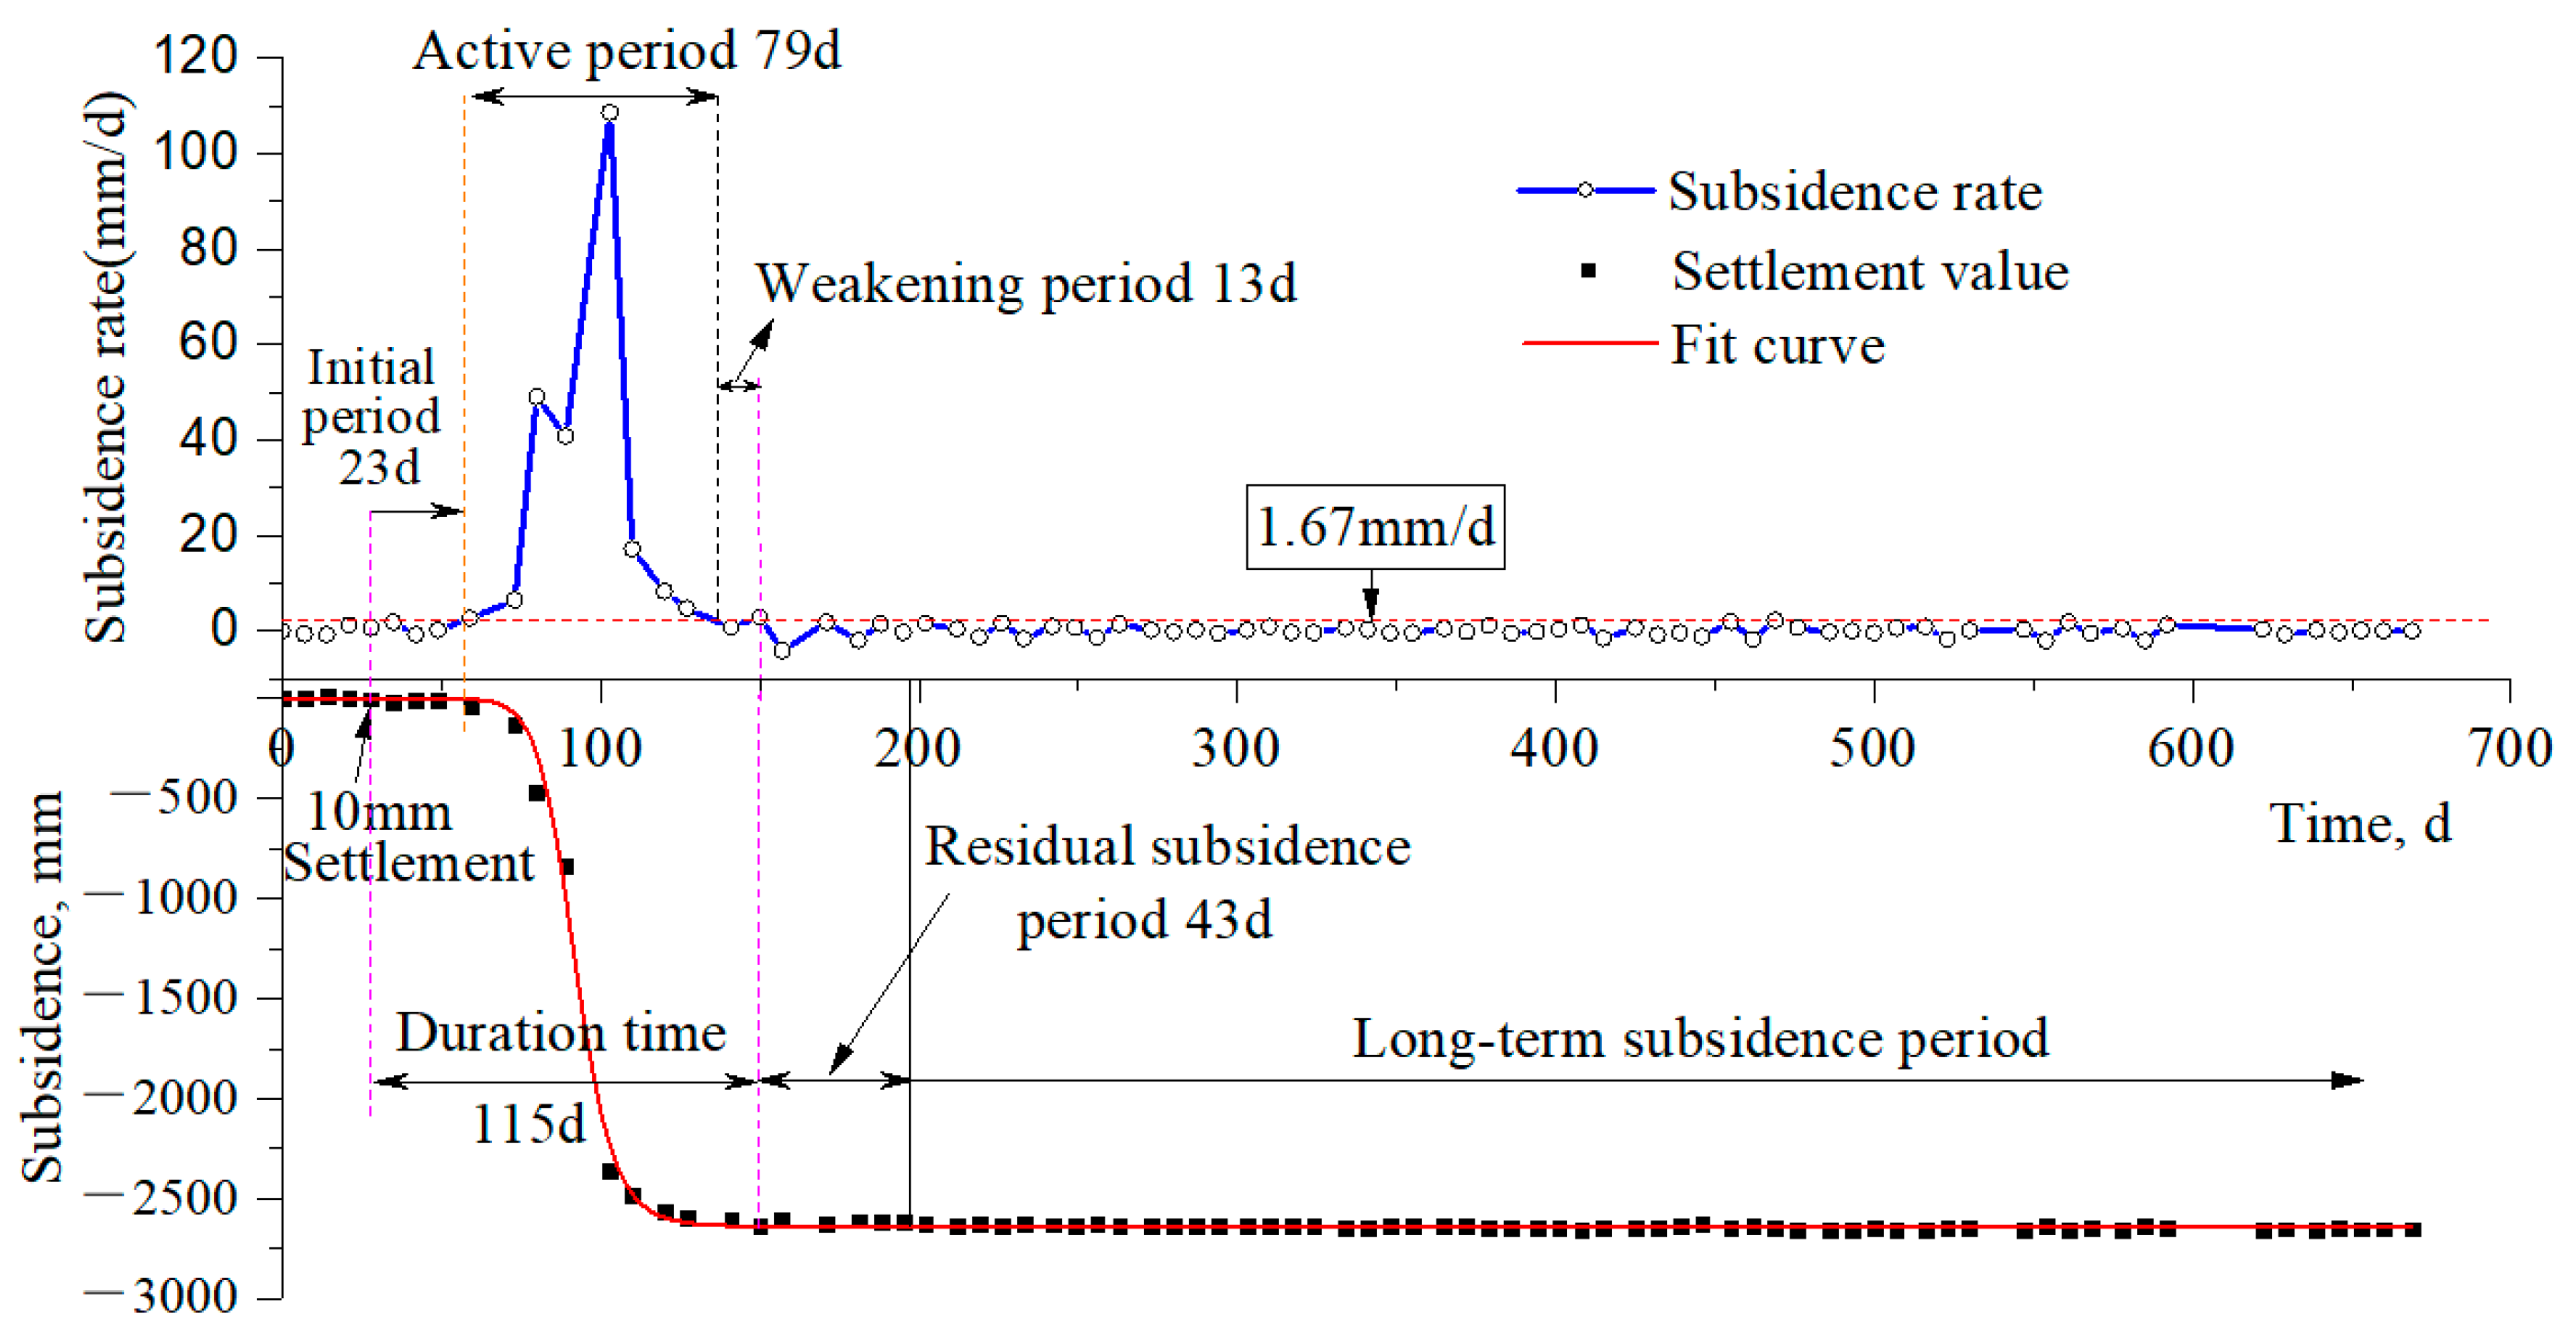
3.2. Calculation for Residual Subsidence over Supercritical Mining

3.2.1. Parameter Inversion

Based on investigated data of surveying station LX-2-4, Equation (4) parameters can be back-calculated using the methodology of least square adjustment over Equation (14). The parameters obtained were as follows: surface extreme subsidence coefficient qm was 0.91, x0 and p amounted to 92.04 and 15.16, respectively, with determination coefficient R2 equal to 0.998. Substitute these three parameters into Equations (7) and (10), then the duration and residual subsidence periods can be derived as 115 d and 43 d, respectively. Similarly, insert the parameters into Equations (11) and (12), and the surface subsidence coefficient within during time and residual subsidence values within the residual subsidence period can be expressed by Equations (17) and (18).
According to the field measurement data of surveying station LX-2-4 and back-calculated results (shown in Figure 10), the initial, active, weakening, and residual subsidence periods were 23 d, 79 d, 13 d, and 43 d, respectively. Correspondingly, surface sinking increments for each period were 57 mm, 2561 mm, 12 mm, and 10 mm, with the ratio of the subsidence increments to surface extreme subsidence values were equivalent to 2.16%, 97.01%, 0.45%, and 0.38%, respectively. The ratios of the time range to total time (long-term subsidence period not considered) were 14.56%, 50.00%, 8.23%, and 27.22%, respectively. The time-series subsidence of the LX-2-4 station reflects the subsidence induced by shallow mining operations in the Linxin colliery. The initial period is very short, the subsidence curve is steep, and the subsidence rate increases sharply within the active period, with quite a large subsidence increment. Accordingly, the surface movement and deformation are unusually intensive, with the maximum subsidence rate reaching 108 mm/d.
q = 0.91   [ 1 1 / ( 1 + ( t / 92.04 ) 15.16 ] ( t 1 50 d )
and
W r ( t ) = W ( t total ) W ( t ) = 2649 [ 1 / ( 1 + ( t 92.04 ) 15.16 ) 9.77 e 6 ] ( 1 50 d < t 1 97 d )

3.2.2. Validation of the Mathematical Model

According to Equation (14), the volume of observed data may affect parameter inversion results, thereby influencing the predictive results of residual subsidence. To analyze the influence of the volume of data on these model parameters and results, the investigated data for different observation time lengths over the LX-2-4 were selected to back-calculate model parameters. After that, the future surface subsidence could be predicted by substituting these derived parameters into Equation (12). The root mean square error (RMSE, Equation (19)) was used to estimate the predictive accuracy of surface subsidence [35]. The time-section selected, the parameters back-calculated and RMSE deduced are given in Table 1 and Figure 11. Here,
m = ± 1 n i = 1 n ( x i Δ ) 2
where m is the RMSE, n is the number of survey data, xi is the predicted value, and ∆ is in situ measurement.
Table 1 and Figure 11 demonstrate that stopping subsidence observation within the active period means that the deviations between measured and calculated values are exceptionally large. For example, with measurement times on 28 May 2015 and 7 June 2015, field observed maximum subsidence values are 2479 mm and 2563 mm, maximum deviations calculated are 272 mm and 82 mm with an RMSE of ±249 mm and ±48 mm, respectively (even though the R-squares are exceedingly high, reaching approximately 1). If terminating surface subsidence observation at a definite time within the weakening period, the deviation between predictive and investigated values decreases noticeably. For example, when the observation is made on 28 June 2015, the calculated maximum deviation and RMSE are 34 mm and ± 11 mm, respectively, close to the values derived from the data obtained during the residual subsidence period. Consequently, it is strongly recommended that subsidence measurement implemented above mined-out voids not be terminated until its subsidence rate extends beyond the active period to the residual subsidence period. Thus, the RMSE and maximum deviation between theoretical values and in situ observed values are also relatively small.

4. Discussion

4.1. Spatiotemporal Integrity Analysis over Logistic Time Function

The time function plays a key role in predicting progressive surface subsidence due to longwall coal mining. Therefore, downward surface movement, sinking velocity, and the acceleration time function should reflect the actual movement of the surface. To study the spatiotemporal distribution of the logistic time function, the first and second derivatives of t can be derived in terms of Equation (5) as Equations (20) and (21):
v maxp ( t ) = ϕ ( t ) W e = p x 0 t p 1 ( x 0 p + t p ) 2 W e
and
a maxp ( t ) = ϕ ( t ) W e = p x 0 p t p 2 [ x 0 p ( p 1 ) t p ( p + 1 ) ] ( x 0 p + t p ) 3 W e
where vmax(t) and amax(t) are the surface subsidence rate and acceleration, respectively, for MSP over t.
Regarding Equations (20) and (21), variation of We can only transform the extremum of vmax(t) and amax(t) but cannot convert their functional curve forms. Therefore, providing We = 1 is acceptable to study the subsidence, subsidence rate, and subsidence acceleration curves, which can be plotted based on Equations (5), (20) and (21). Figure 12a–c show the sinking, subsidence rate, and subsidence acceleration curves, respectively. For each of them, x0 equals 4, 5, 6, and 10, respectively, while p is a constant equal to 3. Figure 12d–f are plotted subsidence, subsidence rate, and subsidence acceleration curves, respectively. For each, p is 2, 3, 4, and 7, respectively, whereas x0 is 5. Figure 12 shows that subsidence curves have an ‘S’ shape, whose values increase from 0 to 1 gradually; subsidence rate curves rise from 0 to vmax, then decrease to 0, and subsidence acceleration curves rise initially from 0 to the maximum positive acceleration +amax, then fall to the maximum negative acceleration −amax, and eventually fall to 0. In addition, the subsidence rate curves can also express symmetric or asymmetric features with the variation of parameters involved in the logistic time function, which proves to be an ideal time function to calculate residual surface subsidence induced by longwall coal mining.

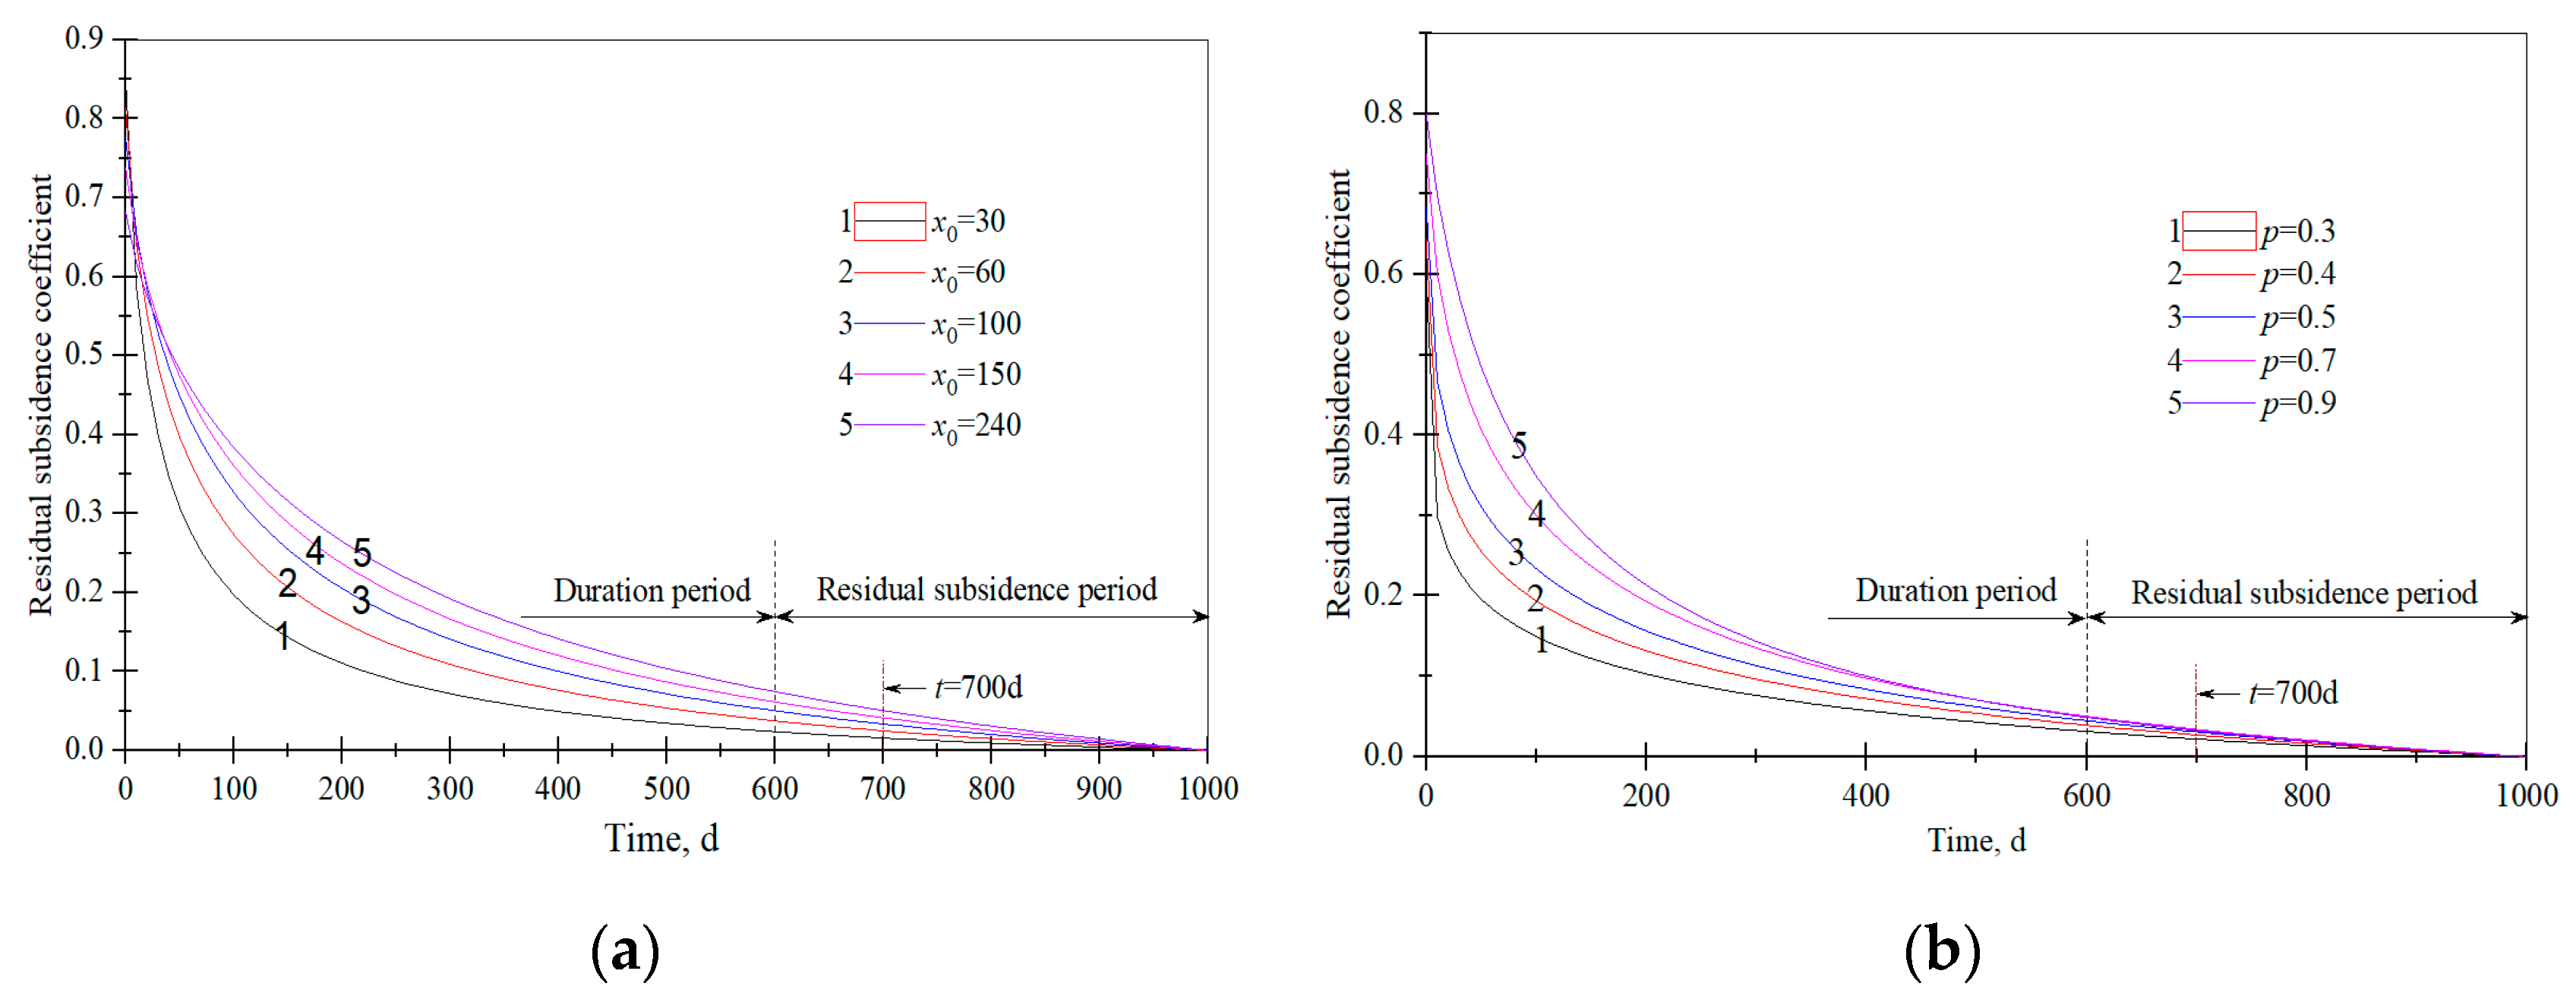
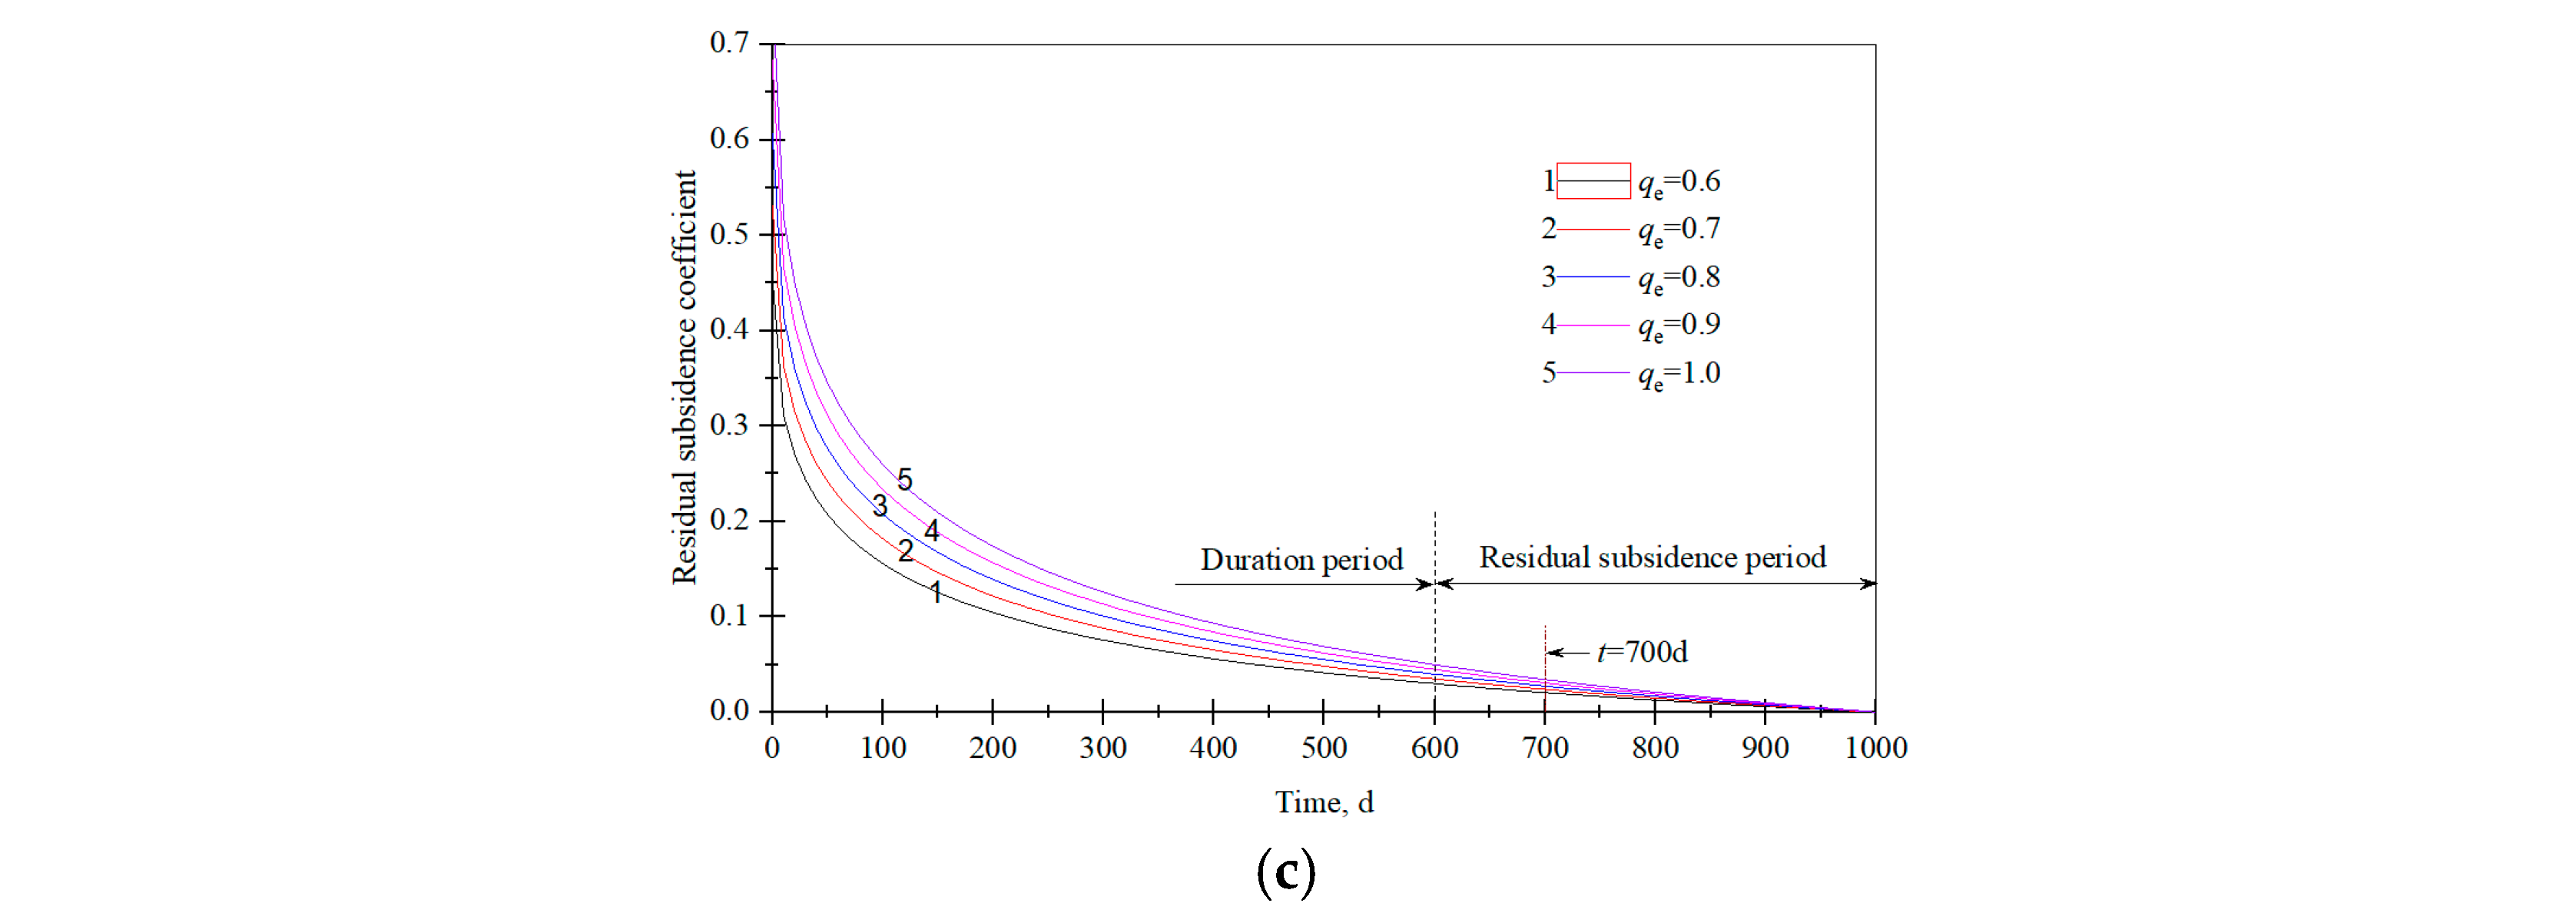
4.2. Evolution of Residual Subsidence Coefficient

According to Equation (13), the parameters p, x0, and qe are closely related to the surface residual subsidence coefficient. A quantitative analysis of the correlation of residual subsidence coefficient and model parameters assumes that duration time and residual subsidence period are 600 d and 400 d, respectively. The influences of logistic time function parameters x0 and p on the residual subsidence coefficient over time are shown in Figure 13. The figure shows that the residual subsidence coefficient decreases gradually to zero with time and varies directly with the values of p, x0, and qe. For a given time (e.g., t = 700 d, when the value of x0 amounts to 30, 60, 100, 150, and 240), the corresponding surface residual subsidence coefficients are 0.016, 0.025, 0.033, 0.041, and 0.049, respectively. When p takes the values of 0.3, 0.4, 0.5, 0.7, and 0.9, the corresponding surface residual subsidence coefficients are 0.021, 0.027, 0.030, 0.032, and 0.034, respectively. When the value of qe is 0.6, 0.7, 0.8, 0.9, and 1.0, the surface residual subsidence coefficients equal 0.020, 0.023, 0.027, 0.030, and 0.034, respectively.

5. Conclusions

Most collieries closed or to be closed are located in coal resource-rich cities in China. With increasing urbanization, factors such as land reutilization, underground space utilization, and city planning above abandoned goafs are becoming increasingly urgent. The findings in this paper should provide strong scientific support for infrastructure constructions and project designs of surface subsidence measurement and for stability estimation of mining-induced surface subsidence areas. The conclusions drawn from this paper are as follows:
(1)
The logistic time function is essentially an ideal mathematical model. It can render the general evolution of surface subsidence from downward surface movement, subsidence rate, and sinking acceleration; the function can be utilized to predict time-dependent surface subsidence induced by an underground mining operation.
(2)
Considering the surface subsidence rate over MSP within subsidence basin, the timeline of the entire surface subsidence process from the outset to termination is divided into three periods: the duration period, residual subsidence period, and a long-term subsidence period. Based on this classification and the logistic time function, this study proposes a novel mathematical model for calculating surface progressive residual subsidence. The surface duration period and residual subsidence period are theoretically separated following the threshold of surface subsidence rate. The surface residual subsidence coefficient varies inversely with time and directly with the model parameters involved in the proposed model.
(3)
The validation of the mathematical model proposed is verified through field investigations. Back-calculating the parameters with the mathematical model, we found that the greater the volume of in situ data, the more accurate the predictive results of residual surface subsidence becomes. Suppose observation of surface subsidence induced by longwall coal mining is stopped within an active period. In that case, the precision of parameter inversion becomes much lower than that deduced with all of the data. Therefore, it is strongly recommended that subsidence measurement implemented above mined-out voids not be terminated until the surface subsidence rate extends beyond the active period. Only then can back-calculated parameters with field-based data be reliable in predicting forthcoming surface residual subsidence.
We must point out that our research is based on in situ continuous surface subsidence induced by underground longwall coal operations. In this way, predictive results are in agreement with the measurements obtained in the field. For predicting non-continuous surface subsidence, step-form subsidence prompted by overburden fractures or fault reactivation, and abrupt surficial collapse induced by unknown reasons, need to be further investigated.

Author Contributions

C.L.: Conceptualization, Writing—Original Draft, Funding acquisition. L.D.: Investigation, Data Curation, Visualization. X.C.: Resources, Supervision. Y.Z.: Term, Methodology, Writing—Review & Editing, Funding acquisition. Y.H.: Validation. W.Z.: Formal analysis. Z.B.: Project administration. All authors have read and agreed to the published version of the manuscript.

Funding

This work was supported by the National Natural Science Foundation of China [grant number 51474217]; the State Key Project of National Natural Science Foundation of China-Shanxi Joint Foundation on Coal Based Low Carbon [grant number U1810203]; the Natural Science United Foundation of Hebei Province, China [grant number E2020402086] and the Program of Youth Backbone Teachers in Henan province of China [grant number 2019GGJS059].

Acknowledgments

We would like to express our sincere gratitude to all financial supports, especially to Jizhong Energy Group Co., Ltd. of China and the Land Resources Survey and Monitoring Institute of Ningxia Hui Autonomous Region for their data support. Besides, we also give our appreciation to the editors and reviewers for their contributions on this paper.

Conflicts of Interest

The authors declare that they have no known competing financial interest or personal relationship that could have appeared to influence the work reported in this paper.

References

  1. Salmi, E.F.; Nazem, M.; Karakus, M. Numerical analysis of a large landslide induced by coal mining subsidence. Eng. Geol. 2017, 217, 141–152. [Google Scholar] [CrossRef]
  2. Vervoort, A.; Declercq, P. Surface movement above old coal longwalls after mine closure. Int. J. Min. Sci. Technol. 2017, 27, 481–490. [Google Scholar] [CrossRef]
  3. Vervoort, A. The Time Duration of the Effects of Total Extraction Mining Methods on Surface Movement. Energies 2020, 13, 4107. [Google Scholar] [CrossRef]
  4. Guo, Q.; Meng, X.; Li, Y.; Lv, X.; Liu, C. A prediction model for the surface residual subsidence in an abandoned goaf for sustainable development of resource-exhausted cities. J. Clean. Prod. 2021, 279, 123803. [Google Scholar] [CrossRef]
  5. Tajdu’s, K.; Sroka, A.; Misa, R.; Hager, S.; Rusek, J.; Dudek, M.; Wollnik, F. Analysis of Mining-Induced Delayed Surface Subsidence. Minerals 2021, 11, 1187. [Google Scholar] [CrossRef]
  6. British Petroleum. BP Statistical Review of World Energy 2020|69th Edition [R/OL]; Royal Dutch/Shell Group: London, UK, 2021; Available online: https://www.bp.com/en/global/corporate/energy-economics/statistical-review-of-world-energy.html (accessed on 5 March 2022).
  7. National Bureau of Statistics. China Statistical Yearbook 2020; China Statistical Press: Beijing, China, 2021. [Google Scholar]
  8. Marian, D.; Onica, I. Analysis of the Geomechanical Phenomena that led to the appearance of sinkholes at the Lupeni Mine, Romania, in the conditions of thick coal seams mining with longwall top coal caving. Sustainability 2021, 13, 6449. [Google Scholar] [CrossRef]
  9. Cai, Y.; Li, X.; Xiao, W.; Zhang, W. Simulation of Mining-Induced Ground Damage Using Orthogonal Experiments to Determine Key Parameters of Super-Large Coalface: A Case Study in Shendong Coalfield in China. Appl. Sci. 2020, 10, 2258. [Google Scholar] [CrossRef] [Green Version]
  10. Booth, C. Groundwater as an environmental constraint of longwall coal mining. Environ. Geol. 2006, 49, 796–803. [Google Scholar] [CrossRef]
  11. Loupasakis, C.; Angelitsa, V.; Rozos, D. Mining geohazards—Land subsidence caused by the dewatering of opencast coal mines: The case study of the Amyntaio coal mine, Florina, Greece. Nat. Hazards 2014, 70, 675–691. [Google Scholar] [CrossRef]
  12. China National Coal Association. Coal Industry Development Report 2020 of China [EB/OL]. 2021. Available online: http://www.coalchina.org.cn (accessed on 7 March 2022).
  13. He, S.; Lee, J.; Zhou, T.; Wu, D. Shrinking cities and resource-based economy: The economic restructuring in China’s mining cities. Cities 2017, 60, 75–83. [Google Scholar] [CrossRef]
  14. The State Council. Several Opinions of the State Council on Promoting the Sustainable Development of Resource-Based Cities. Government Document, 2007. Available online: https://wenku.baidu.com/view/347d5b690266f5335a8102d276a20029bd6463ba.html (accessed on 7 March 2022).
  15. The State Council. The Plan for the Sustainable Development of Resource-Based Cities in China (2013–2020). Government Document, 2013. Available online: http://www.gov.cn/zfwj/2013-12/03/content_2540070.htm (accessed on 7 March 2022).
  16. Cui, X.; Zhao, Y.; Wang, G.; Zhang, B.; Li, C. Calculation of Residual Surface Subsidence Above Abandoned Longwall Coal Mining. Sustainability 2020, 12, 1528. [Google Scholar] [CrossRef] [Green Version]
  17. Peng, S.S. Coal Mine Ground Control; Department of Mining Engineering, West Virginia University: Morgantown, WV, USA, 2006. [Google Scholar]
  18. Cui, X.; Wang, J.; Liu, Y. Prediction of progressive surface subsidence above longwall coal mining using a time function. J. Rock Mech. Min. 2001, 38, 1057–1063. [Google Scholar] [CrossRef]
  19. Peng, S.S. Surface Subsidence Engineering; The Society for Mining, Metallurgy, and Exploration, Inc.: Englewood, CO, USA, 1992. [Google Scholar]
  20. He, G.; Yang, L.; Ling, G. Mining Subsidence; Coal Industry Press: Beijing, China, 1992. [Google Scholar]
  21. Guo, W. Coal Mining Impairment and Protection; Coal Industry Press: Beijing, China, 2013. [Google Scholar]
  22. Asadi, A.; Shakhriar, K.; Goshtasbi, K. Profiling function for surface subsidence prediction in mining inclined coal seams. J. Min. Sci. 2004, 40, 142–146. [Google Scholar] [CrossRef]
  23. Ren, G.; Li, G.; Kulessa, M. Application of a Generalised Influence Function Method for Subsidence Prediction in Multi-seam Longwall Extraction. Geotech. Geol. Eng. 2014, 32, 1123–1131. [Google Scholar] [CrossRef]
  24. Cui, X.; Li, C.; Hu, Q.; Miao, X. Prediction of surface subsidence due to underground mining based on the zenith angle. Int. J. Rock Mech. Min. 2013, 60, 246–252. [Google Scholar] [CrossRef]
  25. Nicieza, C.; Fernandez, M. The new three-dimensional subsidence influence function denoted by n-k-g. Int. J. Rock Mech. Min. 2005, 42, 372–387. [Google Scholar] [CrossRef]
  26. Lokhande, R.; Murthy, V.; Singh, K. Predictive models for pot-hole depth in underground coalmining—Some Indian experiences. Arab. J. Geosci. 2014, 7, 4697–4705. [Google Scholar] [CrossRef]
  27. Yuan, Y.; Li, H.; Zhang, H.; Zhang, Y.; Zhang, X. Improving Reliability of Prediction Results of Mine Surface Subsidence of Northern Pei County for Reusing Land Resources. Appl. Sci. 2020, 10, 8385. [Google Scholar] [CrossRef]
  28. Xu, J.; Zhu, W.; Xu, J.; Wu, J.; Li, Y. High-intensity longwall mining-induced ground subsidence in Shendong coalfield, China. Int. J. Rock Mech. Min. 2021, 141, 104730. [Google Scholar] [CrossRef]
  29. Hu, B.; Zhang, H.; Shen, B. Specification for Coal Pillar Retention/Retaining and Coal Mining under Buildings, Water Bodies, Railways and Main/Major Roadways; Coal Industry Publishing Press: Beijing, China, 2017. [Google Scholar]
  30. Zheng, M.; Deng, K.; Fan, H.; Du, S. Monitoring and Analysis of Surface Deformation in Mining Area Based on InSAR and GRACE. Remote Sens. 2018, 10, 1392. [Google Scholar] [CrossRef] [Green Version]
  31. Modeste, G.; Doubre, C.; Masson, F. Time evolution of mining-related residual subsidence monitored over a 24-year period using InSAR in southern Alsace, France. Int. J. Appl. Earth Obs. Geoinf. 2021, 102, 102392. [Google Scholar] [CrossRef]
  32. Guéguen, Y.; Deffontaines, B.; Fruneau, B.; Heib, M.; Michele, M.; Raucoules, D.; Guise, Y.; Planchenault, J. Monitoring residual mining subsidence of Nord/Pas-de-Calais coal basin from differential and Persistent Scatterer Interferometry (Northern France). J. Appl. Geophys. 2009, 69, 24–34. [Google Scholar] [CrossRef]
  33. Bazaluk, O.; Rysbekov, K.; Nurpeisova, M.; Lozynskyi, V.; Kyrgizbayeva, G.; Turumbetov, T. Integrated monitoring for the rock mass state during large-scale subsoil development. Front. Environ. Sci. 2022, 10, 852591. [Google Scholar] [CrossRef]
  34. Chen, D.; Chen, H.; Zhang, W.; Cao, C.; Zhu, K.; Yuan, X.; Du, Y. Characteristics of the Residual Surface Deformation of Multiple Abandoned Mined-Out Areas Based on a Field Investigation and SBAS-InSAR: A Case Study in Jilin, China. Remote Sens. 2020, 12, 3752. [Google Scholar] [CrossRef]
  35. Blachowski, J.; Kope´, A.; Milczarek, W.; Owczarz, K. Evolution of Secondary Deformations Captured by Satellite Radar Interferometry: Case Study of an Abandoned Coal Basin in SW Poland. Sustainability 2019, 11, 884. [Google Scholar] [CrossRef] [Green Version]
  36. Li, C.; Gao, Y.; Cui, X.; Yuan, D.; He, R. Spatiotemporal evolution of surface subsidence induced by fully-mechanized thick coal underground mining in Yunjialing colliery. J. Min. Saf. Eng. 2019, 36, 37–43. [Google Scholar] [CrossRef]
  37. Knothe, S. Effect of time on formation of basin subsidence. Arch. Min. Steel Ind. 1953, 1, 1–7. [Google Scholar]
  38. Wang, B.; Xu, J.; Xuan, D. Time function model of dynamic surface subsidence assessment of grout-injected overburden of a coal mine. Int. J. Rock Mech. Min. 2018, 104, 1–8. [Google Scholar] [CrossRef]
  39. Zhang, L.; Cheng, H.; Yao, Z.; Wang, X. Application of the Improved Knothe Time Function Model in the Prediction of Ground Mining Subsidence: A Case Study from Heze City, Shandong Province, China. Appl. Sci. 2020, 10, 3147. [Google Scholar] [CrossRef]
  40. Kwinta, A.; Hejmanowski, R.; Sorka, A. A time function analysis used for the prediction of rock mass subsidence. In Proceedings of the International Symposium on Mining Science and Technology, Xuzhou, China, 16–18 October 1996; pp. 419–424. [Google Scholar]
  41. Gonzalez-Nicieza, C.; Alvarez-Fernandez, M.; Menendez-Diaz, A.; Alvarez-Vigil, A. The influence of time on subsidence in the Central Asturian Coal field. Bull. Eng. Geol. Environ. 2007, 66, 319–329. [Google Scholar] [CrossRef]
  42. Peng, X.; Cui, X.; Zang, Y. Time function and prediction of progressive surface movements and deformations. J. Univ. Sci. Technol. Beijing 2004, 26, 341–344. [Google Scholar] [CrossRef] [Green Version]
  43. Nie, L.; Wang, H.; Xu, Y. Application of the arctangent function model in the prediction of ground mining subsidence deformation: A case study from Fushun City, Liaoning Province, China. Bull. Eng. Geol. Environ. 2017, 76, 1383–1398. [Google Scholar] [CrossRef]
  44. Kowalaki, A. Surface subsidence and rate of its increments based on measurements and theory. Arch. Min. Sci. 2001, 46, 391–406. [Google Scholar]
  45. Hu, H.; Zhao, Y.; Kang, J.; Liang, W. Related laws and verification of mined-out area span, time and residual deformation. Chin. J. Rock Mech. Eng. 2008, 27, 65–71. [Google Scholar] [CrossRef]
Figure 1. Subsidence process for surface point P during longwall coal mining: number 1, 2, and 3 represent progressive surface subsidence curves for different wall location; and number 4 refers to final surface subsidence curve.
Energies 15 05024 g001
Figure 2. Surface movement process for MSP during longwall coal mining.
Energies 15 05024 g002
Figure 3. The stratigraphic sequence graph for the panel 132153.
Energies 15 05024 g003
Figure 4. Schematic diagram of the Wannian coalmine location and layout of surface movement monitoring landmarks above 15235 workface.
Energies 15 05024 g004
Figure 5. Schematic diagram of the Lingxin colliery location and automatic surveying stations above 051603 coalface.
Energies 15 05024 g005
Figure 6. Photographs of surface sinking observation stations: (a) GNSS reference station, (b) Working station.
Energies 15 05024 g006
Figure 7. Settlement curves of GNSS observation stations.
Energies 15 05024 g007
Figure 8. Field observed subsidence curves for different surveying lines: (a) line Z; (b) line Q; (c) line K1; (d) line K2.
Energies 15 05024 g008
Figure 9. Predictive results for weakening period and residual subsidence period in terms of maximum subsidence point.
Energies 15 05024 g009
Figure 10. Period values calculated for each temporal sections of surface subsidence over surveying station LX-2-4.
Energies 15 05024 g010
Figure 11. The influence of the amounts of in situ data on back-calculated parameters and predicted values: (a) subsidence rate curve, (b,c) represent stopping observation within active period, (d) presents stopping observation within weakening period, (e,f) show stopping observation within residual subsidence period and long-term subsidence period, respectively.
Energies 15 05024 g011
Figure 12. Surface subsidence, sinking rate, and subsidence acceleration curves based on logistic time function: (a) subsidence curves (p = 3); (b) subsidence rate curves (p = 3); (c) subsidence acceleration curves (p = 3); (d) subsidence curves (x0 = 5); (e) subsidence rate curves (x0 = 5); (f) subsidence acceleration curves (x0 = 5).
Energies 15 05024 g012
Figure 13. Diagrams of the influence of model parameters on residual subsidence coefficient over time: (a) the influence of model parameters x0 on residual subsidence coefficient; (b) the influence of model parameters p on residual subsidence coefficient; (c) the influence of model parameters qe on residual subsidence coefficient.
Energies 15 05024 g013aEnergies 15 05024 g013b
Table 1. The influence of amount of observation data on model parameters derived and predictive precision of residual surface subsidence for different time-section: q is the coefficient of surface subsidence; x0 and p are parameters associated with the lithology of overlying strata; R2 is the coefficient of determination.
Time-SectionTime, dPeriodMax. Subsidence Value, mmDerived Model ParametersR-SquareMaximum Deviation, mmRMSE, mm
qx0pR2
7 February 2015–28 May 2015110Active24790.99293.7712.910.993272±249
7 February 2015–7 June 2015120Active25630.92392.3614.560.99482±48
7 February 2015–28 June 2015141Weakening26050.90592.0215.210.99634±11
7 February 2015–14 August 2015188Residual26180.90191.9315.410.99735±9
7 February 2015–7 December 2016669Long-term 26490.90692.0415.160.998--
Publisher’s Note: MDPI stays neutral with regard to jurisdictional claims in published maps and institutional affiliations.

