
Isobaric Expansion Engine Compressors: Thermodynamic Analysis of the Simplest Direct Vapor-Driven Compressors


Abstract
:1. Introduction
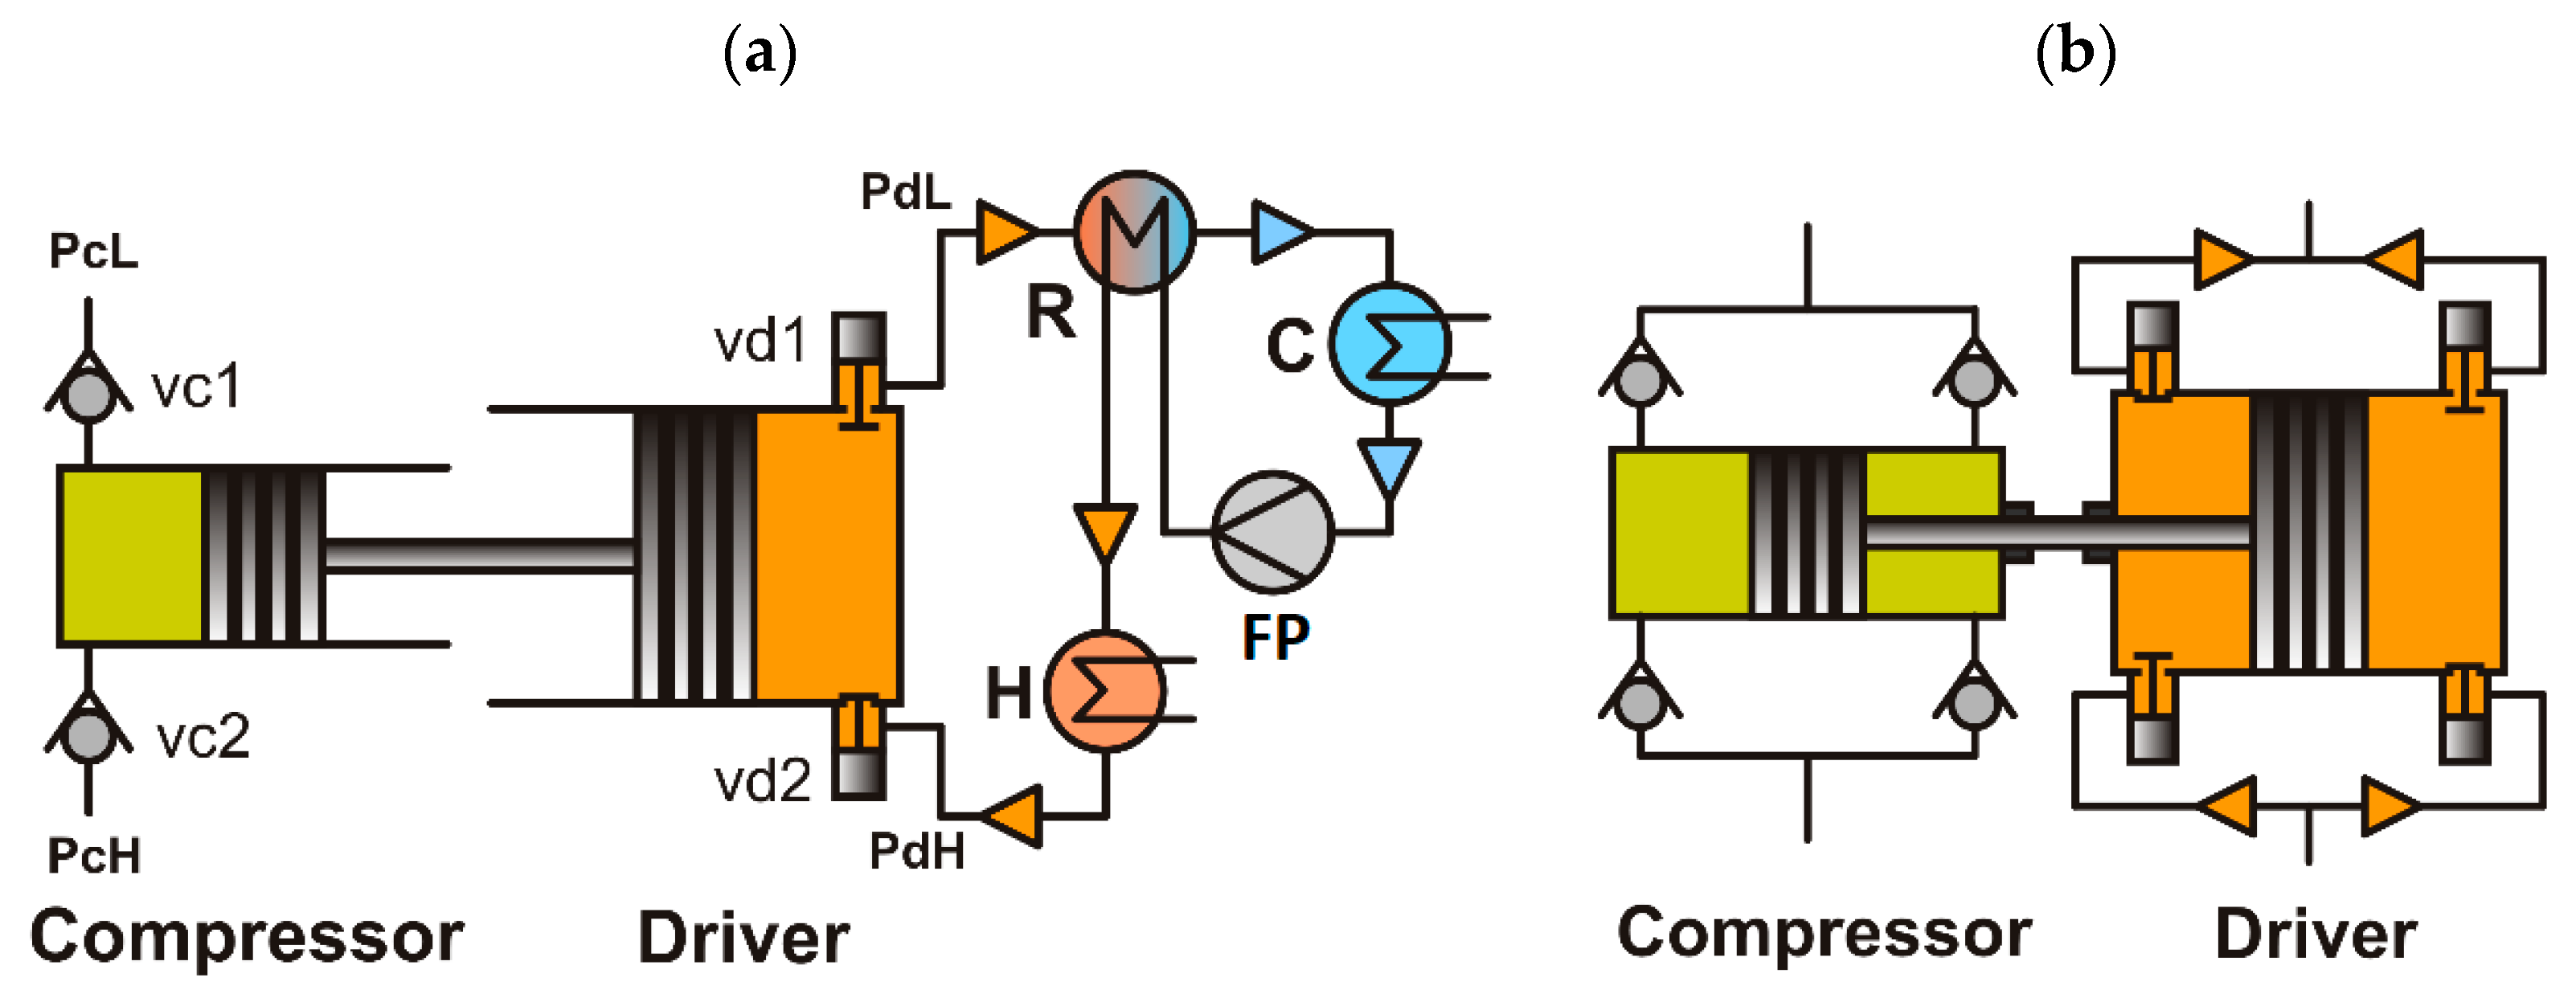
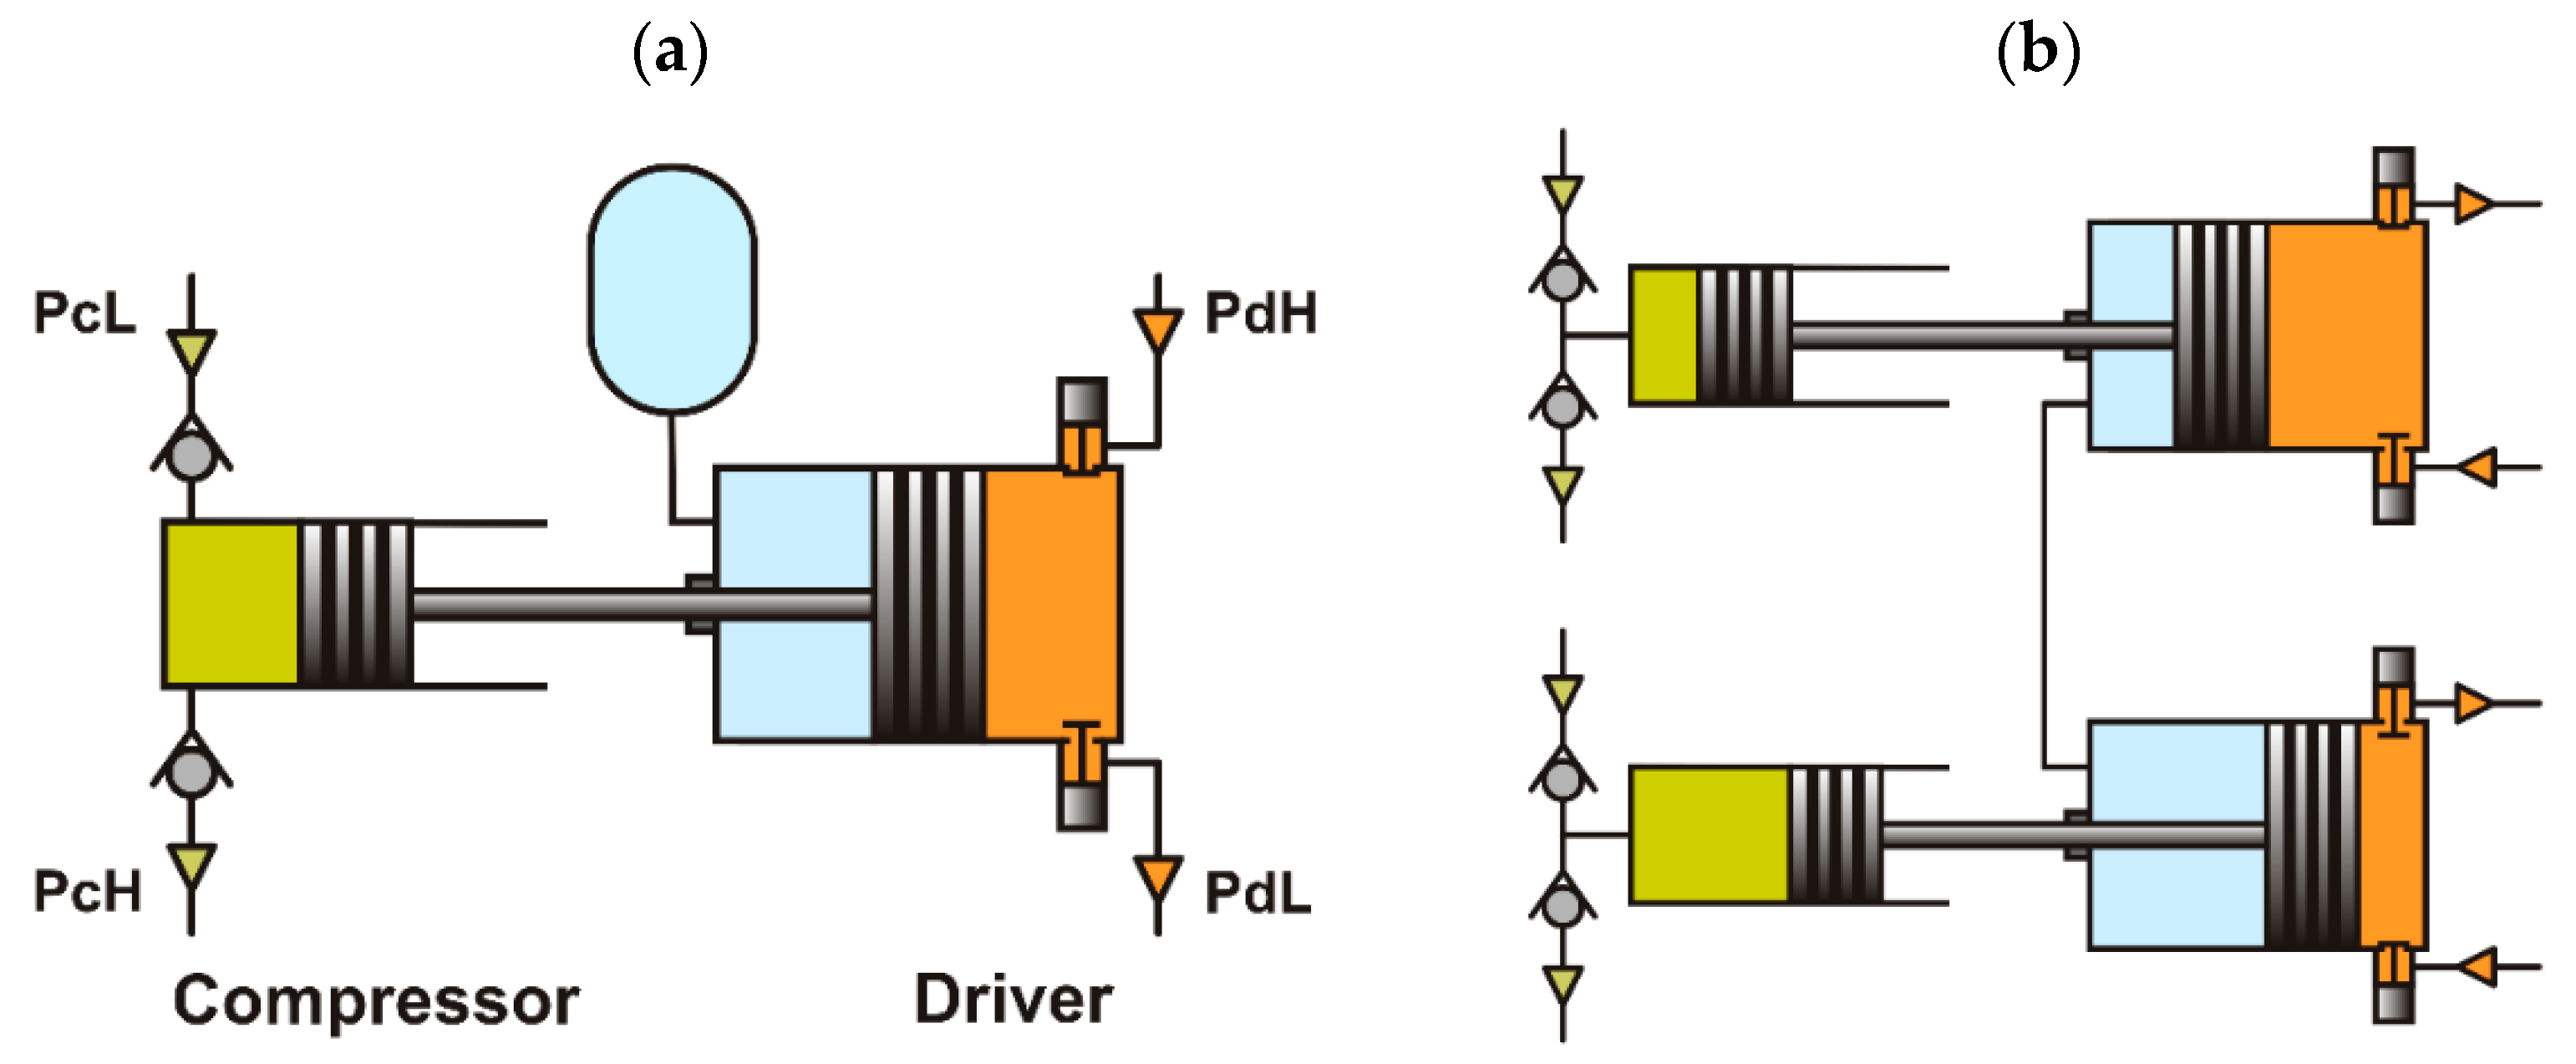
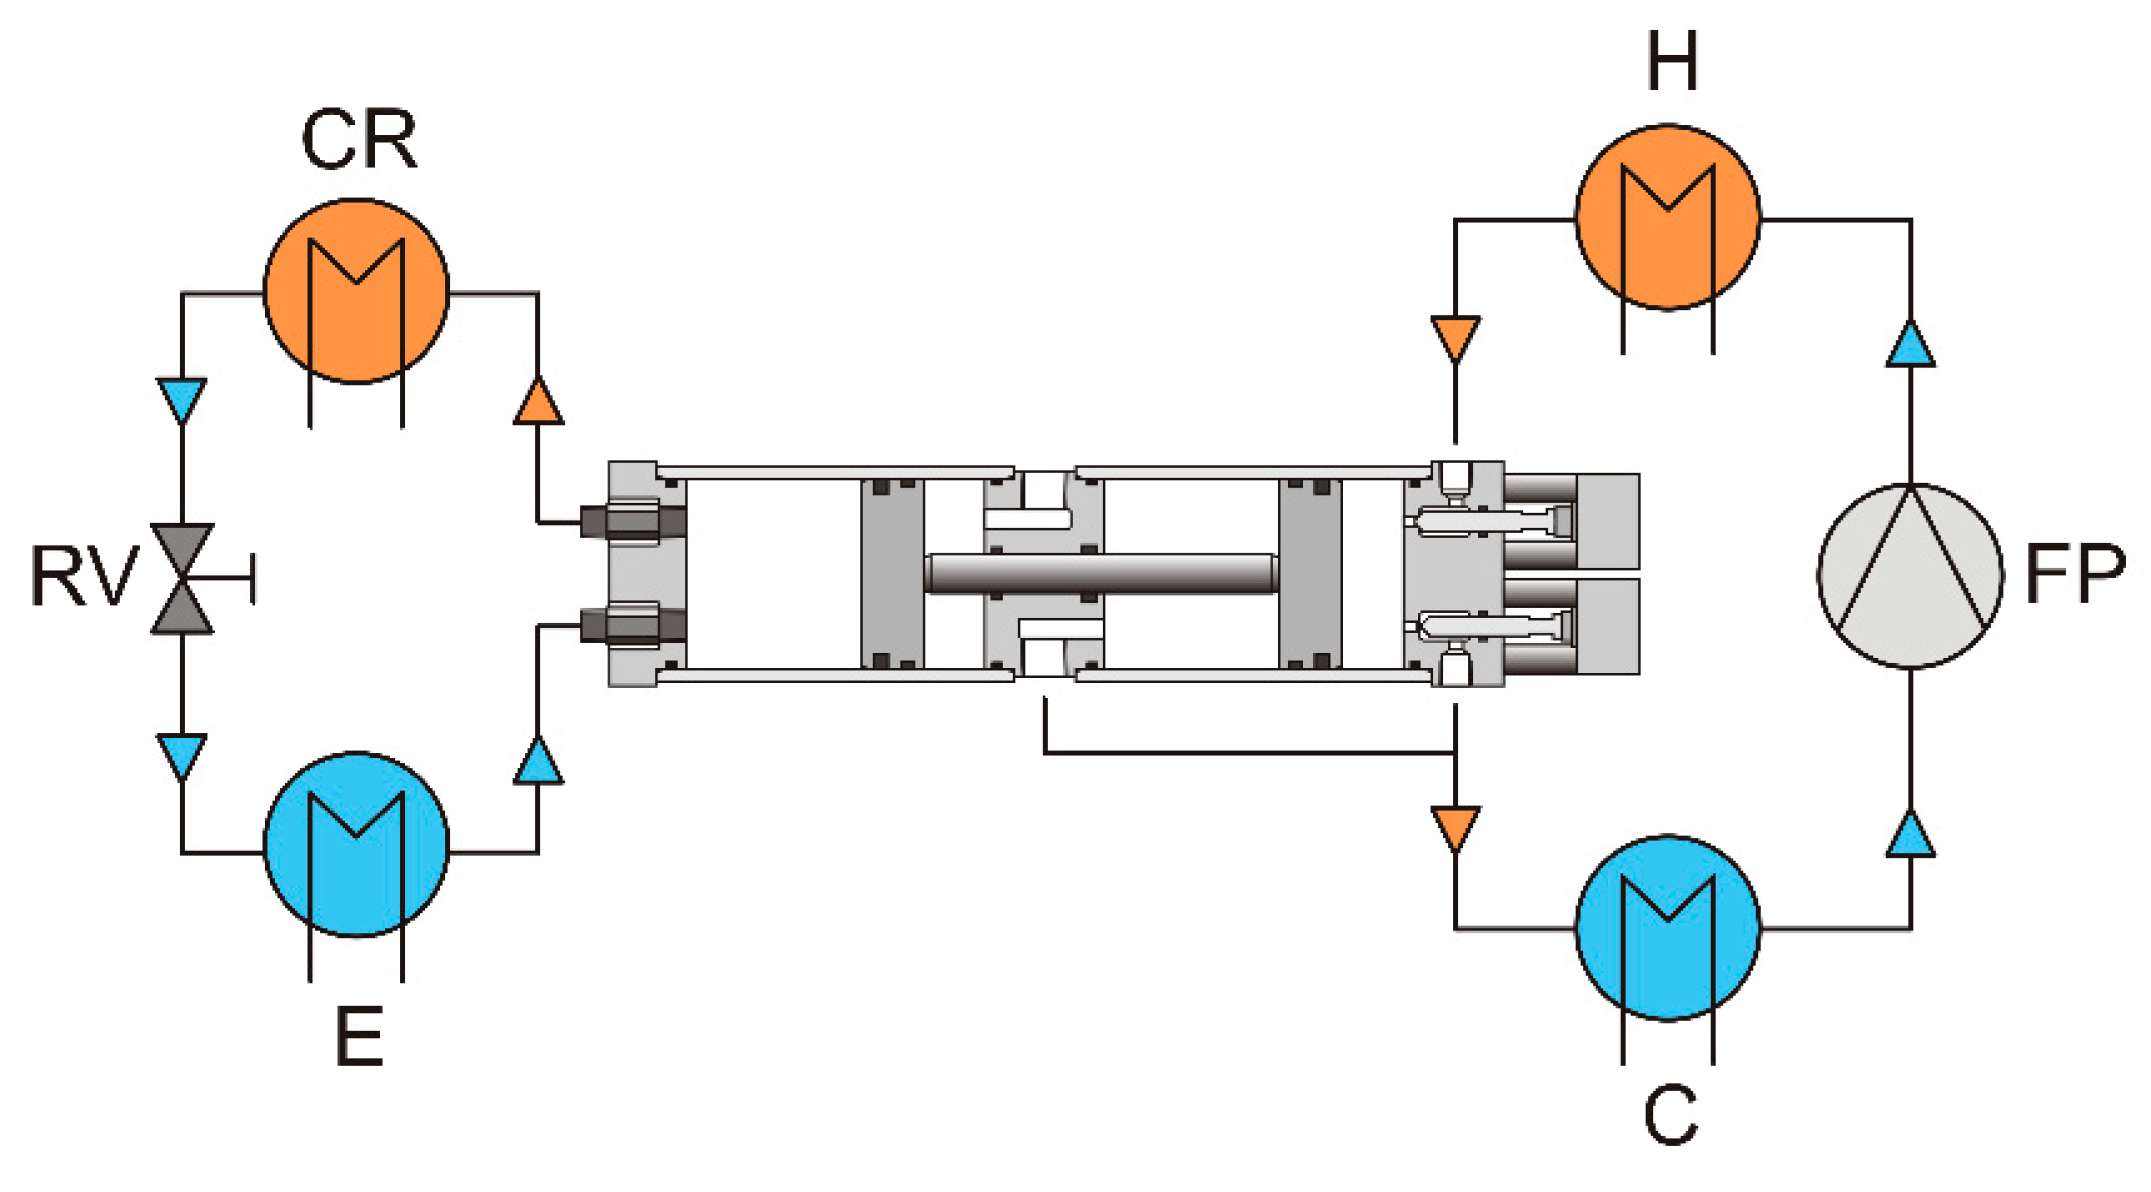
2. Basic Schemes of Vapor-Driven Compressors
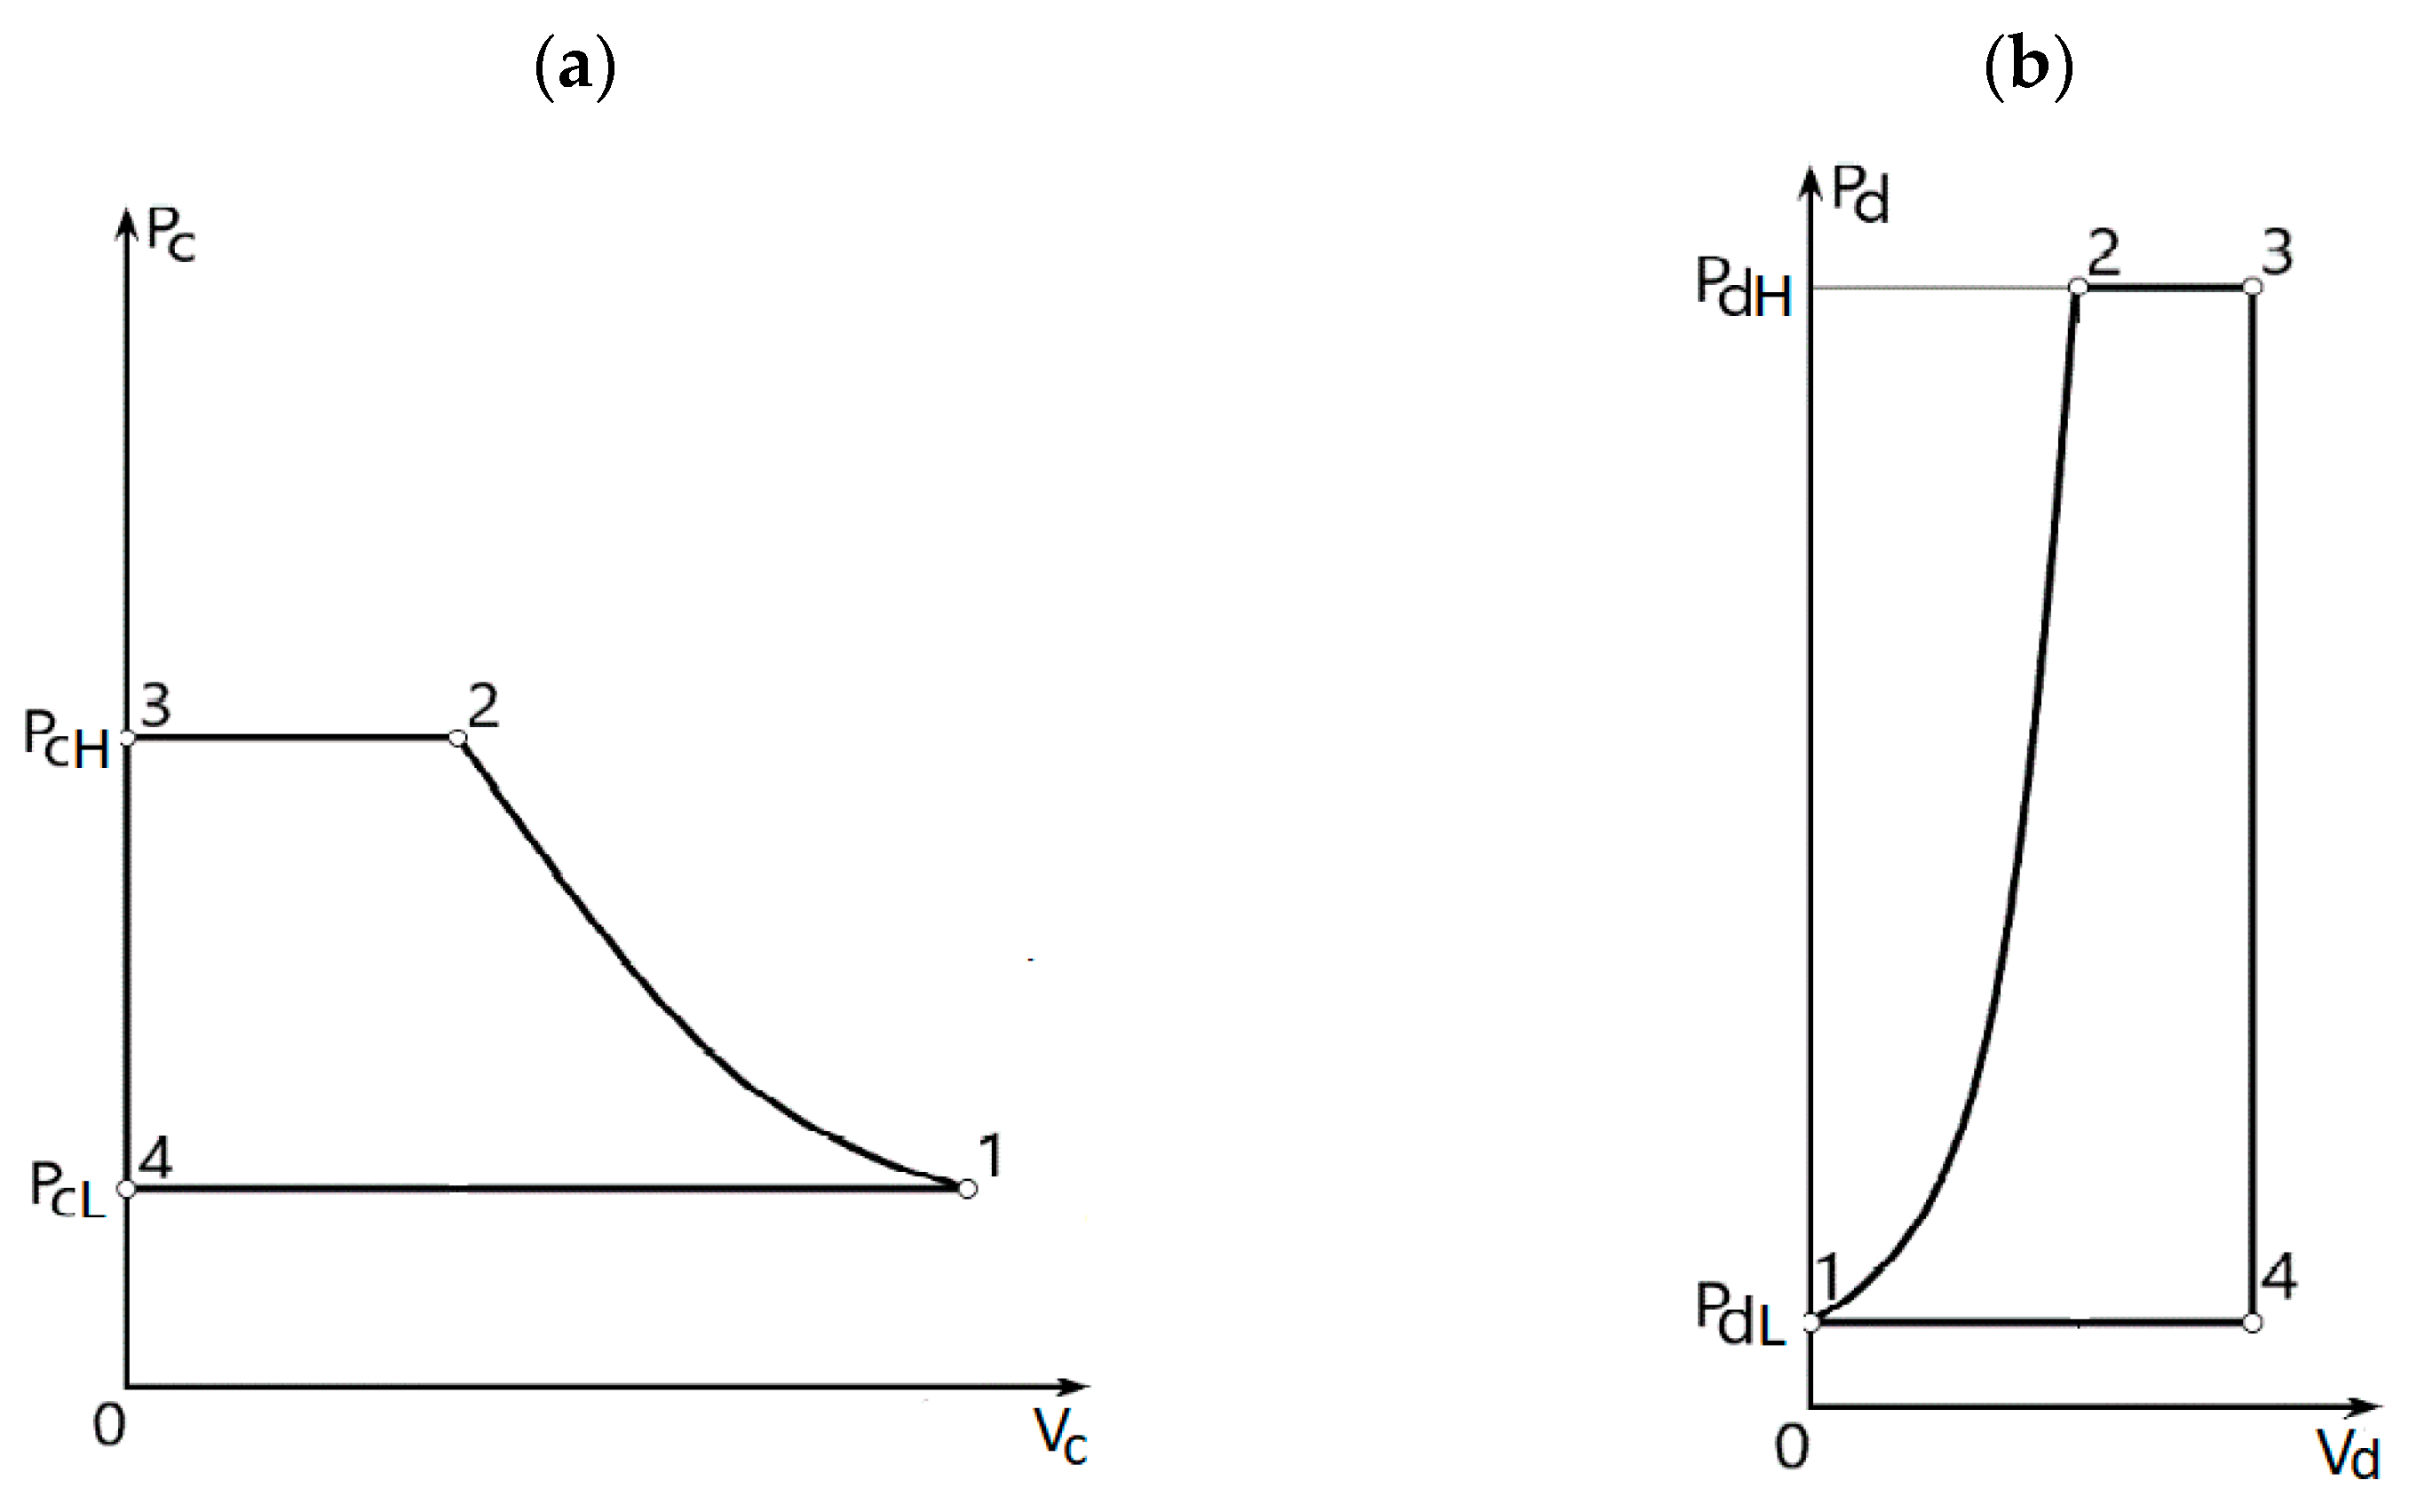
3. Relations between the Pressures and Piston Areas
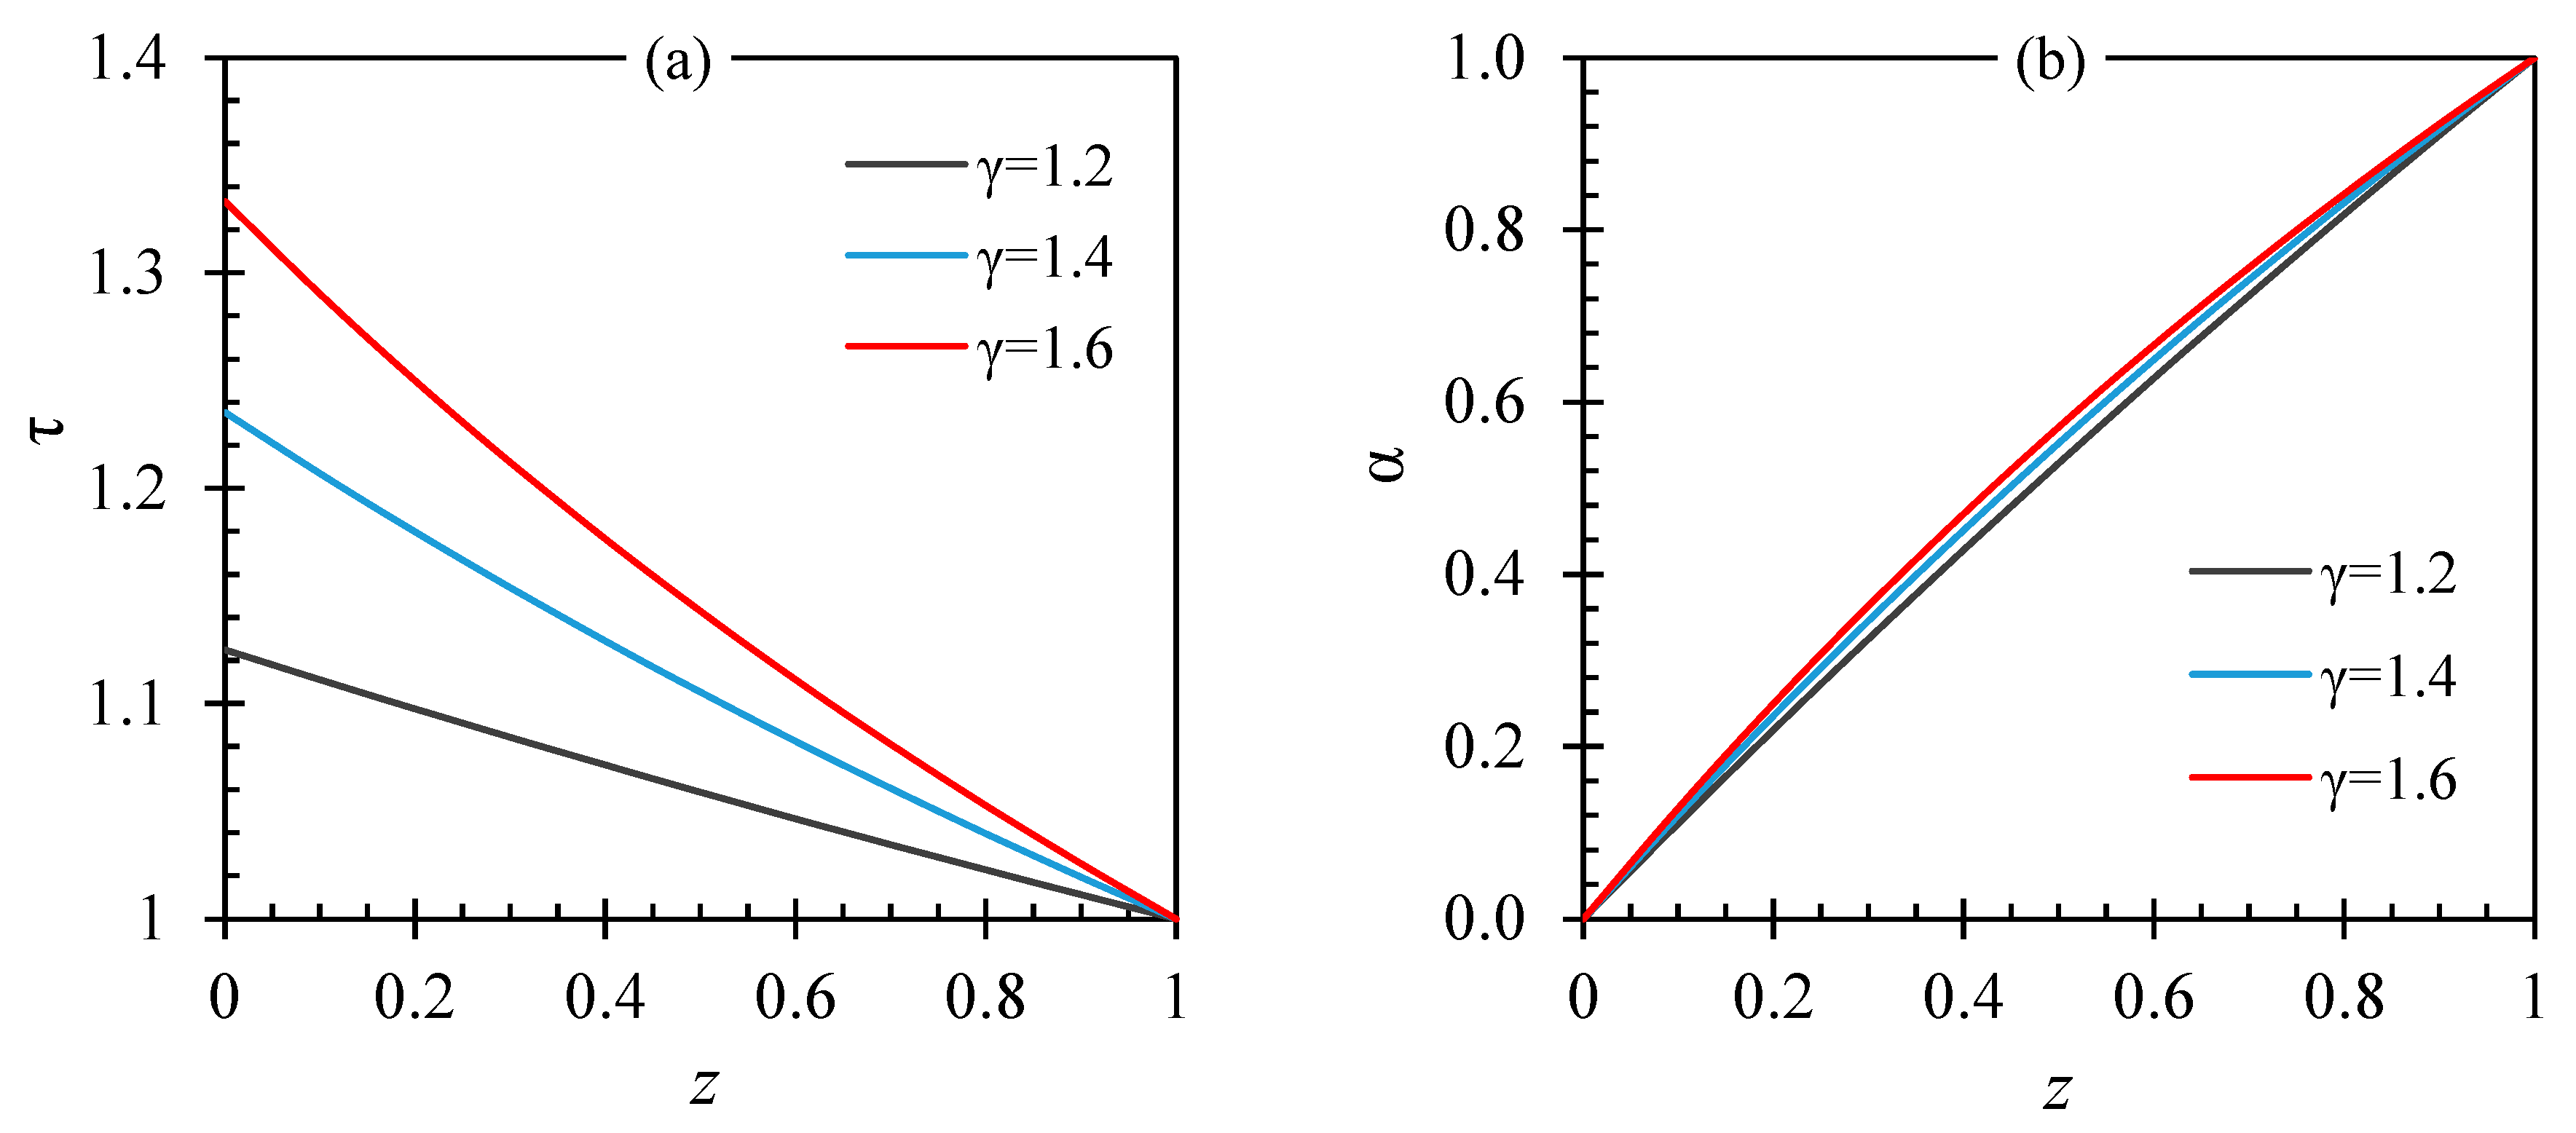
4. Efficiency of Driving Vapor Use
- The process in the compressor is either adiabatic or isothermal.
- The process in the driver is adiabatic.
- The driver only performs useful work on the compression.
- The minimum volumes of the compression and driving cylinder are zero (no dead volume).
- The temperature and pressure of the fluids in the driver and compressor are uniform.
- Mechanical friction between moving and stationary parts in contact (such as piston and cylinder, piston rod and stuffing box) is negligible.
- The inertia of the pistons, piston rods and the fluids is negligible; this is justified for IE engines operating at low frequencies.
- The cross-sectional area of the piston rods is much smaller than the area of the pistons.
- The heat capacities of ideal gases are constant.
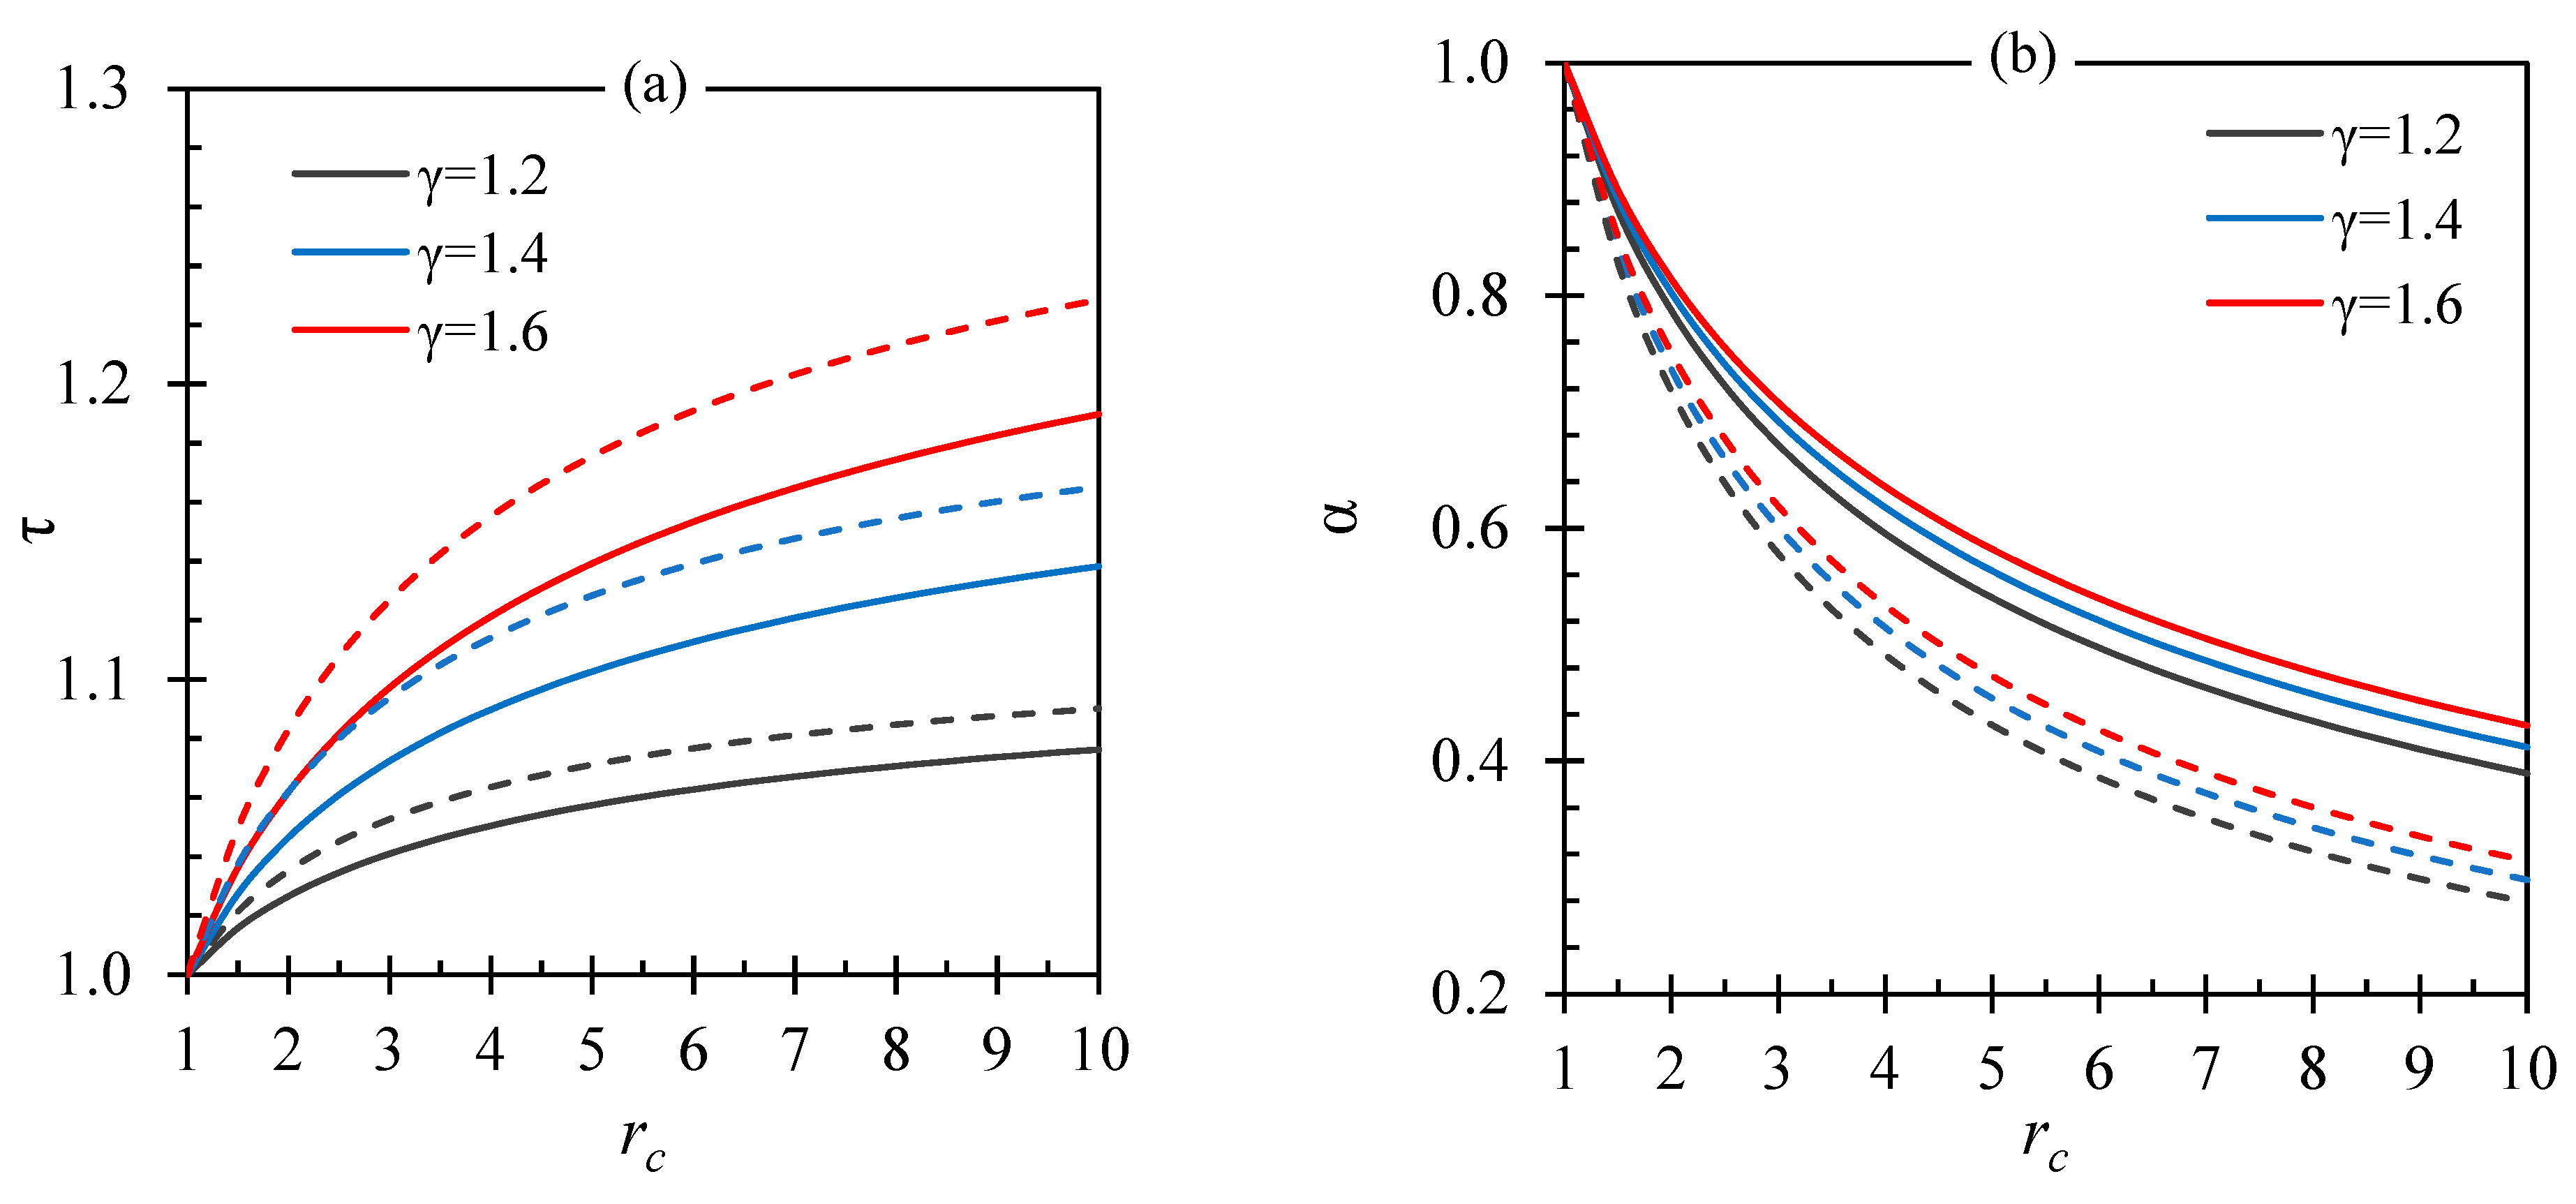
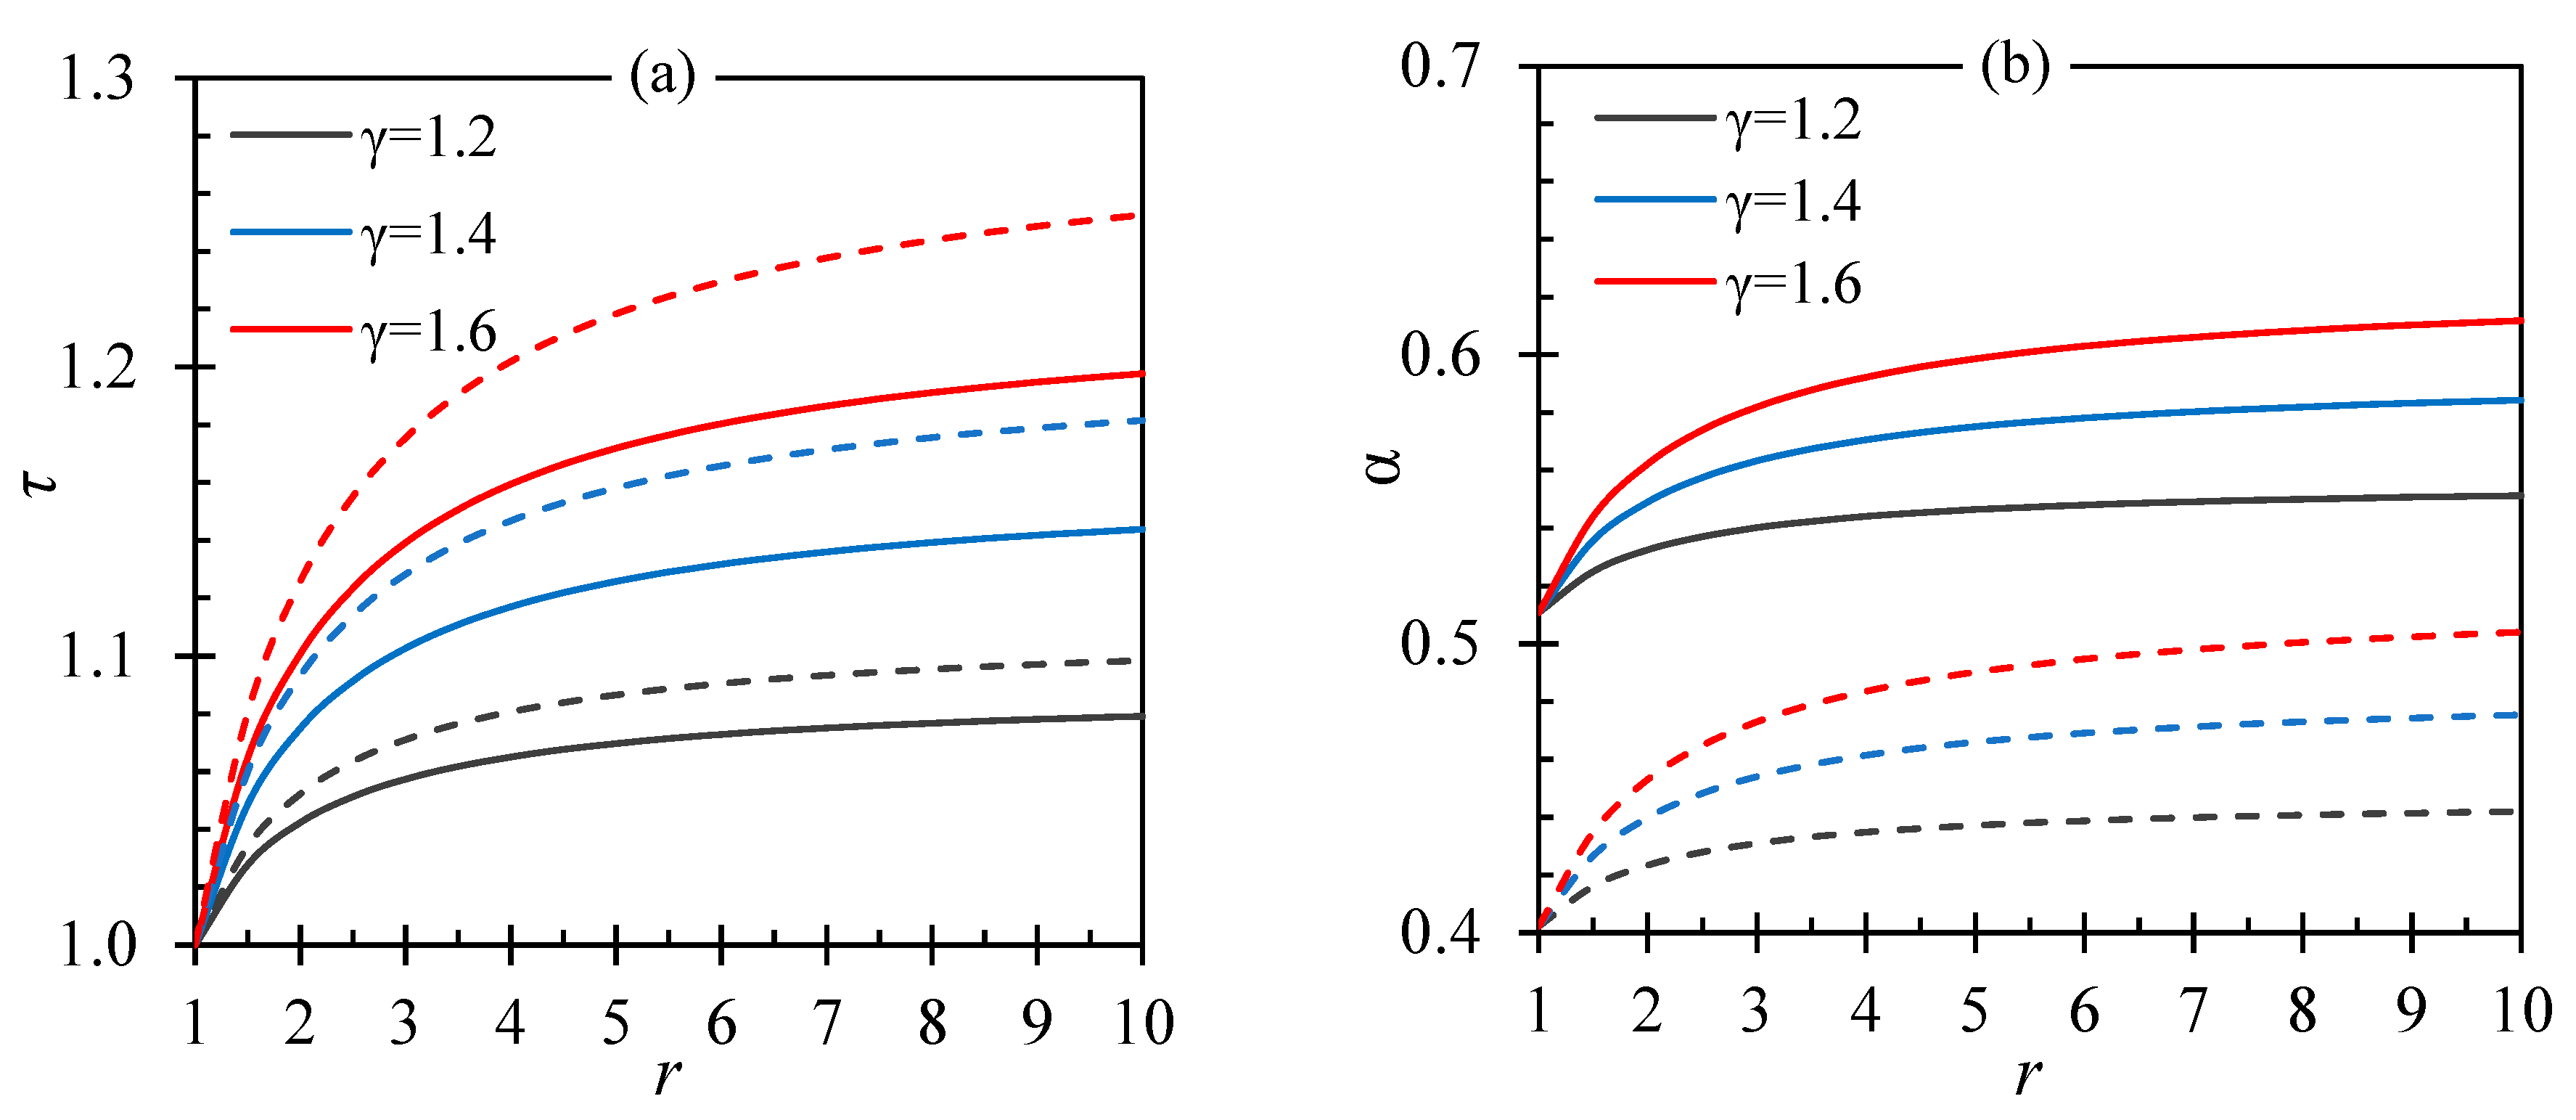
4.1. Ideal Gases
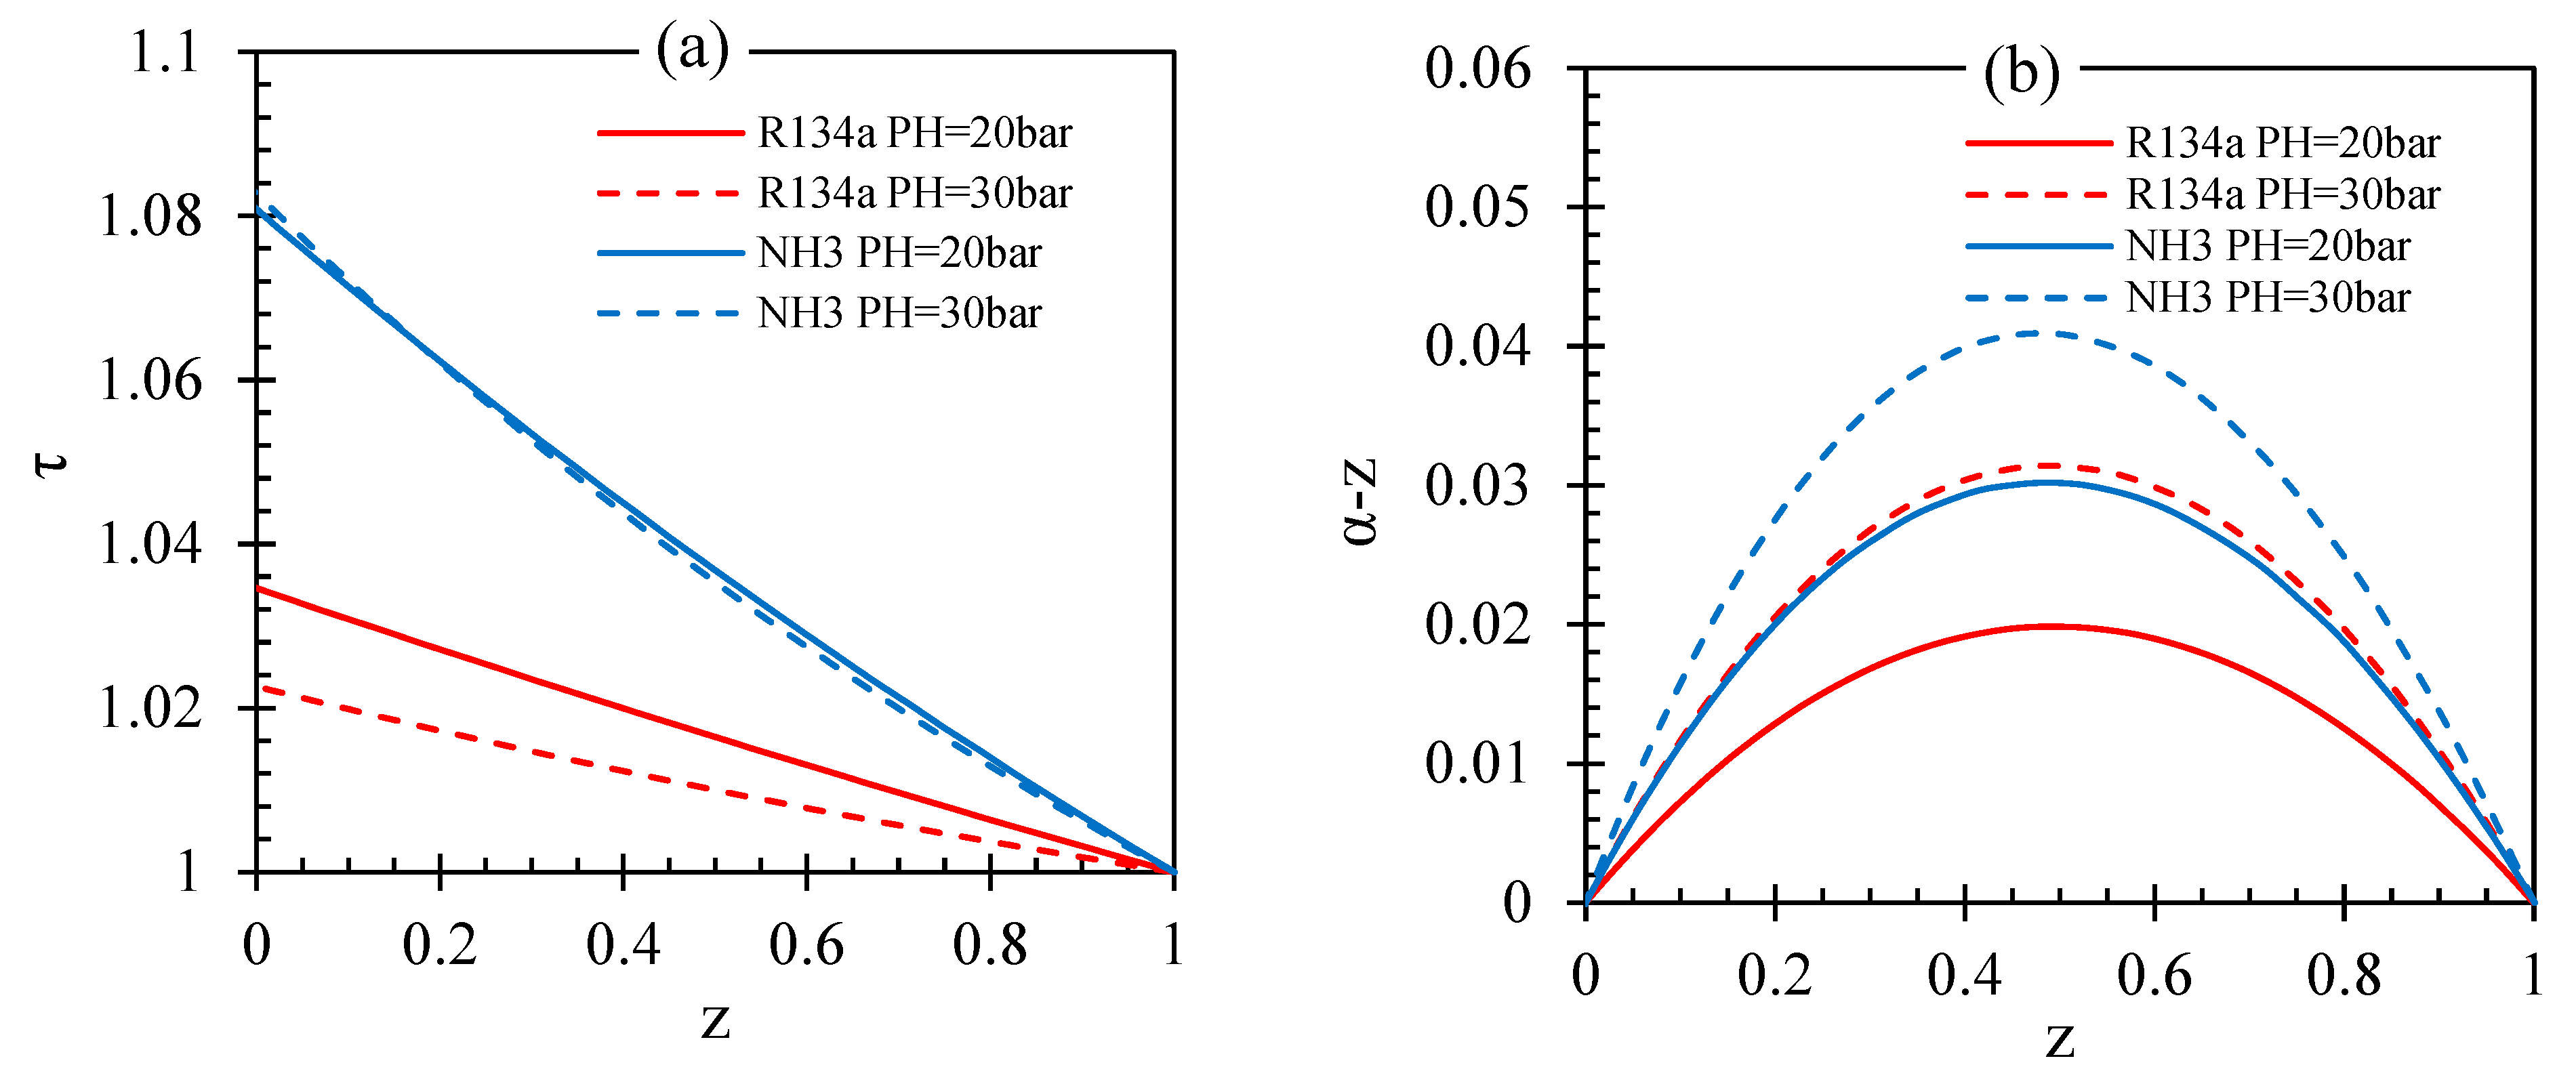
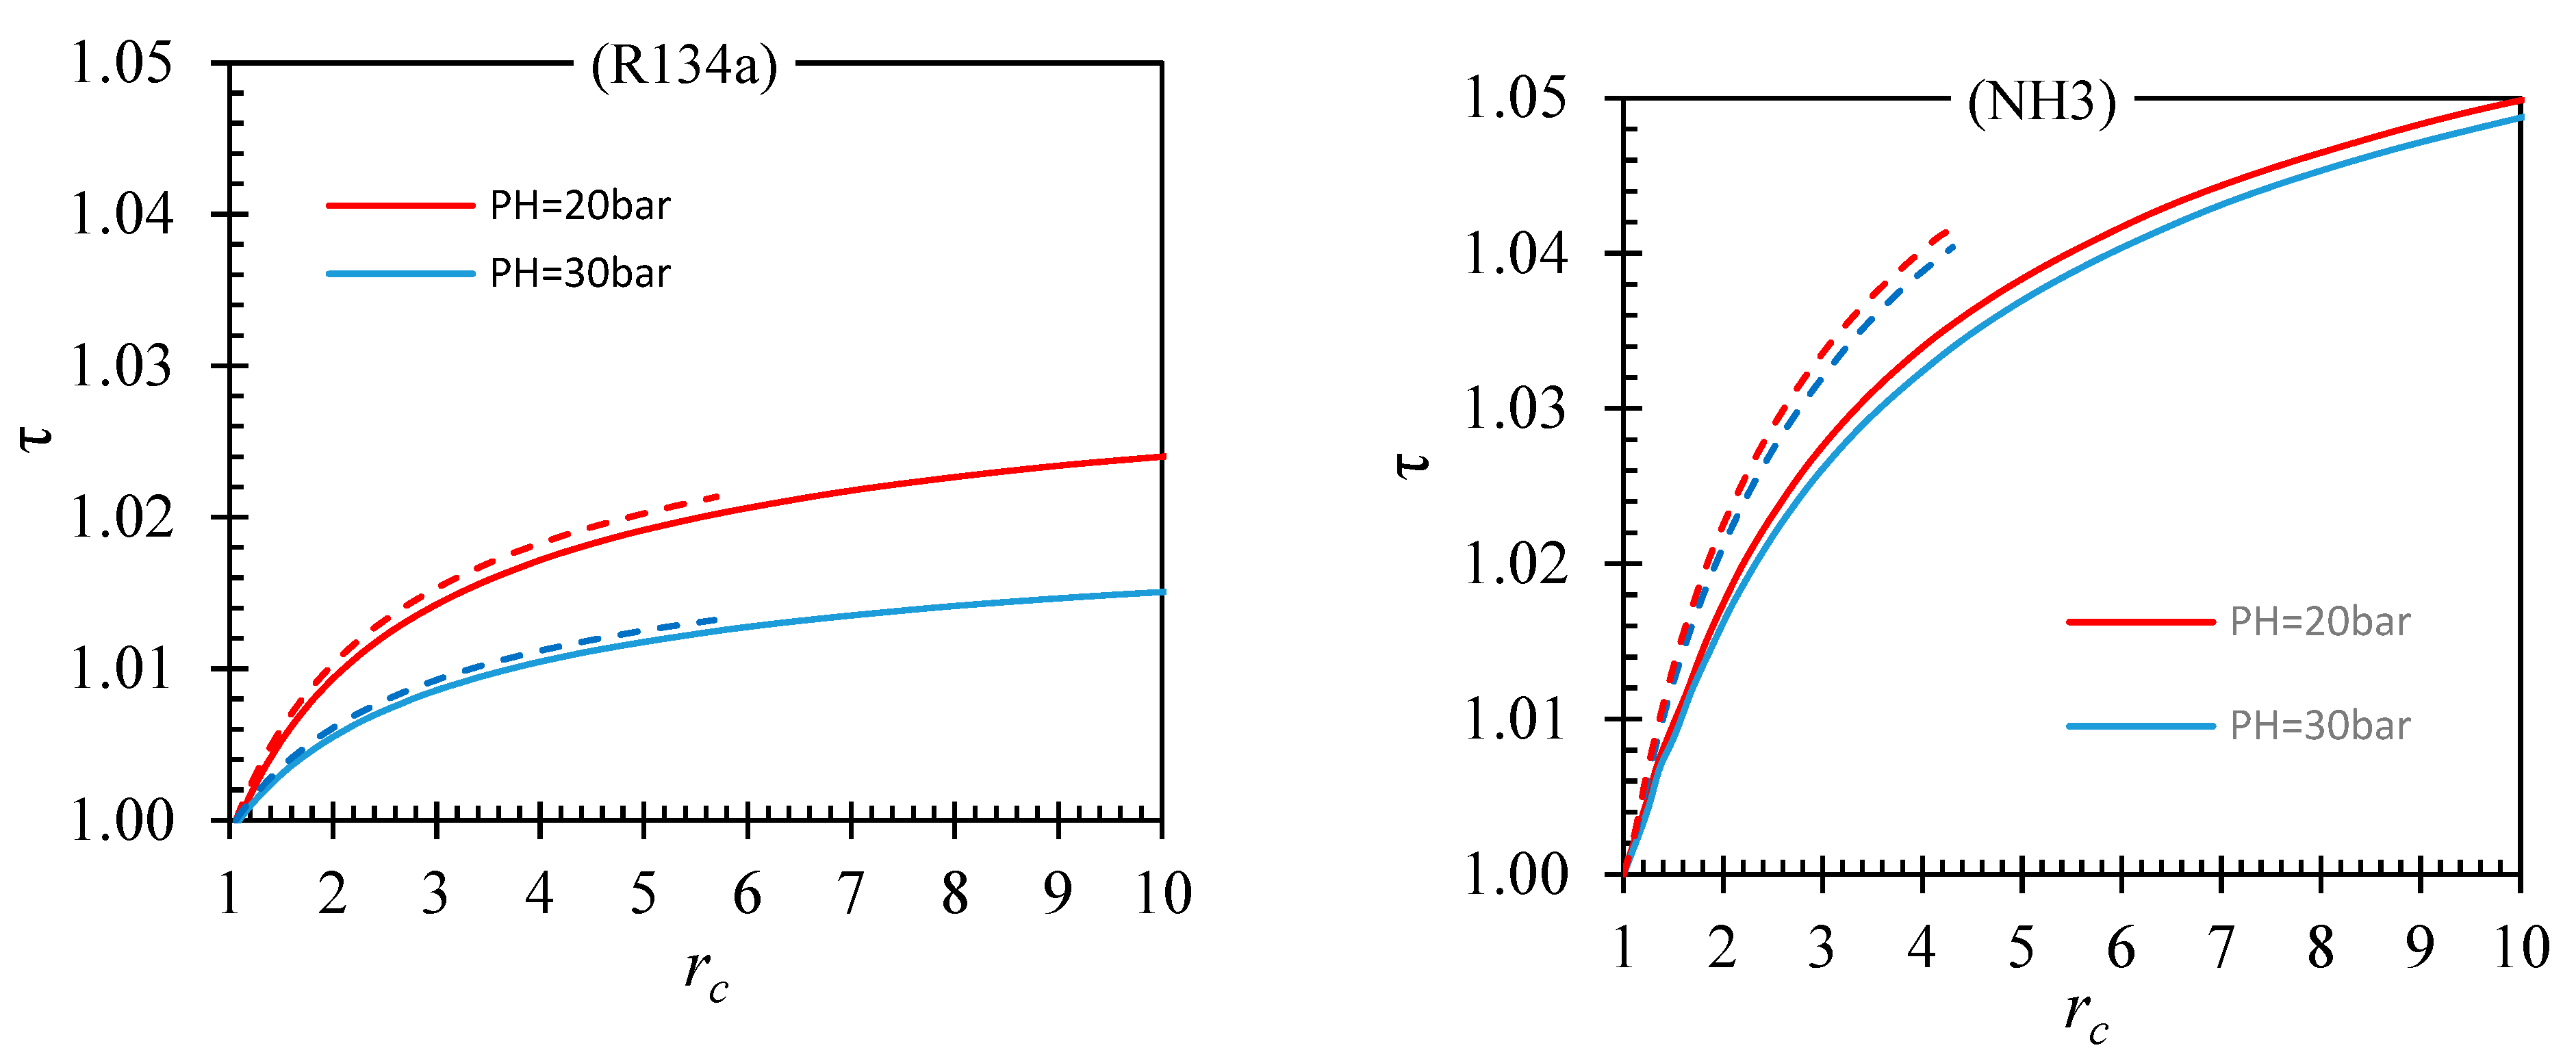
4.2. Real Gases
5. IE Engine Compressor Efficiency
6. Validation of the Engine Compressor Concept
7. Discussion and Conclusions
Author Contributions
Funding
Conflicts of Interest
Nomenclature
| Cross-sectional area (m2) | Greek Letters | ||
| Heat capacity at constant pressure (J/kg K) | Relative vapor use efficiency | ||
| Heat capacity at constant volume (J/kg K) | Isobaric expansion coefficient | ||
| Specific enthalpy (J/kg) | Heat capacity ratio | ||
| IE | Isobaric expansion | Thermal efficiency | |
| Fraction of the feed pump work | Molar mass (kg/kmol) | ||
| Mass of the driving vapor (kg) | Dimensionless temperature of the driving vapor at the end of the compression stroke | ||
| Mass rate of flow (kg/s) | |||
| Pressure (bar) | Subscripts | ||
| Heat (J) | a | Ambient | |
| Pressure ratio | c | Compressor | |
| Specific gas constant (the molar gas constant divided by the molar mass) (J/K kg) | d | Driver | |
| Time | e | End of the compression stroke | |
| Temperature (°C, K) | fp | Feed pump | |
| Specific internal energy (J/kg) | H | High | |
| Specific volume (m3/kg) | L | Low | |
| Volume (m3) | p | Ideal pump | |
| Work (J) | r | Receiver | |
| Specific work (J/kg) | R | Recuperator | |
| Work ratio | |||
References
- Macchi, E. Theoretical Basis of the Organic Rankine Cycle, in Organic Rankine Cycle (ORC) Power Systems; Elsevier: Amsterdam, The Netherlands, 2017. [Google Scholar]
- Tartière, T.; Astolfi, M. A World Overview of the Organic Rankine Cycle Market. Energy Procedia 2017, 129, 2–9. [Google Scholar] [CrossRef]
- Q3 2017: Global Power Markets at a Glance. Available online: https://www.power-technology.com/comment/q3-2017-global-power-markets-glance/ (accessed on 2 June 2022).
- Quoilin, S.; van den Broek, M.; Declaye, S.; Dewallef, P.; Lemort, V. Techno-economic survey of Organic Rankine Cycle (ORC) systems. Renew. Sustain. Energy Rev. 2013, 22, 168–186. [Google Scholar] [CrossRef] [Green Version]
- Tocci, L.; Pal, T.; Pesmazoglou, I.; Franchetti, B. Small Scale Organic Rankine Cycle (ORC): A Techno-Economic Review. Energies 2017, 10, 413. [Google Scholar] [CrossRef]
- Lemmens, S. A perspective on cost and cost estimation techniques for organic Rankine cycle systems. In Proceedings of the 3rd International Seminar on ORC Power Systems, Brussels, Belgium, 12–14 October 2015. [Google Scholar]
- Glushenkov, M.; Kronberg, A.; Knoke, T.; Kenig, E.Y. Isobaric Expansion Engines: New Opportunities in Energy Conversion for Heat Engines, Pumps and Compressors. Energies 2018, 11, 154. [Google Scholar] [CrossRef] [Green Version]
- Van der Kooij, B. The Invention of the Steam Engine; University of Technology: Delft, The Netherlands, 2015. [Google Scholar]
- Whitmore, M. Development of Coal-Fired Steam Technology in Britain. In Encyclopedia of the Anthropocene; Elsevier: Amsterdam, The Netherlands, 2018; pp. 285–305. [Google Scholar]
- Delgado-Torres, A. Solar thermal heat engines for water pumping: An update. Renew. Sustain. Energy Rev. 2009, 13, 462–472. [Google Scholar] [CrossRef]
- Date, A.; Akbarzadeh, A. Theoretical study of a new thermodynamic power cycle for thermal water pumping application and its prospects when coupled to a solar pond. Appl. Therm. Eng. 2013, 58, 511–521. [Google Scholar] [CrossRef]
- Oyewunmi, O.A.; Kirmse, C.J.W.; Haslam, A.J.; Müller, E.A.; Markides, C.N. Working-fluid selection and performance investigation of a two-phase single-reciprocating-piston heat-conversion engine. Appl. Energy 2017, 186, 376–395. [Google Scholar] [CrossRef] [Green Version]
- Kirmse, C.J.W.; Oyewunmi, O.A.; Taleb, A.I.; Haslam, A.J.; Markides, C.N. A two-phase single-reciprocating-piston heat conversion engine: Non-linear dynamic modelling. Appl. Energy 2017, 186, 359–375. [Google Scholar] [CrossRef] [Green Version]
- Glushenkov, M.; Bhosale, R.; Kumar, A.; AlMomani, F.; Kronberg, A. Heat powered water pump for reverse osmosis desalination. In Materials for Energy, Efficiency and Sustainability; TechConnect Briefs; CRC Press: Boca Raton, FL, USA, 2016; pp. 201–204. ISBN 9780997511710. Available online: www.TechConnect.org (accessed on 2 June 2022).
- Markides, C.N.; Smith, T.C.B. A dynamic model for the efficiency optimization of an oscillatory low grade heat engine. Energy 2011, 36, 6967–6980. [Google Scholar] [CrossRef] [Green Version]
- Solanki, R.; Galindo, A.; Markides, C.N. Dynamic modelling of a two-phase thermofluidic oscillator for efficient low grade heat utilization: Effect of fluid inertia. Appl. Energy 2012, 89, 156–163. [Google Scholar] [CrossRef]
- Glushenkov, M.; Kronberg, A. Regenerative Heat to Mechanical Energy Converter with Dense Working Fluid. In Proceedings of the 16th International Stirling Engine Conference, Bilbao, Spain, 24–26 September 2014; pp. 177–186. [Google Scholar]
- Available online: https://www.chester-project.eu/news/ie-engine-pump-in-ects-laboratory-video (accessed on 2 June 2022).
- Glushenkov, M.; Kronberg, A. Experimental study of an isobaric expansion engine-pump—Proof of concept. Appl. Therm. Eng. 2022, 212, 118521. [Google Scholar] [CrossRef]
- Aphornratana, S.; Sriveerakul, T. Analysis of a combined Rankine–vapour–compression refrigeration cycle. Energy Convers. Manag. 2010, 51, 2557–2564. [Google Scholar] [CrossRef]
- Sleiti, A.K. Isobaric Expansion Engines Powered by Low-Grade Heat-Working Fluid Performance and Selection Database for Power and Thermomechanical Refrigeration. Energy Technol. 2020, 8, 2020. [Google Scholar] [CrossRef]
- Sleiti, A.K.; Al-Ammari, W.A.; Al-Khawaja, M. Analysis of Novel Regenerative Thermo-Mechanical Refrigeration System Integrated with Isobaric Engine. J. Energy Resour. Technol. Trans. ASME 2021, 143, 052103. [Google Scholar] [CrossRef]
- Sleiti, A.K.; Al-Khawaja, M.; Al-Ammari, W.A. A combined thermo-mechanical refrigeration system with isobaric expander-compressor unit powered by low grade heat—Design and analysis. Int. J. Refrig. 2020, 120, 39–49. [Google Scholar] [CrossRef]
- Gibbs, K. The Steam Locomotive. An Engineering History; Amberley Publishing: Stroud, UK, 2009; Volume 2013. [Google Scholar]
- Wells, D. How a Steam Locomotive Works; Allan Publishing: Shepperton, UK, 2010. [Google Scholar]
- Wear, W. Steam Engine Air Pump. U.S. Patent 825,950, 17 July 1906. [Google Scholar]
- Barner, J. Fluid Compressing Apparatus. U.S. Patent 1,372,891, 22 March 1921. [Google Scholar]
- Hoop, R. Refrigeration System. U.S. Patent 2,986,907, 6 June 1961. [Google Scholar]
- Cassady, V. Automotive Air Conditioning Apparatus. U.S. Patent 3,823,573, 16 July 1974. [Google Scholar]
- Shelton, S.; Robinson, G.J. Dual Loop Heat Pump System. U.S. Patent 3,988,901, 2 November 1976. [Google Scholar]
- Rowley, C.A.; Gutierrez, H.M. Heat Actuated Heat Pump. U.S. Patent 4,779,427, 25 October 1988. [Google Scholar]
- Dodge, B.F. Chemical Engineering Thermodynamics; McGraw-Hill: New York, NY, USA; London, UK, 1944. [Google Scholar]
- Knoke, T.; Kenig, E.Y.; Kronberg, A.; Glushenkov, M. Model-based Analysis of Novel Heat Engines for Low-Temperature Heat Conversion. Chem. Eng. Trans. 2017, 57, 499–504. [Google Scholar]
- Lemmon, E.W.; Huber, M.L.; McLinden, M.O. miniREFPROP, an Abbreviated Version of NIST REFPROP; NIST Standard Reference Database 23, Version 9.1; NIST: Gaithersburg, MD, USA, 2013.
- NIST. Thermophysical Properties of Fluid Systems. 2018. Available online: https://webbook.nist.gov/chemistry/fluid/# (accessed on 2 June 2022).
- Kronberg, A.; Glushenkov, M.; Knoke, T.; Kenig, E.Y. Theoretical limits on the heat regeneration degree. Int. J. Heat Mass Transf. 2020, 161, 1–10. [Google Scholar] [CrossRef]
- Available online: http://www.encontech.nl/video/Encontech_IE-engine_Refrigerator.mp4 (accessed on 2 June 2022).


| Fluid | ||||
|---|---|---|---|---|
| R134a | 20 and 30 | 7.7 | 90 | 2.6 and 3.9 |
| Ammonia | 20 and 30 | 10.0 | 70 | 2 and 3 |
| R134a | Ammonia | |||||
|---|---|---|---|---|---|---|
| 20 | 90 | 2.6 | 1.30 | 70 | 2 | 1.49 |
| 30 | 90 | 3.9 | 1.91 | 70 | 3 | 1.69 |
| Fluid | ||||
|---|---|---|---|---|
| R134a | 1 | 1–10 | 20 | 1–10 |
| Ammonia | 1 | 1–10 | 0 | 1–10 |
Publisher’s Note: MDPI stays neutral with regard to jurisdictional claims in published maps and institutional affiliations. |
© 2022 by the authors. Licensee MDPI, Basel, Switzerland. This article is an open access article distributed under the terms and conditions of the Creative Commons Attribution (CC BY) license (https://creativecommons.org/licenses/by/4.0/).
Share and Cite
Kronberg, A.; Glushenkov, M.; Roosjen, S.; Kersten, S. Isobaric Expansion Engine Compressors: Thermodynamic Analysis of the Simplest Direct Vapor-Driven Compressors. Energies 2022, 15, 5028. https://doi.org/10.3390/en15145028
Kronberg A, Glushenkov M, Roosjen S, Kersten S. Isobaric Expansion Engine Compressors: Thermodynamic Analysis of the Simplest Direct Vapor-Driven Compressors. Energies. 2022; 15(14):5028. https://doi.org/10.3390/en15145028
Chicago/Turabian StyleKronberg, Alexander, Maxim Glushenkov, Sander Roosjen, and Sascha Kersten. 2022. "Isobaric Expansion Engine Compressors: Thermodynamic Analysis of the Simplest Direct Vapor-Driven Compressors" Energies 15, no. 14: 5028. https://doi.org/10.3390/en15145028
APA StyleKronberg, A., Glushenkov, M., Roosjen, S., & Kersten, S. (2022). Isobaric Expansion Engine Compressors: Thermodynamic Analysis of the Simplest Direct Vapor-Driven Compressors. Energies, 15(14), 5028. https://doi.org/10.3390/en15145028