Article

Optimization of Non-Uniform Perforation Parameters for Multi-Cluster Fracturing

1
Department of Mechanics, College of Energy and Mining Engineering, Shandong University of Science and Technology, Qingdao 266590, China
2
State Key Laboratory of Oil and Gas Reservoir Geology and Exploitation, Southwest Petroleum University, Chengdu 610500, China
3
Research Center of Multiphase Flow in Porous Media, China University of Petroleum (East China), Qingdao 266580, China
4
Bohai Oilfield Research Institute, Tianjin Branch, CNOOC China Limited, Tianjin 300459, China
*
Author to whom correspondence should be addressed.
Energies 2022, 15(14), 5099; https://doi.org/10.3390/en15145099
Submission received: 24 May 2022 / Revised: 7 July 2022 / Accepted: 11 July 2022 / Published: 13 July 2022
(This article belongs to the Special Issue Exploitation of Geological Resources in Unconventional Reservoirs)

Abstract

:
Stress shadowing affects the simultaneous propagation of fractures from multiple perforation clusters. Employing uniform perforation parameters for all clusters cause the unbalanced growth of fractures, which arouses the demand of optimizing non-uniform perforation parameters. An optimization workflow combining a fracture propagation model and the particle swarm optimization method (PSO) is proposed for multi-cluster fracturing in this study. The fracture model considers the coupling of rock deformation and fluid flow along the wellbore and fractures, and it is solved by using the Newton iteration method. The optimization is performed by taking the variance of multiple fracture lengths as fitness value function in the frame of the PSO method. Numerical results show that using the same spacings and perforation parameters for all clusters is detrimental to the balanced growth of multiple fractures. The variance of fracture lengths drops greatly through optimization of cluster spacings and perforation number/diameter. Properly increasing the spacing and perforation number/diameter for the middle clusters promotes the balanced growth of multiple fractures. This study provides an efficient optimization workflow for multi-cluster fracturing treatment in horizontal wells.

1. Introduction

Hydraulic fracturing has become an indispensable technique in the development of tight oil and gas reservoirs, and multi-stage hydraulic fracture with multiple perforation clusters per stage is the most widely used method to produce oil and gas. For multi-cluster fracturing, stress shadowing is induced due to high injection pressure inside fractures, and it may cause a certain percentage of fractures to be unable to initiate and extend when using the uniform perforation parameters for all clusters, namely, unbalanced growth of fractures [1,2,3]. Thus, it is necessary to carry out the optimization of perforation parameters for multi-cluster fracturing.
The basis of optimization is to predict the simultaneous propagation of multi-cluster fractures accurately. Many researchers have carried out numerical simulations. Fractures are characterized by displacement discontinuity, making it difficult to calculate stress field of rock deformation. The discontinuous method and continuous method are introduced to handle fracture discontinuity. In the frame of the discontinuous method, fractures are represented explicitly, and displacements are discontinuous across fractures. This category of method includes: the displacement discontinuity method (DDM), the finite element method (FEM) and its varieties, and the discrete element method (DEM) [4]. The displacement discontinuity method establishes the relationship between stress and displacement discontinuity along the fracture. It is a kind of boundary element method enjoying the advantage of low computational cost, and it has been broadly used to simulate multiple nonplanar fracture interactions [5,6,7] and complex fracture development in naturally fractured reservoirs [8,9]. The combination of the finite element method and cohesive element is adopted for simulating hydraulic fracture propagation [10,11]. The plastic deformation of rock can be readily captured by using the finite element method, so the finite element method is applied to simulate hydraulic fracturing in deep reservoirs with high stresses [12,13]. As one of its varieties, the extended finite element method (XFEM) permits the fracture propagates across a finite element without mesh refining, which attracts much attention for hydraulic fracturing problems [14]. Multi-physics coupling models have also been presented [15,16,17]. However, the extended finite element method has a defect in that an additional criterion is required to determine fracture propagation behavior, which makes it a very tricky task when dealing with the intersection propagation of complex fracture network. In addition, a number of hybrid approaches have been presented, such as the combined finite–discrete element method [18,19] and hybrid discrete–continuum method [20]. Different from the discontinuous method, the continuous method treats fractures immersed in the finite element by using an auxiliary variable, such as the continuous damaged method [21,22], the phase field method [23,24,25], and the peridynamic method [26,27,28]. These methods possess the advantage of requiring no additional criterion for the determination of fracture propagation behavior, which makes it convenient for complex fracture problems with fracture branching and joining. Furthermore, other approaches have been proposed, such as the numerical manifold method [29,30], the lattice method [31], the meshless method [32,33], and the discretized virtual internal bond method [34]. Though so many methods have been proposed, most of them face the challenges of high computational cost for field application. The displacement discontinuity method has almost the lowest computational cost, with which only fractures rather than the whole domain need to be discretized. Thus, it is employed here for the simulation of multi-cluster fractures propagation as the basis of further optimization.
As for optimization of hydraulic fracturing, many approaches have been proposed. Regarding the optimization objectives, they can be categorized into two aspects: maximizing complexity of fracture morphology, or maximizing net present value (NPV) of post-fracturing production. Maximizing the complexity of fracture morphology is conducive to producing more oil and gas, and this is conducted during the process of fracture propagation. The effect of cluster spacings on multiple fracture propagation was extensively analyzed through numerical methods, and it was proved that certain nonuniform cluster spacings promote the even development of fractures [35,36,37]. The limited entry technique has been widely used in multi-cluster fracturing, which increases perforation friction pressure to promote uniform hydraulic fracture growth through limiting the number and diameter of perforations on the wellbore [1,2,3]. It is shown that adjusting the perforation friction can improve the partition of fluid injection and attenuate the adverse effects of stress shadowing [38,39]. The stress field is greatly altered during the fracturing process, and the local horizontal principal stress may re-orientate within an elliptical region around the fracture, which can result in the direction of initial maximum principal stress becoming that of minimum stress, known as stress reversal [40]. In the stress reversal region, the fracture changes its propagation direction, and communicates more natural fractures. Based on the stress reversal extent, cluster spacings, stage spacings, fracture numbers, and well spacings are optimized [41,42,43,44,45]. Besides, optimizations of fracturing treatment parameters are conducted to achieve balanced growth of multi-cluster fractures or maximum stimulated reservoir area [46,47,48,49]. The second category of optimization is based on production simulation. The fracture spacing, stage spacing, well spacing, and pumping parameters are optimized for achieving maximum net present value by using optimization techniques such as genetic algorithm, the PSO method, the multi-coordinate searching method, covariance matrix adaptation evolution strategy (CMA-ES), and machine learning method [50,51,52,53,54,55,56]. Though these methods can search the optimal fracturing parameters, the calculation processes are cumbersome and not convenient for field application. Though many studies have been presented to analyze the effects of cluster spacings and perforation parameters on fracture growth, it still lacks further joint optimization of non-uniform cluster spacings and perforation parameters. Therefore, an optimization workflow combining fracture propagation and the PSO method is proposed to achieve balanced growth of multi-cluster fractures. The novelty of this study is that both the non-uniform cluster spacings and perforation parameters are optimized, and the optimization workflow is made efficient by using the displacement discontinuity method for fracture propagation modeling and the PSO method for optimization.
The rest of this paper is arranged as follows: Section 2 describes the underlying equations for multiple fractures propagation model. Section 3 presents a discretized method and iterative scheme for stress and pressure fields. Section 4 gives optimization scheme based on the PSO method. Section 5 presents the validation of numerical model, the analysis of the propagation law of multiple fractures propagation, and the optimization of cluster spacings and perforation parameters. Section 6 gives some conclusions.

2. Mathematical Model of Fracture Propagation

2.1. Rock Deformation with Displacement Discontinuity Method

The high pressure of injection fluid causes rock deformation and rupture. Displacement discontinuities are induced across the fracture surface, and the relationships between displacement discontinuities and acting stresses are expressed as follows:
σ n i = j = 1 N G i j C n s i j D s j + j = 1 N G i j C n n i j D n j , i = 1 , , N
σ s i = j = 1 N G i j C s s i j D s j + j = 1 N G i j C s n i j D n j , i = 1 , , N
where σn and σs denote the normal and tangential part of impacting stresses, Pa. Dn and Ds denote the normal and tangential part of displacement discontinuities, m. C is the constitutive coefficient matrix, which are functions of rock mechanical parameters. G is the correction coefficient matrix accounting for the effect of constant finite height, whose element is given as:
G i j = 1 d i j β [ d i j 2 + ( h / α ) 2 ] β / 2
where dij is the distance from the element i to element j, m. h is the finite height of fracture, m. α and β are the empirical parameters.
Though many criteria have been proposed for the condition of fracture extension, the maximum circumferential stress criterion is employed here. When the equivalent stress intensity of fracture tip surpasses rock toughness, the fracture tip starts to propagates, and its propagation direction is aligned with the direction of maximum circumferential stress. The criterion can be given as:
cos ( θ M 2 ) ( K I cos 2 ( θ M 2 ) 3 2 K I I sin θ M ) K I C
where KI and KII denote the normal and tangential stress intensity factors, Pa∙m1/2; and KIC is the rock toughness, Pa∙m1/2. θM denotes the diversion angle of the direction of maximum circumferential stress with respect to the fracture front edge, and it can be solved by:
θ M = 2 arctan ( 1 4 ( K I K I I ± ( K I K I I ) 2 + 8 ) )
To determine fracture propagation, it needs to resolve the stress intensity factors in Equations (4) and (5). They are calculated with the displacement discontinuities at the fracture tip element as follows:
K I = 0.806 E π 4 ( 1 v 2 ) 2 a t D n t
K I I = 0.806 E π 4 ( 1 v 2 ) 2 a t D s t
where E is the Young’s modulus of rock, Pa. ν is the Poisson’s ratio of rock. D n t and D s t denote the normal and shear displacement discontinuities at the fracture tip element, m. at is half-length of the fracture tip element, m.

2.2. Fluid Flow along the Wellbore and the Fracture

Fracturing fluid is pumped into the wellbore, and it flows through each cluster perforation to initiate and extend each fracture. To model the fluid flow, two processes need to be considered: fluid flow along the wellbore, and fluid flow in the fracture.
Regarding fluid flow along the wellbore, two equations are constructed in terms of fluid flow rate and fluid pressure. Under the effect of stress shadowing, the propagation velocity of each fracture wing is different, and the injected fracturing fluid is not evenly partitioned to each fracture wing. It needs to solve the partition of total injection rate dynamically. The fluid flow rates into all fracture wings satisfy conservation law, which is written as:
Q T = k = 1 2 m Q k
where QT is the total fluid rate pumped into the wellbore, m3/s. Qk is the injection rate into the fracture wing k, m3/s. m is the number of fractures.
The fluid pressure equation is established by accounting for perforation friction pressure drop and friction pressure drop along the wellbore, which is given by:
p 0 = p w , k + Δ p p f , k + Δ p c f , k , k = 1 , .. , 2 m
where p0 is the fluid pressure at the start of horizontal section of wellbore, Pa. pw,k denotes the fluid pressure at the entrance of fracture wing k, Pa. Δppf,k denotes the friction pressure drop arisen from fluid passing the perforation of fracture wing k, Pa. Δpcf,k denotes the cumulative friction pressure drop from the heel of wellbore to fracture wing k, Pa.
The perforation friction pressure drop is estimated by [57].
Δ p p f , k = 0.8037 ρ Q k 2 n p , k 2 d p , k 4 C p 2
where ρ denotes the density of fluid, kg/m3. np,k is the perforation number of fracture wing k. dp,k is the perforation diameter of fracture wing k, m. Cp denotes the perforation discharge coefficient.
The friction pressure drop along the wellbore is calculated by:
Δ p c f , k = 128 μ π D 4 j = 1 k ( x j x j 1 ) ( Q T k = 1 2 ( j 1 ) Q k )
where D denotes the diameter of horizontal wellbore, m. xj is the distance from the heel point of wellbore to the fracture wing j, m.
As for the fluid flow in the fracture, the Poiseuille law gives the kinetic equation as follows:
q = h w 3 12 μ p s
where q denotes the fluid flow rate passing the fracture cross section, m3/s. w denotes the fracture width, m. μ is the fluid viscosity, Pa∙s. s denotes the local distance of observation point along the fracture, m.
The permeability of matrix is too low in tight or shale gas reservoirs, so that the leakoff of fluid could be ignored. Neglecting the compressibility of fluid, the local conservation equation could be written as:
q s + h w t = 0
Integrating the Equation (13) gives the global conservation equation as:
0 t Q T d t = k = 1 2 m 0 L k ( t ) h w d s

3. Numerical Solution

3.1. Discretized Form

Substituting the fluid pressure and the horizontal principal stresses for the normal and shear stresses in the Equations (1) and (2) gives the discretized form of DDM equation.
p i σ h sin 2 θ i σ H cos 2 θ i = j = 1 N G i j C n s i j D s j + j = 1 N G i j C n n i j D n j , i = 1 , .. , N
1 2 ( σ h σ H ) sin 2 θ i = j = 1 N G i j C s s i j D s j + j = 1 N G i j C s n i j D n j , i = 1 , .. , N
where σH and σh denote the maximum and minimum horizontal principal stresses, Pa.
According to the local conservation law, the discretized form of fluid flow along the fracture element is written as:
Δ t j q i j t + h l i ( w i t w i t Δ t ) = 0 , i = 1 , .. , N
where qij denotes the fluid flow rate between the fracture element i and j, which is expressed with the fluid pressure.
q i j = h 48 μ ( w i + w j ) 3 l i + l j ( p i p j )

3.2. Iterative Scheme

Due to the nonlinearity of the fluid flow equation and the perforation friction pressure equation, an iterative scheme is needed. Considering the linearity of DDM equations, the displacement discontinuities can be directly solved if the fluid pressure is given. Therefore, the fluid pressure, the fluid flow rate into each fracture wing, and the time increment are chosen as the iterative variables. The iterative steps are set as follows: giving the iterative variables with initial guess values, the fracture width is obtained by solving the discretized form of DDM Equations (15) and (16). There are N equations obtained from the discretized form of fluid flow Equation (17), 2m equations from the flow rate Equation (8), and two equations from the pressure Equation (9) and the global conservation Equation (14). The number of unknowns and discretized equations are both equal to N + 2m + 2. It is then solved by the Newton iteration method, and the partial derivative in Jacobian matrix is calculated by numerical approximation. The flowchart is illustrated in Figure 1.

4. Optimization with PSO Method

4.1. PSO Method

The particle swarm optimization method (PSO) is a kind of evolutionary computing technology, which was proposed by Eberhart and Kennedy [58]. The fundamental idea of PSO is to seek the best solution based on the collaboration and information sharing between particles. It has the advantages of easy implementation, less adjustment parameters, fast convergence speed, high solution quality, and good robustness.
The PSO method is described as follows. Given Np particles in the swarm, the position of particle i is denoted as zi, and its velocity is denoted as vi. pbesti denotes the optimal position of the particle i searched, and gbest denotes the optimal position of the swarm searched. The evolutions of particle velocity and position between consecutive generation are updated as follows:
v i ( l + 1 ) = ω v i ( l ) + c 1 r 1 ( p b e s t i z i ( l ) ) + c 2 r 2 ( g b e s t z i ( l ) )
z i ( l + 1 ) = z i ( l ) + z i ( l + 1 )
where l denotes the lth generation. ω is the inertia weight coefficient. c1 and c2 represent the acceleration coefficients. r1 and r2 denote two independent random numbers which obey uniform distribution between [0, 1].
From Equations (19) and (20), the updating of particle position and velocity only depend on its own optimal position and the global optimal position of the swarm, and there is no dependency between particles.

4.2. Optimization Scheme

To achieve the balanced growth of multiple cluster fractures, the PSO method is combined with the proposed numerical model to search the optimal treatment parameters including cluster spacings and perforation parameters. The specific implementation steps are as follows, and the flowchart is shown in Figure 2.
Step 1. Initiate each particle position and velocity using the random generation method. The particle position represents the optimal variable, for example cluster spacing or perforation parameters.
Step 2. Estimate the fitness value of each particle by using proposed numerical model. Taking a particle position as model input parameter, the fracture propagation process is simulated, and the variance of multiple fracture length is calculated and assigned to fitness value of the particle.
Step 3. For each particle, make a comparison between its current fitness value and the fitness value of best position it experienced, and if it is better, take its position as current best position.
Step 4. For each particle, make a comparison between its current fitness value and the fitness value of best position the swarm experienced, and if it is better, replace the global best position of the swarm by its position.
Step 5. The velocity and position of particles are evolved in the light of Formulas (19) and (20).
Step 6. Exit the loop when the fitness value of the global best position is less than preset error or the evolution generation reaches the maximum generation, otherwise return to step 2.

5. Results and Analysis

The fracture propagation model is firstly validated, and then it is employed to simulate multiple fractures propagation. Finally, the optimizations of cluster spacings and perforation parameters are carried out based on the numerical model and PSO method.

5.1. Validation of Numerical Model

To prove that the proposed numerical model captures fracture propagation accurately, the comparison is made between the numerical solution and the analytical solution to KGD fracture model [59]. The basic parameters with the Young’s modulus equaling 30 GPa, the Poisson’s ratio equaling 0.25, and fluid viscosity equaling 0.1 Pa∙s, are used.
The comparison results of fracture half-length using different injection rates are shown in Figure 3. The numerical solutions are in accordance with the analytical solutions for all cases with different injection rates. This validates the accuracy of the proposed numerical model. Thus, it is effective to carry out optimization based on the numerical model.

5.2. Propagation of Multiple Hydraulic Fractures

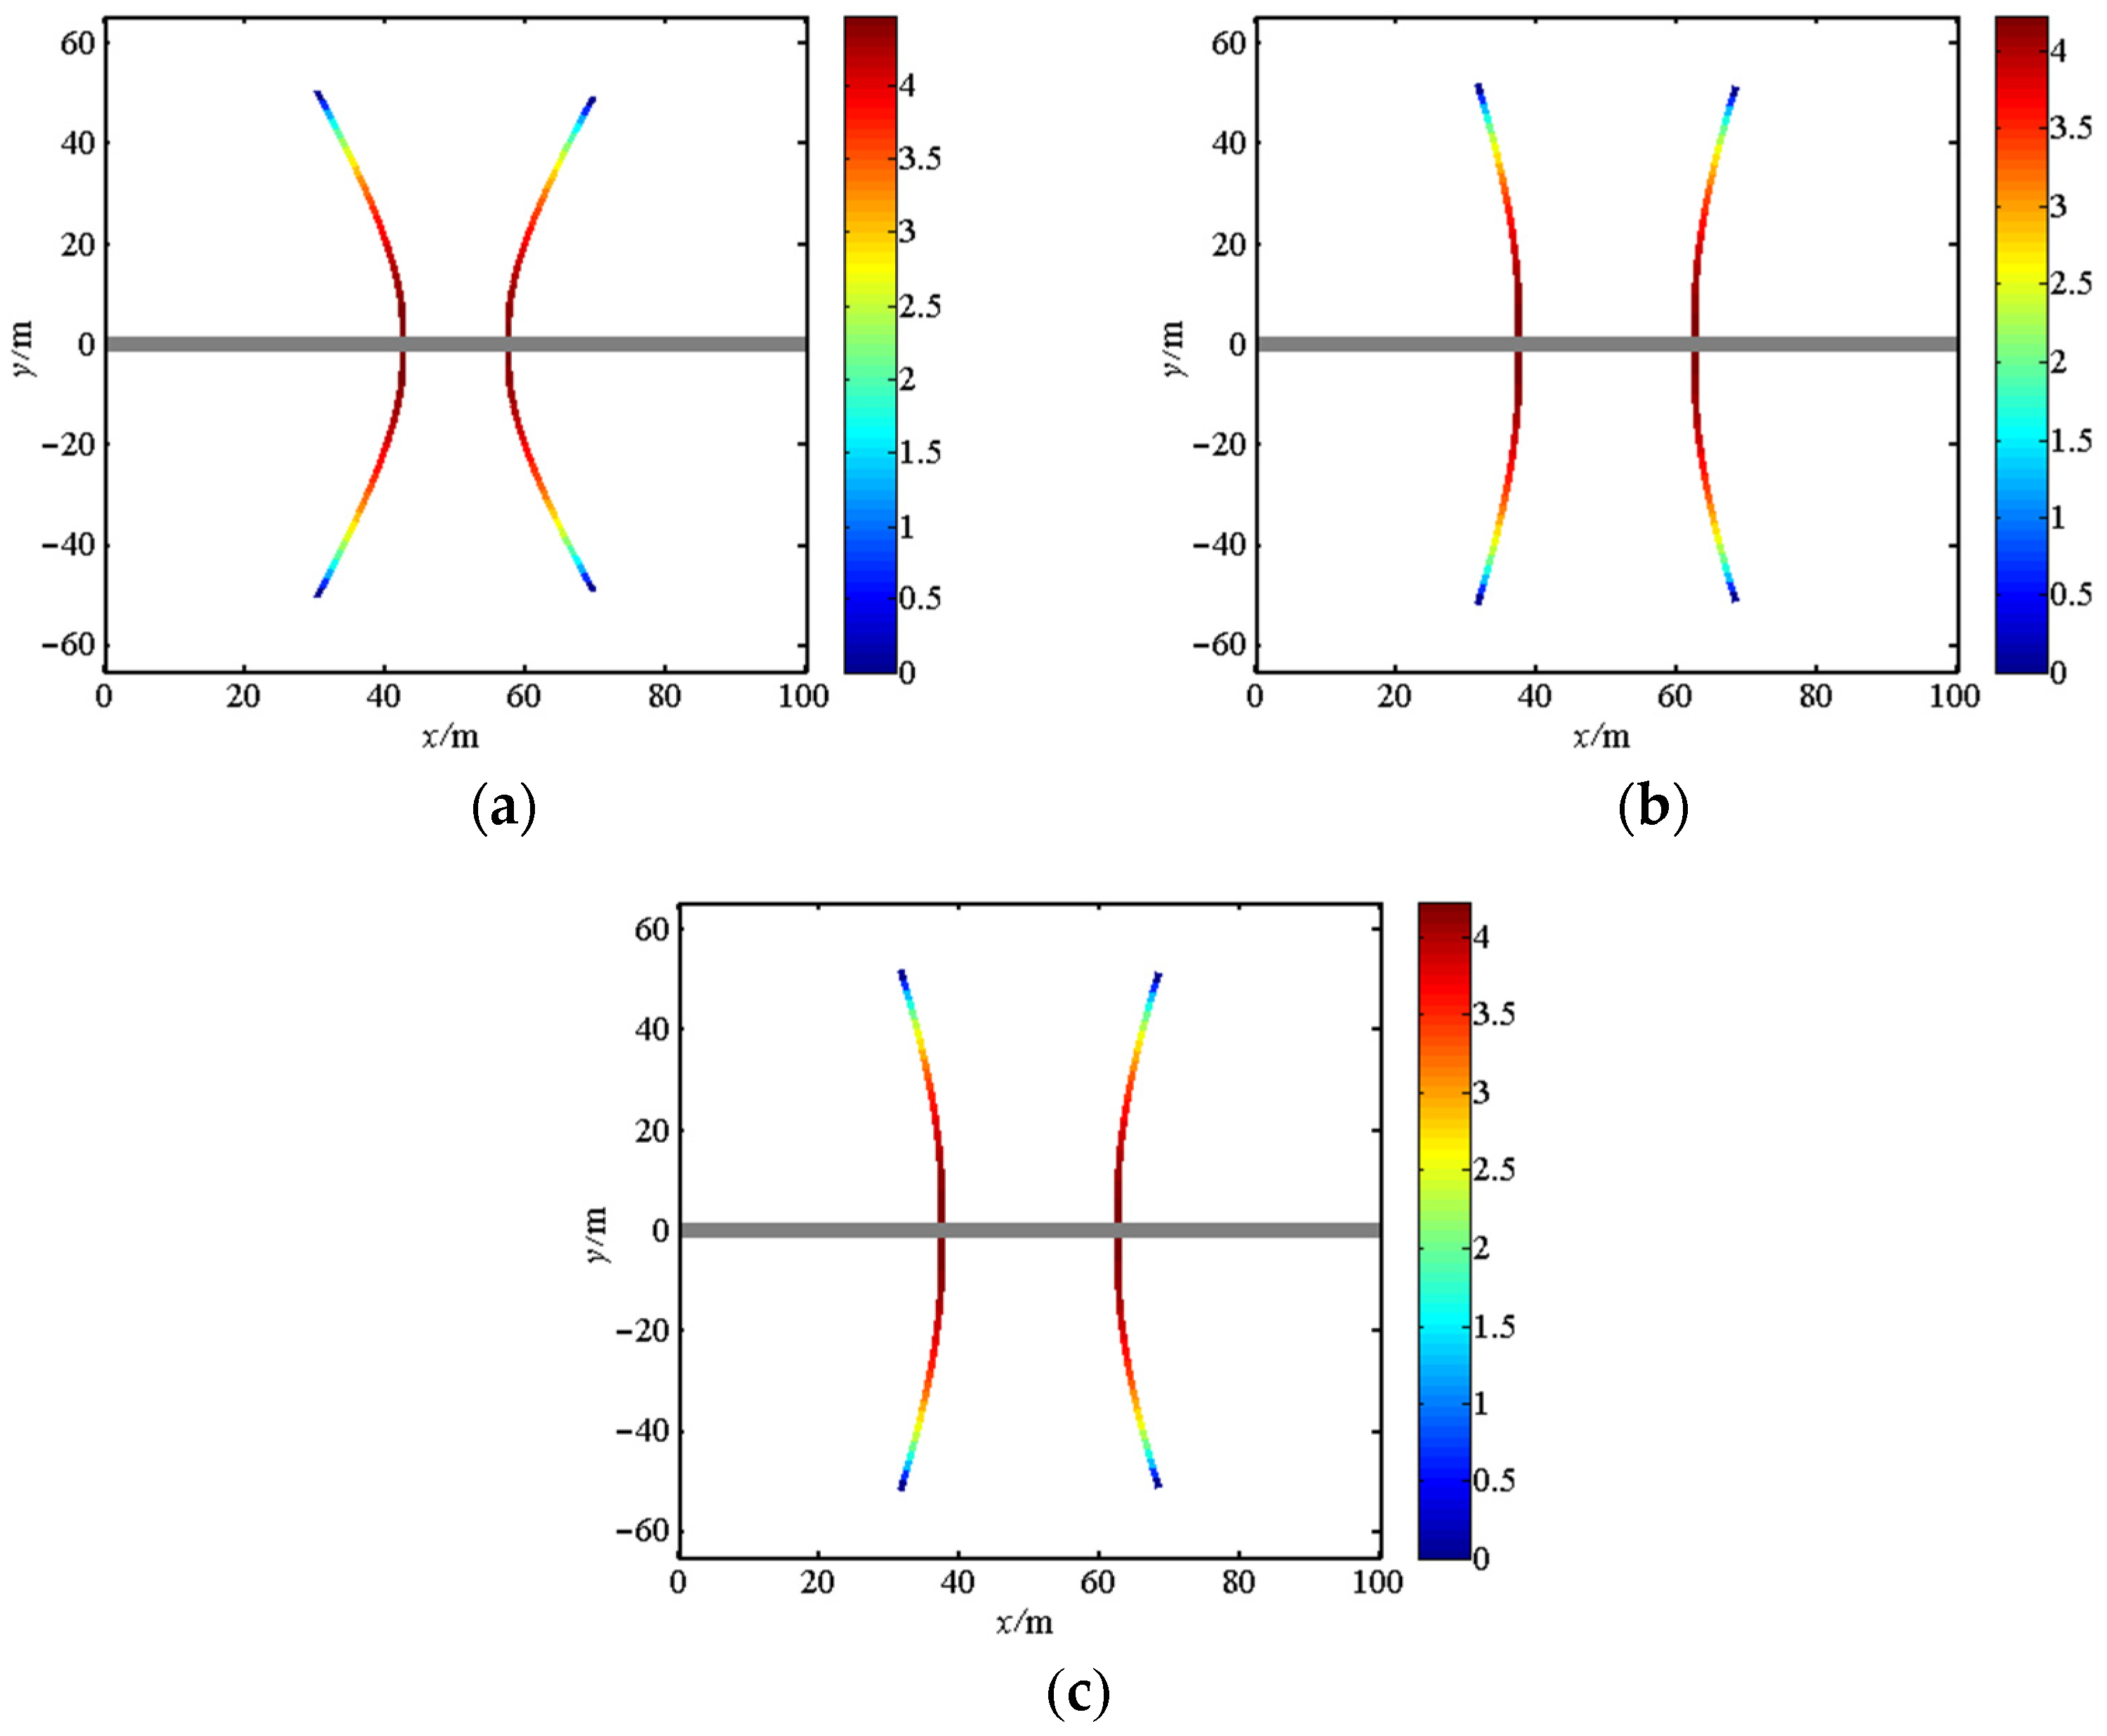
Two-cluster, three-cluster, and four-cluster fracturing treatments are commonly used to stimulate unconventional reservoirs. By using the proposed numerical method, the synchronized extension of multiple hydraulic fractures is simulated. The input parameters are used in the simulation as shown in Table 1. As the control group for optimization, the cluster spacings and perforation parameters are set to be uniform in these following cases in this section.
For two-cluster fracturing, the propagation results with different cluster spacings from 15 m to 35 m are shown in Figure 4. The paths of two cluster fractures are observed to be symmetrical, and the curvature of fracture path drops as cluster spacing decreases. The lengths of two fractures are so close that no optimization is needed anymore for these cases.
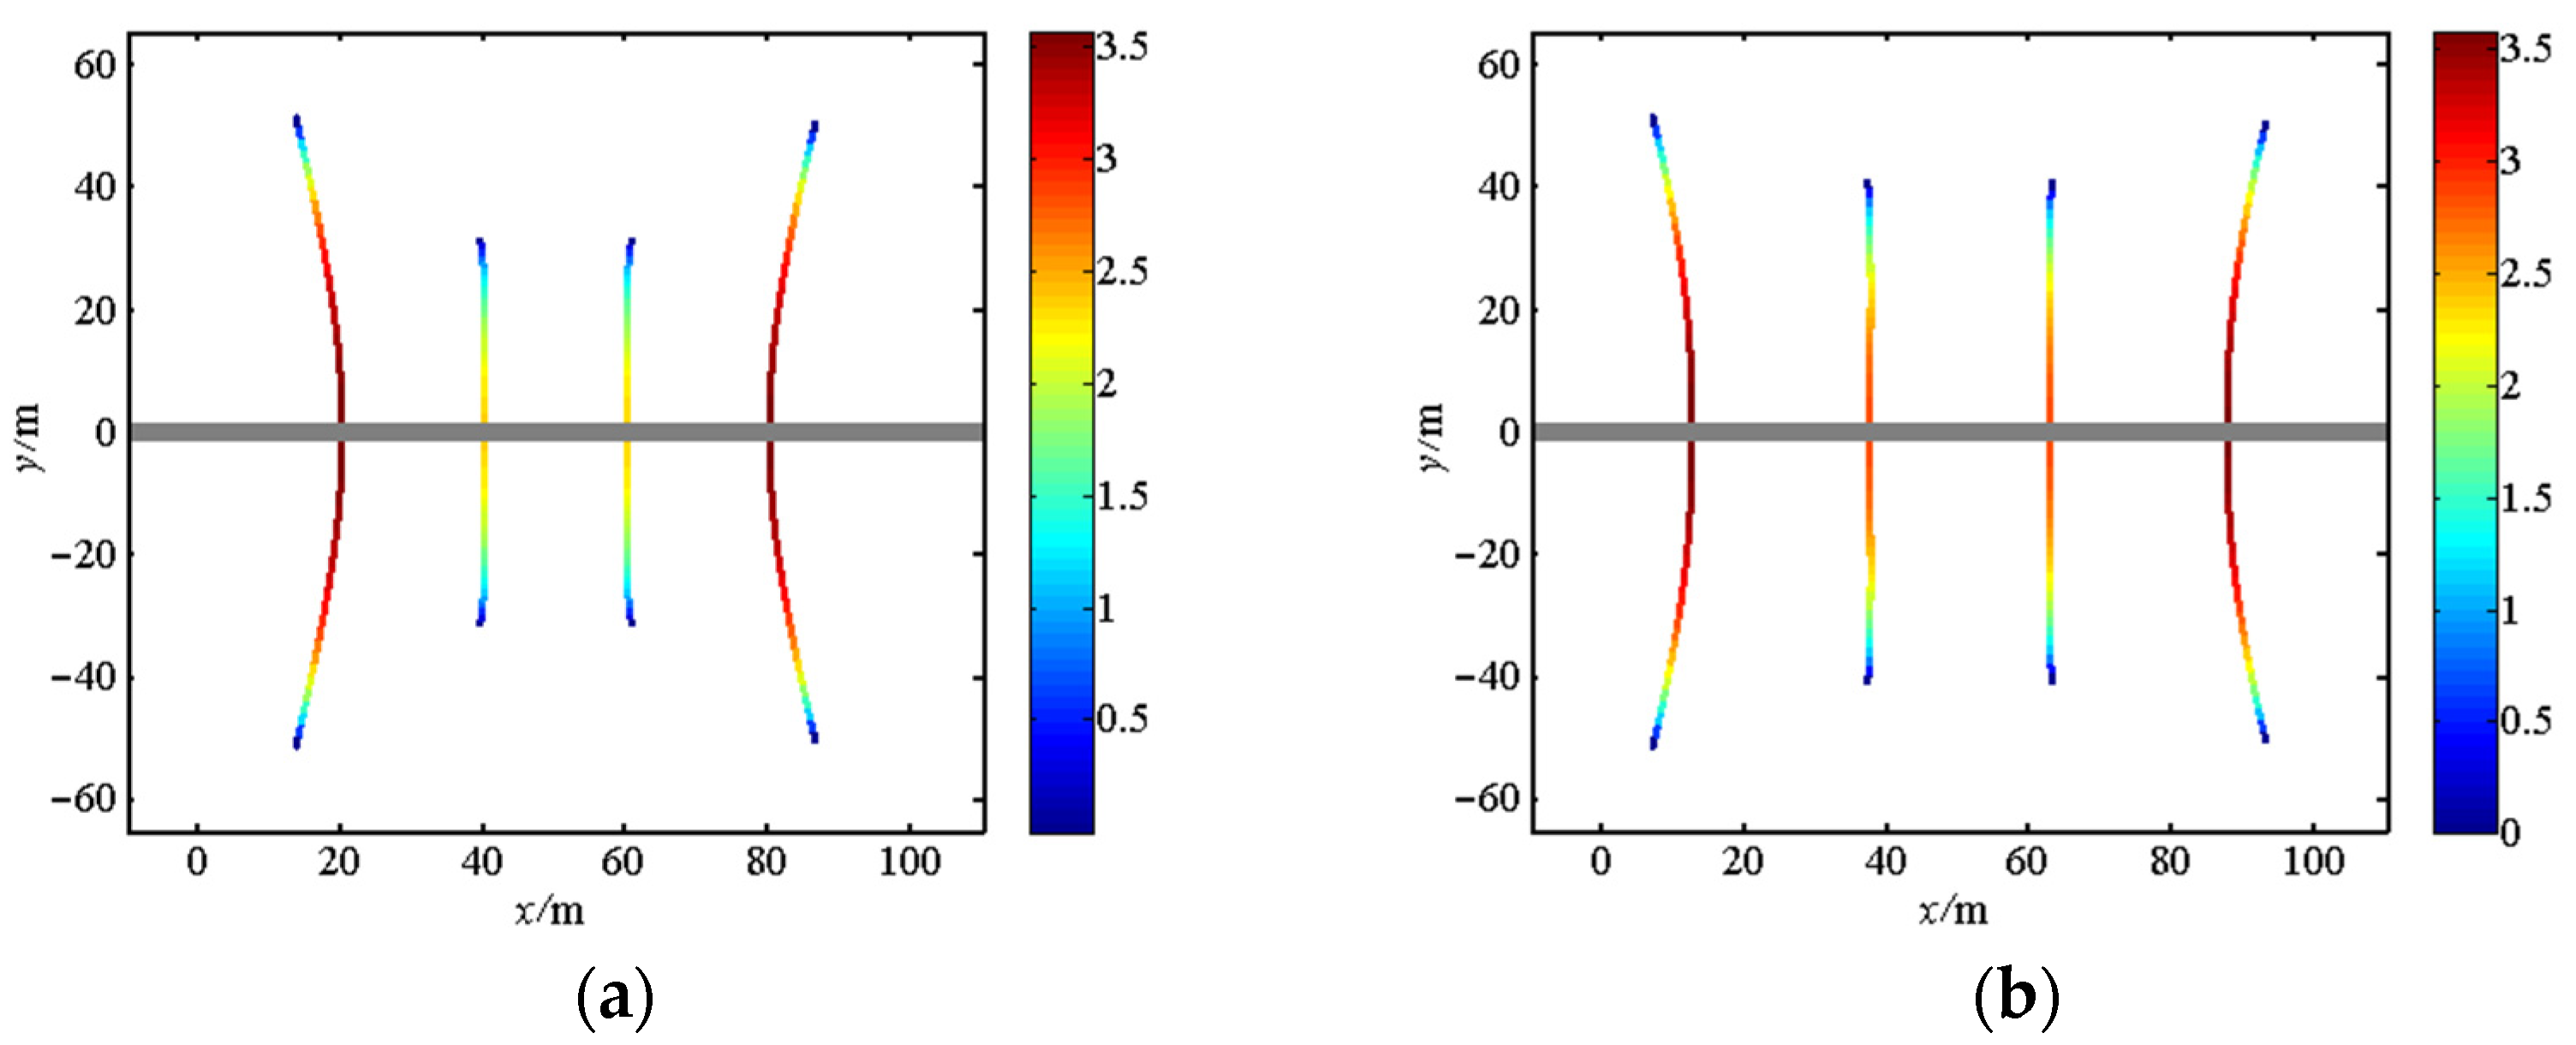
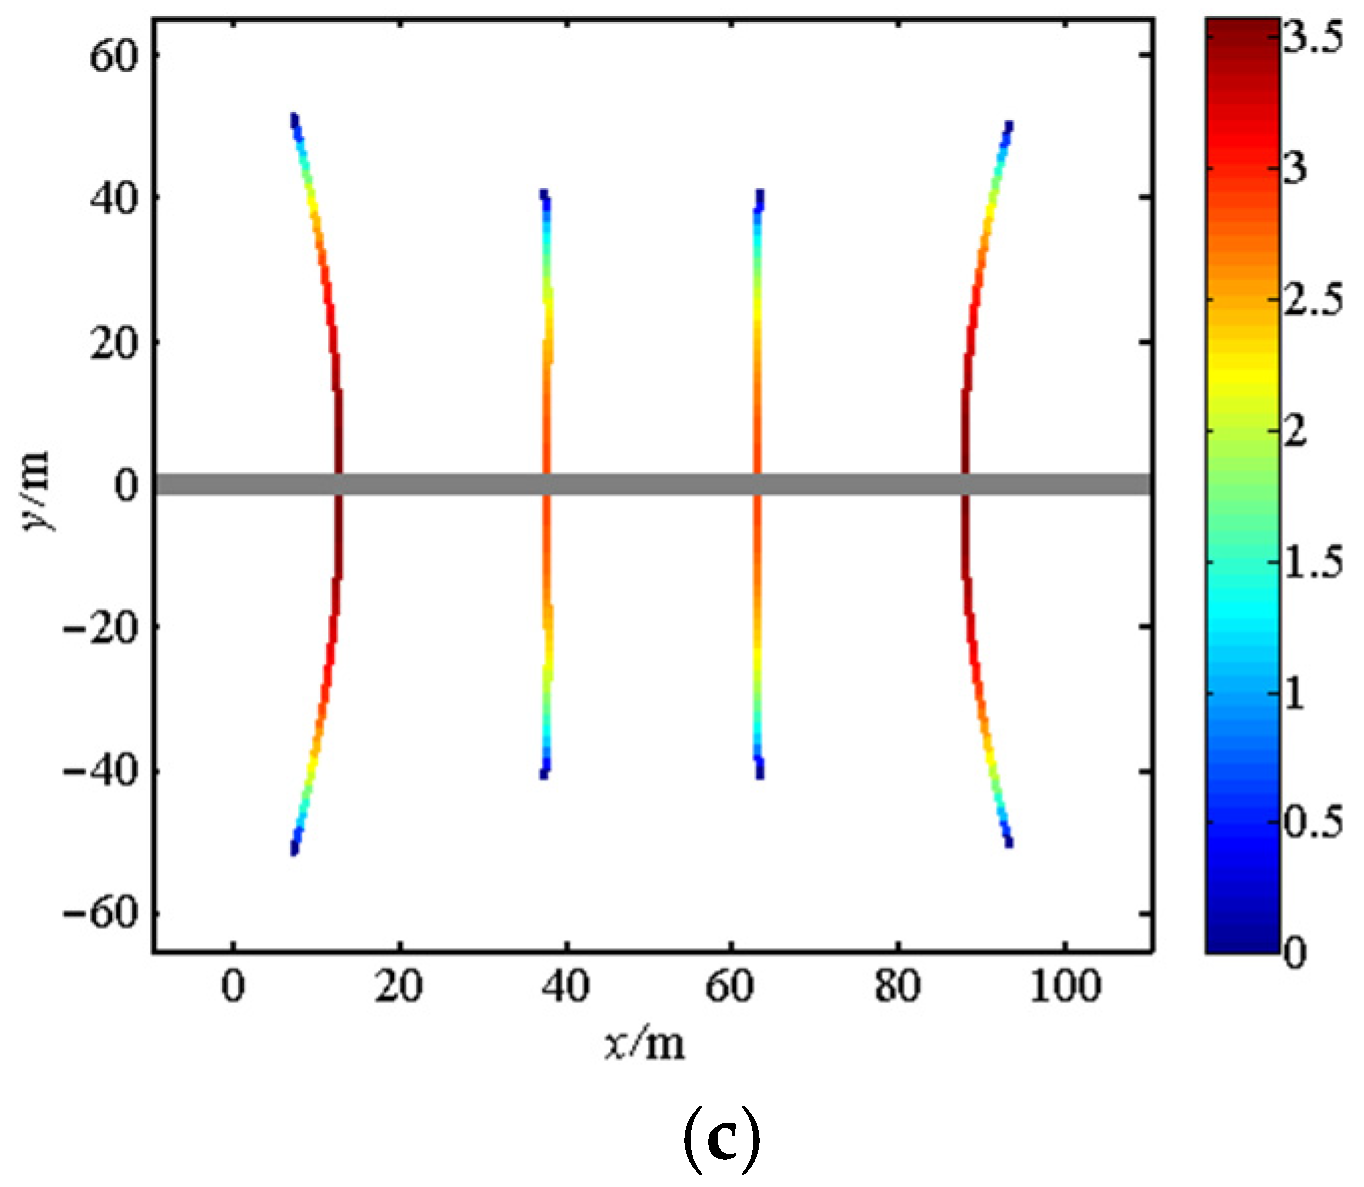
For three-cluster fracturing, there is little variance in the propagation direction of the middle fracture, but great variation in two side fractures’ directions as shown in Figure 5. The side fractures propagate away from the middle cluster fracture. The length of the middle fracture is smaller than that of side fractures, and the difference between them gradually descends as the cluster spacing increases. The same phenomena are observed for four-cluster fracturing as shown in Figure 6. The intrinsic mechanism is that stress shadowing is induced between multiple fractures and it exerts more compression on middle fractures. It is unfavorable for the middle fractures’ propagation, which gives rise to unbalanced growth of multiple fractures. Thus, optimization should be carried out to achieve best performance.

5.3. Optimization of Cluster Spacings

Due to stress shadowing, competition effect exists between multiple fractures propagation. The unbalanced growth of multiple cluster fractures is usually obtained when using uniform cluster spacings. Thus, the cluster spacings are to first be optimized to achieve the balanced growth. To characterize the balanced growth of multiple fractures, the variance of all fracture lengths is calculated after propagation solution. Take three-cluster fracturing, for example, the optimization of two cluster spacings can be transformed to optimization of single cluster spacing given that Δ x 1 + Δ x 2 = Δ S , which can be expressed by
min   s 2 ( Δ x 1 ) s . t .   0 < Δ x 1 < Δ s
where s2 represents the variance of fracture lengths. Δx1 and Δx2 are two cluster spacings, and ΔS denotes the total spacing from the first cluster to the last cluster in one stage.
The variance of fracture lengths is calculated as:
s 2 = j m ( L i L ¯ ) 2 m 1
where Li is the length of fracture i, and L ¯ is the average length of all fractures.
As demonstrated above, the optimization process is captured by the PSO method, and the fitness value is exactly the lengths variance acquired by numerical model. The parameters for PSO optimization are set as follows: the number of particles in the swarm and the maximum generation are set equal to 10, and the preset error is set equal to 0.01. For three-cluster fracturing, the optimized cluster spacings and corresponding variances for different total spacings are obtained as shown in Figure 7. The variance of fracture length drops rapidly with the increase of the total spacing. It is interesting that the optimized cluster spacing differs little between fractures, nearly half of the total spacing.
For four-cluster fracturing, similar procedure is performed to optimize cluster spacings. The results are shown in Figure 8. The optimized spacing between the two middle fractures is larger than other two cluster spacings, while the other two sides cluster spacings differ little from each other. The optimized results are similar to that of Wang and Olson [60]. This is because strong stress interference is imposed on the two middle fractures, and increasing the spacing between them could weaken the stress interference, therefore promoting longer growth.
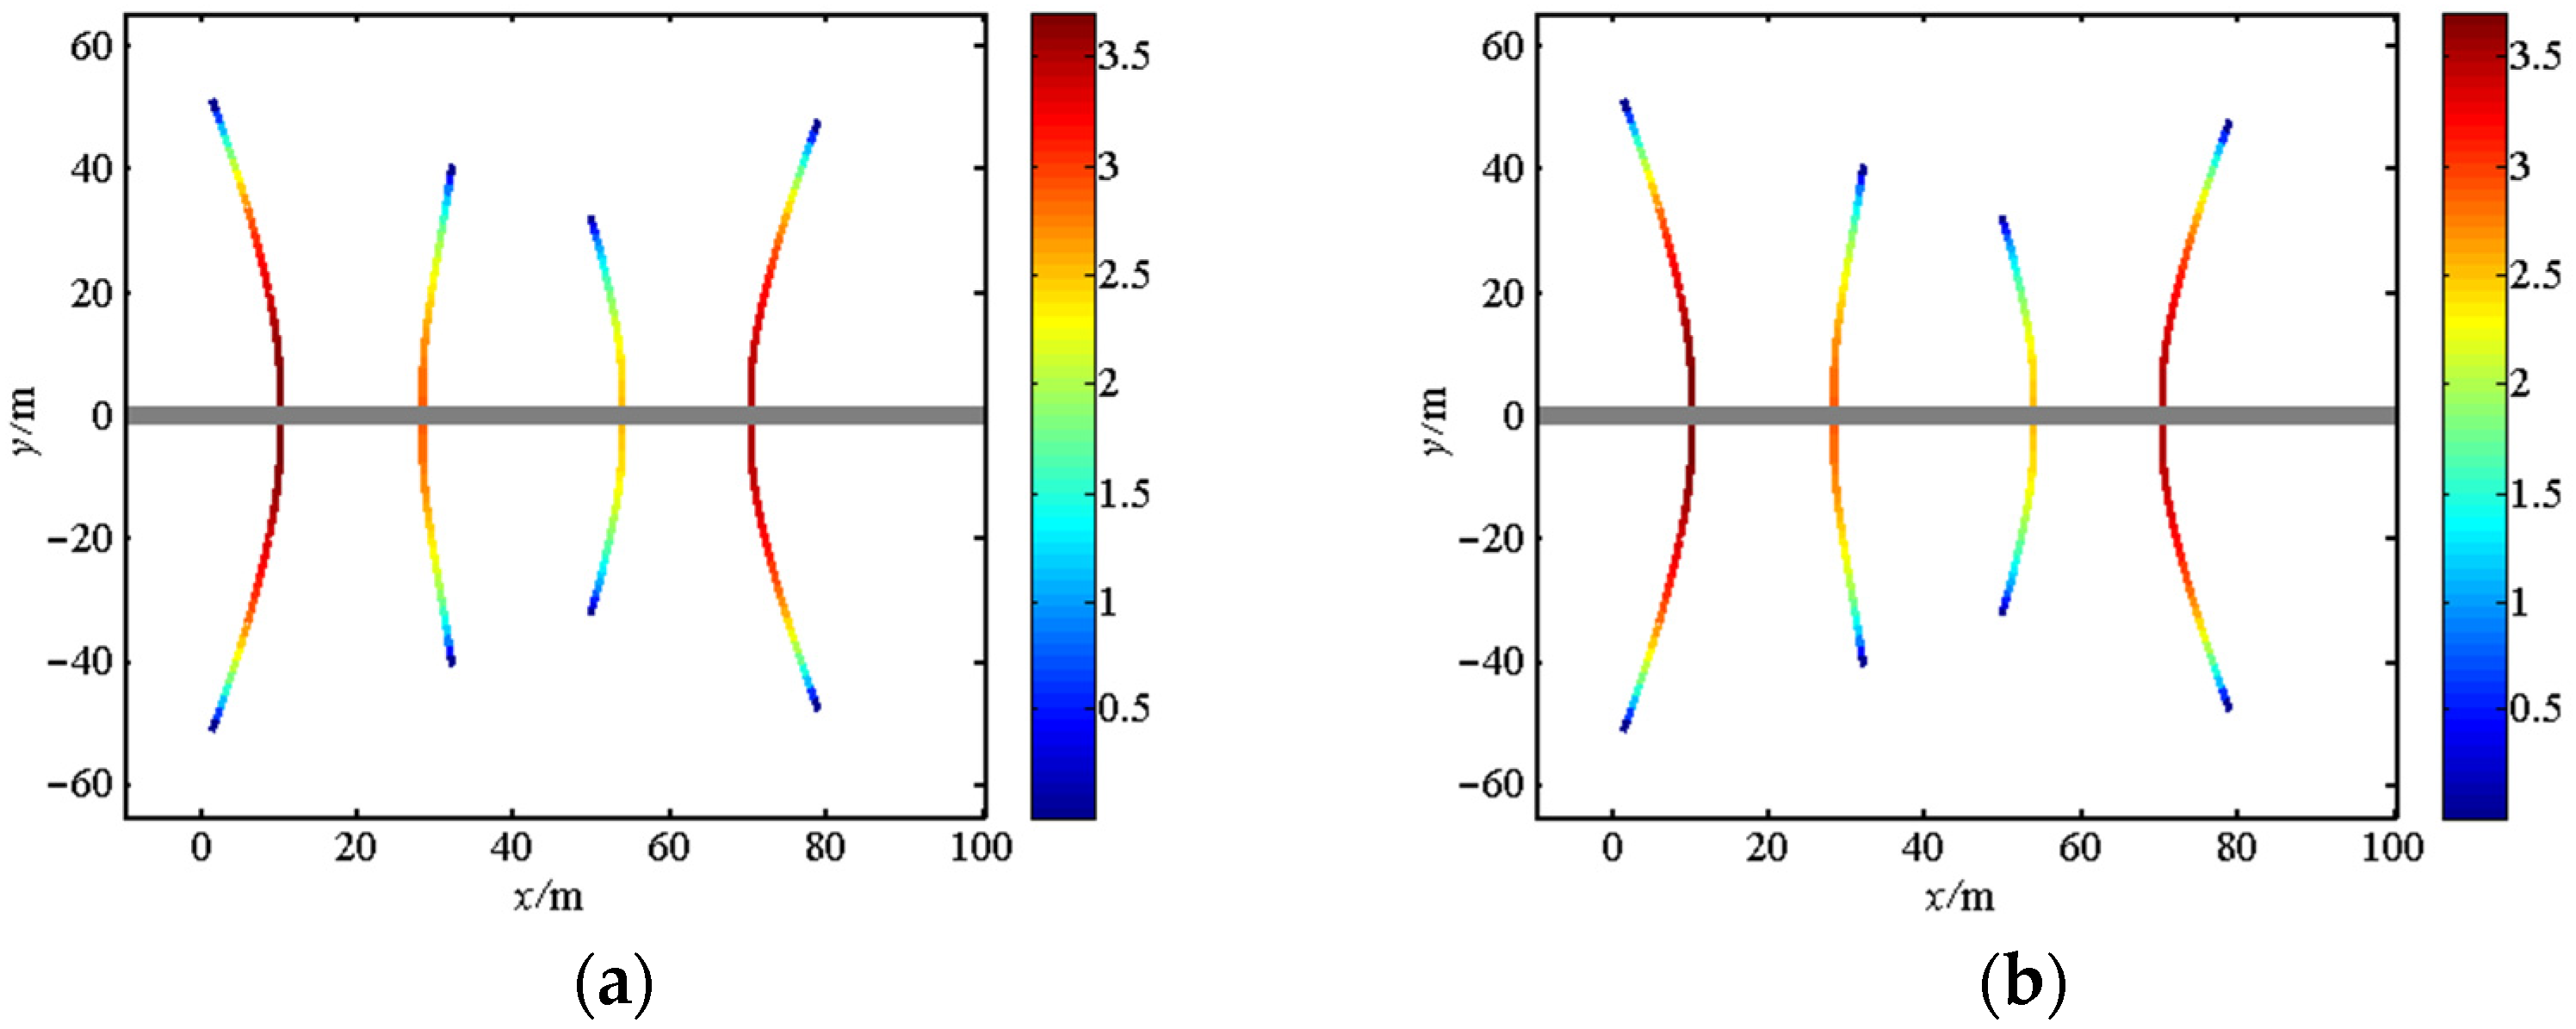
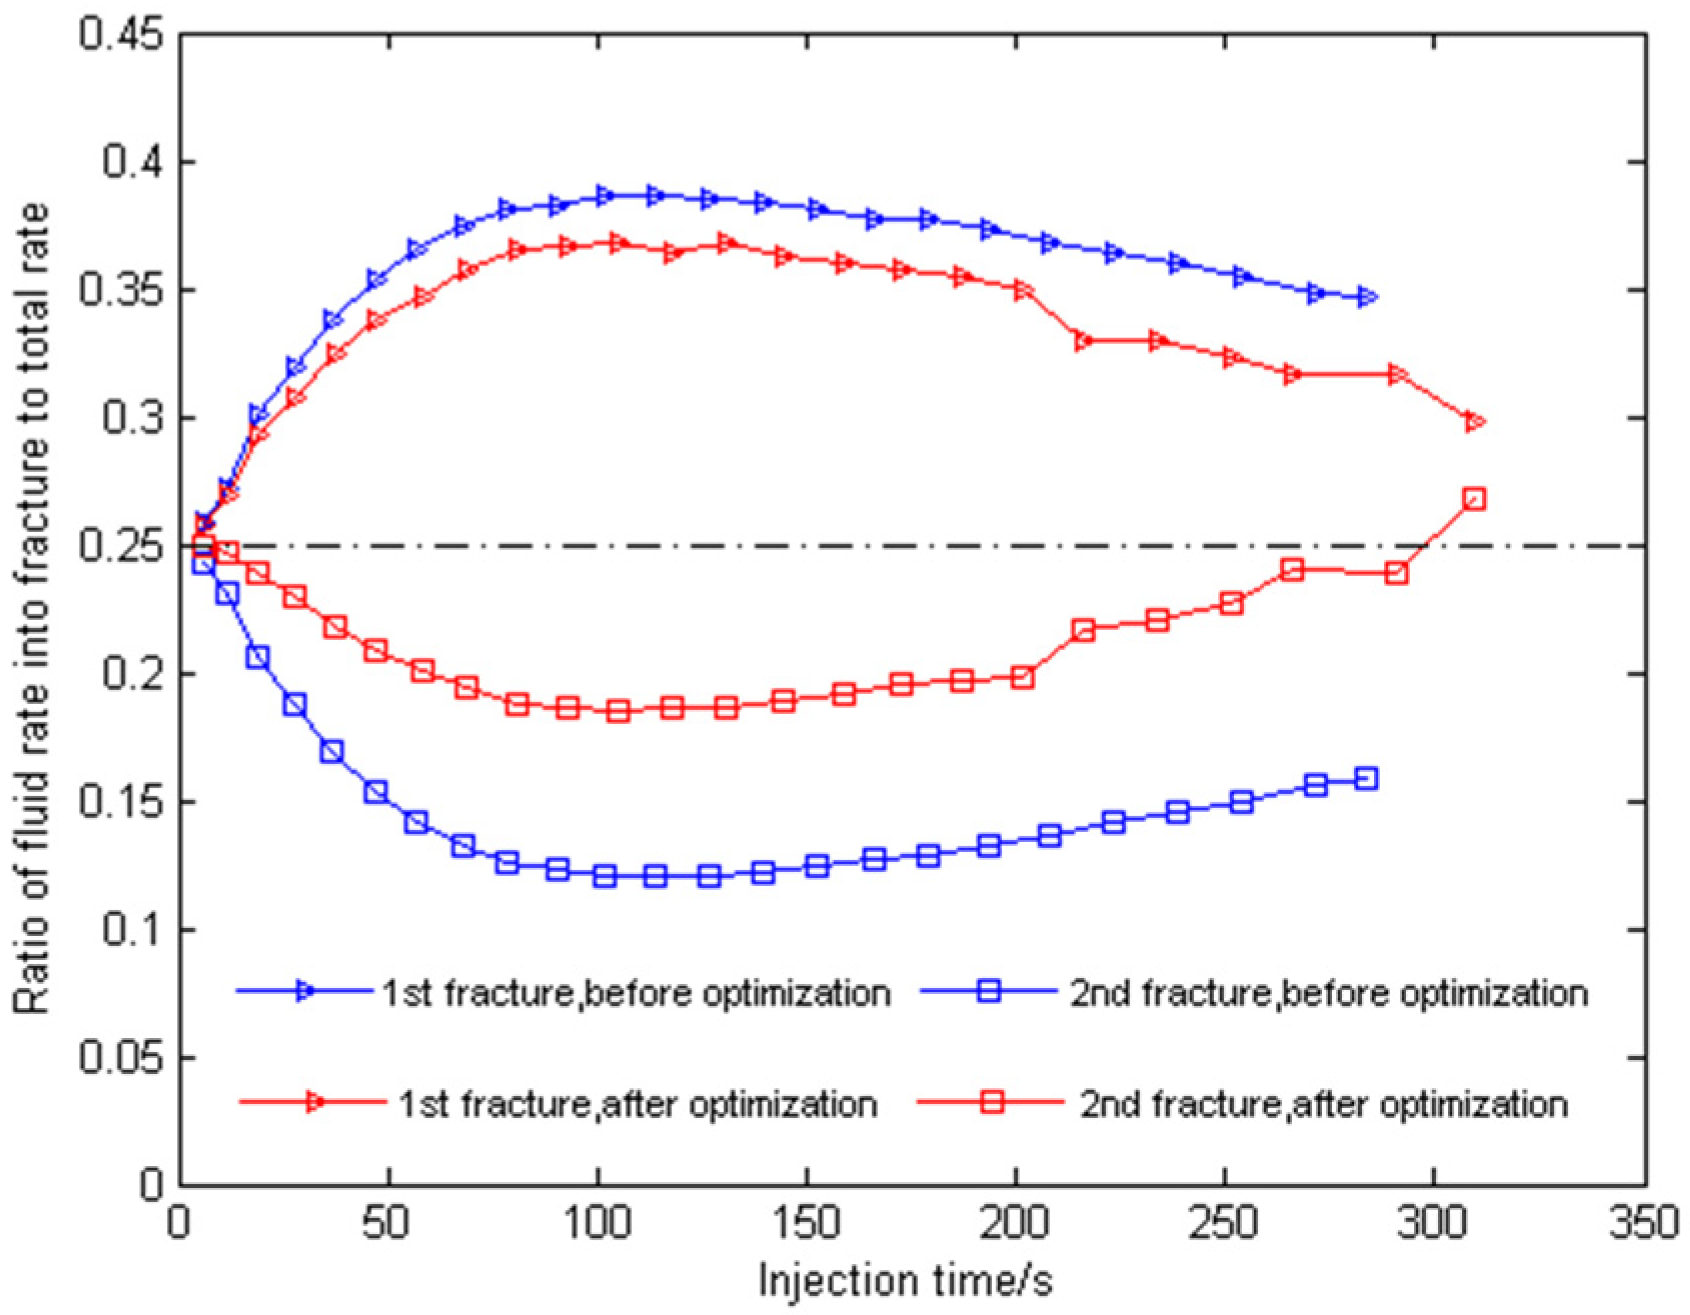
Furthermore, the fracture propagation paths are obtained with the optimized cluster spacings as shown in Figure 9. The pattern of fracture path has been changed in comparison with the cases using uniform cluster spacings (Figure 6). The middle two fractures depart from the side fractures and propagate towards each other. The fracture propagation geometry after optimization is also similar to that of Wang and Olson [60]. The variance of fracture lengths has dropped from 98.9 to 50.8 by using the optimized cluster spacings for the same total spacing of 60 m. This indicates that the variance of fracture lengths falls through optimizing the cluster spacings. After the optimization, the fluid rate partition into each fracture has also changed. To compare the fluid rates into the side fractures and middle fractures, the ratio of them into the first and second fracture are drawn as shown in Figure 10 for both cases before and after optimization with the total spacing equaling 60 m. The fluid rate into two fractures get closer after optimization. However, the value of variance of fracture lengths and the difference of fluid rate into side fracture and middle fracture are still too large when using the small total spacing. One reason is that each cluster is perforated with the same parameters. Thus, optimization should be further performed in terms of perforation parameters.

5.4. Optimization of Perforation Parameters

For multiple cluster fracturing, usually most of the fracturing fluid flows into the side fractures. The cluster spacings have been optimized above to improve the fluid rate distribution, however, the balanced growth of all fractures is still not achieved. Further, the perforation parameters need to be optimized by adopting non-uniform perforation parameters for each cluster to ensure more fluid flowing into the middle fracture. As described in perforation friction pressure drop, two essential parameters are perforation diameter and number for each cluster, which are selected as the optimization variables. The commonly used perforation diameter varies within the range between 7 mm and 15 mm, and the perforation number varies within the range between 10 and 30. Therefore, take three-cluster fracturing, for example, the optimization problem is expressed as follows:
min   s 2 ( n p , 1 , n p , 2 , n p , 3 , d p , 1 , d p , 2 , d p , 3 ) s . t .   10 n p , k 30 ,   k = 1 , 2 , 3 0.007 d p , k 0.015 ,   k = 1 , 2 , 3
From Figure 7 and Figure 8, the fracture length variances of three-cluster fracturing cases with the total spacing equaling 40 m and 50 m, four-cluster fracturing cases with the total spacing equaling 60 m and 70 m are not desirable, thus these cases are adopted for further optimization of perforation parameter. It should be pointed out that this round optimization is carried out based on the optimized cluster spacing. Based on the optimization scheme of the PSO method, the optimized perforation parameters are obtained as shown in Table 2. The fracture length variances drop greatly in contrast with the results before optimization. More specifically, the variance drops from 130.83 to 16.23 (87.6% reduction) for the three-cluster fracturing case with the total spacing equaling 40 m, and it drops from 50.8 to 8.31 (84.5% reduction) for the four-cluster fracturing case with the total spacing equaling 60 m. For the other two cases, the variances have dropped to very small values. It indicates the balanced growth of all fractures is greatly improved. Moreover, it is interesting to find that the optimized perforation number and diameter are the same for the three-cluster fracturing cases with different total spacing. The perforation number and diameter of the middle fracture are the largest. For the four-cluster fracturing cases, the optimized perforation number and diameter of the two middle fractures are larger than that of the two side fractures. However, the relationship of value greatness between the perforation parameters of the two middle fractures is not specific.
To visually observe the optimization results, the fracture propagation paths for four-cluster fracturing cases using the optimized perforation parameters are obtained as shown in Figure 11. The lengths of the two middle fractures are very close to that of side fractures, especially when the total spacing equals 70 m. The reason for this is that greater perforation number and diameter are employed for the middle clusters than that for the side clusters, and then smaller pressure drops of perforation friction are induced. Therefore, more energy is used for fluid viscosity dissipation, and more fluid flows into the middle fractures in comparison with the case using uniform perforation parameters. This could be verified in the evolution of fluid rate distribution. From Figure 10, the fluid rates into the first and second fractures get closer after the optimization of cluster spacings. For further comparison, the optimization of cluster spacings and perforation parameters are denoted as the first and second round of optimization. The comparison of fluid rate into each fracture between two rounds of optimization is shown in Figure 12. The fluid rates of two fractures get much closer after two rounds of optimization.

6. Conclusions

An optimization workflow combining the fracture propagation model and PSO method is proposed for multiple cluster fracturing in a horizontal well. It is found that using the uniform fracture spacings between clusters and the same perforation parameters for each cluster is not conducive to the balanced growth of multiple fractures. Therefore, the optimization study is performed by assuming non-uniform cluster spacings and perforation parameters. After the optimization, the variance of fracture lengths drops greatly and falls within the acceptable range. It is concluded that properly increasing the spacing between middle fractures and their perforation number/diameter could promote the balanced growth of multiple cluster fractures. The obtained results may provide useful information in improving hydraulic fracturing design. However, it should be mentioned that the proposed fracture propagation model is constrained to 2D without considering fracture height growth. If fracture height growth is considered, the optimization objective in this study needs to be changed to the overall effective contact area or the variance of effective contact area for each cluster. Fracture height growth make stress interference more severe when the fracture propagates in laminated reservoirs [61], which results in that the optimized cluster spacings for inner clusters becoming larger.

Author Contributions

Conceptualization, J.Y. and Q.Z.; methodology, Q.Z.; software, Q.Z.; validation, W.L.; formal analysis, W.L.; writing—original draft preparation, Q.Z.; writing—review and editing, W.L.; supervision, J.Y.; funding acquisition, J.Y. and Q.Z. All authors have read and agreed to the published version of the manuscript.

Funding

This research was funded by the National Natural Science Foundation of China (grant nos. 51904321, 52034010 and 42174143), and Open Fund (PLN2020-5) of State Key Laboratory of Oil and Gas Reservoir Geology and Exploitation (Southwest Petroleum University).

Institutional Review Board Statement

Not applicable.

Informed Consent Statement

Not applicable.

Data Availability Statement

Not applicable.

Conflicts of Interest

The authors declare no conflict of interest.

References

  1. Crump, J.B.; Conway, M.W. Effects of perforation-entry friction on bottomhole treating analysis. J. Pet. Technol. 1988, 40, 1041–1048. [Google Scholar] [CrossRef]
  2. Cramer, D.D. The application of limited-entry techniques in massive hydraulic fracturing treatments. In Proceedings of the SPE Production Operations Symposium, Oklahoma City, OK, USA, 8 March 1987. [Google Scholar]
  3. McDaniel, B.W.; Willett, R.M.; Underwood, P.J. Limited-entry frac applications on long intervals of highly deviated or horizontal wells. In Proceedings of the SPE Annual Technical Conference and Exhibition, Houston, TX, USA, 3–6 October 1999. [Google Scholar]
  4. Zhang, Y.; Shao, J.; Liu, Z.; Shi, C. An improved hydromechanical model for particle flow simulation of fractures in fluid-saturated rocks. Int. J. Rock Mech. Min. 2021, 147, 104870. [Google Scholar] [CrossRef]
  5. Xu, G.; Wong, S.W. Interaction of multiple non-planar hydraulic fractures in horizontal wells. In Proceedings of the International Petroleum Technology Conference, Beijing, China, 26–28 March 2013. [Google Scholar]
  6. Wu, K.; Olson, J.E. Simultaneous multifracture treatments: Fully coupled fluid flow and fracture mechanics for horizontal wells. SPE J. 2014, 20, 337–346. [Google Scholar] [CrossRef]
  7. Zhao, J.; Chen, X.; Li, Y.; Fu, B. Simulation of simultaneous propagation of multiple hydraulic fractures in horizontal wells. J. Pet. Sci. Eng. 2016, 147, 788–800. [Google Scholar] [CrossRef]
  8. Wu, K.; Olson, J.E. Numerical investigation of complex hydraulic fracture development in naturally fractured reservoirs. SPE Prod. Oper. 2016, 31, 300–309. [Google Scholar] [CrossRef]
  9. Zeng, Q.; Yao, J. Numerical simulation of fracture network generation in naturally fractured reservoirs. J. Nat. Gas Sci. Eng. 2016, 30, 430–443. [Google Scholar] [CrossRef]
  10. Chen, Z. Finite element modelling of viscosity-dominated hydraulic fractures. J. Petrol. Sci. Eng. 2012, 88, 136–144. [Google Scholar] [CrossRef]
  11. Chen, Z.; Bunger, A.; Zhang, X.; Jeffrey, R.G. Cohesive zone finite element-based modeling of hydraulic fractures. Acta Mech. Solida Sin. 2009, 22, 443–452. [Google Scholar] [CrossRef]
  12. Liu, W.; Yao, J.; Zeng, Q. A numerical hybrid model for non-planar hydraulic fracture propagation in ductile formations. J. Petrol. Sci. Eng. 2021, 196, 107796. [Google Scholar] [CrossRef]
  13. Liu, W.; Zeng, Q.; Yao, J. Poroelastoplastic modeling of complex hydraulic-fracture development in deep shale formations. SPE J. 2021, 26, 2626–2650. [Google Scholar] [CrossRef]
  14. Zeng, Q.; Yao, J.; Shao, J. Numerical study of hydraulic fracture propagation accounting for rock anisotropy. J. Pet. Sci. Eng. 2018, 160, 422–432. [Google Scholar] [CrossRef]
  15. Liu, P.; Li, J.; Sun, S.; Yao, J.; Zhang, K. Numerical investigation of carbonate acidizing with gelled acid using a coupled thermal-hydrologic-chemical model. Int. J. Therm. Sci. 2021, 160, 1–18. [Google Scholar] [CrossRef]
  16. Zeng, Q.; Yao, J.; Shao, J. An extended finite element solution for hydraulic fracturing with thermo-hydro-elastic–plastic coupling. Comput. Methods Appl. Mech. Engrg. 2020, 364, 112967. [Google Scholar] [CrossRef]
  17. Settgast, R.R.; Fu, P.C.; Walsh, S.D.; White, J.A.; Annavarapu, C.; Ryerson, F.J. A fully coupled method for massively parallel simulation of hydraulically driven fractures in 3-dimensions. Int. J. Numer. Anal. Met. 2017, 41, 627–653. [Google Scholar] [CrossRef]
  18. Zhao, Q.; Lisjak, A.; Mahabadi, O.; Liu, Q.; Grasselli, G. Numerical simulation of hydraulic fracturing and associated microseismicity using finite-discrete element method. J. Rock Mech. Geotech. Eng. 2014, 6, 574–581. [Google Scholar] [CrossRef] [Green Version]
  19. Yan, C.; Zheng, H.; Sun, G.; Ge, X. Combined finite-discrete element method for simulation of hydraulic fracturing. Rock Mech. Rock Eng. 2016, 49, 1389–1410. [Google Scholar] [CrossRef]
  20. Zhang, F.; Dontsov, E.; Mack, M. Fully coupled simulation of a hydraulic fracture interacting with natural fractures with a hybrid discrete-continuum method. Int. J. Numer. Anal. Methods Geomech. 2017, 41, 1430–1452. [Google Scholar] [CrossRef]
  21. Liu, L.; Zhu, W.; Wei, C.; Elsworth, D.; Wang, J. Microcrack-based geomechanical modeling of rock-gas interaction during supercritical CO2 fracturing. J. Petrol. Sci. Eng. 2018, 164, 91–102. [Google Scholar] [CrossRef]
  22. Guo, T.; Tang, S.; Liu, X.; Zhang, W.; Qu, G. Numerical simulation of hydraulic fracturing of hot dry rock under thermal stress. Eng. Fract. Mech. 2020, 240, 107350. [Google Scholar] [CrossRef]
  23. Mikelic, A.; Wheeler, M.F.; Wick, T. A phase-field method for propagating fluid-filled fractures coupled to a surrounding porous medium. Multiscale Model. Simul. 2015, 13, 367–398. [Google Scholar] [CrossRef] [Green Version]
  24. Heider, Y.; Markert, B. A phase-field modeling approach of hydraulic fracture in saturated porous media. Mech. Res. Commun. 2016, 80, 38–46. [Google Scholar] [CrossRef]
  25. Chukwudozie, C.; Bourdin, B.; Yoshioka, K. A variational phase-field model for hydraulic fracturing in porous media. Comput. Methods Appl. Mech. Engrg. 2019, 347, 957–982. [Google Scholar] [CrossRef]
  26. Ni, T.; Pesavento, F.; Zaccariotto, M.; Galvanetto, U.; Zhu, Q.; Schrefler, B. Hybrid fem and peridynamic simulation of hydraulic fracture propagation in saturated porous media. Comput. Methods Appl. Mech. Engrg. 2020, 366, 113101. [Google Scholar] [CrossRef]
  27. Ouchi, H.; Katiyar, A.; Foster, J.; Sharma, M. A peridynamics model for the propagation of hydraulic fractures in naturally fractured reservoirs. SPE J. 2017, 22, 1082–1102. [Google Scholar] [CrossRef]
  28. Nadimi, S.; Miskovich, I.; McLennan, J. A 3d peridynamic simulation of hydraulic fracture process in a heterogeneous medium. J. Pet. Sci. Eng. 2016, 145, 444–452. [Google Scholar] [CrossRef]
  29. Yang, Y.; Tang, X.; Zheng, H.; Liu, Q.; Liu, Z. Hydraulic fracturing modeling using the enriched numerical manifold method. Appl. Math. Model. 2018, 53, 462–486. [Google Scholar] [CrossRef]
  30. Wu, Z.; Wong, L. Extension of numerical manifold method for coupled fluid flow and fracturing problems. Int. J. Numer. Anal. Methods Geomech. 2014, 38, 1990–2008. [Google Scholar] [CrossRef]
  31. Bakhshi, E.; Rasouli, V.; Ghorbani, A.; Fatehi Marji, M.; Damjanac, B.; Wan, X. Lattice numerical simulations of lab-scale hydraulic fracture and natural interface interaction. Rock Mech. Rock Eng. 2019, 52, 1315–1337. [Google Scholar] [CrossRef]
  32. Samimi, S.; Pak, A. A fully coupled element-free Galerkin model for hydro-mechanical analysis of advancement of fluid-driven fractures in porous media, Int. J. Numer. Anal. Methods Geomech. 2016, 40, 2178–2206. [Google Scholar] [CrossRef]
  33. Douillet-Grellier, T.; Pramanik, R.; Pan, K.; Albaiz, A.; Jones, B.D.; Pourpak, H.; Williams, J.R. Mesh-free numerical simulation of pressure-driven fractures in brittle rocks. In Proceedings of the SPE Hydraulic Fracturing Technology Conference, The Woodlands, TX, USA, 9–11 February 2016. [Google Scholar]
  34. Peng, S.; Zhang, Z.; Mou, J.; Zhao, B.; Liu, Z.; Ghassemi, A. Hydraulic fracture simulation with hydro-mechanical coupled discretized virtual internal bond. J. Petrol. Sci. Eng. 2018, 69, 504–517. [Google Scholar] [CrossRef]
  35. Peirce, A.P.; Bunger, A.P. Interference fracturing: Nonuniform distributions of perforation clusters that promote simultaneous growth of multiple hydraulic fractures. SPE J. 2015, 20, 384–395. [Google Scholar] [CrossRef] [Green Version]
  36. Chen, X.; Li, Y.; Zhao, J.; Xu, W.; Fu, D. Numerical investigation for simultaneous growth of hydraulic fractures in multiple horizontal wells. J. Nat. Gas Sci. Eng. 2017, 51, 44–52. [Google Scholar] [CrossRef]
  37. Sun, T.; Zeng, Q.; Xing, H. A model for multiple hydraulic fracture propagation with thermo-hydro-mechanical coupling effects. Energies 2021, 14, 894. [Google Scholar] [CrossRef]
  38. Wu, K.; Olson, J.E. Mechanisms of simultaneous hydraulic-fracture propagation from multiple perforation clusters in horizontal wells. SPE J. 2016, 21, 1000–1008. [Google Scholar] [CrossRef]
  39. Zeng, Q.; Liu, Z.; Wang, T.; Gao, Y.; Zhuang, Z. Fully coupled simulation of multiple hydraulic fractures to propagate simultaneously from a perforated horizontal wellbore. Comput. Mech. 2017, 61, 137–155. [Google Scholar] [CrossRef]
  40. Siebrits, E.; Elbel, J.L.; Hoover, R.S.; Diyashev, I.R.; Griffin, L.G.; Demetrius, S.L.; Wright, C.A.; Davidson, B.M.; Steinsberger, N.P.; Hill, D.G. Refracture reorientation enhances gas production in Barnett shale tight gas wells. In Proceedings of the SPE Annual Technical Conference and Exhibition, Dallas, TX, USA, 1–4 October 2000. [Google Scholar]
  41. Roussel, N.P.; Sharma, M.M. Optimizing fracture spacing and sequencing in horizontal-well fracturing. SPE Prod. Oper. 2011, 26, 173–184. [Google Scholar] [CrossRef]
  42. Liu, C.; Liu, H.; Zhang, Y.; Deng, D.; Wu, H. Optimal spacing of staged fracturing in horizontal shale-gas well. J. Pet. Sci. Eng. 2015, 132, 86–93. [Google Scholar] [CrossRef]
  43. Zeng, Y.; Zhang, X.; Zhang, B. Stress redistribution in multi-stage hydraulic fracturing of horizontal wells in shales. Petrol. Sci. 2015, 12, 628–635. [Google Scholar] [CrossRef] [Green Version]
  44. Yao, J.; Zeng, Q.; Huang, Z.; Sun, H.; Zhang, L. Numerical modeling of simultaneous hydraulic fracturing in the mode of multi-well pads. Sci. China Technol. Sci. 2017, 60, 232–242. [Google Scholar] [CrossRef]
  45. Zhao, J.; Zhao, J.; Hu, Y.; Zhang, S.; Huang, T.; Liu, X. Numerical simulation of multistage fracturing optimization and application in coalbed methane horizontal wells. Eng. Fract. Mech. 2019, 223, 106738. [Google Scholar] [CrossRef]
  46. Prashanth, S.; Wu, K.; Kwon, S.K. Optimization of simultaneously propagating multiple fractures in hydraulic fracturing to achieve uniform growth using data-based model reduction. Chem Eng. Res. Des. 2018, 136, 675–686. [Google Scholar]
  47. Wang, Y.; Li, X.; Zhang, B.; Zhao, Z. Optimization of multiple hydraulically fractured factors to maximize the stimulated reservoir volume in silty laminated shale formation, southeastern ordos basin, China. J. Pet. Sci. Eng. 2016, 145, 370–381. [Google Scholar] [CrossRef] [Green Version]
  48. Zeng, F.; Zhang, Y.; Guo, J.; Zhang, Q.; Zheng, Y. Optimized completion design for triggering a fracture network to enhance horizontal shale well production. J. Pet. Sci. Eng. 2020, 190, 107043. [Google Scholar] [CrossRef]
  49. Seyed, E.; Kaveh, A.; Hossein, M. Optimization of the horizontal-well multiple hydraulic fracturing operation in a low-permeability carbonate reservoir using fully coupled xfem model. Int. J. Rock Mech. Min. 2019, 114, 33–45. [Google Scholar]
  50. Xu, S.; Feng, Q.; Wang, S.; Farzam, J.; Li, Y. Optimization of multistage fractured horizontal well in tight oil based on embedded discrete fracture model. Comput. Chem. Eng. 2018, 117, 291–308. [Google Scholar]
  51. Meyer, B.; Bazan, L.; Jacot, R.; Lattibeaudiere, M. Optimization of multiple transverse hydraulic fractures in horizontal wellbores. In Proceedings of the SPE Unconventional Gas Conference, Pittsburgh, PA, USA, 23–25 February 2010. [Google Scholar]
  52. Yu, W.; Sepehrnoori, K. Optimization of well spacing for Bakken tight oil reservoirs. In Proceedings of the Unconventional Resources Technology Conference, Denver, CO, USA, 25–27 August 2014. [Google Scholar]
  53. Zhang, H.; Sheng, J. Optimization of horizontal well fracturing in shale gas reservoir based on stimulated reservoir volume. J. Pet. Sci. Eng. 2020, 190, 107059. [Google Scholar] [CrossRef]
  54. Morozov, A.; Popkov, D.; Duplyakov, V.; Mutalova, R.; Paderin, G. Data-driven model for hydraulic fracturing design optimization: Focus on building digital database and production forecast. J. Pet. Sci. Eng. 2020, 194, 107504. [Google Scholar] [CrossRef]
  55. Jiang, B.; Li, H.; Zhang, Y.; Wang, Y.; Wang, J.; Patil, S. Multiple fracturing parameters optimization for horizontal gas well using a novel hybrid method. J. Nat. Gas Sci. Eng. 2016, 34, 604–615. [Google Scholar] [CrossRef]
  56. Kang, C.A.; McClure, M.W.; Reddy, S.; Naidenova, M.; Zdravko, T. Optimizing shale economics with an integrated hydraulic fracturing and reservoir simulator and a bayesian automated history matching and optimization algorithm. In Proceedings of the SPE Hydraulic Fracturing Technology Conference and Exhibition, The Woodlands, TX, USA, 1–3 February 2022. [Google Scholar]
  57. Willingham, J.D.; Tan, H.C.; Norman, L.R. Perforation Friction Pressure of Fracturing Fluid Slurries. In Proceedings of the Low Permeability Reservoirs Symposium, Denver, CO, USA, 26–28 April 1993. [Google Scholar]
  58. Eberhart, R.; Kennedy, J. A new optimizer using particle swarm theory. In Proceedings of the Mhs95 Sixth International Symposium on Micro Machine & Human Science, Nagoya, Japan, 4–6 October 1995. [Google Scholar]
  59. Geertsma, J.; De Klerk, F. A rapid method of predicting width and extent of hydraulically induced fractures. J. Petrol. Technol. 1969, 21, 1571–1581. [Google Scholar] [CrossRef]
  60. Wang, J.; Olson, J.E. Auto-optimization of hydraulic fracturing design with three-dimensional fracture propagation in naturally fractured multi-layer formations. In Proceedings of the SPE/AAPG/SEG Unconventional Resources Technology Conference, Virtual, 20–22 July 2020. [Google Scholar]
  61. Mehrabi, M.; Pei, Y.; Haddad, M.; Javadpour, F.; Sepehrnoori, K. Quasi-static fracture height growth in laminated reservoirs: Impacts of stress and toughness barriers, horizontal well landing depth, and fracturing fluid density. In Proceedings of the SPE/AAPG/SEG Unconventional Resources Technology Conference, Houston, TX, USA, 26–28 July 2021. [Google Scholar]
Figure 1. Flowchart of iteration scheme for fracture propagation model.
Energies 15 05099 g001
Figure 2. Flowchart of optimization scheme.
Energies 15 05099 g002
Figure 3. Comparison results of fracture half-length using different injection rates. (The solid lines represent analytical solutions, and the dotted lines numerical solutions).
Energies 15 05099 g003
Figure 4. Fracture propagation path and fracture width distribution (mm) with different cluster spacings: (a) 15 m; (b) 25 m; (c) 35 m.
Energies 15 05099 g004
Figure 5. Fracture propagation path and fracture width distribution (mm) with different cluster spacings: (a) 20 m; (b) 25 m; (c) 30 m.
Energies 15 05099 g005
Figure 6. Fracture propagation path and fracture width distribution (mm) with different cluster spacings: (a) 20 m; (b) 25 m; (c) 30 m.
Energies 15 05099 g006aEnergies 15 05099 g006b
Figure 7. The optimized cluster spacings and corresponding variances for three-cluster fracturing.
Energies 15 05099 g007
Figure 8. The optimized cluster spacings and corresponding variances for four-cluster fracturing.
Energies 15 05099 g008
Figure 9. Fracture propagation paths and width distribution (mm) using optimized cluster spacing with different total spacings: (a) 60 m; (b) 70 m.
Energies 15 05099 g009
Figure 10. Comparison of ratio of fluid rate into each fracture before and after optimization of cluster spacings.
Energies 15 05099 g010
Figure 11. Fracture propagation paths and width distribution (mm) using optimized perforation parameters with different total spacings: (a) 60 m; (b) 70 m.
Energies 15 05099 g011
Figure 12. Comparison of ratio of fluid rate into each fracture using first round optimization of cluster spacings and second round optimization of perforation parameters.
Energies 15 05099 g012
Table 1. Input parameters for numerical simulation.
ParameterMagnitude/UnitParameterMagnitude/Unit
Young’s modulus E40 GPaFracture height h30 m
Poisson’s ratio0.25Fluid viscosity μ1 × 10⁻³ Pa∙s
Perforation diameter dp0.01 mFracturing fluid density ρ1.2 × 10³ kg/m3
Perforation number np60Fluid injection rate QT0.0405 m3/s
Maximum principal stress35 MPaMinimum principal stress31 MPa
Table 2. The optimization results of perforation parameters.
Cluster Number
m
Total Spacing
ΔS/m
Perforation Number
np
Perforation Diameter
dp/10−3 m
Variance
s2
34010, 30, 107, 15, 716.23
5010, 30, 107, 15, 70.25
46010, 30, 27, 107, 11, 15, 78.31
7010, 26, 25, 107, 12, 10, 70.63
Publisher’s Note: MDPI stays neutral with regard to jurisdictional claims in published maps and institutional affiliations.