
Clay Mineral Type and Content Control Properties of Fine-Grained CO2 Caprocks—Laboratory Insights from Strongly Swelling and Non-Swelling Clay–Quartz Mixtures


Department of Geosciences, University of Oslo, P.O. Box 1047, Blindern, 0316 Oslo, Norway
Energies 2022, 15(14), 5149; https://doi.org/10.3390/en15145149
Submission received: 8 June 2022
/
Revised: 12 July 2022
/
Accepted: 13 July 2022
/
Published: 15 July 2022
(This article belongs to the Topic Carbon Capture, Storage and Utilisation Technologies (CCS/CCU))
Abstract
:Understanding and predicting sealing characteristics and containment efficiency as a function of burial depth across sedimentary basins is a prerequisite for safe and secure subsurface storage. Instead of estimators and empirical relationships, this study aimed to delineate data-driven variability domains for non-cemented fine-grained clastic caprocks. Constant rate-of-strain uniaxial compression experiments were performed to measure changes in properties of brine-saturated quartz–clay mixtures. The binary mixtures were prepared by mixing quartz with strongly swelling (smectite) and non-swelling (kaolinite) clays representing end-member clay mineral characteristics. The primary objective was to evaluate the evolution of mudstone properties in the first 2.5 km of burial depth before chemical compaction and cementation. By conducting systematic laboratory tests, variability domains, normal compaction trends, and the boundaries in which characteristics of fine-grained argillaceous caprocks may vary were identified, quantified, and mathematically described. The results showed distinct domains of properties, where kaolinite-rich samples showed higher compressibility, lower total porosity, higher vertical permeability, and higher Vp and Vs. Two discrepancies were discovered in the literature and resolved regarding the compaction of pure kaolinite and the ultimate lowest porosity for quartz–clay mixtures. The present experimental study can provide inputs for numerical simulation and geological modeling of candidate CO2 storage sites.
1. Introduction
Mudstones and shales are of fundamental importance as caprocks for anthropogenic-related storage sites, such as geological CO2 sequestration and waste repositories [1,2,3,4,5,6], and conventional and unconventional petroleum-related activities [7,8,9]. Local geological trends strongly affect the rock properties of the fine-grained argillaceous layers. The geological trends may markedly change even within a sedimentary basin [4,10,11,12]. The rock properties are critically conditioned by burial history (i.e., compaction trend) and depositional environment (i.e., depositional trend). [10,13]. Post-depositional processes modify mudstone properties during burial through mechanical and chemical compactions. The post-depositional trends and lateral variability in sedimentary basins dictate the variations in macroscale rock properties, and therefore should also be incorporated in any basin-wide interpretation. Such knowledge and understanding are crucial, particularly in areas with little or no well log information, to constrain geological and geophysical models and reduce uncertainties in predicting rock and fluid properties. This study focused on sediment burial and compaction trends.
There are two different conceptual models, as presented in Figure 1, which explain the post-depositional changes related to mudstone compaction trends. These two frameworks define the relative impact and the domain of influence for mechanical and chemical compactions as a function of temperature or burial depth.
The first conceptual model, on the left side of Figure 1, states that after the initial mechanical compaction, there is a transition zone during which clay diagenesis, cementation, and chemical compaction begin simultaneously as mechanical compaction is still active [14,15]. At higher temperatures, chemical compaction (cementation) is the only governing mechanism that continues, by implication, independently of the effective stress [14,15]. However, the importance, presence, and span of the transition zone are discussed and highlighted dissimilarly in literature proposing the first model (e.g., Bjørlykke in [16]). For instance, Storvoll and Brevik [17] assert that at the onset of chemical compaction, when quartz cement precipitates, the grain contacts become more stable and the stress distributes on a larger surface area because of the cement. As a result, further increases in effective vertical stress become insufficient to overcome the strength and stability of the grain framework. They conclude that it marks the end of mechanical compaction and the beginning of sole chemical compaction [17].
The right side of Figure 1 presents the second conceptual model. It states that both chemical and mechanical compactions are responsible for the changes in mudstone properties after the onset of clay mineral transformation [18,19,20]. Moreover, there is no implication in the second model about mechanical compaction getting negligible at temperatures above 100 °C. Goulty et al. [19] documented mechanical compaction in response to increased effective stress up to 130 °C.
Figure 1.
Alternative conceptual models for the relative impact of mechanical and chemical compactions on mudstones during burial (modified from [19]).
Figure 1.
Alternative conceptual models for the relative impact of mechanical and chemical compactions on mudstones during burial (modified from [19]).

Another group of scientists, such as Day-Stirrat et al. [21], while using the first conceptual model, have incorporated the second model by stating that there is a mutual impact of mechanical and chemical compactions at deeper depths. Chemical compaction dominates the mutual impact, and the effect of mechanical compaction eventually fades away [21,22]. The temperature and stress (depth) thresholds, however, remain elusive.
In contrast to what is often assumed for mudstones to use a single normal compaction trend (NCT), fine-grained argillaceous rocks show considerable scatter in compaction curves during burial, even in the mechanical compaction domain [3,4,8,12,23,24,25,26]. Until recently, mudstones and shales have often been considered similar lithology types, and little attention has been given to the microscale properties [7].
The mechanical properties and elastic moduli of fine-grained sediments increase as a result of increasing effective vertical stress, which in turn leads to an increase in acoustic velocity during burial [27]. While these moduli increase monotonically during mechanical compaction with the decrease in porosity or increase in effective vertical stress, they show different behaviors when chemical compaction begins [8,12,28]. In particular, the shear modulus reacts distinctly above and below an apparent knee point, representing the initiation of quartz cementation. The knee point is characterized by a sharp increase in shear modulus and change in the trend line.
In the mechanical compaction domain, the Athy-like exponential decline in porosity can generally describe porosity compaction curves [29]. The shape of the compaction curves is controlled by microstructure [26,30,31], which in turn determines the pore space properties and the available intergranular volume for cementation [22,32]. The precipitated cement does not significantly influence porosity or bulk density at the onset of chemical compaction, because the pore volume only changes slightly [33]. It, however, results in a significant increase in velocity-depth trends [3,34], as incipient quartz cementation near grain contacts causes a rapid and considerable framework stiffening [8,35,36]. Therefore, the early quartz cementation causes a substantial increase in shear modulus. It is why shear-wave velocity indicates a much higher sensitivity to weak cementation than compressional wave velocity [17,37]. As burial depth increases and chemical compaction continues, total porosity decreases and acoustic velocity increases. However, it has less impact on the continued stiffening of grain framework and, consequently, elastic moduli [12,17,34].
There are two different approaches to describe the physical properties of rocks, namely, “estimators” and “bounds.” In contrast to bounds that provide a range of potential variations in rock properties, given the limited subsurface data we typically have, the estimators give a specific value for the rock property, e.g., when Archie’s empirical relationship (often named law) is being used to predict saturation or Gassmann’s equations are being applied to see how effective moduli vary as a function of pore fluid variations. However, rock microstructure and microscale properties are controlling factors that determine where the values should locate within the boundaries and why estimators cannot provide a universal solution and may fail or mislead us [8,38]. Depending on the microstructure and composition of the constituents in terms of mineralogy and grain size, a boundary or domain should be used to describe mudstone properties instead of a single line or equation.
Mechanical compaction experiments in the laboratory provide the opportunity to study the evolution of rock properties during burial. In this study, the evolution of petrophysical, rock physics, and geomechanical properties of mixtures of quartz–kaolinite and quartz–smectite during laboratory compaction is presented. The experiments can simulate the compaction of sediments in a normally compacted basin before the onset of chemical compaction and cementation. The concurrent study of non-swelling (kaolinite) and strongly swelling (smectite) end-member clay minerals provides insights into the boundaries in which properties of fine-grained sediments and mudstone caprocks may change as a result of burial and increase in effective stress. The presented laboratory data set of various rock properties and the identified domains of variability may provide numeric inputs for evaluating containment efficiency for CO2 storage candidates.
2. Materials and Methods
2.1. Sample Preparation and Characterization
A total of 8 brine-saturated specimens of quartz–clay mixtures were tested (Table 1). Each specimen was tested twice to ensure repeatability. The synthetic samples were prepared by mixing quartz grains with non-swelling (kaolinite) and strongly swelling (smectite) clay minerals. The quartz grains are composed of silt-sized (4–63 μm) and very fine sand-sized (63–125 μm) aggregates. The quartz–clay samples were obtained by mixing quartz with different weight percentages of kaolinite or smectite clay groups. The quartz–clay weight percentages were 85:15, 50:50, 15:85, and 0:100. Therefore, four quartz–clay mixtures were tested for each kaolinite (non-swelling) and smectite (strongly swelling) clay mineral. An aqueous solution of 0.6 M (35 g/L) sodium chloride (NaCl, EMSURE) in deionized water (MilliQ water) was used to prepare the brine-saturated quartz–clay mixtures.
The mineralogical composition, including whole-rock (bulk) and clay minerals, was identified and quantified using the X-ray diffraction (XRD) technique. The grain size was provided by a laser particle-size analyzer (Beckman Coulter LS13 320). The detailed procedures of sample characterization were given in [4,12].
2.2. Laboratory Setup and Experimental Procedure
Mechanical compaction experiments using a constant rate of strain protocol were carried out to measure the evolution of petrophysical and rock physics properties of the 8 brine-saturated quartz–clay mixtures. The brine-saturated samples were tested using a high-stress oedometer equipped with two piezoelectric transducers with a resonant frequency of 500 kHz to generate and receive ultrasonic signals (Figure 2A). Constant rate of strain (CRS) uniaxial compression tests were performed to measure the compressibility of the brine-saturated quartz–clay mixtures [39,40]. A strain rate of 0.67% per hour was selected to simulate a close to hydrostatic pressure condition [40,41], corresponding to an initial deformation of 0.2 mm per hour for an initial sample height of 30 mm. In these experiments, effective vertical stress was increased to 25 MPa.
The pulse transmission technique was used to measure compressional (Vp) and shear wave (Vs) velocities approximately every 5 MPa. The wave velocities (Vp and Vs) were then used together with bulk density (ρ) to estimate the dynamic elastic moduli. The most significant sources of uncertainty/error in velocity measurements were arrival time determination (from the raw waveforms) and continuous height measurement. The estimated relative error in Vp and Vs was approximately 5% to 2% (Vs carrying larger uncertainty), which declined rapidly as effective vertical stress was increased. Parameters measured during CRS experiments (except ultrasonic velocity) were associated with less than 2% uncertainty. A detailed derivation of physical properties and uncertainty/error quantification during compaction experiments is given in [12,26]. All experiments were performed with drained loading conditions at room temperature of approximately 19–21 °C. A detailed description of the experimental setup for compaction experiments is given in [12,26].
2.3. Vertical Permeability Measurement
The constant rate of strain (CRS) compaction technique offers a direct method for computing vertical hydraulic conductivity continuously during the test. Figure 2 demonstrates the applied stress and drainage condition for the performed uniaxial CRS compaction experiment. While the non-moving pedestal was kept undrained, the moving piston allowed the pore fluid to drain to atmospheric pressure (Figure 2). The procedures given in [39,40] were followed to calculate the vertical permeability of the samples. The CRS-derived properties (e.g., total porosity, bulk density, vertical permeability) values were computed continuously at 5 min time intervals during the compaction experiments. Each specimen was also subjected to several single-phase flow direct permeability measurements to ensure the reliability of the CRS-driven permeability curves. Steady-state flow-through experiments were performed to measure absolute permeability at a constant pressure gradient condition, and vertical permeability was calculated using Darcy’s law [26,42,43]. The direct vertical permeability measurements were conducted under controlled axial stress and pore pressure.
3. Results and Discussion
The following sections present and discuss the results of laboratory experiments to evaluate the evolution of mudstone rock properties in the first 2.5 km of burial depth (until approximately 25 MPa effective stress). Instead of individual compaction curves, the focus is on boundaries and domains in which properties of non-swelling (kaolinite) and strongly swelling (smectite) clay-rich caprock layers change.
3.1. Changes in Rock Properties as a Function of Effective Stress
Figure 3 shows a distinct compaction behavior for porosity, permeability, Vp, and Vs of four quartz–kaolinite and four quartz–smectite mixtures with 85:15, 50:50, 15:85, and 0:100 weight percentage ratios (Table 1). The presented boundaries in Figure 3A–D can be accurately described by the exponential equation y = exp (a + b∗ln(x)). Figure 3A shows that smectite-rich mixtures were less prone to compaction (lower degree of compressibility) than the kaolinite-rich mixtures, with a final total porosity of 28–42% and 19–30%, respectively. A wide range of total porosity values (19–42%, with a span of 23%) for the fine-grained sediments was identified at the end of the mechanical compaction domain (Figure 3A). The vertical permeability results showed approximately two orders of magnitude domain of variability (Figure 3B). The kaolinite-rich samples showed higher permeability (transmissivity) in a range of ≈0.001–0.0002 mD compared to smectite-rich samples (≈0.0001–0.00001 mD). Kaolinite-rich fine-grained mixtures consistently showed higher Vp and Vs values than smectite-rich specimens (Figure 3C,D). While Vp graphs show considerable overlap, the Vs values were more or less spanning over two distinct regions with a slight overlap in values.
Although the tested clay–quartz mixtures had a domain of variability at any given effective stress, the loading curves of the brine-saturated samples were similar in shape (Figure 3A–D). As a result, the mathematical equation describing or estimating the corresponding normal compaction trends (NCTs) can be similar (refer to Appendix A for more details).
In Figure 3A, three stages of porosity loss can be identified in the NCTs of fine-grained sediments at given intervals of effective vertical stress, namely (I) 0–1 MPa, (II) 1–5 MPa, and (III) 5–25 MPa effective vertical stress. Around 40% of initial porosity loss occurs during stage I due to the slurry’s water loss before grains come in contact at very low effective stresses (up to 1 MPa). Stage II (1–5 MPa) defines the shape and susceptibility to loss of the pore volume. Relatively slow and steady compaction occurred between 5 and 25 MPa in stage III. The compaction in this interval is mainly associated with rearrangement, reorientation, and closer packing of the grains. Therefore, similar to Velde’s results [30], an exponential and a linear substage can be considered for the mechanically dominated compaction. Careful observation of compaction curves (particularly Figure 3A) shows that porosity loss before 5 MPa was different for each mixture. The compressibility in this interval defines the form of compaction baseline for each tested sample. This specific compressibility could be related to the development of depositional fabric and the packing of the grains in this interval.
The ultrasonic wave velocity (Vp and Vs) depends considerably on effective vertical stress (Figure 3C,D). Rapid development in velocity, especially in Vp, was observable in early compaction stages (I–II). As mentioned above, the rapid velocity increase corresponds to the significant porosity loss at low-stress levels. The domain of variability in ultrasonic velocity (both Vp and Vs) increased with the increase in effective vertical stress (Figure 3C,D), and hence during burial in the mechanical compaction domain (Figure 1). The increment of compressional wave velocity in stage III was nearly the same for all tested samples.
3.2. Changes in Rock Properties as a Function of Total Porosity
In Figure 4A, the semi-logarithmic (logarithmic ordinate versus linear abscissa) kv-φ relationship indicates that the permeability decline is faster than the porosity loss and the decrease in permeability more rapid at higher porosities (at low-stress levels when compaction is still in stages I–II). In other words, Figure 4A shows that effective stress affects permeability more than the total porosity. Approximately four to five orders of magnitude dispersion between the two boundaries (lowest and highest boundaries of permeability–porosity relationship) indicate the potential variability of fluid flow properties in fine-grained rocks within the mechanical compaction domain. Exponential equations of type ln(y) = b∗x + a can describe the presented boundaries (Appendix A).
In analyzing the fluid flow measurements, a negative correlation between the vertical permeability and the content of clay fractions and a positive correlation with the silt-sized particles were identified, consistent with the published literature, e.g., [31,44,45]. Although several studies (for instance, Yang and Aplin [46]) proposed that samples with similar content of clay particles hold the same permeability, the results of the present study suggest that this is not a universally accurate observation (Figure 3 and Figure 4). It was shown that binary quartz–clay mixtures with a similar percentage of clay fractions but different types (swelling and non-swelling) had markedly different permeability. It is correct that quartz–clay samples show an overall decrease in permeability with the increase of clay content. However, the relationship is not one-to-one, and the severity of the porosity–permeability loss is not only a function of clay volume content. In other words, a higher clay content does not necessarily mean a lower permeability. Although it might be counterintuitive, this observation where mixtures with lower clay content show lower permeability suggests that the best-possible packing of different-sized classes produces the most low-permeability porous medium, not the clay fraction alone. Among kaolinite-rich specimens, quartz–kaolinite (50:50 wt %) and among smectite-rich specimens, quartz–smectite (15:85 wt %) showed the lowest permeability.
The synthetic quartz–clay mixtures ranged between 10−2 and 10−5 mD (Figure 4). At effective vertical stresses equivalent to 2 km burial depth, the highest and lowest permeabilities among binary mixtures were recorded for quartz–kaolinite 85:15 and quartz–smectite 15:85 (wt %), respectively. The strongly swelling clays (smectite) markedly influenced fluid flow properties of fine-grained sediments, which can be associated with the grain size of these clays [47] and the subsequent influence of pore size and pore throat on the permeability. Moreover, the large specific surface area of the smectite clay group (inversely proportional to grain size) can prevent pore fluid from participating in flow and lead to reduced permeability.
At the start of the uniaxial compression experiments (the equivalent of deposition time in the natural setting in sedimentary basins), the properties of brine-saturated fine-grained quartz–clay mixtures were expected to lie on or near the Reuss bound [8,38,48] as long as they were unconsolidated. The increase in effective vertical stress and decrease in total porosity cause more steeply increasing permeability and ultrasonic velocity trajectories. In Figure 4, permeability, Vp and Vs of non-swelling and strongly swelling clay–quartz samples showed somewhat separate and distinctive domains, and therefore could be used to construct respective rock physics templates.
Vp and Vs show a general trend of increasing velocity with decreasing total porosity, highlighting the significant porosity control on Vp and Vs of mudstone (and shale) sediments during mechanical compaction. The cross-plots of Vp-φ and Vs-φ (Figure 4B,C) suggest that any velocity–porosity empirical relationships as a single equation estimator cannot be used reliably and broadly, because approximately 800 m/s in Vp and 400 m/s in Vs were observable at a given total porosity value. The broad domain of variability in Vp and Vs at the same total porosity highlights the importance of such factors as compositional content (mineralogy and grain size), microfabric, and packing. Therefore, it is essential to consider both velocity and porosity measurements for characterizing mechanically compacted formations on well log data. In addition, it is crucial to consider the coupled effect of clay type and clay content on ultrasonic velocity and porosity (Figure 3 and Figure 4).
3.3. Changes in Elastic Moduli and Rock Physics Properties
The cross-plots of elastic moduli in Figure 5 demonstrate that the mechanical rock properties of clay-rich sediments strongly depended on the type of clays besides their content, particularly end-member clay minerals of a non-swelling (kaolinite) and strongly swelling (smectite) nature. A rapid increase in bulk modulus was observable in the early compaction stages (I–II) (Figure 5A). The rapid increase was attributed to the significant porosity loss at low-stress levels, as the bulk modulus indicates how incompressible the samples are. The compressibility rate decreased after 5–10 MPa effective vertical stress, and the bulk modulus continued to increase almost linearly afterward.
The shear modulus (rigidity) indicated a steady and gentle increase during mechanical compaction. Poisson’s ratio showed a considerable drop throughout the experiments. The decline was notable in the first 10 MPa effective vertical stress (Figure 5C). When specimens resembled incredibly soft water-saturated sediments or suspended particles in a fluid, the values of Poisson’s ratio were around 0.45 and approaching 0.5. Poisson’s ratio showed an instant fall as effective vertical stress increased. It decreased with a gentler slope toward the end of the tests. The variability in the domain of mechanical properties (i.e., elastic moduli) of the tested samples was relatively small at early stress levels, but it increased with effective vertical stress (Figure 5A–C).
The quartz–kaolinite mixtures had higher bulk and shear moduli and lower Poisson’s ratios than the quartz–smectite samples. For the synthetic quartz–clay mixtures (Figure 4), the end-point values at 25 MPa effective vertical stress varied approximately in the following ranges: bulk modulus 6.2–11.2 GPa, shear modulus 0.45–2.1 GPa, and Poisson’s ratio 0.41–0.46. As end members of clay minerals with respect to grain size and surface area, the kaolinite-rich and smectite-rich domains of variability demonstrated maximum and minimum compressibility (Figure 5). The smectite-rich samples showed notably low rigidity (shear modulus) and high Poisson’s ratios.
Regarding the smectite clay fractions, it should be noted that these strongly swelling fractions constituted a large group of 2:1 (tetrahedral-octahedral-tetrahedral) clay minerals, characterized by low layer charge (0.2–0.6 per half unit cell) and hydrated exchangeable cations [47,49]. These characteristics determine the weakness of linkage between the different layers of a given particle [47,49,50]. Therefore, chemical and structural heterogeneity are typical for species in the smectite group. Both composition and structure are subject to continual variations in time and sedimentary environment [51,52]. The shape of smectites also varies according to the conditions of formation. Species in this group can be found in flakes, curls, and laths of different sizes [47,52]. Also, smectites are known to be of polydispersive size distribution, which also changes as a result of physical processes and chemical and structural transformations [49,50,52]. Therefore, it is expected that the mechanical properties of species in the smectite group differ from each other.
Rock physics subplots in Figure 6 show properties of mudstones rich in varying percentages of end-member clay minerals spread over a wide range. Although overlap zones are evident in each cross-plot, one can identify that smectite-rich and kaolinite-rich fine-grained sediments have distinctive characteristics. In Figure 6A, published Vp-Vs relationships proposed by Castagna et al. [53], Greenberg and Castagna [54], and Nooraiepour et al. [12] are presented along with Vp/Vs ratio isocontours. The latter equation was derived by extensive laboratory compaction experiments on brine-saturated reconstituted mudstone and shale aggregates retrieved from drill cuttings of several caprock layers [12]. It can be expressed as Vp = 1.30∗Vs + 1172, where Vp and Vs are in [m/s] [4].
Binary mixtures of quartz–smectite (compared to kaolinite-rich mudstones) show lower Vp and Vs (Figure 6A), higher Vp/Vs ratio and lower Ip (Figure 6B), lower Young’s modulus and higher Poisson’s ratio (Figure 6C), and finally lower μρ and λρ (Figure 6D). The following intervals of properties were distinctive of brine-saturated kaolinite-rich samples in the mechanical compaction domain: Vp > 2200 m/s, Vs > 750 m/s, Vp/Vs ratio < 3, Ip > 4750, Poisson’s ratio > 0.4375, Young’s modulus > 3.25, μρ > 2.5, and λρ > 17.5 (Figure 6). Similarly, a specific domain can be identified for smectite-rich samples, owing to their characteristic high total porosity and low Vs.
3.4. Inconsistencies in Published NCTs for Pure Kaolinite and Binary Quartz–Clay Mixtures
Two discrepancies were found in the literature in assessing the compaction behavior of brine-saturated kaolinite-rich mixtures.
As Figure 7 demonstrates, the majority of published kaolinite compaction curves document 17–25% total porosity at 50 MPa effective vertical stress [23,26,55,56,57,58,59,60,61,62,63]. The coarser kaolinite grains were more susceptible to compaction (more compressible) than the finer kaolinites. The composite mixture of size classes (as a whole) showed the most porosity reduction [57]. In contrast, a minority group of literature has reported an entirely different ultimate compaction end point, with 11% total porosity at 50 MPa effective vertical stress for brine-saturated kaolinite (Figure 7). In the present study, two samples of pure kaolinite powder were purchased and tested (for this purpose, compaction experiments were continued to 50 MPa effective stress) to evaluate compaction behavior and end-point total porosity of kaolinites (Table 1). The two samples were produced by (I) IMERYS, UK (SPES white sort), and (II) Potterycraft Ltd., UK. The grain-size analyses of purchased kaolinite samples showed mixed class sizes, and therefore the highest degree of compaction was expected from our experiments. Both kaolinite samples followed similar NCTs and showed approximately 20% final total porosity at 50 MPa effective vertical stress (Figure 7). Therefore, our laboratory results only confirm the former group of scientists (the majority) and disagree with the φ = 11% value for pure kaolinite NCT.
The second inconsistency was found in recognizing maximum compaction in argillaceous deposits. A (majority) group of experimental studies showed that the highest compaction level and maximum porosity loss could be identified for brine-saturated quartz–clay mixtures with 20–40% kaolinite content (and 60–80% quartz) [26,55,59,64,65,66,67,68,69,70,71]. These experimental works have reported a total porosity of around 12% at 50 MPa effective vertical stress for such mixtures. On the other hand, a (minority) group of laboratory efforts documented the lowest attainable total porosity at 50 MPa for pure kaolinite samples (φ = 11%). Unexpectedly, the latter group reported that binary mixtures of kaolinite–quartz are less prone to compaction than pure kaolinite [72,73], which is theoretically peculiar [38,64,67]. Their experiments showed the most efficient packing (lowest ultimate total porosity for a binary mixture) for the 50:50 kaolinite–quartz with 16% total porosity at 50 MPa effective vertical stress. Our compaction experiments contradict the latter group’s claim that the highest compaction is associated with pure kaolinite and confirms that only the best packing of a kaolinite–quartz mixture may show the lowest attainable total porosity or highest compressibility. The reported porosity value for the 50:50 kaolinite–quartz mixture by the second group holds valid based on our experiments.
A closer look into the literature supporting second cases (minority) in the two aforementioned inconsistencies led to an unexecuted observation. A well-cited group in 2007 reported 11% total porosity at 50 MPa for brine-saturated pure kaolinite, in 2008 19–23%, and in 2009 switched back to 11% [72,74,75]. Such discrepancies from a single group without clarification or comparison with the literature along with reporting pure kaolinite’s NCT as maximum compaction in binary mixtures bring us to the conclusion that the 11% result for kaolinite’s NCT may not be entirely precise or reliable.
4. Implications for Top Seal Integrity
Fluid flow through the rock matrix, preexisting and induced fracture networks, fault systems, and the geomechanical and geochemical factors associated with CO2 injection define a caprock layer’s sealing capacity and integrity. Fine-grained argillaceous rocks (i.e., mudstones and shales) are the commonly identified caprocks for CO2 storage reservoirs [76,77]. They also have a profound significance for studying geological processes, geoengineering applications, and conventional and unconventional petroleum-related activities.
Unlike chemical compaction and cementation, which are more challenging to replicate in a laboratory, experimental mechanical compaction of brine-saturated samples enables researchers to study the evolution of mudstone properties as a function of effective vertical stress. The present study investigated variations in physical, hydraulic, and ultrasonic properties of brine-saturated binary clay–quartz mixtures as a function of effective vertical stress. The experiments simulated the mechanical compaction of sediments in subsiding sedimentary basins with no superimposed tectonic forces before chemical compaction and cementation. As shown in our previous works [4,11,25], the laboratory results are comparable with in situ well log measurements in the first 2.5 km burial depth to further investigate rock physics, geomechanics, and compaction-exhumation history of the caprock sequences.
Uniaxial compaction experiments were performed to evaluate the properties of the semi-compacted fine-grained sediments to simulate domains of variability for CO2 seal sequence that were still in the mechanical compaction domain and not affected by cementation. It can, however, be expected that the laboratory specimens will show reduced anisotropy compared to the natural setting because the aggregates do not settle into layers in the same way as natural deposits [78,79]. The structures of marine sequences might show a significant degree of anisotropy, which is developed during deposition, compaction, and subsequent straining during burial [80,81,82]. In addition, it is probable that the clay fractions do not settle with a matching orientation in the laboratory as they become deposited and preferentially oriented in nature [83]. This may negatively affect the study of fluid flow and transport properties in synthetic samples [83]. Development of high overpressures, undrained loading, calibration and measurement precision, and violation of other guidelines set by ASTM [40] may cause further uncertainties in the results of a CRS test.
Rigid grains like quartz are expected to withstand the applied stresses and preserve total porosity, while ductile particles like clays bend and block the interparticle pore volumes. Ductile minerals, such as clays, tend to wrap around the grains at higher stresses, reduce the periphery porosity, and severely impact the permeability [73,84]. Alteration in pore volume during burial may change the pore space connectivity, porous medium morphology, and tortuosity, and therefore changes in fluid flow and solute transport. The ductile clay fractions in the fine-grained caprocks may also cover reactive solid surfaces, which leads to limited diffusion in the porous layers around the grains and hence limited (geo)chemical reactions [2]. This armoring phenomenon caused by clay minerals reshapes the available surface area for precipitation and dissolution (geo)chemical reactions during coupled thermo-hydro-mechanical-chemical (THMC) processes, leading to changes in the system’s reactivity and reaction progress and rates [2,85,86,87].
It is generally assumed that the higher the content of clay minerals, the lower the permeability. However, laboratory permeability measurements of the quartz–clay mixtures in this study suggest that the clay type, grain-mixing ratio, packing, and potentially preferred orientation of grains must be considered. It was shown that synthetic mixtures of quartz–kaolinite 50:50 and quartz–smectite 15:85 (wt%) gave the end member low permeability among the kaolinite- and smectite-rich mixtures and thus corresponding mudstones rich in non-swelling and strongly swelling clays.
The presented results indicate that grain-size distribution and mineralogical composition are the controlling factors in the porosity–permeability relationships of mudstones and fine-grained clay-rich (argillaceous) subsurface layers. Porosity–permeability relationships are widely proposed to describe the single-phase permeability of mudstones and shales, because porosity is a routine and usually available measurement (core analysis and in situ well log measurements). The empirical relationships are typically developed from laboratory measurements (e.g., Yang and Aplin [46]), theoretical models, such as the Kozeny–Carman equation (e.g., Chapuis and Aubertin [88]) and the Hagen–Poiseuille equation (e.g., Civan et al. [89]), or binary mixing models (e.g., Revil and Cathles [90]). These approaches often make one or several macroscale assumptions for correlating the total porosity with matrix permeability via applying a tuning factor related to mineralogy, clay fractions, or clay surface area. The present experimental results indicate that seeking to approximate the vertical permeability of fine-grained sediments and mudstones with a single macroscale equation may not provide a universal solution, because multiple parameters with not a one-to-one correspondence affect flow characteristics. Incorporating microstructure characteristics into the permeability models and considering boundaries (domain of potential variability) instead of single estimators are two necessary directions for simulating the top seal integrity of CO2 storage candidates. Microstructure characteristics are essential for containment assessments because they control the macroscale fluid flow and transport properties in fine-grained argillaceous caprocks.
Funding
This publication has been produced with support from the project “Solid and salt precipitation kinetics during CO2 injection into reservoir” (SaltPreCO2), funded by the EEA and Norway Grants, Norwegian Financial Mechanism 2014–2021, (UMO-2019/34/H/ST10/00564) through the GRIEG Program, operated by the Polish National Science Centre (NCN) in cooperation with the Research Council of Norway (NFR).
Data Availability Statement
The data and materials supporting this study’s findings are available from the corresponding author upon reasonable request.
Acknowledgments
M.N. acknowledges the Faculty of Mathematics and Natural Sciences at the University of Oslo (UiO) for granting the Kristine Bonnevie scholarship. The author expresses his gratitude towards Adamson’s Foundation in support of geological research, Reusch’s grant to promote geography and geology, and Orlaug L. Merkesdal’s grant (UiO’s Foundation for Funds and Scholarships, UNIFOR).
Conflicts of Interest
The authors declare no competing financial or non-financial interest.
Appendix A
As emphasized in the introduction (Section 1), the present study aimed to provide data-driven boundaries and delineate domains of variability for various rock properties of fine-grained clay-rich clastic caprocks. Additionally, we discussed how and why it is essential to move away from empirical approaches and single line/value estimators. However, to make the NCT domains and presented boundaries more accessible for numeric modeling purposes or for constraining data analyses/interpretations, exponential-type mathematical equations together with coefficients describing upper and lower limits are given in Table A1.

Table A1.
Mathematical equations and corresponding coefficients describing variability domains for various properties of quartz–clay binary mixtures in the mechanical compaction domain.
Table A1.
Mathematical equations and corresponding coefficients describing variability domains for various properties of quartz–clay binary mixtures in the mechanical compaction domain.
| Figure | Subplot | Equation | Kaolinite-Rich Binary Mixtures | Smectite-Rich Binary Mixtures | ||||||
|---|---|---|---|---|---|---|---|---|---|---|
| Lower Boundary Coefficients | Upper Boundary Coefficients | Lower Boundary Coefficients | Upper Boundary Coefficients | |||||||
| a | b | a | b | a | b | a | b | |||
| Figure 3 | A | y = exp (a + b∗ln(x)) | 3.8660022 | −0.12582485 | 3.604363 | −0.18990982 | 4.0482839 | −0.082468556 | 3.8048668 | −0.118814 |
| B | −1.6264308 | −1.4806903 | −5.0742795 | −1.0291726 | −3.6129421 | −1.5440703 | −6.5994262 | −1.4030827 | ||
| C | 7.3226798 | 0.088211752 | 7.3677866 | 0.13741761 | 7.3050906 | 0.082131234 | 7.3514765 | 0.10892861 | ||
| D | 5.7056652 | 0.26926114 | 5.9981767 | 0.27632831 | 5.7428196 | 0.13130909 | 5.8591546 | 0.24165027 | ||
| Figure 4 | A | ln(y) = b∗x + a | −10.028926 | 0.098084803 | −14.185274 | 0.27424423 | −19.311332 | 0.22147957 | −17.236867 | 0.24334317 |
| B | 8.3119656 | −0.026209519 | 8.2279476 | −0.018581189 | 8.2808769 | −0.020270873 | 8.271686 | −0.016788725 | ||
| C | 7.8537623 | −0.05101014 | 7.7097782 | −0.038643926 | 7.7724375 | −0.041374261 | 7.7070976 | −0.034836206 | ||
| Figure 5 | A | y = exp (a + b∗ln(x)) | 1.4015981 | 0.1781668 | 1.5485299 | 0.27294465 | 1.2796649 | 0.18507085 | 1.4564052 | 0.24001766 |
| B | −2.0943057 | 0.70562619 | −1.1804517 | 0.62291463 | −1.8316319 | 0.3186028 | −1.6752392 | 0.56303121 | ||
| C | −0.76191432 | −0.037718901 | −0.738609 | −0.020471854 | −0.75029521 | −0.01735871 | −0.73956822 | −0.006554059 | ||
| D | ln(y) = b∗x + a | −0.041068431 | 3.3820241 | −0.051477194 | 3.4099259 | 3.4275793 | −0.036983438 | 3.3728576 | −0.041360769 | |
| E | 2.3407736 | −0.081132019 | 2.8757394 | −0.10934554 | 2.6979158 | −0.079317675 | 2.968095 | −0.096656714 | ||
| F | y = exp (a + b∗ln(x)) | −1.500971 | 0.19471909 | −1.1883243 | 0.11616354 | −1.3252217 | 0.1465476 | −1.5923159 | 0.22429785 | |
References
- Song, J.; Zhang, D. Comprehensive review of caprock-sealing mechanisms for geologic carbon sequestration. Environ. Sci. Technol. 2013, 47, 9–22. [Google Scholar] [CrossRef] [PubMed]
- Fazeli, H.; Nooraiepour, M.; Hellevang, H. Microfluidic Study of Fracture Dissolution in Carbonate-Rich Caprocks Subjected to CO2-Charged Brine. Ind. Eng. Chem. Res. 2020, 59, 450–457. [Google Scholar] [CrossRef]
- Nooraiepour, M. Rock Properties and Sealing Efficiency in Fne-Grained Siliciclastic Caprocks—Implications for CCS and Petroleum Industry; University of Oslo: Oslo, Norway, 2018. [Google Scholar]
- Nooraiepour, M.; Haile, B.G.; Hellevang, H. Compaction and mechanical strength of Middle Miocene mudstones in the Norwegian North Sea–The major seal for the Skade CO2 storage reservoir. Int. J. Greenh. Gas Control 2017, 67, 49–59. [Google Scholar] [CrossRef]
- Nooraiepour, M.; Fazeli, H.; Miri, R.; Hellevang, H. Effect of CO2 Phase States and Flow Rate on Salt Precipitation in Shale Caprocks-A Microfluidic Study. Environ. Sci. Technol. 2018, 52, 6050–6060. [Google Scholar] [CrossRef]
- Falcon-Suarez, I.H.; Lichtschlag, A.; Marin-Moreno, H.; Papageorgiou, G.; Sahoo, S.K.; Roche, B.; Callow, B.; Gehrmann, R.A.S.; Chapman, M.; North, L. Core-scale geophysical and hydromechanical analysis of seabed sediments affected by CO2 venting. Int. J. Greenh. Gas Control 2021, 108, 103332. [Google Scholar] [CrossRef]
- Avseth, P.; Draege, A.; van Wijingaarden, A.J.; Johansen, T.A.; Jørstad, A. Shale rock physics and implications for AVO analysis: A North Sea demonstration. Lead. Edge (Tulsa, OK) 2008, 27, 788–797. [Google Scholar] [CrossRef]
- Avseth, P.; Mukerji, T.; Mavko, G.; Dvorkin, J. Rock-physics diagnostics of depositional texture, diagenetic alterations, and reservoir heterogeneity in high-porosity siliciclastic sediments and rocks-A review of selected models and suggested work flows. Geophysics 2010, 75, X75A31–X75A47. [Google Scholar] [CrossRef]
- Aplin, A.C.; Macquaker, J.H.S. Mudstone diversity: Origin and implications for source, seal, and reservoir properties in petroleum systems. Am. Assoc. Pet. Geol. Bull. 2011, 95, 2031–2059. [Google Scholar] [CrossRef]
- Avseth, P.; Flesche, H.; Van Wijngaarden, A.J. AVO classification of lithology and pore fluids constrained by rock physics depth trends. Lead. Edge (Tulsa, OK) 2003, 22, 1004–1011. [Google Scholar] [CrossRef]
- Loseth, H.; Wensaas, L.; Gading, M.; Duffaut, K.; Springer, M. Can hydrocarbon source rocks be identified on seismic data? Geology 2011, 39, 1167–1170. [Google Scholar] [CrossRef] [Green Version]
- Nooraiepour, M.; Mondol, N.H.; Hellevang, H.; Bjørlykke, K. Experimental mechanical compaction of reconstituted shale and mudstone aggregates: Investigation of petrophysical and acoustic properties of SW Barents Sea cap rock sequences. Mar. Pet. Geol. 2017, 80, 265–292. [Google Scholar] [CrossRef] [Green Version]
- Haile, B.G.; Klausen, T.G.; Czarniecka, U.; Xi, K.; Jahren, J.; Hellevang, H. How are diagenesis and reservoir quality linked to depositional facies? A deltaic succession, Edgeøya, Svalbard. Mar. Pet. Geol. 2018, 92, 519–546. [Google Scholar] [CrossRef]
- Bjørlykke, K.; Høeg, K. Effects of burial diagenesis on stresses, compaction and fluid flow in sedimentary basins. Mar. Pet. Geol. 1997, 14, 267–276. [Google Scholar] [CrossRef]
- Bjørlykke, K. Clay mineral diagenesis in sedimentary basins-A key to the prediction of rock properties. Examples from the North Sea Basin. Clay Miner. 1998, 33, 14–34. [Google Scholar] [CrossRef]
- Bjørlykke, K. Compaction of sedimentary rocks: Shales, sandstones and carbonates. In Petroleum Geoscience: From Sedimentary Environments to Rock Physics, 2nd ed.; Springer: Berlin/Heidelberg, Germany, 2015; pp. 351–360. ISBN 9783642341328. [Google Scholar]
- Storvoll, V.; Brevik, I. Identifying time, temperature, and mineralogical effects on chemical compaction in shales by rock physics relations. Lead. Edge 2008, 27, 750–756. [Google Scholar] [CrossRef]
- Dutta, N.C. Deepwater geohazard prediction using prestack inversion of large offset P-wave data and rock model. Lead. Edge (Tulsa, OK) 2002, 21, 193–198. [Google Scholar] [CrossRef]
- Goulty, N.R.; Sargent, C.; Andras, P.; Aplin, A.C. Compaction of diagenetically altered mudstones—Part 1: Mechanical and chemical contributions. Mar. Pet. Geol. 2016, 77, 703–713. [Google Scholar] [CrossRef] [Green Version]
- Lahann, R. Impact of Smectite Diagenesis on Compaction Modeling and Compaction Equilibrium. Press. Regimes Sediment. Basins Their Predict. 2001, 76, 61–72. [Google Scholar]
- Day-Stirrat, R.J.J.; McDonnell, A.; Wood, L.J.J. Diagenetic and Seismic concerns associated with interpretation of deeply buried “mobile shales”. AAPG Mem. 2010, 93, 5–27. [Google Scholar] [CrossRef]
- Milliken, K.L.; Day-Stirrat, R.J. Cementation in mudrocksz: Brief review with examples from cratonic basin mudrocks. AAPG Mem. 2013, 133–150. [Google Scholar] [CrossRef]
- Chilingarian, G.V.; Rieke Iii, H.H.; Donaldson, E.C. Chapter 2 Compaction of argillaceous sediments. Dev. Pet. Sci. 1995, 41, 47–164. [Google Scholar]
- Giles, M.R.R.; Indrelid, S.L.; James, D.M.D. Compaction—The great unknown in basin modelling. Geol. Soc. Lond. Spec. Publ. 1998, 141, 15–43. [Google Scholar] [CrossRef]
- Bachrach, R. Mechanical compaction in heterogeneous clastic formations from plastic-poroelastic deformation principles: Theory and applications. Geophys. Prospect. 2016. [Google Scholar] [CrossRef]
- Nooraiepour, M.; Mondol, N.H.; Hellevang, H. Permeability and physical properties of semi-compacted fine-grained sediments—A laboratory study to constrain mudstone compaction trends. Mar. Pet. Geol. 2019, 102, 590–603. [Google Scholar] [CrossRef]
- Ma, X.; Zoback, M.D. Laboratory experiments simulating poroelastic stress changes associated with depletion and injection in low-porosity sedimentary rocks. J. Geophys. Res. Solid Earth 2017, 122, 2478–2503. [Google Scholar] [CrossRef]
- Vernik, L.; Kachanov, M. Modeling elastic properties of siliciclastic rocks. Geophysics 2010, 75, E171–E182. [Google Scholar] [CrossRef]
- Athy, L.F. Density, Porosity and Compaction of Sedimentary Rocks. Am. Assoc. Pet. Geol. Bull. 1930, 14, 1–24. [Google Scholar]
- Velde, B. Compaction trends of clay-rich deep sea sediments. Mar. Geol. 1996, 133, 193–201. [Google Scholar] [CrossRef]
- Schneider, J.; Flemings, P.B.B.; Day-Stirrat, R.J.J.; Germaine, J.T.T. Insights into pore-scale controls on mudstone permeability through resedimentation experiments. Geology 2011, 39, 1011–1014. [Google Scholar] [CrossRef]
- Peltonen, C.; Marcussen, Ø.; Bjørlykke, K.; Jahren, J. Clay mineral diagenesis and quartz cementation in mudstones: The effects of smectite to illite reaction on rock properties. Mar. Pet. Geol. 2009, 26, 887–898. [Google Scholar] [CrossRef]
- Marcussen, Ø.; Faleide, J.I.; Jahren, J.; Bjørlykke, K. Mudstone compaction curves in basin modelling: A study of Mesozoic and Cenozoic Sediments in the northern North Sea. Basin Res. 2010, 22, 324–340. [Google Scholar] [CrossRef]
- Vernik, L.; Nur, A. Petrophysical classification of siliciclastics for lithology and porosity prediction from seismic velocities. Am. Assoc. Pet. Geol. Bull. 1992, 76, 1295–1309. [Google Scholar]
- Winkler, K.W. Contact stiffness in granular porous materials: Comparison between theory and experiment. Geophys. Res. Lett. 1983, 10, 1073–1076. [Google Scholar] [CrossRef]
- Bernabé, Y.; Fryer, D.T.T.; Hayes, J.A.A. The effect of cement on the strength of granular rocks. Geophys. Res. Lett. 1992, 19, 1511–1514. [Google Scholar] [CrossRef]
- Han, D.-H.H.; Batzle, M. Velocities of deepwater reservoir sands. Lead. Edge (Tulsa, OK) 2006, 25, 460–466. [Google Scholar] [CrossRef]
- Mavko, G.; Mukerji, T.; Dvorkin, J. The Rock Physics Handbook: Tools for Seismic Analysis of Porous Media, 2nd ed.; Cambridge University Press: Cambridge, UK, 2009. [Google Scholar]
- Wissa, A.E.; Christian, J.T.; Davis, E.H.; Heiberg, S. Consolidation at constant rate of strain. ASCE J. Soil Mech. Found. Div. 1971, 97, 1393–1413. [Google Scholar] [CrossRef]
- ASTM Standard D4186-06. Test Method for One-Dimensional Consolidation Properties of Saturated Cohesive Soils Using Controlled-Strain Loading 2006. ASTM: West Conshohocken, PA, USA, 2006.
- Adams, A.L. Laboratory Evaluation of the Constant Rate of Strain and Constant Head Techniques for Measurement of the Hydraulic Conductivity of Fine Grained Soils; Massachusetts Institute of Technology: Cambridge, MA, USA, 2011. [Google Scholar]
- Moghadam, J.N.; Nooraiepour, M.; Hellevang, H.; Mondol, N.H.; Aagaard, P. Relative permeability and residual gaseous CO2 saturation in the Jurassic Brentskardhaugen Bed sandstones, Wilhelmøya Subgroup, western central Spitsbergen, Svalbard. Nor. J. Geol. 2019, 99, 317–328. [Google Scholar] [CrossRef]
- Nooraiepour, M.; Bohloli, B.; Park, J.; Sauvin, G.; Skurtveit, E.; Mondol, N.H.H. Effect of brine-CO2 fracture flow on velocity and electrical resistivity of naturally fractured tight sandstones. Geophysics 2018, 83, WA37–WA48. [Google Scholar] [CrossRef] [Green Version]
- Gamage, K.; Screaton, E.; Bekins, B.; Aiello, I. Permeability–porosity relationships of subduction zone sediments. Mar. Geol. 2011, 279, 19–36. [Google Scholar] [CrossRef]
- Daigle, H.; Screaton, E.J.J. Evolution of sediment permeability during burial and subduction. Geofluids 2015, 15, 84–105. [Google Scholar] [CrossRef]
- Yang, Y.; Aplin, A.C. A permeability–porosity relationship for mudstones. Mar. Pet. Geol. 2010, 27, 1692–1697. [Google Scholar] [CrossRef]
- Brigatti, M.F.F.; Galán, E.; Theng, B.K.G. Structure and Mineralogy of Clay Minerals. In Handbook of Clay Science; Elsevier: Amsterdam, The Netherlands, 2013; Volume 5, pp. 21–81. [Google Scholar]
- Avseth, P.; Mukerji, T.; Mavko, G. Quantitative Seismic Interpretation: Applying Rock Physics Tools to Reduce Interpretation Risk; ProQuest: Morrisville, NC, USA, 2005; Volume 9780521816, ISBN 9780511600074. [Google Scholar]
- Brigatti, M.F.F.; Galán, E.; Theng, B.K.G.K.G.; Schoonheydt, R.A.; Johnston, C.T.; Bergaya, F. 1—Clay minerals and their surfaces. In Surface and Interface Chemistry of Clay Minerals; Schoonheydt, R., Johnston, C.T., Bergaya, F.B.T.-D., Eds.; Elsevier: Amsterdam, The Netherlands, 2018; Volume 9, pp. 1–21. ISBN 1572-4352. [Google Scholar]
- Bergaya, F.; Lagaly, G. Chapter 1—General Introduction: Clays, Clay Minerals, and Clay Science. In Handbook of Clay Science; Bergaya, F., Lagaly, G.B.T.-D., Eds.; Elsevier: Amsterdam, The Netherlands, 2013; Volume 5, pp. 1–19. ISBN 1572-4352. [Google Scholar]
- Haigh, S.K.; Vardanega, P.J. Fundamental basis of single-point liquid limit measurement approaches. Appl. Clay Sci. 2014, 102, 8–14. [Google Scholar] [CrossRef] [Green Version]
- Emmerich, K. Chapter 2.13—Full Characterization of Smectites. In Handbook of Clay Science; Bergaya, F., Lagaly, G.B.T.-D., Eds.; Elsevier: Amsterdam, The Netherlands, 2013; Volume 5, pp. 381–404. ISBN 1572-4352. [Google Scholar]
- Castagna, J.P.; Batzle, M.L.; Eastwood, R.L. Relationships between compressional-wave and shear-wave velocities in clastic silicate rocks. Geophysics 1985, 50, 571–581. [Google Scholar] [CrossRef]
- Greenberg, M.L.; Castagna, J.P. Shear-wave velocity estimation in porous rocks: Theoretical formulation, preliminary verification and applications. Geophys. Prospect. 1992, 40, 195–209. [Google Scholar] [CrossRef]
- Beloborodov, R.; Pervukhina, M.; Han, T.; Josh, M. Experimental Characterization of Dielectric Properties in Fluid Saturated Artificial Shales. Geofluids 2017, 2017, 1019461. [Google Scholar] [CrossRef] [Green Version]
- Chilingar, G.V.; Knight, L. Relationship Between Pressure and Moisture Content of Kaolinite, Illite, and Montmorillonite Clays1. Am. Assoc. Pet. Geol. Bull. 1960, 44, 101–106. [Google Scholar] [CrossRef]
- von Engelhardt, W.; Gaida, K.H. Concentration changes of pore solutions during compaction of clay sediments. J. Sediment. Res. 1963, 33, 919–930. [Google Scholar] [CrossRef]
- Brown, P.R. Compaction of fine-grained terrigenous and carbonate sediments: A review. Bull. Can. Pet. Geol. 1969, 17, 486–495. [Google Scholar]
- Marion, D.; Nur, A.; Yin, H.; Han, D. Compressional velocity and porosity in sand-clay mixtures. Geophysics 1992, 57, 554–563. [Google Scholar] [CrossRef]
- Robinet, J.C.; Pakzad, M.; Plas, F. Un modèle rhéologique pour les argiles gonflantes. Rev. Française Géotechnique 1994, 68, 57–67. [Google Scholar] [CrossRef] [Green Version]
- Vasseur, G.; Djeran-Maigre, I.; Grunberger, D.; Rousset, G.; Tessier, D.; Velde, B. Evolution of structural and physical parameters of clays during experimental compaction. Mar. Pet. Geol. 1995, 12, 941–954. [Google Scholar] [CrossRef]
- Djéran-Maigre, I.; Tessier, D.; Grunberger, D.; Velde, B.; Vasseur, G. Evolution of microstructures and of macroscopic properties of some clays during experimental compaction. Mar. Pet. Geol. 1998, 15, 109–128. [Google Scholar] [CrossRef]
- Beloborodov, R.; Pervukhina, M.; Lebedev, M. Compaction trends of full stiffness tensor and fluid permeability in artificial shales. Geophys. J. Int. 2018, 212, 1687–1693. [Google Scholar] [CrossRef] [Green Version]
- Glover, P.W.J.; Luo, M. The Porosity and Permeability of Binary Grain Mixtures. Transp. Porous Media 2020, 132, 1–37. [Google Scholar] [CrossRef] [Green Version]
- Yin, H. Acoustic Velocity and Attenuation of Rocks: Isotropy, Intrinsic Anisotropy, and Stress-Induced Anisotropy; Stanford University: Stanford, CA, USA, 1992. [Google Scholar]
- Dewhurst, D.N.; Aplin, A.C.; Sarda, J.-P.; Yang, Y. Compaction-driven evolution of porosity and permeability in natural mudstones: An experimental study. J. Geophys. Res. Solid Earth 1998, 103, 651–661. [Google Scholar] [CrossRef]
- Revil, A.; Grauls, D.; Brévart, O. Mechanical compaction of sand/clay mixtures. J. Geophys. Res. Solid Earth 2002, 107, 2293. [Google Scholar] [CrossRef]
- Pitman, T.D.; Robertson, P.K.; Sego, D.C. Influence of fines on the collapse of loose sands. Can. Geotech. J. 1994, 31, 728–739. [Google Scholar] [CrossRef]
- Thevanayagam, S.; Mohan, S. Intergranular state variables and stress–strain behaviour of silty sands. Géotechnique 2000, 50, 1–23. [Google Scholar] [CrossRef]
- Knoll, D.M.; Knight, R. Relationships between Dielectric and Hydrogeologic Properties of Sand-Clay Mixtures. In Proceedings of the Fifth International Conferention on Ground Penetrating Radar, Kitchener, ON, Canada, 12 June 1994. [Google Scholar] [CrossRef]
- Beloborodov, R.; Pervukhina, M.; Luzin, V.; Delle Piane, C.; Clennell, M.B.; Zandi, S.; Lebedev, M. Compaction of quartz-kaolinite mixtures: The influence of the pore fluid composition on the development of their microstructure and elastic anisotropy. Mar. Pet. Geol. 2016, 78, 426–438. [Google Scholar] [CrossRef]
- Mondol, N.H.H. Porosity and permeability development in mechanically compacted silt-kaolinite mixtures. In Proceedings of the 2009 SEG Annual Meeting, Houston, TX, USA, 25–30 October 2009; Volume 28, pp. 2139–2143. [Google Scholar]
- Fawad, M.; Mondol, N.H.; Jahren, J.; Bjørlykke, K. Microfabric and rock properties of experimentally compressed silt-clay mixtures. Mar. Pet. Geol. 2010, 27, 1698–1712. [Google Scholar] [CrossRef]
- Mondol, N.H.; Bjørlykke, K.; Jahren, J.; Høeg, K. Experimental mechanical compaction of clay mineral aggregates-Changes in physical properties of mudstones during burial. Mar. Pet. Geol. 2007, 24, 289–311. [Google Scholar] [CrossRef]
- Mondol, N.; Bjørlykke, K.; Jahren, J. Experimental Compaction of Kaolinite Aggregates—Effects of Grain Size on Mudrock Properties. In Proceedings of the 70th EAGE Conference and Exhibition incorporating SPE EUROPEC 2008, Rome, Italy, 9 June 2008; p. cp-40-00284. [Google Scholar]
- Michael, K.; Golab, A.; Shulakova, V.; Ennis-King, J.; Allinson, G.; Sharma, S.; Aiken, T. Geological storage of CO2 in saline aquifers—A review of the experience from existing storage operations. Int. J. Greenh. Gas Control 2010, 4, 659–667. [Google Scholar] [CrossRef]
- Liu, F.; Lu, P.; Griffith, C.; Hedges, S.W.; Soong, Y.; Hellevang, H.; Zhu, C. CO2–brine–caprock interaction: Reactivity experiments on Eau Claire shale and a review of relevant literature. Int. J. Greenh. Gas Control 2012, 7, 153–167. [Google Scholar] [CrossRef] [Green Version]
- Karstunen, M.; Koskinen, M. Plastic anisotropy of soft reconstituted clays. Can. Geotech. J. 2008, 45, 314–328. [Google Scholar] [CrossRef] [Green Version]
- Yin, Z.-Y.; Hattab, M.; Hicher, P.-Y. Multiscale modeling of a sensitive marine clay. Int. J. Numer. Anal. Methods Geomech. 2011, 35, 1682–1702. [Google Scholar] [CrossRef]
- Burland, J.B. On the compressibility and shear strength of natural clays. Geotechnique 1990, 40, 329–378. [Google Scholar] [CrossRef]
- Hicher, P.Y.; Wahyudi, H.; Tessier, D. Microstructural analysis of inherent and induced anisotropy in clay. Mech. Cohesive-Frictional Mater. 2000, 5, 341–371. [Google Scholar] [CrossRef]
- Wheeler, S.J.S.J.; Näätänen, A.; Karstunen, M.; Lojander, M. An anisotropic elastoplastic model for soft clays. Can. Geotech. J. 2003, 40, 403–418. [Google Scholar] [CrossRef]
- Falcon-Suarez, I.H.; Amalokwu, K.; Delgado-Martin, J.; Callow, B.; Robert, K.; North, L.; Sahoo, S.K.; Best, A.I. Comparison of stress-dependent geophysical, hydraulic and mechanical properties of synthetic and natural sandstones for reservoir characterization and monitoring studies. Geophys. Prospect. 2019, 67, 784–803. [Google Scholar] [CrossRef] [Green Version]
- Zhao, H.; Ning, Z.; Zhao, T.; Zhang, R.; Wang, Q. Effects of mineralogy on petrophysical properties and permeability estimation of the Upper Triassic Yanchang tight oil sandstones in Ordos Basin, Northern China. Fuel 2016, 186, 328–338. [Google Scholar] [CrossRef]
- Nooraiepour, M.; Masoudi, M.; Hellevang, H. Probabilistic nucleation governs time, amount, and location of mineral precipitation and geometry evolution in the porous medium. Sci. Rep. 2021, 11. [Google Scholar] [CrossRef] [PubMed]
- Nooraiepour, M.; Masoudi, M.; Shokri, N.; Hellevang, H. Probabilistic Nucleation and Crystal Growth in Porous Medium: New Insights from Calcium Carbonate Precipitation on Primary and Secondary Substrates. ACS Omega 2021, 6, 28072–28083. [Google Scholar] [CrossRef]
- Deng, H.; Poonoosamy, J.; Molins, S. A reactive transport modeling perspective on the dynamics of interface-coupled dissolution-precipitation. Appl. Geochem. 2022, 137, 105207. [Google Scholar] [CrossRef]
- Chapuis, R.P.; Aubertin, M. On the use of the Kozeny–Carman equation to predict the hydraulic conductivity of soils. Can. Geotech. J. 2003, 40, 616–628. [Google Scholar] [CrossRef]
- Civan, F.; Rai, C.S.S.; Sondergeld, C.H.H. Shale-Gas Permeability and Diffusivity Inferred by Improved Formulation of Relevant Retention and Transport Mechanisms. Transp. Porous Media 2011, 86, 925–944. [Google Scholar] [CrossRef]
- Revil, A.; Cathles, L.M., III; Cathles, L.M. Permeability of shaly sands. Water Resour. Res. 1999, 35, 651–662. [Google Scholar] [CrossRef]
Figure 2.
(A) A schematic representation of high-stress oedometer compression setup equipped with piezoelectric transducers for real-time Vp and Vs measurements. (B) Applied vertical stress and pore fluid drainage conditions during the constant rate of strain (CRS) uniaxial compaction experiments.
Figure 2.
(A) A schematic representation of high-stress oedometer compression setup equipped with piezoelectric transducers for real-time Vp and Vs measurements. (B) Applied vertical stress and pore fluid drainage conditions during the constant rate of strain (CRS) uniaxial compaction experiments.
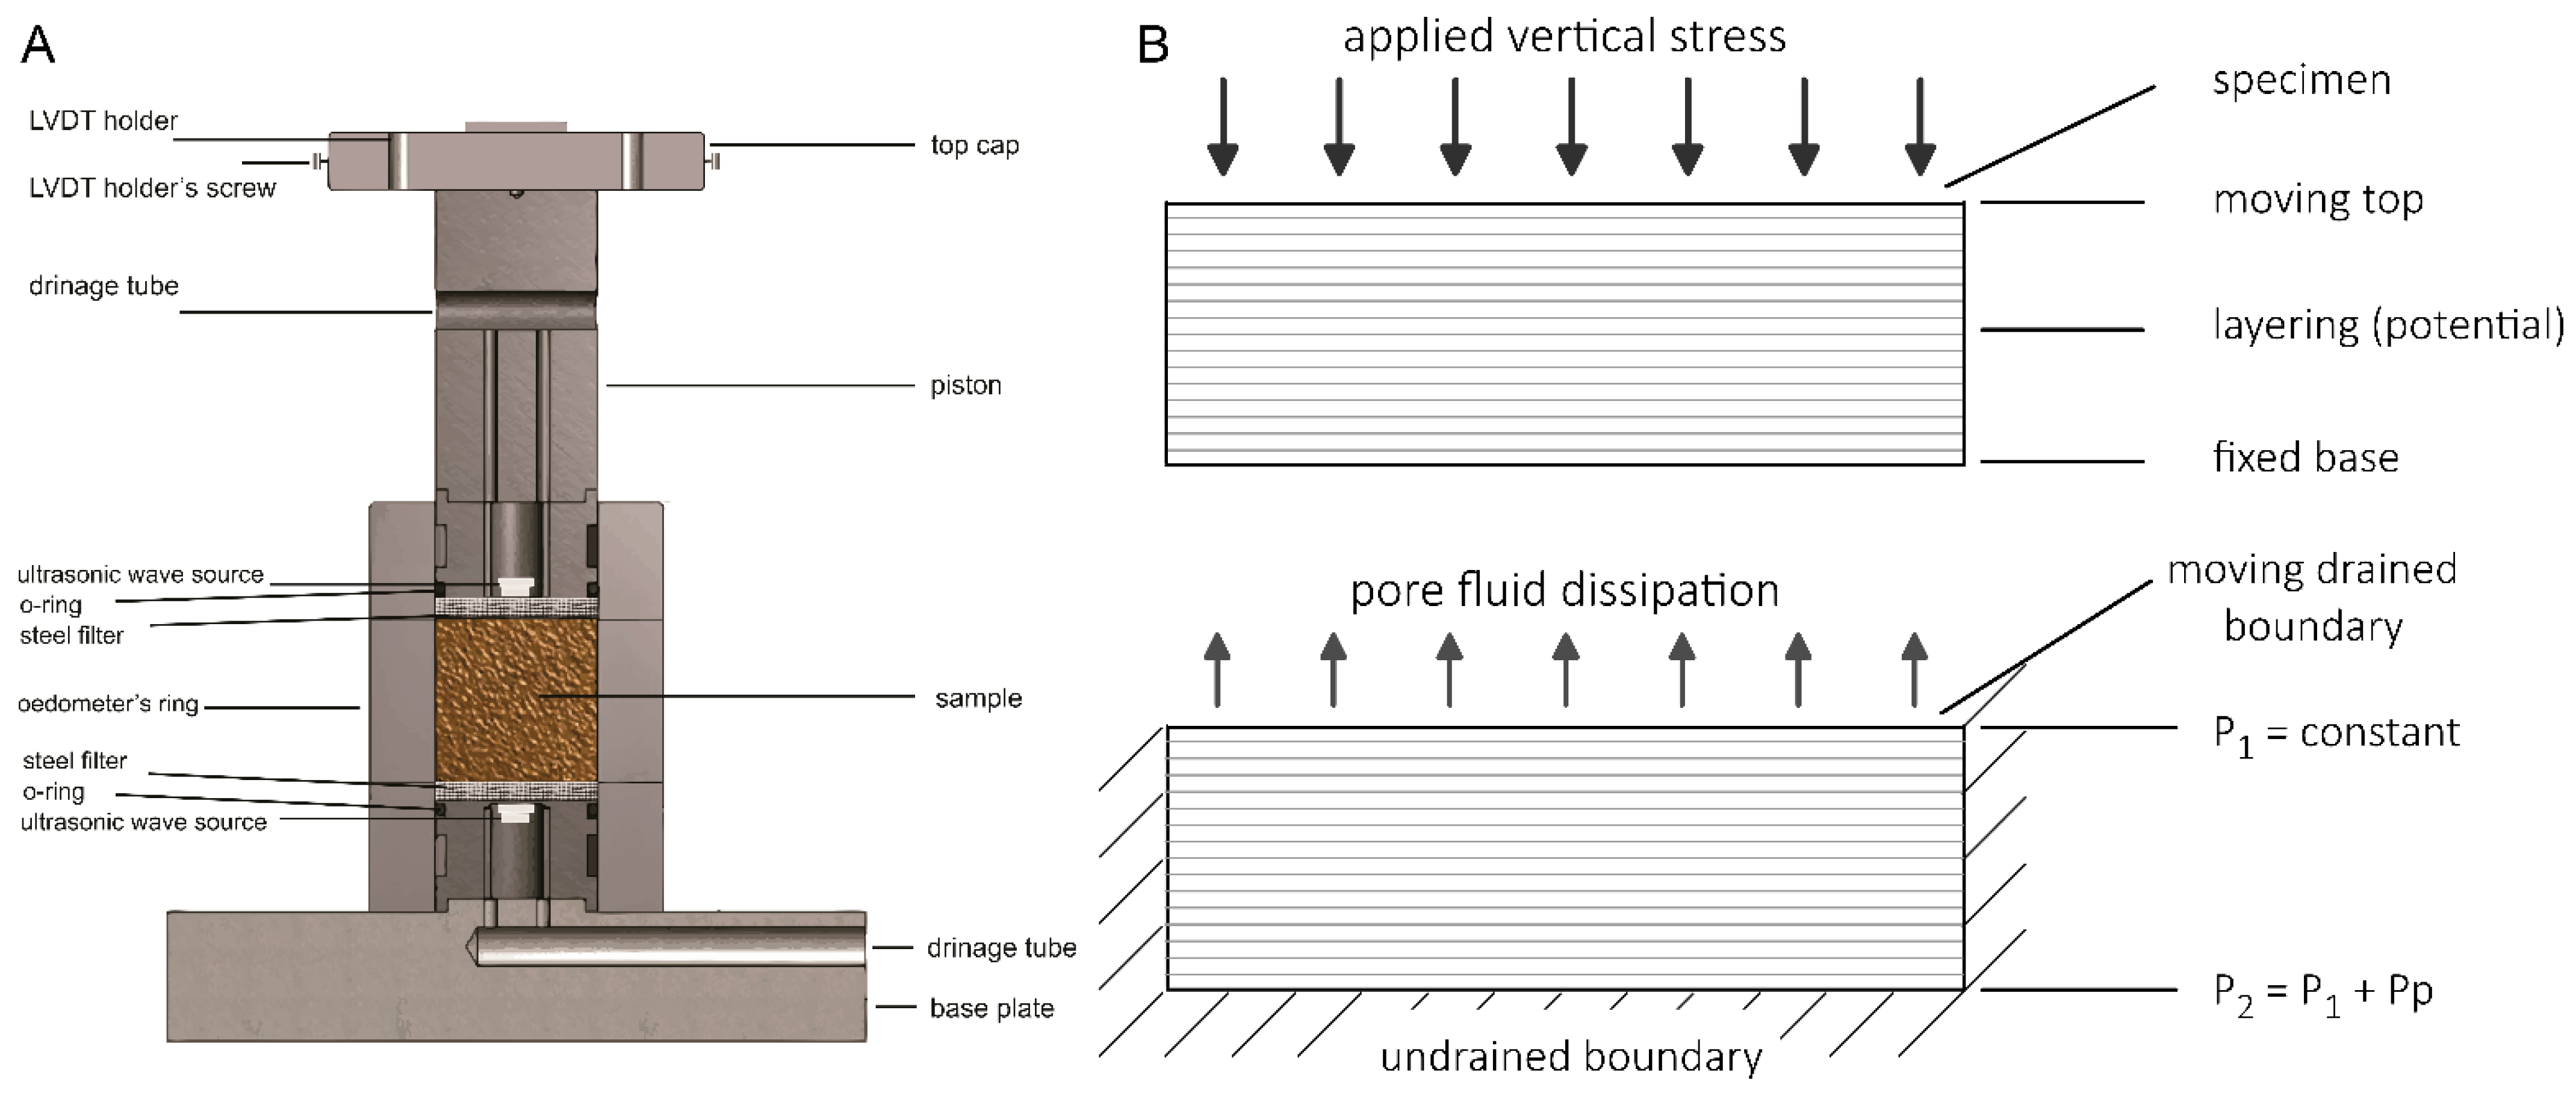
Figure 3.
The uniaxial mechanical compaction results of brine-saturated binary quartz–clay mixtures. The evolution of (A) total porosity [%], (B) vertical permeability [mD], (C) compressional wave velocity (Vp) [m/s], and (D) shear-wave velocity (Vs) [m/s] are plotted as a function of effective vertical stress [MPa]. The variability domains of kaolinite-rich and smectite-rich mudstone samples are color-coded in violet and green, respectively. y = exp (a + b∗ln(x)) describes the presented boundaries. The estimated relative error in Vp and Vs was approximately 5% to 2%, which declined rapidly as effective vertical stress was increased. Parameters measured during CRS experiments (except ultrasonic velocity) were associated with less than 2% uncertainty.

Figure 4.
Experimental compaction results of brine-saturated binary quartz–clay mixtures. The evolution (A) vertical permeability [mD] in semi-logarithmic plane, (B) compressional wave velocity (Vp) [m/s], and (C) shear-wave velocity (Vs) [m/s] in linear coordinates are plotted as a function of total porosity [%]. The variability domain of kaolinite-rich and smectite-rich mudstone samples are color-coded in violet and green, respectively. ln(y) = b∗x + a describes the presented boundaries.

Figure 5.
Computed dynamic elastic moduli of brine-saturated binary quartz–clay mixtures. The evolution of elastic moduli, namely, (A,D) bulk modulus [GPa], (B,E) shear modulus [GPa], and (C,F) Poisson’s ratio are plotted against (top row) effective vertical stress [MPa] and (bottom row) total porosity [%]. The variability domain of kaolinite-rich (violet squares) and smectite-rich (green circles) clay minerals are shown. The exponential equations y = exp (a + b∗ln(x)) and ln(y) = b∗x + a describe the elastic moduli boundaries versus effective vertical stress and total porosity, respectively.
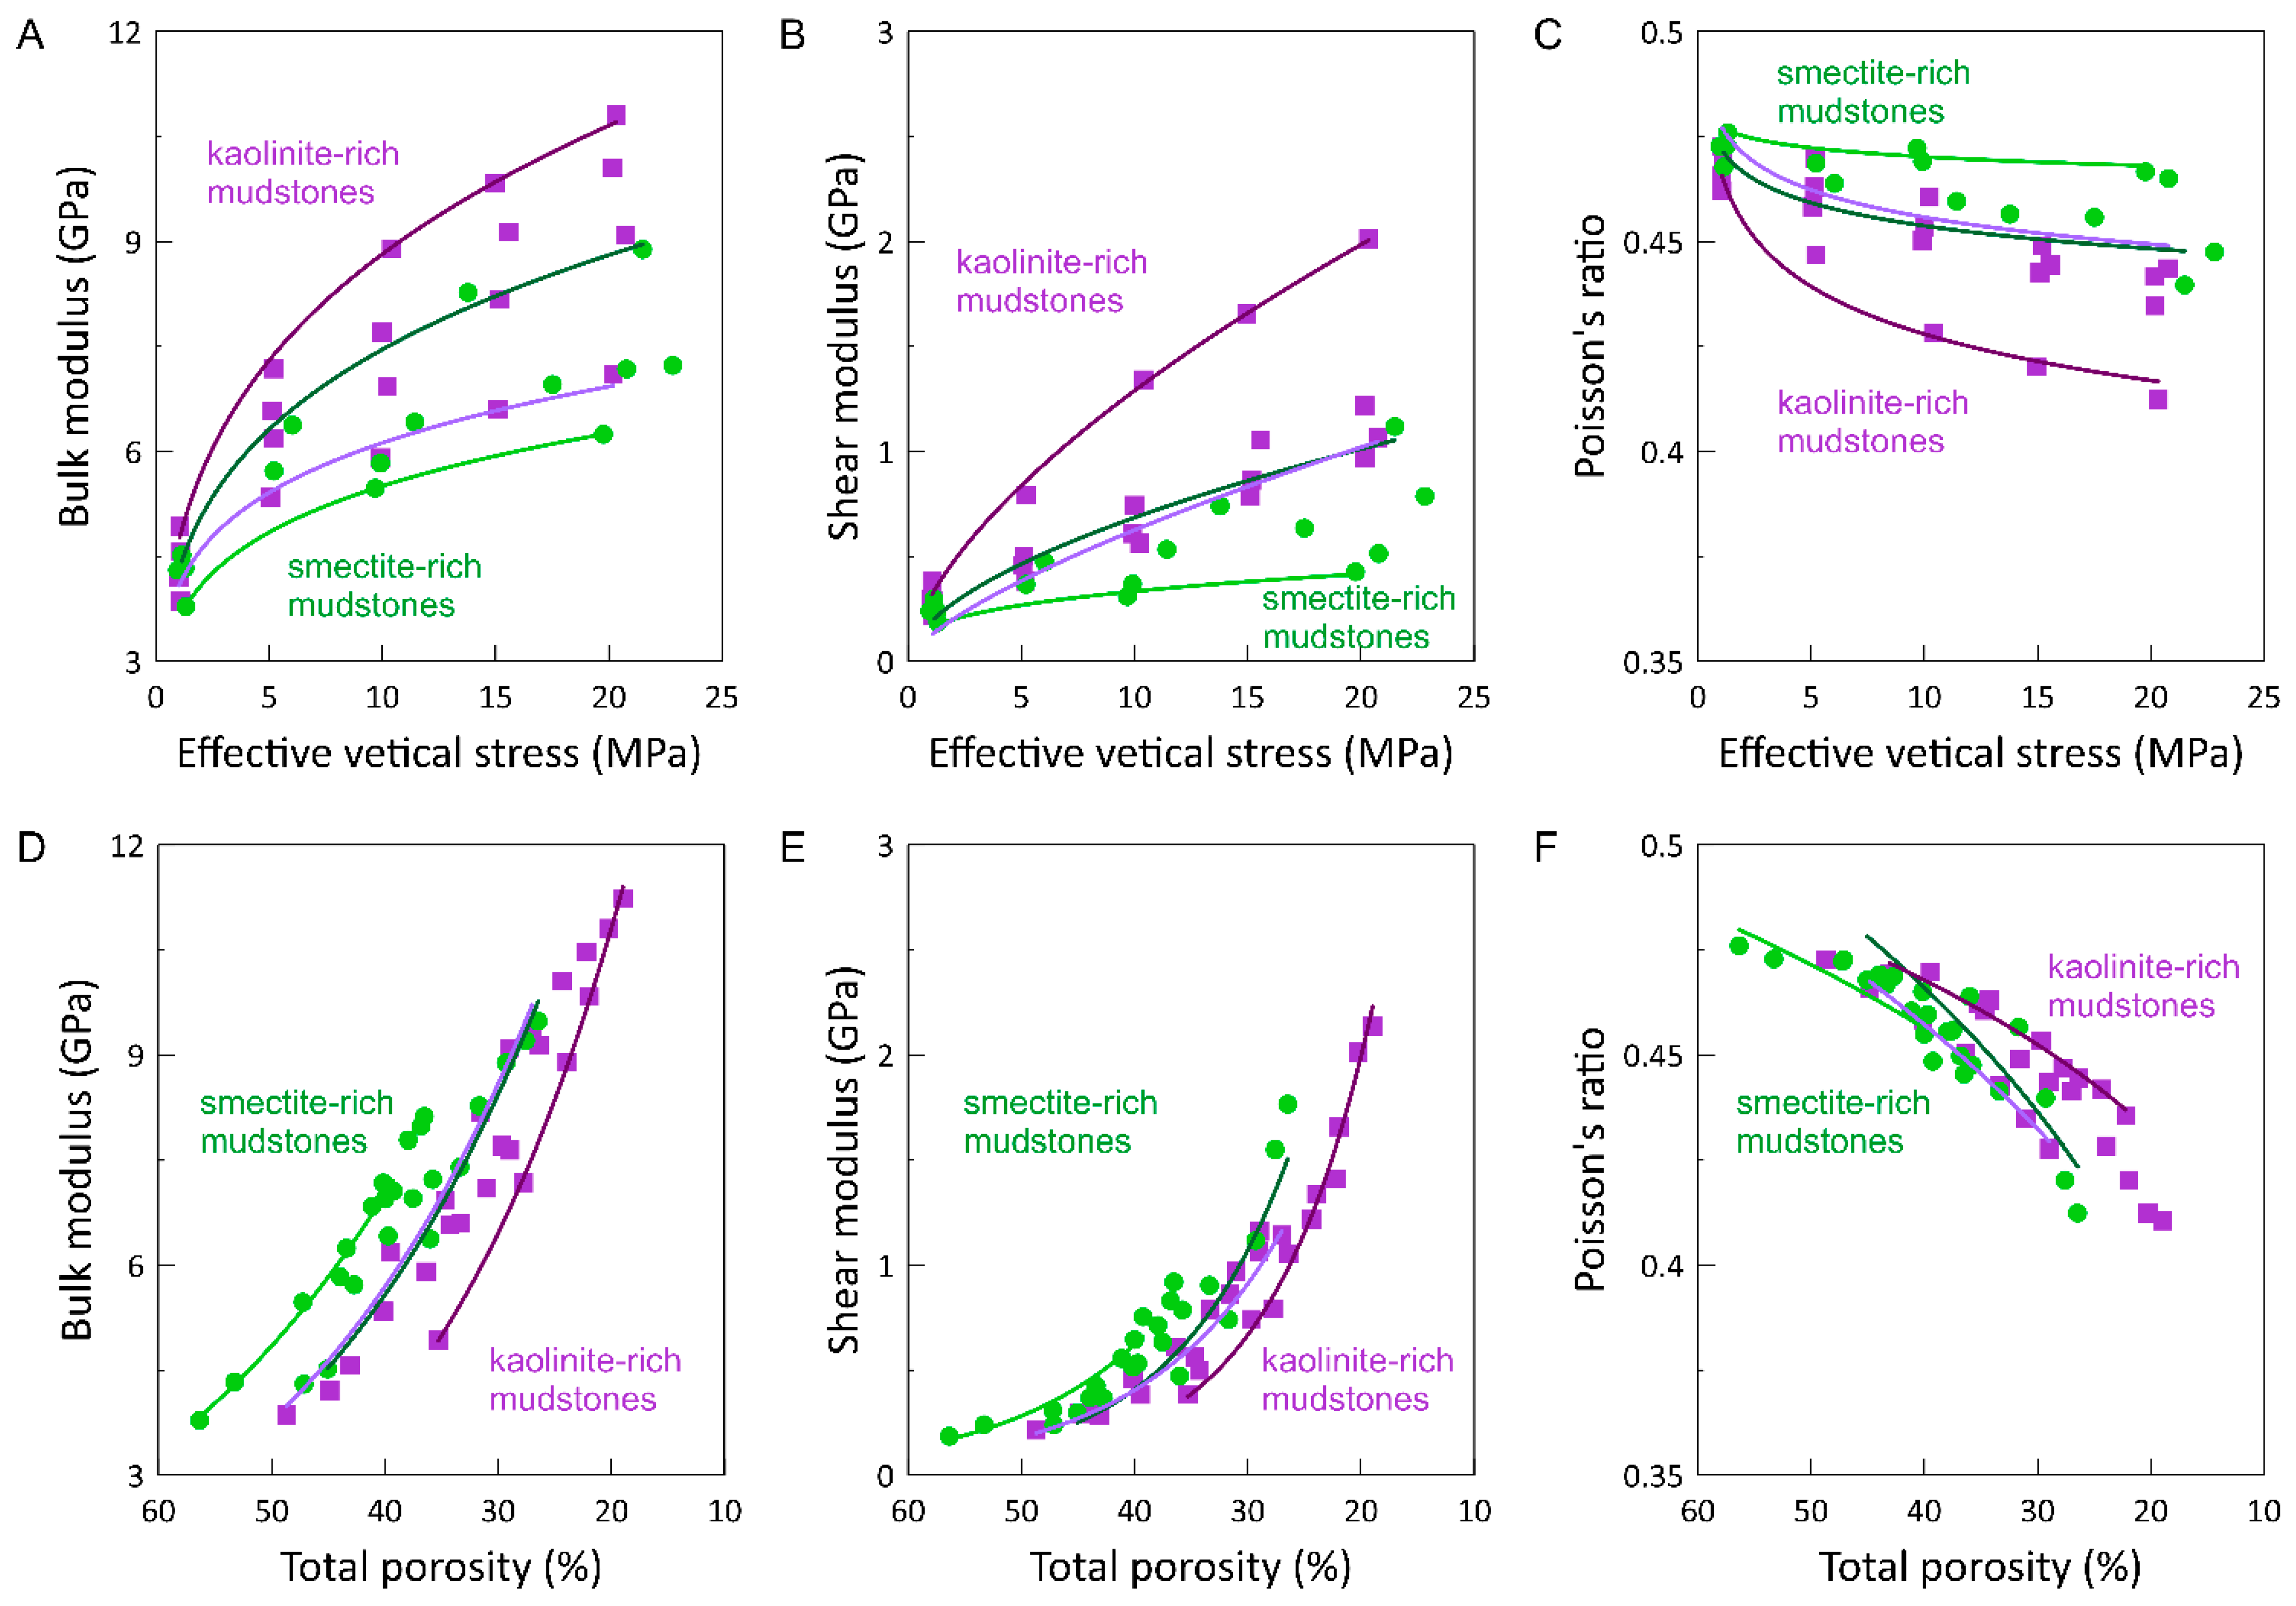
Figure 6.
Rock physics cross-plots of (A) Vp versus Vs along with the published Vp-Vs relationships [12,53,54], (B) Vp/Vs ratio versus ultrasonic impedance (Ip, P-impedance), (C) Young’s modulus versus Poisson’s ratio, and (D) μρ (rigidity times bulk density) versus λρ (incompressibility times bulk density). Computed and measured properties for kaolinite-rich (violet squares) and smectite-rich (green circles) clay minerals are shown.

Figure 7.
Comparison of published experimental normal compaction trends (NCTs) for brine-saturated pure kaolinite samples. Citations are given in the text.
Figure 7.
Comparison of published experimental normal compaction trends (NCTs) for brine-saturated pure kaolinite samples. Citations are given in the text.
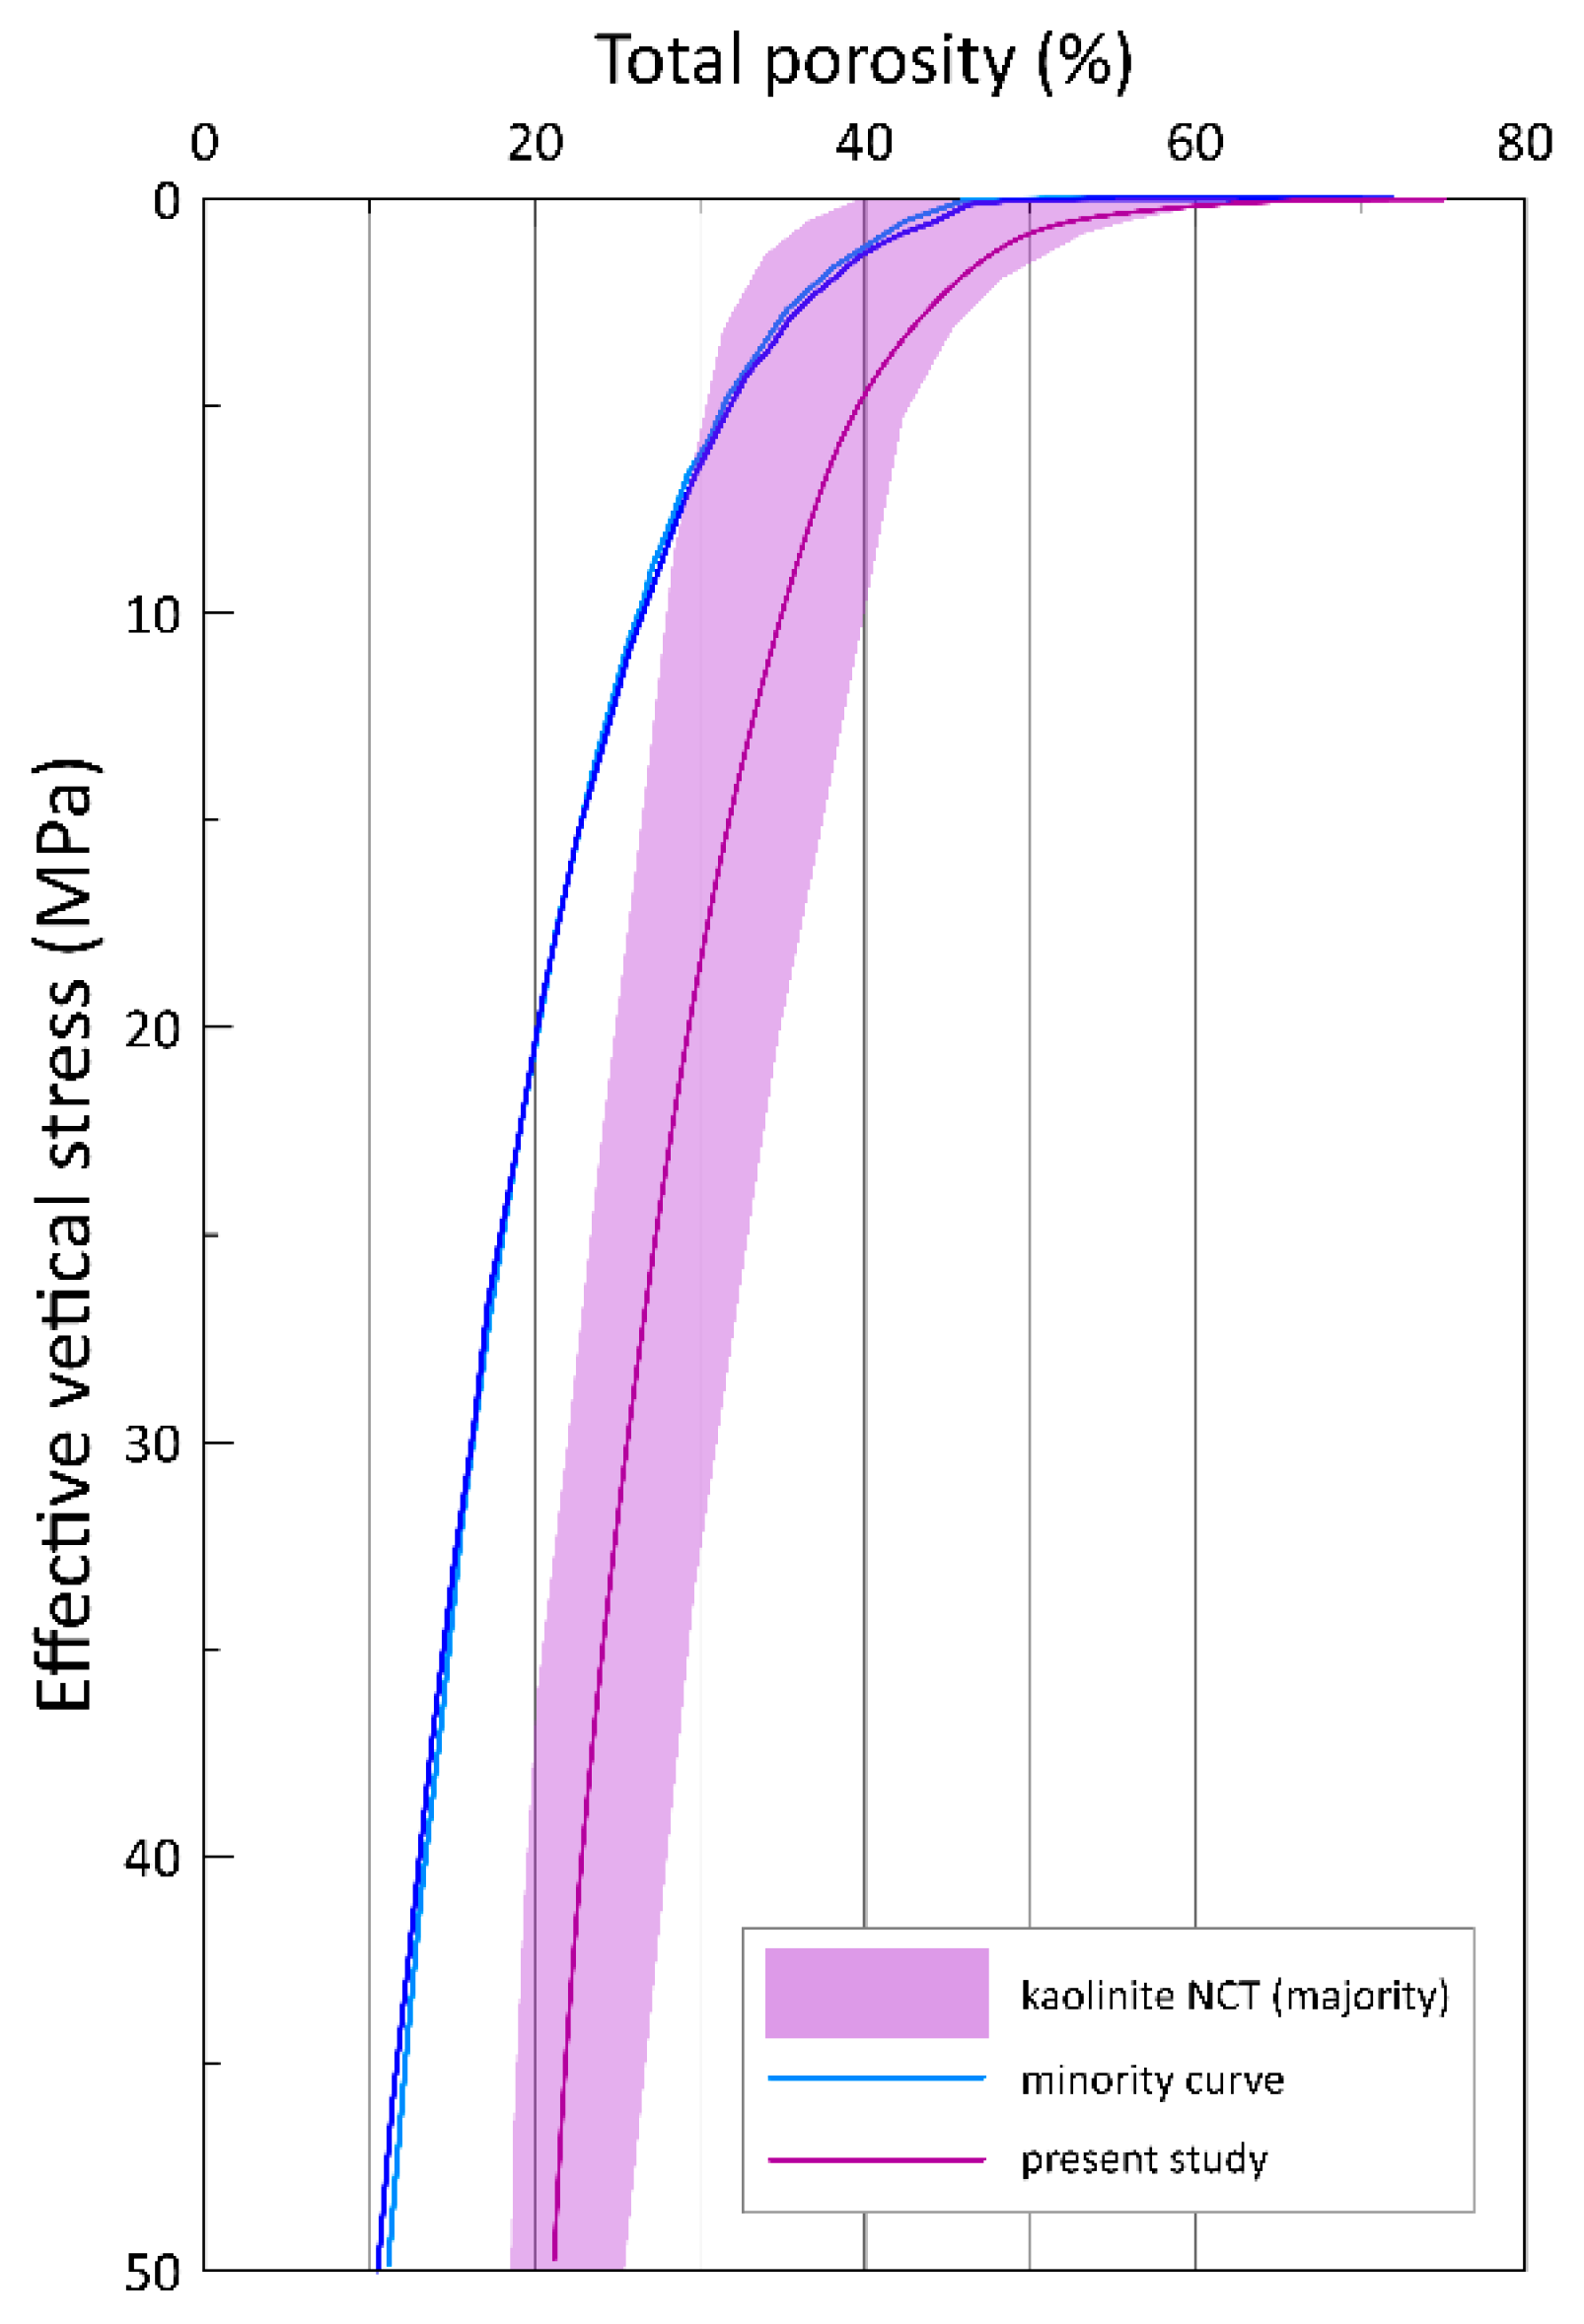
Table 1.
List of the tested samples and their initial parameters.
| Binary Mixtures | Compaction | Initial Parameters | |||||
|---|---|---|---|---|---|---|---|
| Clay Fraction | Quartz * Fraction | Quartz: Clay wt [%] | Effective Stress [MPa] | Initial Height [mm] | Brine-Sat. Mass [gr] | Dry Mass [gr] | |
| kaolinite-rich | kaolinite | --- | 0:100 | 25 | 31.09 | 87.69 | 39.97 |
| kaolinite | silt + VFS | 15:85 | 25 | 32.54 | 90.53 | 38.51 | |
| kaolinite | silt + VFS | 50:50 | 25 | 34.89 | 100.37 | 47.45 | |
| kaolinite | silt + VFS | 85:15 | 25 | 31.9 | 95.93 | 49.4 | |
| smectite-rich | smectite | --- | 0:100 | 25 | 33.23 | 88.27 | 32.64 |
| smectite | silt + VFS | 15:85 | 25 | 33.96 | 91.7 | 37.28 | |
| smectite | silt + VFS | 50:50 | 25 | 32.29 | 87.7 | 35.49 | |
| smectite | silt + VFS | 85:15 | 25 | 33.99 | 100.56 | 48.49 | |
| pure kaolinite | kaolinite | --- | 0:100 | 50 | 31.15 | 87.86 | 40.03 |
| kaolinite | --- | 0:100 | 50 | 31.11 | 87.84 | 40.00 | |
* Quartz grains are composed of silt-sized (4–63 μm) and very fine sand (VFS)-sized (63–125 μm) aggregates
Publisher’s Note: MDPI stays neutral with regard to jurisdictional claims in published maps and institutional affiliations. |
© 2022 by the author. Licensee MDPI, Basel, Switzerland. This article is an open access article distributed under the terms and conditions of the Creative Commons Attribution (CC BY) license (https://creativecommons.org/licenses/by/4.0/).
Share and Cite
MDPI and ACS Style
Nooraiepour, M. Clay Mineral Type and Content Control Properties of Fine-Grained CO2 Caprocks—Laboratory Insights from Strongly Swelling and Non-Swelling Clay–Quartz Mixtures. Energies 2022, 15, 5149. https://doi.org/10.3390/en15145149
AMA Style
Nooraiepour M. Clay Mineral Type and Content Control Properties of Fine-Grained CO2 Caprocks—Laboratory Insights from Strongly Swelling and Non-Swelling Clay–Quartz Mixtures. Energies. 2022; 15(14):5149. https://doi.org/10.3390/en15145149
Chicago/Turabian StyleNooraiepour, Mohammad. 2022. "Clay Mineral Type and Content Control Properties of Fine-Grained CO2 Caprocks—Laboratory Insights from Strongly Swelling and Non-Swelling Clay–Quartz Mixtures" Energies 15, no. 14: 5149. https://doi.org/10.3390/en15145149
Note that from the first issue of 2016, this journal uses article numbers instead of page numbers. See further details here.