1. Introduction
In recent years, the international energy landscape has been undergoing historic changes. In addition to the rapid increase in the adoption of renewable energy sources (RES), we are observing a transition from a centralized electricity generation system to an increasingly distributed one. Thanks to the widespread adoption of small decentralized production units, such as photovoltaic (PV) panels or small cogeneration plants, the contribution of production from conventional power plants is decreasing. Rooftop PV installations, in particular, are today the most used RES in residential areas, and an increase of 40 GW of PV installations in the EU is expected by 2024 [
1].
However, the continuous growth of energy generation from RES has not only led to a significant change in the structure of the energy system but also influenced business models related to the world of energy, and new players have been introduced, highlighting the importance of the role of the consumer and the community in the creation of these energy systems. In this context, the renewable energy community (REC) regulation is assuming a leading role in producing energy from renewable sources and scientific research for innovative technologies that are best integrated with RES. Energy communities (ECs) can be defined as user associations that aim to produce energy from renewable sources within the community that needs to consume it and exchange it, with a view to achieving self-consumption and self-sustainability.
The European Council adopted two directives as part of the “Clean Energy Package”, presented by the European Commission in 2016 [
2]. The renewable energy directive (RED II) 2018/2001/EU [
3] introduced the concept of renewable energy communities (RECs) with the aim of fostering the production, consumption and storage of energy from locally available renewable energy sources. The internal electricity market (IEM) directive 2019/944/EU [
4], instead, introduced the concept of the citizens’ energy community (CEC), where the aim revolves around the participation of users in electricity markets in all of their forms. The definitions of CEC and REC describe a way to “organize” the collective cooperation of an activity related to the production of energy on a specific property as a form of governance without any commercial purpose; in fact, the main purpose of both CECs and RECs is to provide more environmental, economic or social benefits to the community. However, there are some differences between the definitions of CEC and REC that support us in explaining their relationship. These differences relate to the geographical size of the community, the forms of energy involved, the technology, the control and participating members and, finally, the purpose of the European legislative framework for the two entities.
In Italy, the RED II directive was implemented through Article 42-bis of the
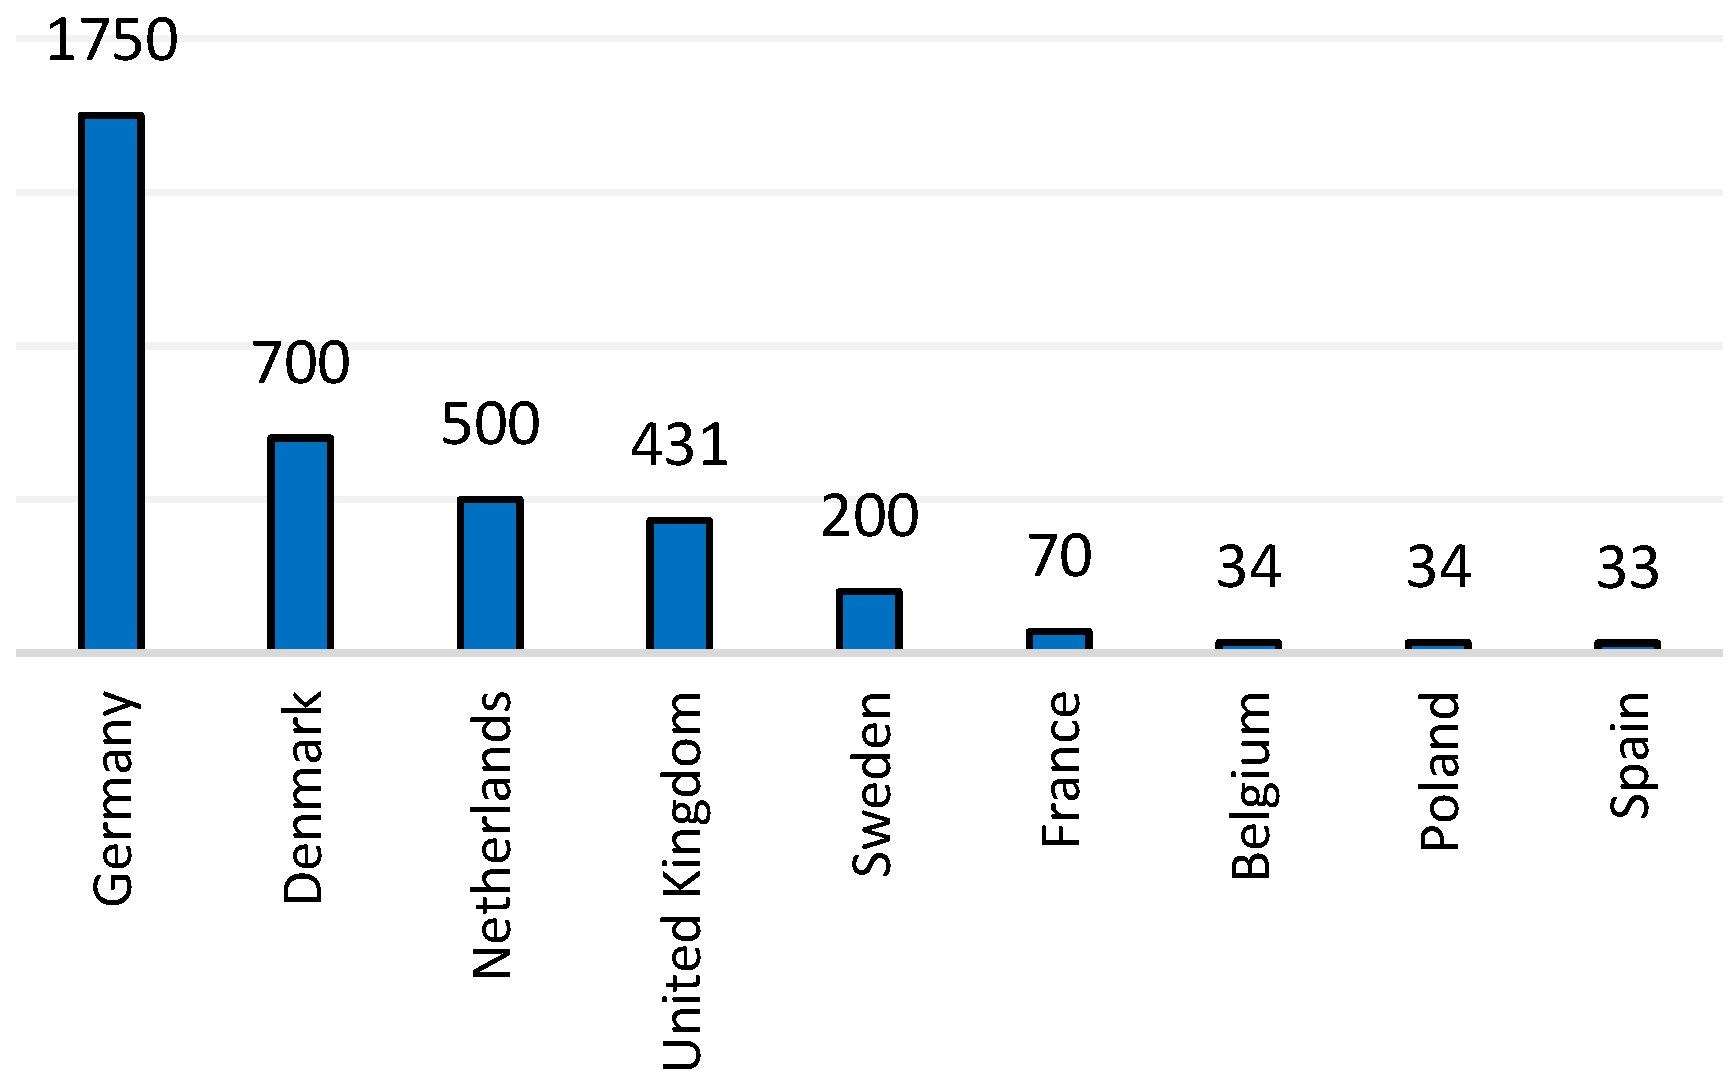
Milleproroghe Decree (Legislative Decree 162/19) in an “experimental framework” in which two new legislative/regulatory concepts are introduced: collective self-consumers and renewable energy communities. Following the Italian partial transposition, the regulation of the authority 318/2020 was defined, which deals with the “regulatory” issue and the decree of the 16th of September 2020, in which the issue relating to incentives (under ministerial competence) is addressed. In December 2020, the technical rules were published by the GSE (Energy Services Manager), which define the necessary requirements, the access procedures, the standard contract scheme and the timing of the provision of incentives. On 15 December 2021, the Legislative Decree 8 November 2021 n. 199 came into force, which activated the RED II, and on 26 December 2021, the Legislative Decree 8 November 2021 n. 210 activated the IEM directive. At present, in Europe, there are about 3500 renewable energy cooperatives, a type of energy community, mostly located in Northwestern Europe, as shown in
Figure 1 [
5]. RECs and CECs are still emerging themes in the academic literature. As the conditions can vary remarkably based on the geographical area, several studies have focused on analyzing the current state of development of RECs and CECs in specific countries: the difficulties of implementing RECs in France and England, for instance, were investigated respectively in [
6,
7]. The work presented in [
8] instead compares the REC implementation models in France, where the phenomenon is emerging, and in the Netherlands, where the concept is more consolidated and mature, recognizing that RECs play a key role in the energy transition.
Other studies have analyzed how the energy modeling of urban buildings can contribute to the development of REC [
9] and the methodological approaches to their implementation [
10]. Another study analyzed strategies for energy storage systems of prosumers who are part of a REC equipped with photovoltaic generators [
11]. Other authors [
12] provide an interesting overview of the upcoming developments of REC, focusing on the strengths of the new approach to energy consumption and the criticalities that their adoption entails.
District heating networks (DHNs) are another technology widely adopted today [
13] as a solution to reduce the environmental impact of energy demand in urbanized areas. By reducing the number of boilers and increasing their size, they allow reducing emissions within the city area while increasing safety and eliminating the need for transporting fuel to residential areas. This is particularly true for DHNs in which the heat is supplied by combined heat and power (CHP) units that allow the achievement of high levels of overall efficiency [
14].
While inherently more efficient than decentralized heat generation, DHNs can still benefit from improvements with the aim of reducing their carbon footprint. This can be achieved through their integration with RES: on the one hand, this allows the decarbonization of heat generation in the DHN, while on the other hand, it can make it easier to manage the intermittent and non-programmable nature of most RES. Integrated CHP-RES thermal grids have been applied in a few cases in Europe, mostly focusing, however, on dispatchable RES such as geothermal heat [
15] and biomass [
16]. There are, however, a few examples of solar-driven DHNs, such as the results of the work conducted in [
17].
In this regard, ECs offer an innovative way to foster the adoption of RES in DHNs, whose potential has yet to be analyzed. Heat pumps can be located in a central heating generation facility to decarbonize heat generation, but often, the surface available for PV systems within the premises of the central heating generation facility is limited; on the other hand, neighboring buildings often have available surfaces for PV generation that go beyond the respective demand, especially during times when energy is available. Because of the relative novelty of the field, little work has been devoted so far to the adoption of the EC form in connection to DHNs. The study presented in [
18] shows the environmental and economic benefits of establishing a REC and discusses the potential of renewable energy communities for fifth-generation district heating and cooling systems. In a different study, S. Zwickl-Bernhard et al. [
19] proposed the decarbonization of an urban district of Vienna through two different linked approaches that allow the almost complete electrification of energy services and involve the expansion of the district heating network.
In another study, P. Arevalo et al. [
20] presented an interesting technical-economic analysis of different combined hybrid energy systems, such as wind generators, photovoltaic systems, hydrokinetic turbines, batteries and diesel generators in southern Ecuador.
With the implementation of the use of energy from RES, the world is confronting their greatest problem, that is, the non-programmability of their production. Thanks to the regulation of energy communities, the opportunity to exploit the share of energy that would normally be lost takes shape through strategies aimed at increasing the internal sharing of energy by drawing economic, energy and environmental benefits.
This study highlights how renewable energy communities can play a leading role in the energy transition and represent an opportunity to be taken in the context of the decarbonization of district heating networks. In detail, the aim of the work was to investigate the potential synergies derived from the implementation of RECs in DHNs, a topic that is only little discussed in the current literature since RECs have only recently been formally defined in the European regulatory framework. More specifically, the authors aimed to investigate how the concept of RECs associated with DHNs can lead to better overall energy-economic performance, testing the potential of excess solar energy and adopting different strategies in order to maximize self-consumption and self-sufficiency, as well as to evaluate the most efficient investment in economic terms by exploiting the incentive tariff on shared energy in a specific energy community in Italy.
2. Methodology
The analysis of the potential synergies between RECs and DHNs was based on a simulation approach using the iVN simulation tool [
21].
The model developed in this study and implemented in iVN (see
Section 2.1) allowed the simulation of different scenarios and their evaluation in terms of energy, economic and environmental performance indicators (see
Section 2.5). The model was applied to the case of an existing district heating network located in Bologna (Italy), described in
Section 2.2. The application of the model to the case study allowed the analysis of the integration of various production systems installed at the thermal power plant or at the end users (see
Section 2.3). More specifically, the potential to generate heat for the DHN by using power generated by local PV rooftop installations that is not directly used by the residents in the building, thus sharing their energy within the energy community, was investigated.
2.1. Energy Network Simulation Model
In order to optimize the distribution of thermal, electrical, refrigeration and fuel energy flows and to evaluate the benefits of a renewable energy community, the iVN (Intelligent Virtual Network [
18]) software was used. iVN is a network mapping and analysis tool, whose operation is based on the principle of energy balance at nodes. An example of the configuration of the iVN network is shown in
Figure 2.
In iVN, units are modeled using load-dependent efficiencies defined based on a lookup table approach. Building energy demands can be either provided by the user as time series or automatically estimated by iVN based on information on the site. The energy produced by PV panels is modeled based on tilt, orientation and nominal efficiency and includes load- and temperature-dependent conversion efficiency.
2.2. Case Study
The analysis of the performance of a REC combined with a DHN was performed on the applied case of an existing network. The case study is an area within the suburb of Corticella in the outskirts of Bologna, Italy. Bologna is located at a latitude of 45°37′ and a longitude of 11°21′.
Figure 3 shows the polar solar diagram [
22], which shows the trajectories of the sun (in terms of solar altitude and azimuth) over the course of a day. In this reference frame, the rays join the points of equal azimuth, while the concentric circles join the points of equal height.
The area used as a case study in this paper is a residential area that uses a thermal plant and a DHN for the production and distribution of hot water for both space heating (SH) and domestic hot water (DHW) demands. The thermal plant is in the center of the DHN, and at present, it represents the only place where heat is fed into the network. The power plant consists of four boilers, each with a design heat output of 2900 kW
th and an internal combustion cogeneration engine with a design power and heat output of 1400 kW
e and 1500 kW
th, respectively. A total thermal power of approximately 13,100 kW
th can be delivered to the DHN. The hot water produced is fed into the network at 10 bar and at temperatures ranging between 80 °C and 90 °C, while the pressure drop along the entire path of the network (delivery and return) is approximately 6 bar.
Figure 4 shows the configuration of the thermal power station of Corticella.
The network serves 17 users, of which 13 are residential buildings consisting of a total of 960 apartments, 2 are schools, 1 is a medium-sized supermarket, and 1 is a hospital. The 17 users served by the district heating network receive energy both for space heating during winter and for producing domestic hot water during the whole year. In this work, the energy demand profiles in a typical summer, winter and mid-season day for each user served by the plant were taken as a reference. These combined profiles were obtained in previous studies that examined the Corticella district heating network [
23,
24] and are presented in
Figure 5,
Figure 6 and
Figure 7. The heat requirement is given by the sum of the needs for DHW and SH; the electricity requirement includes daytime and nighttime lighting of utilities and common areas and the use of household appliances in the residential case and of different appliances in the hospital; the cooling requirement is related to the summer air conditioning of the locals.
Figure 8 shows a 3D view of the buildings in the Corticella district heating network imported from Open Street Maps.
2.3. Simulation Scenarios
This study included the simulation of different scenarios, defined with the aim of analyzing the possibility of adding different electrical and/or thermal generation systems:
Scenario 0 (S0): The reference scenario. In this scenario, the energy requirements for domestic hot water and heating are met by the CHP unit (which works only during the winter) and by the four boilers (which work all year round). The energy requirements for electricity and cooling are met by the electricity grid. Compression refrigeration units are present at each user. Furthermore, it is assumed that the electricity production of the CHP unit feeds the auxiliary services of the plant and the pumping group of the district heating network.
Scenario 1 (S1): In this configuration, the installation of absorption refrigeration units at each user to replace compression refrigeration units is considered, where the absorption chillers are assumed to receive heat from the DHN. In this case, the CHP unit is assumed to be running during both the heating and cooling seasons.
Scenario 2 (S2): This configuration, based on Scenario 0, includes the addition of PV systems on the roofs of the buildings of the 17 users.
Scenario 3a (S3a): In addition to PV systems, all configurations of Scenario 3 include the installation of a centralized heat pump that supplies heat to the users. The heat pump sizing is based on a parametric analysis, with the aim of maximizing the shared energy and self-sufficiency and minimizing costs. In the case of S3a, the heat pump is set to run only when the CHP is off.
Scenario 3b (S3b): This configuration has the same unit composition as S3a. In this scenario, the heat pump works only when the CHP remains off and with a 9 a.m.–5 p.m. operating schedule, defined in an attempt to increase its self-sufficiency.
Scenario 3c (S3c): This configuration has the same unit composition as S3a. To further improve the self-sufficiency of the heat pump, in this case, the control of the heat pump is defined such that it is only activated when a sufficient share of its energy demand is covered by the excess electricity generated by the local PV installations.
The main features of the different scenarios are summarized in
Table 1.
2.4. Other Assumptions
The proposed cases were simulated with the iVN software to evaluate the optimal annual operational structure of the entire network. The simulation of the network was performed on an hourly basis for the year 2021, as shown in
Table 2.
The main characteristics of the systems introduced—listed in
Table 3—are defined as follows:
PV panels—Scenarios 2 and 3(a–c): The sizing of the installed photovoltaic systems is based on the available roof surfaces of the 17 users. This parameter was calculated in iVN after importing buildings using Open Street Maps. Subsequently, the useful surface was multiplied by a corrective factor equal to 0.6 to provide a conservative assumption for the surface available for PV modules. The tilt and azimuth angles were chosen based on the optimum for the considered location (latitude 44°30′27″00 N, longitude 11°21′5″ 04 E).
Centralized heat pumps—Scenarios 3(a–c): The coefficient of performance (COP) was chosen based on the available literature [
25]. The three scenarios include the installation of a centralized heat pump that produces hot water at 80 °C. The centralized heat pump is used to produce hot water to be integrated into the district heating network in both summer and winter. It is not used in chiller mode for cooling in summer. During summer, the DHN is also used to provide heat for domestic hot water supply, which explains why HP is also used during summer.
Absorption chiller—Scenario 1: The Energy Efficiency Ratio (EER) was chosen based on the literature, as in the case of heat pumps [
25].
2.5. Key Performance Indicators
The different scenarios were simulated and estimated based on energy, economic and environmental indicators.
From the energy perspective, the analysis focused on two indicators: the self-consumption (SC) rate and the self-sufficiency (SS) rate. The SC rate is defined as the ratio between the local energy production that is used locally and the total local energy production; the SS rate is defined as the ratio between the energy production that is locally used and the total local energy consumption.
For the economic analysis, the parameters related to the operating and investment costs are shown respectively in
Table 4 and
Table 5. For the purchase cost of electricity and natural gas, reference was made to the statistical data provided by the Italian authority for the electricity and gas markets (ARERA). More specifically, the energy cost for household end-users in 2019 was used for the cost of electricity, while values for industrial uses were used for the cost of natural gas [
26,
27]. The assumptions concerning the investment costs of PV panels [
28], absorption groups [
29] and heat pumps [
30] were taken from the available literature.
In Italy, the energy shared within a REC is incentivized. According to the Italian incentive system [
31], the energy shared within an energy community is calculated on an hourly basis as the minimum between the feed-in energy and the unmet electric energy demand. The “shared energy” thus calculated is incentivized with a dedicated tariff of approximately 11 EUR/MWh
e, in addition to the price paid for electricity feed-in.
To evaluate the soundness of the proposed investments, the NPV parameter was used. The NPV is one of the most efficient tools for evaluating which investment is most convenient in economic terms:
where
represents the cash flow,
is the investment cost,
is the interest rate, assumed equal to 6% (which considers the riskiness of the project itself), and
is the useful life, assumed to be equal to 20 years.
In order to carry out a detailed environmental analysis, CO
2 emission factors for the supply of electricity and use of natural gas were identified. Based on what was reported in [
32], for the estimation of CO
2 emissions relating to the supply of electricity, an emission factor relating to electricity consumption of 234 gCO
2/kWh [
33] was used. For natural gas, an emission factor of 202 gCO
2/kWh [
34] was used.
3. Results and Discussion
This section reports the results related to the self-consumption and self-sufficiency rates of buildings equipped with PV systems, the results related to the parametric analysis performed for the sizing of the heat pumps in Scenarios 3a–c and, finally, the results of the energy, economic and environmental analysis for all of the scenarios implemented.
Figure 9 shows the trends of the self-consumption rate and the self-sufficiency rate for the 17 users served by the district heating plant and equipped with a photovoltaic system on the roof. While the self-consumption rate is relatively high, there is a significant amount of surplus production in almost all users. This suggests that there is potential in terms of energy sharing within a renewable energy community. The self-sufficiency rate, on the other hand, settles at around 25–30%, suggesting that the PV installed is far from sufficient to cover all electricity needs in the area.
To define the design to be compared for Scenarios 3a–c, a parametric analysis was performed to identify the optimal size of the heat pump. The choice was based on the attempt to maximize the shared energy, the self-sufficiency and the net present value (NPV) of the investment. The shared energy refers to the excess electricity produced by the photovoltaic systems that is used by the heat pump.
Figure 10 shows the results for Scenario 3a, in which the heat pump runs for the whole day during the summer season. The 100 and 150 kW heat pumps are the only economically advantageous ones; therefore, for Scenario 3a, the 150 kW heat pump was considered, which has a slightly lower NPV than the 100 kW pump but higher self-consumption and self-sufficiency rates (9.5% and 35.8%, respectively).
Figure 11 shows the results for Scenario 3b, in which the heat pump can be used only during the summer season between 9:00 a.m. and 5:00 p.m. In this case, the 100 kW heat pump is chosen as the optimal size with an NPV of EUR 17,700 and self-consumption and self-sufficiency rates of 7% and 73.1%, respectively. The electrical surplus from photovoltaics is always fixed. As the size of the heat pump increases, the self-consumed energy grows more slowly than the absorbed electricity. Consequently, the self-sufficiency rate (given by the ratio between self-consumed energy and absorbed electricity) tends to become constant above 600 kW.
Based on the results obtained, a third analysis was carried out in which the heat pump operates only when the surplus production of the PV panels is greater than 25%, 50% and 75% of the heat delivered hourly by the heat pump in a hypothetical continuous operation (Scenario 3c). Three sizes of 100, 200 and 300 kW were analyzed.
Table 6 shows the results obtained, which show substantial improvements compared to the two previous cases. For this scenario, the 200 kW heat pump was therefore chosen, which works when the photovoltaic surplus is greater than 25% of the heat load supplied by the heat pump. Self-consumption and self-sufficiency rates of 12.6% and 97.3%, respectively, were achieved, with an NPV of EUR 32,387.
Figure 12 shows how the NPV calculated to evaluate the investment of heat pumps in Scenarios 3a–c varies with and without incentives for RECs. It is evident that the constitution of an energy community can lead to important economic benefits by making the investment convenient, thanks to the incentive for shared energy.
Figure 13 and
Figure 14 show a summary of the primary energy demand and a comparative analysis of the scenarios analyzed relative to the reference, Scenario 0. In Scenario 2, the installation of PV panels significantly affects the energy supplied by the electricity grid, with a reduction of 20.26%. Furthermore, in Scenario 3c, there is a reduction of 20.24% in the electricity supplied by the grid, despite the addition of a centralized 200 kW heat pump. This is because the surplus production of the PV systems is shared with the heat pump, minimizing withdrawal from the grid. Furthermore, in Scenarios 3a–3c, there is a reduction (albeit minimal) in fuel consumed, thanks to the installation of heat pumps with different operating profiles. In Scenario 1, there is a 13.21% reduction in electricity consumption, because the compression refrigeration units (which absorb electricity) have been replaced with absorption refrigeration units (which absorb thermal energy), with a consequent increase of 23.9% in fuel used.
Figure 15 and
Figure 16 show a summary of the CO
2 emissions of the entire network in the different scenarios analyzed and a comparative analysis of the scenarios relative to the reference scenario. In particular, there are promising results in all scenarios, except for Scenario 1, which does not envisage the installation of energy production plants from renewable sources but includes the replacement of compression refrigeration units with absorption refrigeration units that are powered by the thermal power plant, with a consequent increase in fuel used.
Finally,
Figure 17 and
Figure 18 focus on the system costs. The results show that Scenarios 2 and 3a–c all show a positive improvement compared to the reference scenario, although limited. However, an improvement in the NPV in Scenarios 3a–3c when compared to Scenario 2 can be noted. This is particularly clear in the case of Scenario 3c, where the NPV is almost twice as high as the one achieved in Scenario 2. This highlights the relevant potential of using excess heat from the PV systems to feed the local DHN, especially when incentives are available for energy communities.
Figure 18 also highlights the importance of the incentive for energy communities, which basically constitute the major contributor to the difference in the net economic results between Scenario 2 and Scenarios 3a–c.
The analysis of the impact of the CEC configuration can be conducted based on the breakdown of the economic performance in Scenarios 3a–c. In Scenario 2, the only profit goes to the owners of the PV panels, who receive about 40,000 EUR/y in compensation for the energy that they sell to the electricity grid. This value remains the same in Scenarios 3a–c, with the addition of the income generated by the incentive for shared energy in energy communities, which amounts to 7000 EUR/y, 4900 EUR/y and 9400 EUR/y in Scenarios 3a–c, respectively. While these provide a minor contribution to the overall system’s OPEX (in the range of 3,500,000 EUR/y for Scenarios 3a–3c), the results show that they allow, in combination with the installation of the centralized heat pump, an overall improvement in the NPV of the system.
The presented work opens up a few additional questions that need to be answered. The use of energy storage, both electric and thermal, should be investigated, together with the optimized control of the heat pumps, so as to further increase self-consumption and the incentive for shared energy. In addition, the potential of decentralized heat generation with heat pumps, to be combined with a system able to exchange energy in both directions, should be investigated and compared with the presented analysis. Finally, the potential of using façades for PV generation, as suggested in [
26], could be investigated.
4. Concluding Remarks
The recent attention on renewable and citizen energy communities, especially in the European Union, is expected to contribute to the necessary growth in the uptake of renewable energy generation, especially at the decentralized level.
In this study, the potential of using excess solar energy from local rooftop PV installations was tested to power a heat pump that can be used during the winter months to provide useful heat to the local district heating network. Related scenarios were compared with the existing network and with two relevant alternatives: one considering the use of absorption chillers for summer cooling to maximize the use of cogeneration units, and one considering the simple installation of PV panels with no heat pump. These scenarios were simulated and applied to the case of an existing DHN in Bologna, Italy.
From the results of the study, it can be concluded that the main improvement comes from installing PV panels on the rooftops of the community: this is the choice that, alone, generates the largest benefit in both economic (the calculated 20-year NPV is EUR 273,000) and environmental terms (emissions are reduced by 11% compared to the reference scenario). Furthermore, in this case study, the energy locally produced and self-consumed is relatively high (an average of approximately 70%) as a consequence of the high density of the neighborhood. This would not make it the optimal case for an energy community. Nevertheless, the results show that using heat pumps to provide part of the heat to the DHN increases the NPV from EUR 273,000 to EUR 398,000–521,000, depending on the scenario: this is partly due to the increased conversion efficiency but also to the net additional income (4900 EUR/y–9400 EUR/y) generated by the incentives for energy communities.
This work shows how the establishment of an energy community makes it convenient to invest in heat pumps with a view to decarbonizing the DHN, making the most of the incentive tariff on energy shared within the community.
In this study, the application of CECs to DHNs was analyzed in a relatively simple, simulation-based manner. Future developments will include efforts towards an optimization-based approach, both for the system’s design and operations and for additional technologies, such as for storage.


 ,
, 


