Abstract
A ground natural gas leaking event at the Fuling shale gas field is reported in this paper. Thirteen leakage spots were discovered in two places near the SW-1 and SW-2 drilling wells. The biggest leak rate was above 1000 m3 per day, and no H2S was identified in any of the 13 leaking spots, according to the field study. The chemical components, carbon isotope properties of the leaking gases, and the geological context of the leaking location were researched in order to determine the reason for the leaking incident. From the geological conditions, the Shimen 1# fault belt cuts the whole strata from bottom to top, according to seismic reverse time migration (RTM), and the fault and leaking spots are located in the range of the surface projection of the horizontal section of the adjacent shale gas well. The fracture development evaluation shows that the Wufeng–Longmaxi Formation, which is also the producing layer of the Fuling shale gas field, has a very high possibility of fracture development. From the geochemical view, the carbon isotope of the leaking gases lies in the range of the Wufeng–Longmaxi Formation, showing that the Wufeng–Longmaxi Formation is the gas source of the leaking gas.
1. Introduction
The development of shale gas has expanded in the past few decades with the advancement in hydraulic fracturing technology and improvements in horizontal well drilling [1]. The successful production of shale gas has drastically altered the global energy landscape and has the potential to significantly reduce global energy shortages. Shale gas has also been touted as a way to reduce air pollution and the greenhouse effect. However, with a growing understanding of shale gas, possible negative externalities of shale gas development, such as a large greenhouse gas footprint, effects on groundwater quality, and hydraulic fracturing-induced earthquakes have been observed and received much public attention. Recent reports show that the GHG (greenhouse gas) footprint of shale gas is much bigger than that of conventional gas, due to methane emissions during well completion [2,3,4]. The development of shale gas has the potential to degrade the groundwater quality [1,5,6]. Sharp increases in the rate of earthquakes as a result of hydraulic fracturing have also been reported in recent years [7,8,9]. China, as the country with the world’s largest shale gas reserves, is eager to explore and develop shale gas to alleviate energy shortages and pollution [10,11]. China’s shale gas development has accelerated dramatically in the last decade [11,12]. In 2018, China’s shale gas output surpassed 10 billion cubic meters [10]. However, the public has expressed worries about the safety of shale gas production. Because air pollutants and greenhouse gas (GHG) emissions connected with shale gas extraction have the potential to degrade local air quality and contribute to global warming, the conversation has switched to this topic [10,13].
The Fuling shale gas field in China is the country’s first big commercially produced shale gas field [14]. Until the end of 2018, the Fuling shale gas field’s cumulative output topped 140,108 m3 [15]. Accompanied by the rapid development, some risks have evolved as a result of the fast expansion of shale gas production in the Fuling shale gas region. In 2016, an accident of ground natural gas leaking in the Fuling shale gas field was reported. This accident is quite different from the potential negative externalities of shale gas development discussed in previous research but has more direct and distinct impacts on the safety of the community. To reveal the cause of the incident and explore the association of the incident with the development of the Fuling shale gas field, investigations on geological and chemical aspects should be carried out, respectively. First, the geological conditions should be clarified. Previous research shows that hydraulic fracturing is unlikely to create conductive fractures on the surface. However, damaged casing and flawed cementing could lead to natural gas leaking into the shallow ground, and the faults near the hydraulic fracturing points may also provide the migration channel to the ground [16]. Second, the origin of the leaking gas should be identified. The chemical components and the carbon isotope characteristics are usually applied to identify the origin of the shale gas. The Fuling shale gas has a very high methane content (more than 95.0%), a low value of wetness (less than 0.8%), and a high value of dryness (greater than 100) [17,18,19]. The carbon isotope analyses showed that the δ13 C values of the Fuling shale gas field range from −29.2‰ and −30.5‰ and apparently have a reverse feature of [20]. It is also found that the kerogen types of the Fuling shale gas is mainly type I, and some type II.
In this paper, field surveys and laboratory studies are being conducted to determine the geological conditions of the leaking area, the geochemical characteristics, and the origin of the leaking gas. The purpose of this study is to (1) clarify the origin of the leaking gas, and (2) reveal the relationship between the leakage accident and the shale gas development.
2. Background
2.1. A Brief Description of the Leaking Accident
The leakage incident was originally reported in Yuelai village, Chongqing, China, on 23 December 2016. In two places near the platform of the Fuling shale gas field’s SW-1 well, 13 leakage spots were discovered. The first location, which covers around 200 m2, has nine leaking locations, while the second, which covers a lesser area, has four. The shortest distance between the first location’s leaking sites and the platform of the SW-1 well is around 260 m. The second position is around 500 m from the first. Between the initial location and the platform of the SW-1 well is a deep ditch with a depth of more than 100 m. The leaking spots’ coordinates and elevations are listed in Table 1.

Table 1.
The coordinates and altitude in the leakage area.
The leaking spots in the first location have all been lit. The flame of the leaking site with the highest leaking rate (LKP-3) was over 1.0 m high, and almost 1000 m3 of shale gas was emitted into the atmosphere every day. The other eight leaking spots had substantially lower leak rates than this one. The second zone’s leaking points have not been ignited. The presence of methane at these locations was discovered. LKP-12 and LKP-13 had 4.2 percent and 0.14 percent methane, respectively, with no H2S measured at these two locations.
On 23 December 2016, the leaking incident was initially disclosed. After that, an investigative committee was formed, and a field survey revealed that the first leaking site emerged on 19 December 2016, followed by additional eight leaking locations in the following two days. The leaking event was initially thought to be unrelated to the Fuling shale gas development; thus, the surrounding platforms’ advancements were investigated. Near the leaking spots, there are two platforms labeled ‘SW-1’ and ‘SW-2,’ with distances of roughly 260 m and 4 km, respectively, from the leaking points to the platforms. The drilling of the platform SW-1 began in March 2014 and was completed in May 2014. Hydraulic fracturing of SW-1 was conducted in October and November of 2014, and gas production began in February of 2015. While drilling for SW-2 began in June 2014 and was completed in August of that year. SW-2’s hydraulic fracture date was the same as SW-1’s, and the gas production date was one month later.
The volumes of fracturing in the SW-1 and SW-2 platforms were 28,000 m3 and 30,000 m3, respectively, and the fracturing sand used was roughly 900 tons and 1000 tons, respectively. The SW-2 has a wellhead pressure of 18 to 19 MPa, which is the same as the SW-1. There were no unexpected pressure fluctuations noted during the process. The underground pressure was not monitored. The length of the horizontally hydraulic fractured well is about 1000 m to 1300 m.
The developing history of SW-1 and SW-2 wells shows that the leaking incident happened nearly two years after the operation of the wells, which means the leaking incident is temporally possibly caused by the development of hydraulic fracturing. The locations of the leaking points are in the range of the surface projection of the horizontal section of the SW-1 well, so that the leaking incident is geographically possible relating to the shale gas development.
2.2. Geological Background
The Fuling gas field lies in the southeast of the Sichuan Basin (Figure 1). The geological structure of the Fuling gas field is a diamond faulted anticline in the East Sichuan fault–fold belt, and its burial depths are higher in the northeast while lower in the southwest. Two groups of faults trending in the east-north direction and nearly north-south direction are surrounding the Fuling gas field.
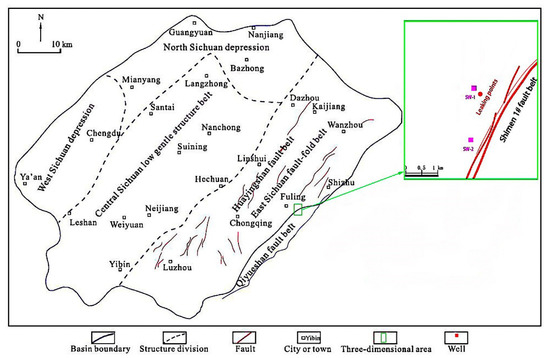
Figure 1.
Locations of the shale gas wells and the leaking points in Fuling area (modified from Qin et al. [21]).
The outcrops of the Fuling shale gas field are mainly near the Feixianguan formation. The production layer of the Fuling area is the high-quality shales, lithostratigraphically dominated by black carbonaceous shale, siliceous shale, and carbonaceous mudstone, in the Upper Ordovician Wufeng and Lower Silurian Longmaxi formations with the thickness ranging from 60–150 m.
3. Investigation Methods
To reveal the cause of the leaking accident, a thorough comprehension of the stratigraphic distribution and the existence of faults is necessary. In this study, reverse time migration (RTM) was used to investigate the stratigraphic distribution and fault characteristics of the leaking area. As one of the most vigorous methods to map the subsurface structures, reverse time migration (RTM) can efficiently locate seismic and acoustic sources by the means of numerical wave-field modeling. This method basically has three steps, the forward propagation of source wave fields, the backward propagation of receiver wave fields, and the reconstruction of a focused image using the imaging condition [22].
The origin of the leaking gases was also studied in this study. Seven samples were collected, including three samples from the leaking points and four samples from the shale gas wells SW-1 and SW-2 near the leaking points. The method used to collect the leaking gas is shown in Figure 2. A plastic pipe was placed on the leaking point and sealed by a pile of earth. The chemical compositions and carbon isotopic characteristics of the collected hydrocarbon samples were tested and analyzed. An Agilent 6890 N gas chromatograph (GC) equipped with a flame ionization detector and a thermal conductivity detector was used to measure the chemical compositions of the leaking gas samples and the shale gas samples. A Trace GC ULTRA-MAT 253 IRMS was used to measure the stable carbon isotope values.
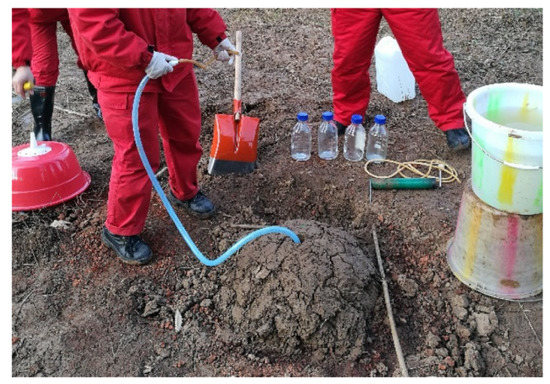
Figure 2.
The method used to collect the leaking gas.
4. Results
4.1. RIM Results Tectonic Characteristics
Figure 3 presents the seismic reverse time migration (RTM) results. The RTM survey profile passes through the SW-1 platform, the leaking area, and the Shimen 1# fault belt. The seismic RTM result shows that the main formations, i.e., Longtan formation, Liangshan formation, and Wufeng formation, are continuous, while the phase of the outcropped Feixianguan formation is discontinuous. The existence of minor faults is uncertain in the Feixianguan formation. The Shimen 1# fault cuts the whole stratum from the bottom to the top, and the F1 fault, an associated fault of the Shimen 1# fault, only cuts the Liangshan formation and above. The well SW-1 is about 1100 m away from the Shimen 1# fault in the main production layer of Wufeng formation, is about 960 m away from the F1 minor fault in Feixianguan formation, and is about 960 m away from the leaking area. Since the horizontal fractured walls have a length between 1000 and 1300 m, the faults and the leaking points are in the range of the surface projection of the horizontal section of the adjacent shale gas well.
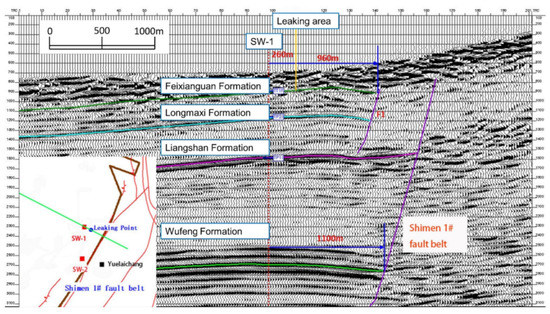
Figure 3.
Reverse time migration (RTM) analysis of the leaking area.
4.2. Chemical Composition
Table 2 gives the chemical composition of the gas samples. The samples named ‘LKP-x’ were collected from the leaking points. The samples collected from drilling platforms (SW-1, SW-2) near the leaking points (indicated in Figure 3) were labeled as ‘SW-X-X’. The results referring to previous research were labeled the same as the original paper. All of the samples presented in Table 2 are from the Fuling shale gas field. The distances between the leaking points and drilling platforms SW-1 and SW-2 are approximately 260 m and 4 km, respectively, while other wells in Table 2 are much further away. The dominant component of the gases from the drilling wells and the leaking points is methane. The methane content of natural gas from the drilling wells near the leaking points (SW-1, SW-2) is between 98.32% and 98.87%, with an average of 98.64%, and lies in the methane content of natural gas from the previous results (ranging from 97.89% to 98.89% with an average of 98.55%). The methane content of gases from the leaking points, is much lower than that of natural gas from the Fuling shale gas fields, ranging from 85.59% to 87.05% with an average of 86.42%. On the contrary, the ethane content of gases from the leaking points is larger than that of natural gas from wells near the leaking point. The ethane content of gases from the leaking points is between 1.06% and 1.86% with an average of 1.34%, while the ethane content of natural gas from the wells in the Fuling shale gas field is between 0.52% and 0.75%, with an average of 0.65%. The nonhydrocarbon is mainly CO2, and samples from the leaking points have a very high CO2 content, ranging from 11.53% to 12.99%, while the CO2 content of samples from the drilling wells in the Fuling shale gas field is much lower and is no more than 0.4%.
Table 2.
Components and the stable carbon of the natural gas in the leakage area.
4.3. Carbon Isotopic Composition
The methane carbon isotope of the leaking gases is between −30.5‰ and −30.3‰ with an average of −30.3‰, while the ethane carbon isotope of the leaking gases ranges from −35.8‰ to −35.3‰ with an average of −35.3‰. The δ13C1 value of gas samples from the Fuling shale gas field ranges from −32.2‰ to −29.5‰ with an average of −31.09‰, and the δ13C2 value varies from −36.5‰ to −34.7‰ with an average of 35.79%. Basically, the carbon isotope of the leaking gases lies in the range of the Fuling shale gas field.
The value of δ13CO2 of the leaking gases ranges from −31.0‰ to −26.3‰ with an average of −28.0‰. However, the value of δ13CO2 in the previously reported results of the Fuling area [17,18,24,25,26,27,28] was distributed in a wide range, from −22.54‰ to 8.0‰.
5. Discussion
In order to explore the cause of the natural gas leaking accident, the origin of the leaking gas must be identified first. However, the source and geneses of natural gas may be very complex due to the small molecules of natural gas, which are easy to transform and mix in the reservoir. To identify the genetic type of natural gas, a combination consideration of the chemical components, the carbon isotope characteristics, and the geological setting is necessary [29].
Figure 4 presents the relationship between δ13C1 and δ13C2 of the leaking gas samples, and the results of gas samples of wells SW-1 and SW-2 and previous research were also plotted for comparison. The plot of δ13C1 -δ13C2 is usually used to identify if the gas sample is an oil-type gas or a coal-formed gas. As shown in Figure 4, the carbon isotope values of the leaking gases fall in zone III with mixed reversed gas, which corresponds with wells near the leaking points and wells of the Fuling shale gas field of previous research. The origin of the nonhydrocarbon gas is another piece of evidence to identify the origin of the leaking gases. In this study, the source of CO2 of the leaking gas is investigated and compared with the results of the Fuling shale gas. As shown in Figure 5, previous studies show that the genesis of the shale gas in the Fuling area can be divided into three types: thermogenic, abiogenic, and biogenic origin [18], while the leaking gas is thermogenic. It is also found that the value of δ13CO2 of the leaking gas is lower than previous results.
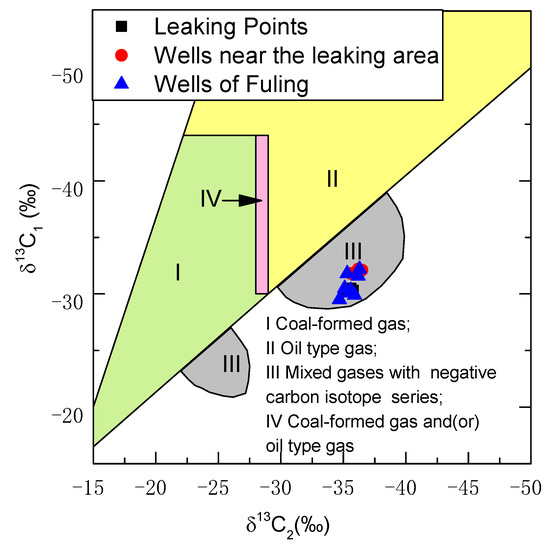
Figure 4.
Plot for gases from the leaking points and from wells of Fuling shale gas field (data sources: refs. [17,18,23,24]).
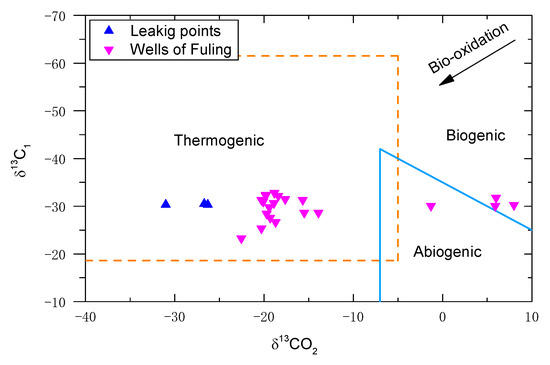
Figure 5.
Comparison of the source of CO2 between the samples of the leaking points and the samples of the wells of Fuling shale gas field (modified from Xin et al. [18] and Kotarba et al. [30]) (data sources: refs. [17,24,26,27,28]).
Previous explorations in the Sichuan basin show that six sets of source rocks are found in this area: the Upper Triassic series, the Upper Permian series, the Mid-Lower Permian series, and the Lower Silurian series [20]. According to the carbon isotope analyses of source rocks in the Sichuan Basin, the gases of the leaking points only fall in the Lower Silurian series, which is also the production formation of the Fuling shale gas field [31]. The RTM results also support this conjecture (Figure 3). The Shimen 1# fault belt, which cut the whole stratum, may provide passage for the leaking gas. The development of associated faults in the shallow formations, and the discontinuity of the Wufeng formation make it possible for the gas to escape from the leaking area. For further study of the possibility of the gas leaking from the Wufeng formation, the fracture development was investigated. A fracture development evaluation model proposed by Hou et al. [32] based on the fracture porosity was applied.
The model can be written as follows
where and are productions of wells in a fractured–micro-fractured zone and a non-fractured zone, respectively, is the fracture porosity (%), and a and b are the empirical coefficients equal to 0.7595 and 0.9963 [32], respectively.
According to previous experimental results [33], the fracture porosity of the WL shale ranges from 0.3% to 3.3% with an average value of 1.3%. The is in a range of 1.0647 and 9.2767 with an average value of 2.2799, which means the development of a high fracture is a possibility in the WL shale.
As discussed in Section 4.2, the chemical components of the leaking gas are quite different from the Fuling shale gas. To demonstrate the difference, the Bernard diagram and the plot of are presented to identify the genetic characteristics of the gas samples [19,34]. As shown in Figure 6a, different types of gases are mainly located between the type II and type III kerogen area, and the gases of the leaking points are much closer to the type III kerogen area. However, in the plot of , the gases of the leaking points fall in the border area of coal-derived gas and oil-cracked gas, and the gases of the Fuling shale gas field lie in the oil crack area, as shown in Figure 6b. According to the carbon isotopic characteristics and the geological analyses, it is inferred that the leaking gas comes from the Wufeng–Longmaxi Formation.
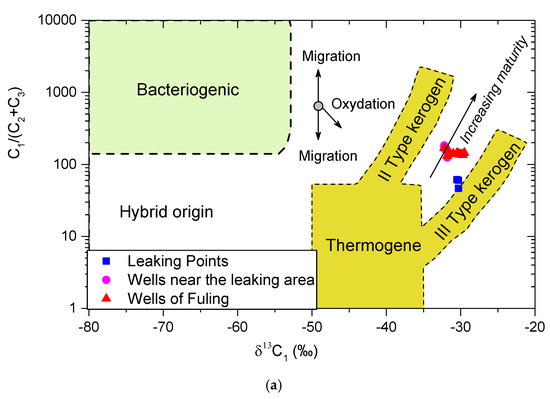
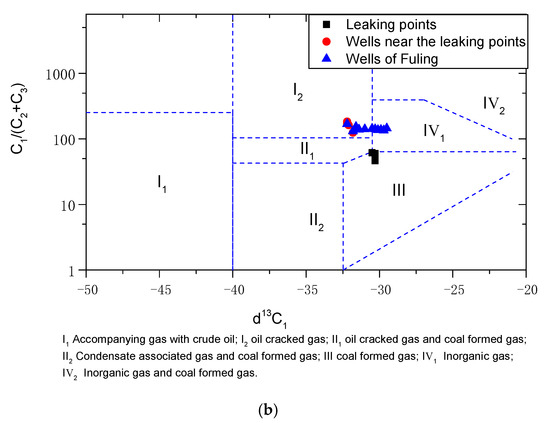
Figure 6.
(a) Bernard diagram and (b) plot of - for gases from the leaking points and gases from wells of Fuling shale gas field (data sources: refs. [24,25,27,28]).
6. Control of Gas Leak
The development of shale gas has greatly mitigated the tightness of the energy supply and fundamentally altered the world’s energy structure. However, as shale gas extraction has progressed, issues such as water contamination, gas leaks, and earthquakes brought on by hydraulic fracturing have become more and more prominent. Among these issues, the gas leak directly poses a risk to the safety of human life and property. The following steps may be performed to control the gas leak:
- (1)
- The choice of the venue is crucial. Prior to site selection, a comprehensive geological study should be conducted, and places with faults and other sorts of discontinuities should be avoided.
- (2)
- To boost output and lessen the impact of shale gas development, new hydraulic fracturing technologies should be developed and used.
- (3)
- Another critical challenge in controlling shale gas leaks is the advancement in well cementation. Damage to the well casing is a common cause of gas leak accidents. In well cement, the use of novel materials, technologies, and procedures is anticipated.
- (4)
- To avoid the gas leak incident, a comprehensive monitoring system would be quite beneficial.
7. Conclusions
This paper describes a natural gas leakage accident in the Fuling shale gas field. The geological environment, chemical components, and carbon isotopic features are all explored in relation to the origin of this accident. The main conclusions can be drawn as follows:
- (1)
- Analyses of the chronological order and spatial distance of the shale gas development and the leak incident show that it is temporally and spatially possible that the shale gas development results in the leak incident.
- (2)
- The seismic reverse time migration (RTM) result shows that there are two faults near the SW-1 well, and one of the faults, named Shimen 1#, cuts the whole stratum from the bottom to the top. Moreover, the phase of the outcropped Feixianguan formation is discontinuous and illustrates the possibility of the existence of minor faults in the Feixianguan formation, which can provide the channel for the leaking shale gas.
- (3)
- According to the investigation into the source of the accident, the leaking gas’ carbon isotope characteristics are identical to those of the shale gas from the Wufeng–Longmaxi Formation, which is also the Fuling shale gas field’s producing layer, showing that the Wufeng–Longmaxi Formation is the gas source the the leaking gas.
Author Contributions
Conceptualization, Y.Z. and H.M.; methodology, Z.Z.; software, Y.L.; validation, Y.Z., H.M. and S.J.; writing—original draft preparation, Y.Z.; writing—review and editing, H.M.; visualization, S.J.; project administration, Y.Z.; funding acquisition, Y.Z. All authors have read and agreed to the published version of the manuscript.
Funding
This research was funded by the Special Project on Performance Incentive Guidance of Chongqing Scientific Research Institution, grant number cstc2021jxj190001; the Key Technology Research and Application of Deep Shale Gas Green Development in Western Chongqing area, grant number cstc2019jxj190002, and by the Special Project on Performance Incentive Guidance of Chongqing Scientific Research Institution, grant number cstc2018jxj190003.
Institutional Review Board Statement
Not applicable.
Informed Consent Statement
Not applicable.
Data Availability Statement
Not applicable.
Conflicts of Interest
The authors declare no conflict of interest.
References
- Olmstead, S.M.; Muehlenbachs, L.A.; Shih, J.-S.; Chu, Z.; Krupnick, A.J. Shale gas development impacts on surface water quality in Pennsylvania. Proc. Natl. Acad. Sci. USA 2013, 110, 4962–4967. [Google Scholar] [CrossRef] [PubMed]
- Grieve, P.L.; Hynek, S.A.; Heilweil, V.; Sowers, T.; Llewellyn, G.; Yoxtheimer, D.; Solomon, D.K.; Brantley, S.L. Using environmental tracers and modelling to identify natural and gas well-induced emissions of methane into streams. Appl. Geochem. 2018, 91, 107–121. [Google Scholar] [CrossRef]
- Howarth, R.W.; Santoro, R.; Ingraffea, A. Methane and the greenhouse-gas footprint of natural gas from shale formations. Clim. Chang. 2011, 106, 679. [Google Scholar] [CrossRef]
- Howarth, R.W.; Santoro, R.; Ingraffea, A. Venting and leaking of methane from shale gas development: Response to Cathles et al. Clim. Chang. 2012, 113, 537–549. [Google Scholar] [CrossRef]
- Vandecasteele, I.; Rivero, I.M.; Sala, S.; Baranzelli, C.; Barranco, R.; Batelaan, O.; Lavalle, C. Impact of shale gas development on water resources: A case study in northern Poland. Environ. Manag. 2015, 55, 1285–1299. [Google Scholar] [CrossRef] [PubMed]
- Warner, N.R.; Christie, C.A.; Jackson, R.B.; Vengosh, A. Impacts of shale gas wastewater disposal on water quality in western Pennsylvania. Environ. Sci. Technol. 2013, 47, 11849–11857. [Google Scholar] [CrossRef] [PubMed]
- Ellsworth, W.L. Injection-induced earthquakes. Science 2013, 341, 1225942. [Google Scholar] [CrossRef]
- Ghofrani, H.; Atkinson, G.M. A preliminary statistical model for hydraulic fracture-induced seismicity in the Western Canada Sedimentary basin. Geophys. Res. Lett. 2016, 43, 10,164–10,172. [Google Scholar] [CrossRef]
- Holland, A.A. Earthquakes triggered by hydraulic fracturing in south-central Oklahoma. Bull. Seismol. Soc. Am. 2013, 103, 1784–1792. [Google Scholar] [CrossRef]
- Li, X.; Mao, H.; Ma, Y.; Wang, B.; Liu, W.; Xu, W. Life cycle greenhouse gas emissions of China shale gas. Resour. Conserv. Recycl. 2020, 152, 104518. [Google Scholar] [CrossRef]
- Zhang, Y.; Wang, H.; Han, Y.; Wang, D.; Zhu, G.; Lu, X. Shale gas development in China: Implications for indoor and outdoor air quality and greenhouse gas emissions. Environ. Int. 2020, 141, 105727. [Google Scholar] [CrossRef] [PubMed]
- Guo, M.; Lu, X.; Nielsen, C.P.; McElroy, M.B.; Shi, W.; Chen, Y.; Xu, Y. Prospects for shale gas production in China: Implications for water demand. Renew. Sustain. Energy Rev. 2016, 66, 742–750. [Google Scholar] [CrossRef]
- Ma, Z.; Pang, Y.; Zhang, D.; Zhang, Y. Measuring the air pollution cost of shale gas development in China. Energy Environ. 2019, 31, 1098–1111. [Google Scholar] [CrossRef]
- Xusheng, G.; Dongfeng, H.; Yuping, L.; Zhihong, W.; Xiangfeng, W.; Zhujiang, L. Geological factors controlling shale gas enrichment and high production in Fuling shale gas field. Pet. Explor. Dev. 2017, 44, 513–523. [Google Scholar]
- Guo, X.; Li, Y.; Li, J.; Feng, M.; Duan, H. Discovery of Fuling Shale Gas Field and its prospects. Front. Energy 2019, 13, 354–366. [Google Scholar] [CrossRef]
- Zhang, D.; Yang, T. Environmental impacts of hydraulic fracturing in shale gas development in the United States. Pet. Explor. Dev. 2015, 42, 876–883. [Google Scholar] [CrossRef]
- Wu, W.; Fang, C.C.; Dong, D.Z.; Liu, D. Shale gas geochemical anomalies and gas source identification. Acta Pet. Sin. 2015, 36, 1332–1340. [Google Scholar]
- Xin, C.; Chen, L.; Guo, X.; Wang, C. Geochemical Characteristics of Shale Gas in the Silurian Longmaxi Formation, Jiaoshiba Area, Southeast Sichuan Basin, China. Energy Fuels 2019, 33, 8045–8054. [Google Scholar] [CrossRef]
- Zhong, C.; Qin, Q.; Fan, C.; Hu, D. Geochemical characteristics of shale gas and its response to thermal maturity (Ro) in the Longmaxi formation, Dingshan area, Southeast Sichuan. Pet. Sci. Technol. 2019, 37, 1270–1278. [Google Scholar] [CrossRef]
- Yang, R.; He, S.; Hu, Q.; Hu, D.; Yi, J. Geochemical characteristics and origin of natural gas from Wufeng-Longmaxi shales of the Fuling gas field, Sichuan Basin (China). Int. J. Coal Geol. 2017, 171, 1–11. [Google Scholar] [CrossRef]
- Qin, H.; Fan, X.; Liu, M.; Hao, J.; Liang, B. Carbon isotope reversal of desorbed gas in Longmaxi shale of Jiaoshiba area, Sicuhan Basin. Pet. Res. 2017, 2, 169–177. [Google Scholar] [CrossRef]
- Liu, H.; Long, Z.; Tian, B.; Han, F.; Fang, G.; Liu, Q.H. Two-dimensional reverse-time migration applied to GPR with a 3-D-to-2-D data conversion. IEEE J. Sel. Top. Appl. Earth Obs. Remote Sens. 2017, 10, 4313–4320. [Google Scholar] [CrossRef]
- Dai, J.; Zou, C.; Dong, D.; Ni, Y.; Wu, W.; Gong, D.; Wang, Y.; Huang, S.; Huang, J.; Fang, C. Geochemical characteristics of marine and terrestrial shale gas in China. Mar. Pet. Geol. 2016, 76, 444–463. [Google Scholar] [CrossRef]
- Wu, W.; Shi, X.; Liu, J.; Li, D.; Xie, J.; Zhao, S.; Ji, C.; Hu, Y.; Guo, Y. Accumulation conditions and exploration potential of Wufeng-Longmaxi Formations shale gas in Wuxi area, Northeastern Sichuan Basin, China. J. Nat. Gas Geosci. 2017, 2, 263–271. [Google Scholar] [CrossRef]
- Dai, J.; Zou, C.; Liao, S.; Dong, D.; Ni, Y.; Huang, J.; Wu, W.; Gong, D.; Huang, S.; Hu, G. Geochemistry of the extremely high thermal maturity Longmaxi shale gas, southern Sichuan Basin. Org. Geochem. 2014, 74, 3–12. [Google Scholar] [CrossRef]
- Wu, W.; Huang, S.P.; Hu, G.; Gong, D.Y. A comparison between shale gas and conventional gas on geochemical characteristics in Weiyuan area. Nat. Gas Geosci. 2014, 25, 1994–2002. [Google Scholar]
- Wu, W.; Luo, C.; Zhang, J.; Liu, W.P. Evolution law and genesis of ethane carbon isotope of oil type gas. Acta Pet. Sin. 2016, 37, 1463–1471. [Google Scholar]
- Ziqi, F.; Dan, L.I.U.; Huang, S.; Wei, W.U.; Dazhong, D.; Weilong, P. Carbon isotopic composition of shale gas in the Silurian Longmaxi Formation of the Changning area, Sichuan Basin. Pet. Explor. Dev. 2016, 43, 769–777. [Google Scholar]
- Wan, Z.; Shi, Q.; Guo, F.; Zhong, Y.; Xia, B. Gases in Southern Junggar Basin mud volcanoes: Chemical composition, stable carbon isotopes, and gas origin. J. Nat. Gas Sci. Eng. 2013, 14, 108–115. [Google Scholar] [CrossRef]
- Kotarba, M.J.; Nagao, K. Composition and origin of natural gases accumulated in the Polish and Ukrainian parts of the Carpathian region: Gaseous hydrocarbons, noble gases, carbon dioxide and nitrogen. Chem. Geol. 2008, 255, 426–438. [Google Scholar] [CrossRef]
- Wei, X.; Guo, T.; Liu, R. Geochemical features and genesis of shale gas in the Jiaoshiba block of Fuling Shale Gas Field, Chongqing, China. J. Nat. Gas Geosci. 2016, 1, 361–371. [Google Scholar] [CrossRef]
- Hou, L.; Zou, C.; Yu, Z.; Luo, X.; Wu, S.; Zhao, Z.; Lin, S.; Yang, Z.; Zhang, L.; Wen, D.; et al. Quantitative assessment of the sweet spot in marine shale oil and gas based on geology, engineering, and economics: A case study from the Eagle Ford Shale, USA. Energy Strategy Rev. 2021, 38, 100713. [Google Scholar] [CrossRef]
- Wang, Y.; Huang, J.; Li, X.; Dong, D.; Wang, S.; Guan, Q. Quantitative characterization of fractures and pores in shale beds of the Lower Silurian, Longmaxi Formation, Sichuan Basin. Nat. Gas Ind. B 2015, 2, 481–488. [Google Scholar] [CrossRef][Green Version]
- Bernard, B.B.; Brooks, J.M.; Sackett, W.M. Light hydrocarbons in recent Texas continental shelf and slope sediments. J. Geophys. Res. Ocean. 1978, 83, 4053–4061. [Google Scholar] [CrossRef]


Publisher’s Note: MDPI stays neutral with regard to jurisdictional claims in published maps and institutional affiliations. |
© 2022 by the authors. Licensee MDPI, Basel, Switzerland. This article is an open access article distributed under the terms and conditions of the Creative Commons Attribution (CC BY) license (https://creativecommons.org/licenses/by/4.0/).