Article

Coupled FEM and CFD Modeling of Structure Deformation and Performance of PEMFC Considering the Effects of Membrane Water Content

State Key Laboratory of Engines, Tianjin University, Tianjin 300350, China
*
Author to whom correspondence should be addressed.
These authors contributed equally to this work.
Energies 2022, 15(15), 5319; https://doi.org/10.3390/en15155319
Submission received: 22 June 2022 / Revised: 10 July 2022 / Accepted: 11 July 2022 / Published: 22 July 2022
(This article belongs to the Special Issue Advanced Research on Fuel Cells and Hydrogen Energy Conversion)

Abstract

:
Based on a coupled finite element method (FEM) and computational fluid dynamics (CFD) model, the structural deformation and performance of a proton exchange membrane fuel cell (PEMFC) under different membrane water contents are studied. The water absorption behavior of the membrane is investigated experimentally to obtain its expansion coefficient with water content, and the Young’s modulus of the membrane and catalyst (CL) are obtained through a tensile experiment. The simulation results show that the deformation of the membrane increases with water content, and membrane swelling under the channel is larger than that under the rib, forming a surface bump under the channel. The structural changes caused by the membrane water content have little effect on the performance of PEMFC in the low-current density range; while its influence is significant in the medium- and high-current density range. A medium membrane water content value of 12 achieves the best fuel cell performance due to the balance of membrane resistance and mass transport.

1. Introduction

Proton exchange membrane fuel cells (PEMFCs) have proven to be one of the most promising energy conversion devices due to their high efficiency and low operating temperature [1,2,3,4,5]. Although the current fuel cell technology has made great progress, there are still some problems with durability and performance. PEMFCs are affected by operating conditions and assembly forces during operation, which can lead to structural deformation of the membrane and porous electrodes, thereby affecting the transport process and performance of PEMFCs [6,7,8]. Therefore, it is necessary to establish a PEMFC model that couples structural deformation and mass transfer to comprehensively reflect the influence of fuel cell structural deformation on cell performance.
Due to its importance, many researchers have carried out experimental and simulation studies on the structural deformation and performance of fuel cells under assembly pressure. Toghyani et al. [9] found that the assembly pressure reduced the porosity of the gas diffusion layer (GDL); thus, the transfer rate of the reactant gas through the GDL decreased, which negatively affected the performance of PEMFC. Especially at high current densities, the assembly pressure had a significant effect on the ohmic loss and concentration loss of PEMFC. Zhang et al. [10] studied the mechanical behavior of PEMFC carbon paper GDL considering the complex contact environment in the layered structure of GDL fibers. The results showed that with the increase in applied pressure, the average porosity of the carbon paper decreased, and the inhomogeneity of the porosity along the in-plane direction increased. In addition, they further gave a rational explanation for the increase in concentration loss and the decrease in ohmic loss when the GDL was pressurized based on the results of the microstructure study. Li et al. [11] investigated the effect of different assembly pressures on the non-uniform deformation of PEMFC and the effect of GDL deformation on the mass transfer characteristics (local distribution of oxygen), the conductivity characteristics (local distribution of current density), and the overall performance of PEMFC (cell polarization curve and net power density) due to the deformation using numerical simulations. The results indicated that the assembly pressure should be selected in the range of 0.5–1.5 MPa to achieve good cell performance, and the cell performance was maximized at the assembly pressure of 1.0 MPa.
The GDL deformation by assembly pressure has been extensively studied by researchers. While the membrane deformation by assembly pressure is small compared with the GDL due to higher elastic modulus, the membrane property can change greatly at different hydration levels. The hydration/dehydration caused by water production/drainage in PEMFC can cause physical and dimensional changes in the membrane, which has a great impact on the performance of PEMFC. Zhang et al. [12] described the structural evolution of Nafion with water content, and in dehydrated Nafion, the dry cluster diameters were significantly smaller than the cluster spacing, which explained the extremely low ionic conductivity in the anhydrous state. Woo et al. [13] found that functionalized seafoam with fluorine groups contributed to its dispersion in composite films. Such composite films exhibited higher water absorption, thermomechanical and chemical stability, and proton conductivity with a reduced swelling rate. Zhong et al. [14] found by in situ experiments that the structure of the membrane electrode assembly (MEA) was damaged due to the presence of stresses and cracks, which were formed at the interface between the membrane and the CL, resulting in catalyst loss and agglomeration, and even delamination of the CL. The aforementioned structural changes led to a decrease in catalyst activity and an increase in cell resistance, which eventually led to degradation of output performance. Yoon et al. [15] found that operating conditions such as relative humidity (RH) and current density changed the stress distribution within the membrane by modeling the viscoelasticity of the membrane, and gas transport characteristics and current density were influenced significantly by the degree of cell compression.
Changes in inlet gas RH and flow rate can result in different water distributions within the membrane. As mentioned earlier, the degree of hydration has a great influence on the mechanical and physical properties of the membrane, such as proton conductivity and expansion rate. Li et al. [16] performed RH cycling tests in fuel cell hardware without electrochemical reactions and found that hydrothermal stress alone could cause gas crossover failure of the membrane. They found a linear relationship between hydrothermal expansion and water content, and the overall slope of the stress–strain curve decreased with water content during humidification and immersion in liquid water. Khattra et al. [17] investigated the effects of constant RH holding time, humidified air feed rate, and water absorption rate in the membrane on the membrane stress response. It was found that although a longer holding time under high and low humidity conditions would lead to redistribution of the stress, the redistribution and reduction of stress values during hydration and inelastic deformation eventually led to the development of residual tensile stress after dehydration, while tension stresses around 9–10 MPa might lead to mechanical degradation of the membrane. A subsequent study [18] found that the different water uptake behavior of the membrane had a significant effect on the membrane stress and thus might affect the lifetime of the membrane.
Therefore, the membrane and CL deformation influenced by water content should be considered in the numerical simulation of PEMFC to more accurately reflect the structure deformation and stress concentration. There are some simulation works considering the influence of gas inlet RH on the membrane deformation, but it should be pointed out that in the actual operation of PEMFC, it takes a long time for the membrane to reach water equilibrium, and the environment of the membrane in PEMFC is quite different from a membrane directly exposed to the humidified gas. The membrane expansion ratio measured at a certain gas RH (in equilibrium state) does not truly reflect that of the membrane in PEMFC operated under some gas inlet RH, while almost all the previous simulation studies treated them equally. A rational way needs to needs to develop a correlation between the membrane expansion ratio and membrane water content, rather than the gas RH, in the simulation of membrane deformation. Moreover, the deformation of the membrane and CL should also be considered in the computational fluid dynamics (CFD) model for more accurately simulating the mass transport and performance of PEMFC.
In this study, the membrane expansion coefficient at different water contents and the membrane Young’s modulus are experimentally obtained, which are applied to the deformation model of PEMFC by the finite element method (FEM). The PEMFC deformations including the deformations of membrane and CL obtained by the FEM model are extracted and input into a CFD model of PEMFC to investigate their effects on the mass transport and performance of PEMFC, and different models are compared to stress the significant impact of membrane expansion, and the effects of the membrane water contents are analyzed.

2. Methods

The numerical simulations are carried out based on a coupled FEM and CFD model. The FEM model is used to calculate the MEA deformation and stress distribution using the measured membrane and CL properties, and then the deformed geometric model is imported into the CFD model to simulate the mass transport and performance of PEMFC.

2.1. FEM Model

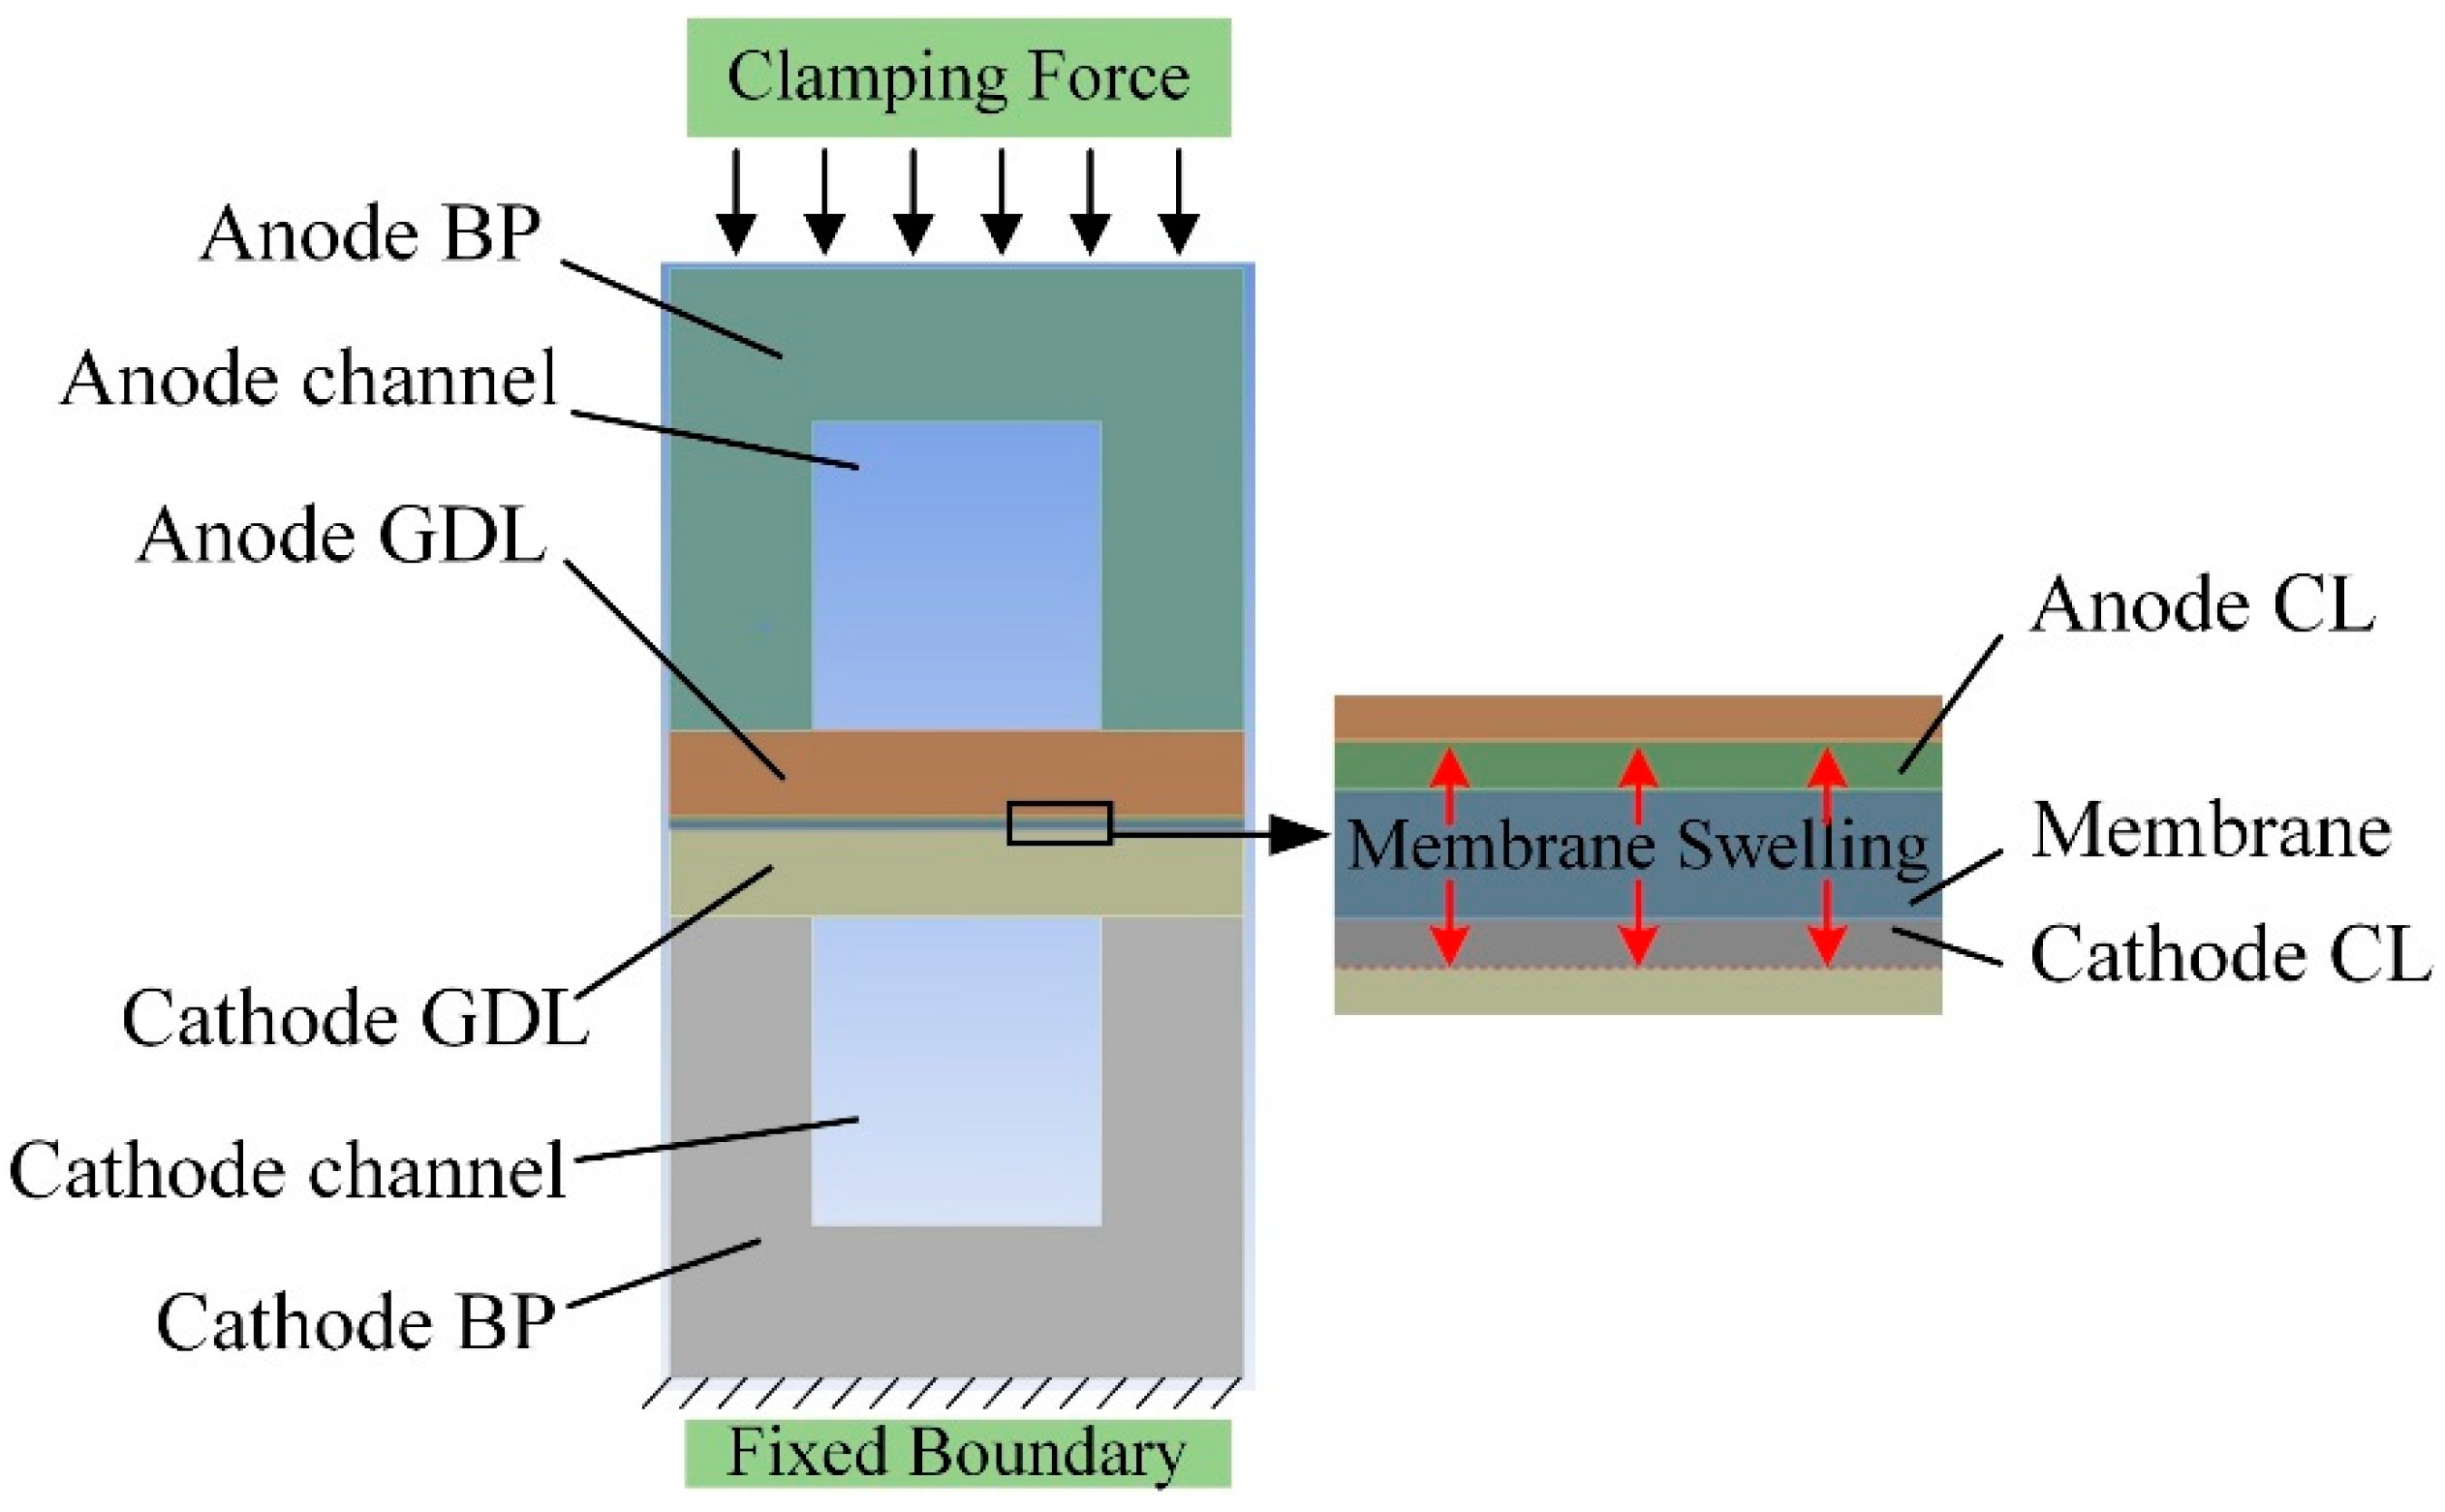
2.1.1. Computational Domain and Assumptions

Figure 1 shows the computational domain of the FEM model. The width and height of the flow channel are both 1 mm, the width of the rib is 0.5 mm, the height of the graphite bipolar plate (BP) is 1.5 mm, the GDL is selected as TGP-H-090 with a thickness of 0.28 mm, the thickness of CL is 0.01 mm, and the membrane is selected as Nafion 211 with a thickness of 0.0254 mm.
To simplify the model, the following assumptions are made: (1) assume perfect assembly between different components and ignore the effect of sliding misalignment; (2) assume that the mechanical properties of all materials are isotropic, including isotropic wet and thermal expansion coefficients; (3) assume that the assembly pressure on the upper surface of the BP is uniform.

2.1.2. Mathematical Model

The elastic deformation involved in the FEM model uses a linear elastic plane strain formulation, which is mainly controlled by the equilibrium equations, elastic equations and geometric equations.
Equilibrium equations:
{ σ x x + τ y x y + X = 0 σ y y + τ x y x + Y = 0
Elastic equation:
{ σ x = E ( 1 μ ) ( 1 + μ ) ( 1 μ ) ( ε x + μ 1 μ ε y ) σ y = E ( 1 μ ) ( 1 + μ ) ( 1 μ ) ( μ 1 μ ε x + ε y ) τ x y = γ x y G
Geometric equations:
2 ε x y 2 + 2 ε y x 2 = 2 γ x y x y
where σ is the normal stress, τ is the shear stress, X and Y are the body forces, G is the shear elastic modulus, E is the Young’s modulus, ε is the normal strain, γ is the shear strain, and μ is the Poisson’s ratio. The strain tensor can be expressed as [19]:
ε = ε e l + ε p l + ε T + ε S
where the superscripts εel, εpl, εT and εS are the elastic, plastic, thermal and swelling induced components of strain. In addition, the plastic deformation of the membrane and CL are expressed by the Von Mises yield criterion 11:
f ( σ ) = ( σ x σ y ) 2 + ( σ y σ z ) 2 + ( σ z σ x ) 2 2 = 3 2 S i j S i j
where Sij is the deviatoric stress.
The physical property parameters of BP and GDL involved are selected from [20,21]. Other corresponding material parameters and mechanical property parameters of Nafion 211 and CL in different water content environments are selected from [22]. In addition, most of the current studies on the measurement of the swelling expansion coefficient of membranes are based on RH, and to obtain the swelling expansion coefficient of membranes with different water contents, relevant measurement experiments need to be performed. The Young’s modulus of CL is difficult to obtain and needs to be obtained by experimental and analytical methods. The detailed experimental methods are as follows.

2.1.3. Measurement of Membrane Swelling Expansion Coefficient

This part mainly uses the gravimetric method to test and calculate the water content of the membrane. The sample size of the membrane used in this experiment is 2 × 1 cm. The experimental method is as follows: measure the weight of the membrane W1 before the experiment; place the membrane in ultrapure water with a constant temperature of 80 °C for a certain time t; wipe to remove water on the surface of the membrane; measure the dimensions change and the weight of membrane after water absorption W2. The amount of water absorbed in the membrane is Wwater = W2W1. The experiments are repeated at least 5 times for each test. The membrane dimensions and the amount of water absorbed in the membrane are averaged over all results to ensure the reliability of the experimental data.
The weights of dry and wet membranes can be used to calculate the absorbed water amount in the membrane as follows:
Water   Uptake = W 2 W 1 W 1 × 100 %
The dimensionless number of water content in the membrane, which is defined as λ, is calculated by the following equation:
λ = N H 2 O N SO 3 = Water   Uptake ( % ) × 10 18 × IEC
where N H 2 O and N SO 3 are moles of water and sulfate ion, IEC is the ion exchange capacity of Nafion 211, which ranges from 0.95–1.01 mmol g−1 and is taken here to be 1.00 mmol g−1.
Table 1 shows the water content and linear strain of membrane versus immersion time in water at a temperature of 80 °C. Both the water content and the linear strain of the membrane increase initially with time and reach almost constant values after about 20 min. After comparison of the test results, a linear relationship between the linear strain and water content of the membrane is obtained, i.e., linear strain ≈ 0.328 λ, which will be imported to the FEM model for structure deformation of MEA. The CL is assumed to have the same swelling coefficient with the membrane.

2.1.4. Measurement of Young’s Modulus

The Young’s modulus of the membrane is measured using a universal material testing machine (Instron Company, USA, E1000). The Young’s modulus of CL cannot be measured directly since it is too fragile to be clamped individually. Since the CL is usually sprayed on the membrane surface, forming a catalyst-coated membrane (CCM), the mechanical behavior of CL is obtained indirectly by testing both the CCM and membrane through a mathematical derivation. The CCM is coated with 0.1/0.4 mg Pt/C catalyst with the same thickness on both the anode and cathode sides.
Typical true stress–strain curves for membranes and CCMs can be obtained from experimental measurements. True stress ( σ true ) and true strain ( ε true ) can be used to account for large deformations. They are related to engineering stress ( σ e ) and engineering strain ( ε e ), as shown in the following equations:
σ true = ( 1 + ε e ) σ e
ε true = ln ( 1 + ε e )
In the linear range, both the membrane and the CL can be considered as simple lamellar structures that together form the CCM, such that the mixing rule can be used to determine the Young’s modulus of the CL. For uniaxial tension, the strains of both the membrane and CL are assumed to be the same as the strains of the CCM in the same load direction:
ε CCM = ε M = ε CL
Assuming a uniform uniaxial stress distribution, the Hooke’s law can be used:
σ = E ε
F = σ A
where σ is stress, ε is strain, E is elastic modulus, F is pressure and A is the cross-sectional area. The combined force on the CCM includes the force acting on the membrane and the force acting on the CL, then:
F CCM = F M + F CL
( E ε A ) CCM = ( E ε A ) M + ( E ε A ) CL
and the Young’s modulus of CL can be deduced as:
E CL = ( E ε A ) CCM ( E ε A ) M ( ε A ) CL
Figure 2 shows the true stress–true strain plots of the membrane and CCM measured at the same strain rate (5/min). It shows that the CCM produces less stress than the membrane for a given strain. The measured Young’s modulus of membrane and CCM are 228.49 and 368.84 MPa, respectively. According to Equation (15), the Young’s modulus of CL is 174.56 MPa.

2.1.5. Boundary Condition

In the FEM model, as shown in Figure 1, to simulate the assembly process of PEMFC, the assembly pressure of 1 MPa is uniformly applied to the upper surface of the anode bipolar plate, and a fixed constraint is applied to the lower surface of the cathode bipolar plate. To ensure that the deformation of both sides of the PEMFC is approximately the same, there is no out-of-plane displacement and in-plane rotation, and the left and right sides of the model are set as symmetric boundary conditions. The rest of the surfaces are free surfaces.

2.1.6. Numerical Procedures

The FEM model is discretized and solved based on Ansys Workbench 19.2 platform. The equations are solved using the Newton–Raphson method for a total of 98,606 cells in the computational domain of the model. The grid independence test is performed by refining the grid cells of the membrane electrode, and the deviation of the PEMFC deformation is only 0.1% after doubling the grid of the membrane electrode. Thus, the effect of refining the grid is negligible, and the number of grids is considered sufficient.

2.2. CFD Model

2.2.1. Computational Domain and Assumptions

Figure 3 shows the computational domain of the CFD model. The geometric parameters are the same as the computational domain of the FEM model after deformation, and the length of the channel is 50 mm.
The following assumptions are made in the CFD model: (1) the PEMFC operates in a steady state with constant surface temperature; (2.)the GDL and CL are assumed to be porous media with uniform isotropic distribution, and the effect of anisotropy is neglected in the model; (3) the effect of gravity is neglected; (4) the gas entering the flow channel during the operation of PEMFC is assumed to be incompressible, and the gas flow is laminar due to the small Reynolds number; (5) the proton exchange membrane does not allow the reaction gas to pass through.

2.2.2. Mathematical Model

Based on the above assumptions, the mathematical model of the CFD model can be derived as follows.
The mass conservation equation of gas mixture:
( ρ g u g ) = S m
The conservation of momentum equation for a gas mixture:
( ρ g u g u g ε 2 ( 1 φ l ) 2 ) = P g + μ g ( ( ( u g ε ( 1 φ l ) ) ) + ( u g T ε ( 1 φ l ) ) ) 2 3 μ g ( ( u g ε ( 1 φ l ) ) ) + S u
Gas species conservation equation:
( ρ g u g Y i ) = ( ρ g D i e f f Y i ) + S i
Liquid water transport equation:
( f ρ g u g ) = ( ρ l D l φ l ) + S l
Dissolved water transport equation:
0 = ρ m e m E W ( D d e f f λ d ) + S d
Electron transport equation:
0 = ( κ e e f f φ e ) + S e
Proton transport equation:
0 = ( κ i o n e f f φ i o n ) + S i o n
Energy conservation equation:
( ( ρ C p ) f l e f f u T ) = ( k f l , s l e f f T ) + S T
The proton conductivity is expressed as [23]:
κ i o n = ( 0.5139 λ 0.326 ) e x p [ 1268 ( 1 303.15 1 T ) ]
The effective proton conductivity can be expressed as [24]:
κ i o n e f f = ω 1.5 κ i o n
where D is the mass diffusivity, f is the interfacial drag coefficient, EW is the equivalent weight of membrane, λ is the water content in ionomer and k is the thermal conductivity, ω is the volume fraction of polymers, and S is the source terms for each equation. All the source terms, other equations, and parameters related to the conservation equation are given in detail in [20,25,26,27].

2.2.3. Boundary Condition

In the CFD model, the inlet of the cathode and anode flow channels are set as mass flow inlet boundary conditions according to the operating conditions of the cell, and the outlet of the two flow channels are set as pressure outlet boundary conditions. The mass flow rates at the inlet are expressed as follows:
m a n = ρ g a n α a n R a n A a c t 2 F c H 2
m c a t = ρ g c a t α c a t R c a t A a c t 2 F c O 2
where α is the stoichiometric ratio, R is the reference current density, which is corrected according to the calculation results, A is the active area of the fuel cell, and F is the Faraday’s constant. c H 2 and c O 2 are the concentrations of hydrogen and oxygen at the anode and cathode inlets, respectively:
c H 2 = p g , o u t + Δ p g a n R H a n p s a t R T
c O 2 = 0.21 ( p g , o u t + Δ p g c a t R H c a t p s a t ) R T
The numerical calculations involved in this study are all performed at a fixed output voltage. The electronic potential of the anode terminal is set to 0, and the electronic potential of the cathode terminal is set to the working voltage of the fuel cell. The materials and operating parameters of the CFD model are shown in Table 2.

2.2.4. Numerical Procedures

The CFD model is solved based on the platform of Ansys Fluent 19.2, and user-defined functions (UDFs) are used to compile the material transport equations, source terms, and associated boundary conditions into the software. The model uses the SIMPLE algorithm based on the pressure criterion and the second-order windward algorithm, and the convergence process is improved by using double precision calculations and the AMG method. The grid independence test shows that the error of fuel cell performance is less than 1% after increasing the grid by 50% in the x, y, and z directions. In addition, many other studies have compared the simulation results from the same CFD model with the experimental results, and the results show that the CFD model result agrees well with the experimental result, which proves the reasonableness of the model [26,27].

3. Results and Discussion

As shown in Table 3, five different cases (Base case*, Cases 1*–4*) are set up to compare different models and to analyze the effects of water content on the structure deformation and performance of PEMFC.

3.1. Model Comparisons

Figure 4 shows the deformation of the MEA for Base case*, Case 1*, and Case 2* shown in Table 2. In Base case*, no assembly pressure and membrane swelling are applied; only the assembly pressure is applied in Case 1*, and both assembly pressure and membrane swelling with λ of 15 are applied in Case 2*. It can be seen that in Case 1*, the GDL below the rib is significantly deformed, while the GDL below the channel is not significantly changed compared with the Base Case*, and the membrane and CL hardly change. When the membrane swelling is considered in Case 2*, the membrane expands toward the cathode and anode, and the membrane below the rib expands less due to the restraint of the bipolar plate, while the membrane below the channel expands more, and hence, the membrane surface is not level and the thickness is greater than Case 1* (more clearly shown in Figure 5). In this case, the GDL suffers from bilateral compression by the assembly pressure and the expansion of the membrane.
Figure 5 shows the equivalent stress distribution of the membranes in both Case 1* and Case 2*. In Case 1*, the maximum stress in the membrane is 2.74 MPa, which occurs below the rib, while the minimum stress is only 0.72 MPa, which occurs at the edge between the rib and the channel. In Case 2*, the stress in the membrane is significantly higher, with a maximum stress of 3.58 MPa, and the maximum stress occurs at the center below the channel, while the minimum stress is below the rib, with a magnitude of 2.83 MPa, which is also higher than the maximum stress in Case 1*. This is mainly due to more expansion of the membrane under the channel. The results indicate that the membrane swelling has a significant influence on the stress distribution and that the MEA deformation and should be considered in the modeling.
The deformations of each component from different models are then exported to draw the corresponding 3D PEMFC geometric model, which is imported into the CFD model to obtain the transport characteristics and performance of the PEMFC for the three cases. Figure 6 and Figure 7 show the distribution of the oxygen mass fraction in the Base case*, Case 1* and Case 2* for the operating voltage of 0.6 V. The plot shows that the oxygen mass fraction of GDL under the rib is significantly lower in Case 1* and Case 2* compared to the Base Case*, and this is because the porosity of the GDL below the rib is reduced due to compression, which is not conducive to mass transport. However, the oxygen mass fraction under the channel is higher in Case 1* and Case 2* compared to the Base Case*. The porosity of the GDL under the channel is only reduced slightly, the oxygen transport path becomes shorter, and a smaller channel cross-sectional area due to GDL intrusion increases flow velocity and mass convection to the electrode. The oxygen mass fraction in Case 2* is somewhat larger than that in Case 1* both under the channel and rib region, because the degree of GDL intrusion into the flow channel is higher due to membrane swelling.
Figure 8 shows the distribution of liquid water volume fraction in the Base case*, Case 1* and Case 2* when the operating voltage is 0.6 V. The volume fraction of liquid water in Case 2* is slightly smaller than the volume fraction of liquid water in Case 1* and larger than the volume fraction of liquid water in the Base case*, almost opposite to the results of the mass fraction distribution of oxygen shown in Figure 6. The reasons can be explained similarly with oxygen transport: small porosity deteriorates liquid water removal from the GDL under the rib, but GDL intrusion to the channel has positive functions on water removal. This also verifies that liquid water blocks the electrode and is detrimental to the reactant gas transport.
Figure 9 compares the fuel cell polarization curves in the Base case*, Case 1*, and Case 2*. Overall, the performance of Case 1* is slightly better than the Base case*, because the compression deformation leads to a shorter gas transport distance due to GDL intrusion and a greater electron conductivity of the GDL due to small porosity, which plays a major role in determining the fuel cell performance at small and medium load ranges. At high load range (small voltage or large current density), the CFD result considering GDL deformation is worse due to severe water flooding. When considering the effect of membrane swelling in Case 2*, the membrane expands, and its thickness increases, which makes the membrane and bipolar plate compress the GDL in both directions, resulting in smaller porosity in the GDL. In this situation, higher mass transport resistance due to small porosity and ion transport resistance due to increased membrane thickness play a more important role, and the fuel cell performance is reduced in all the load ranges. At a cell voltage of 0.6 V, the magnitude of the current density values is consistent with the oxygen mass fraction shown in Figure 6 and Figure 7. The current density is negatively correlated with the oxygen mass fraction, because the constant mass flow rate is set at the channel inlet, and a higher current density means more oxygen consumption and less oxygen left in the channel and GDL.

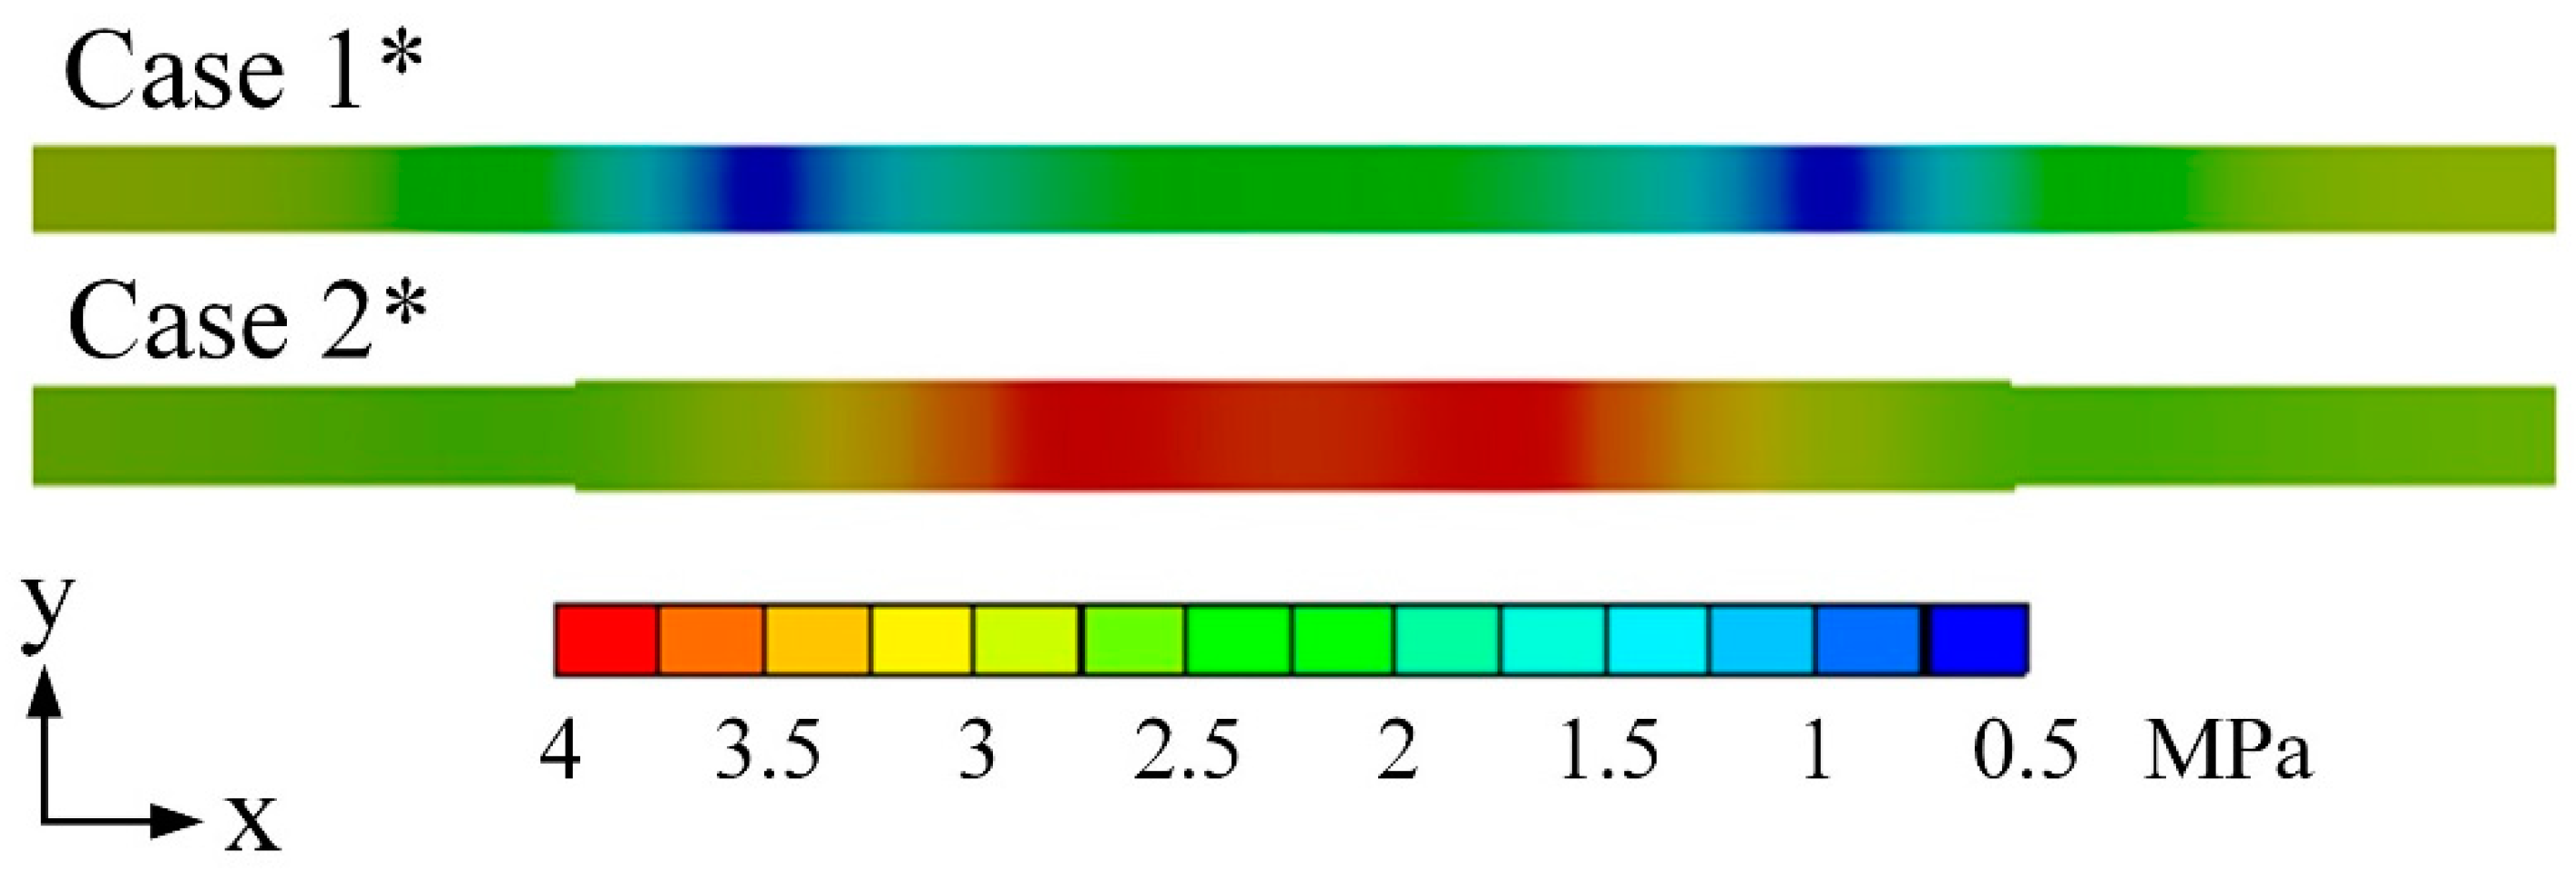
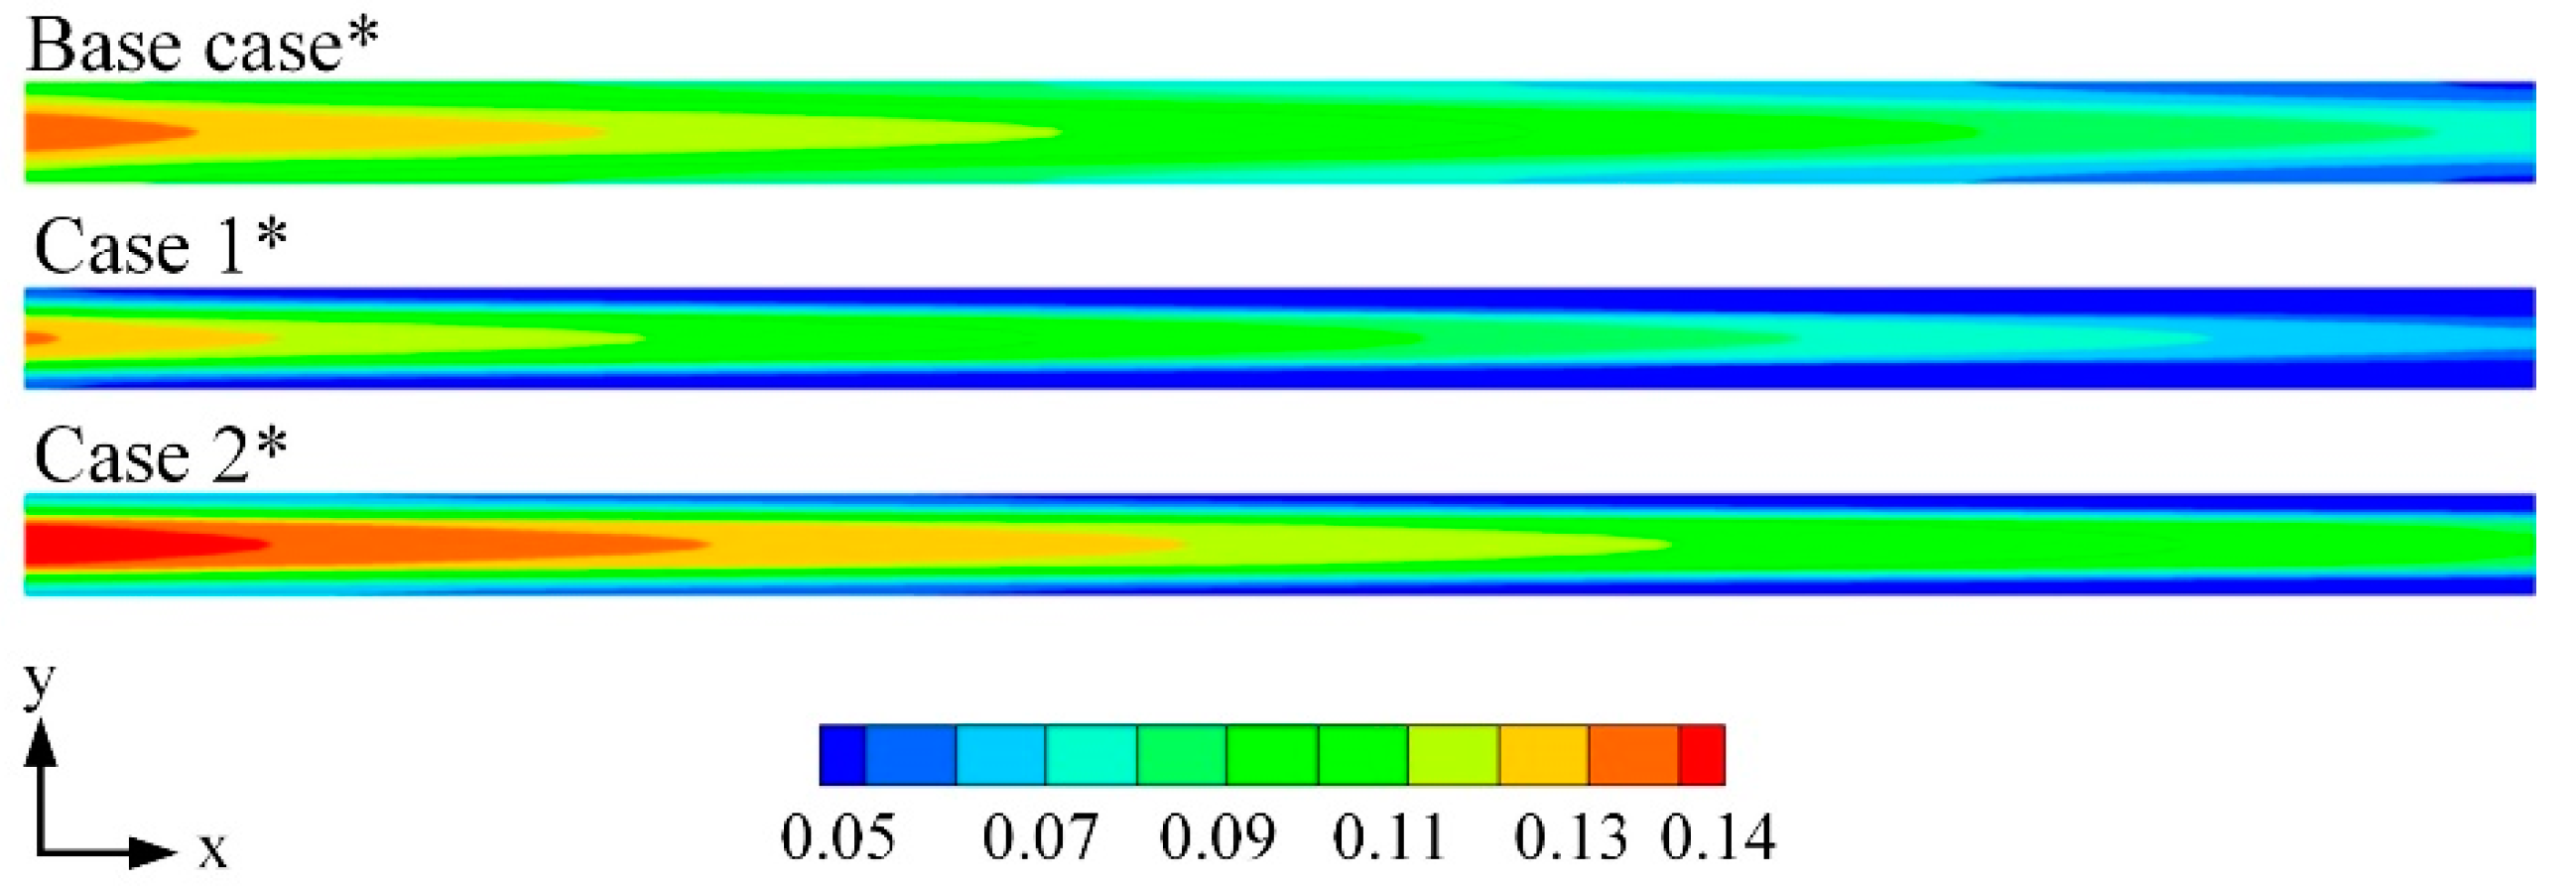
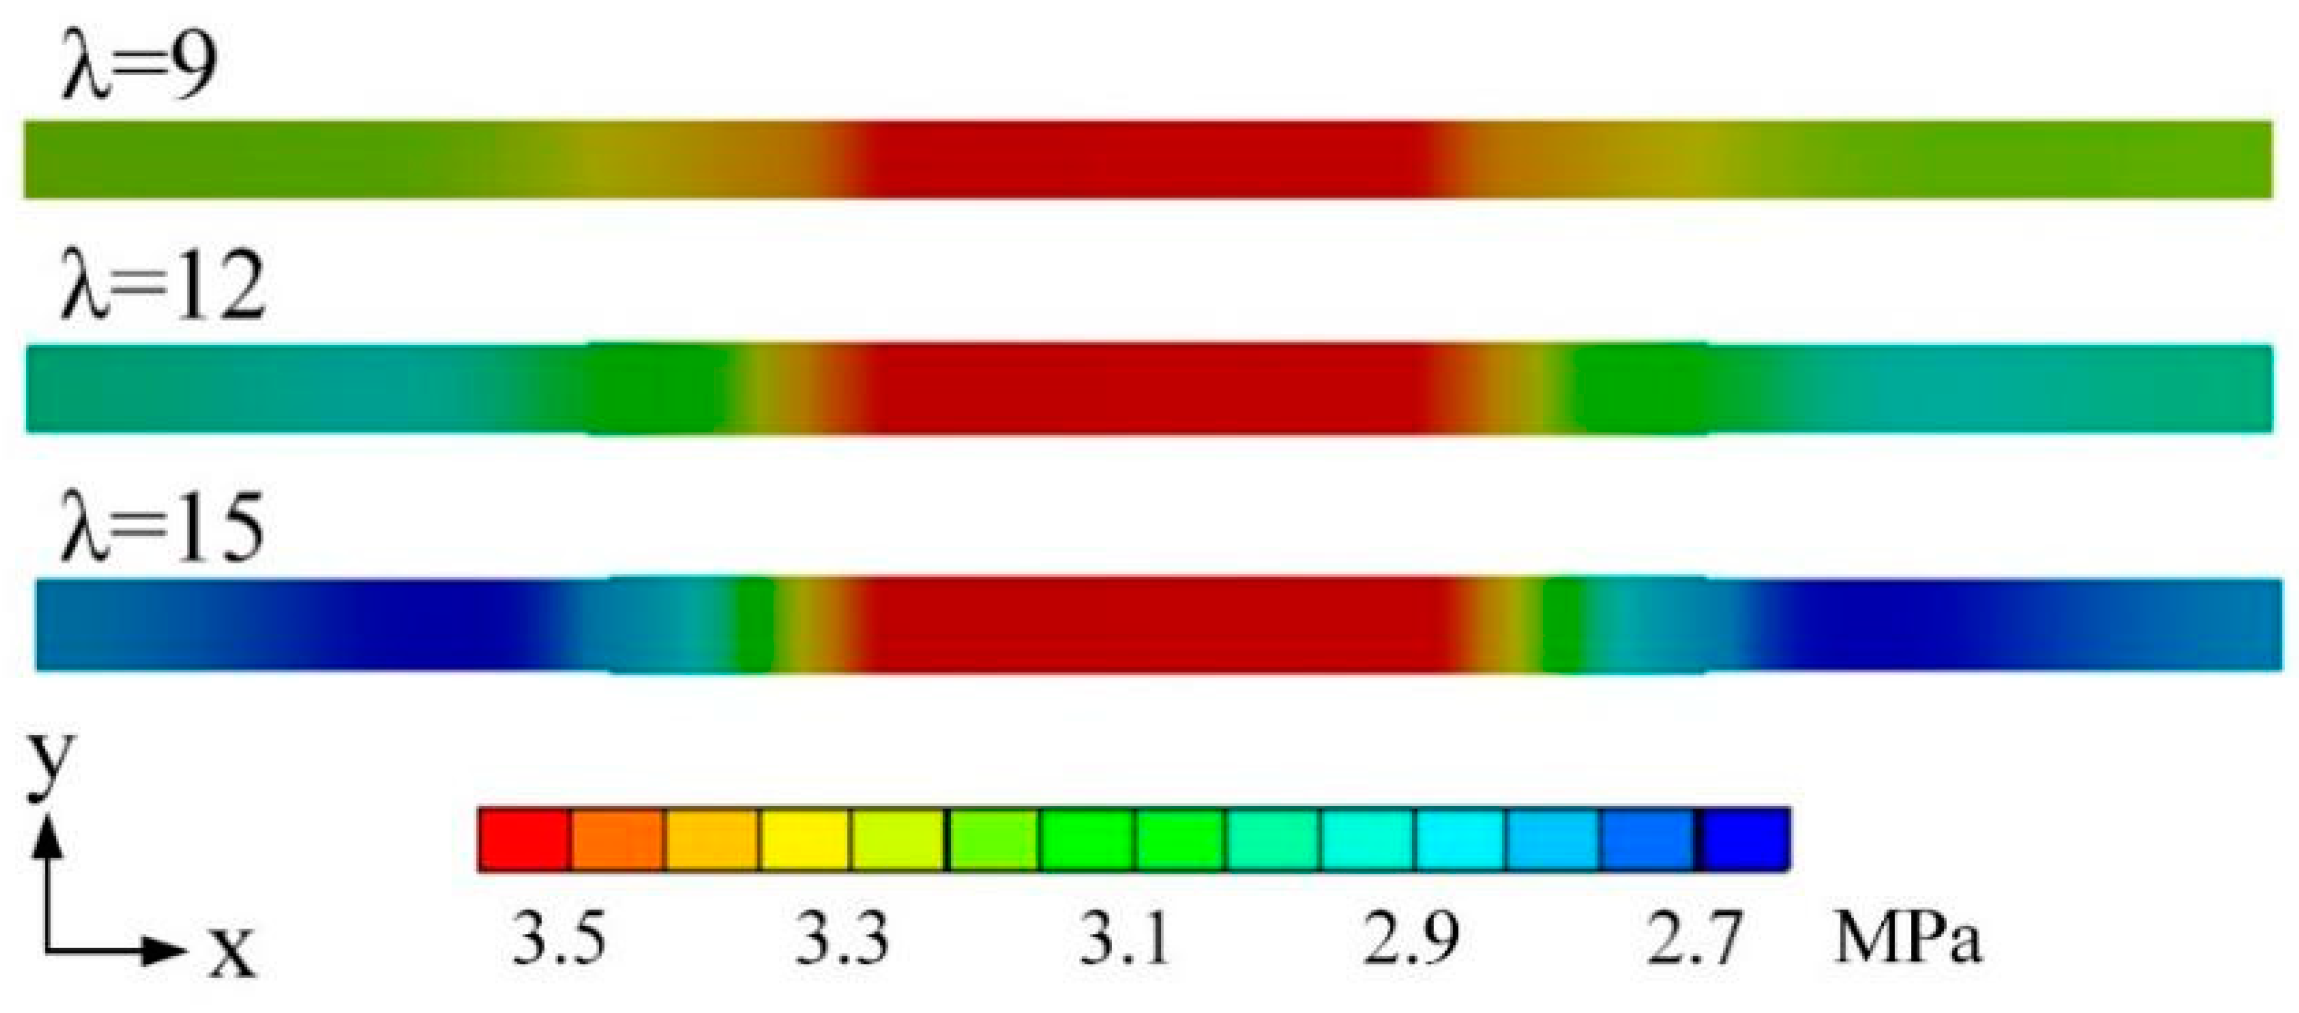
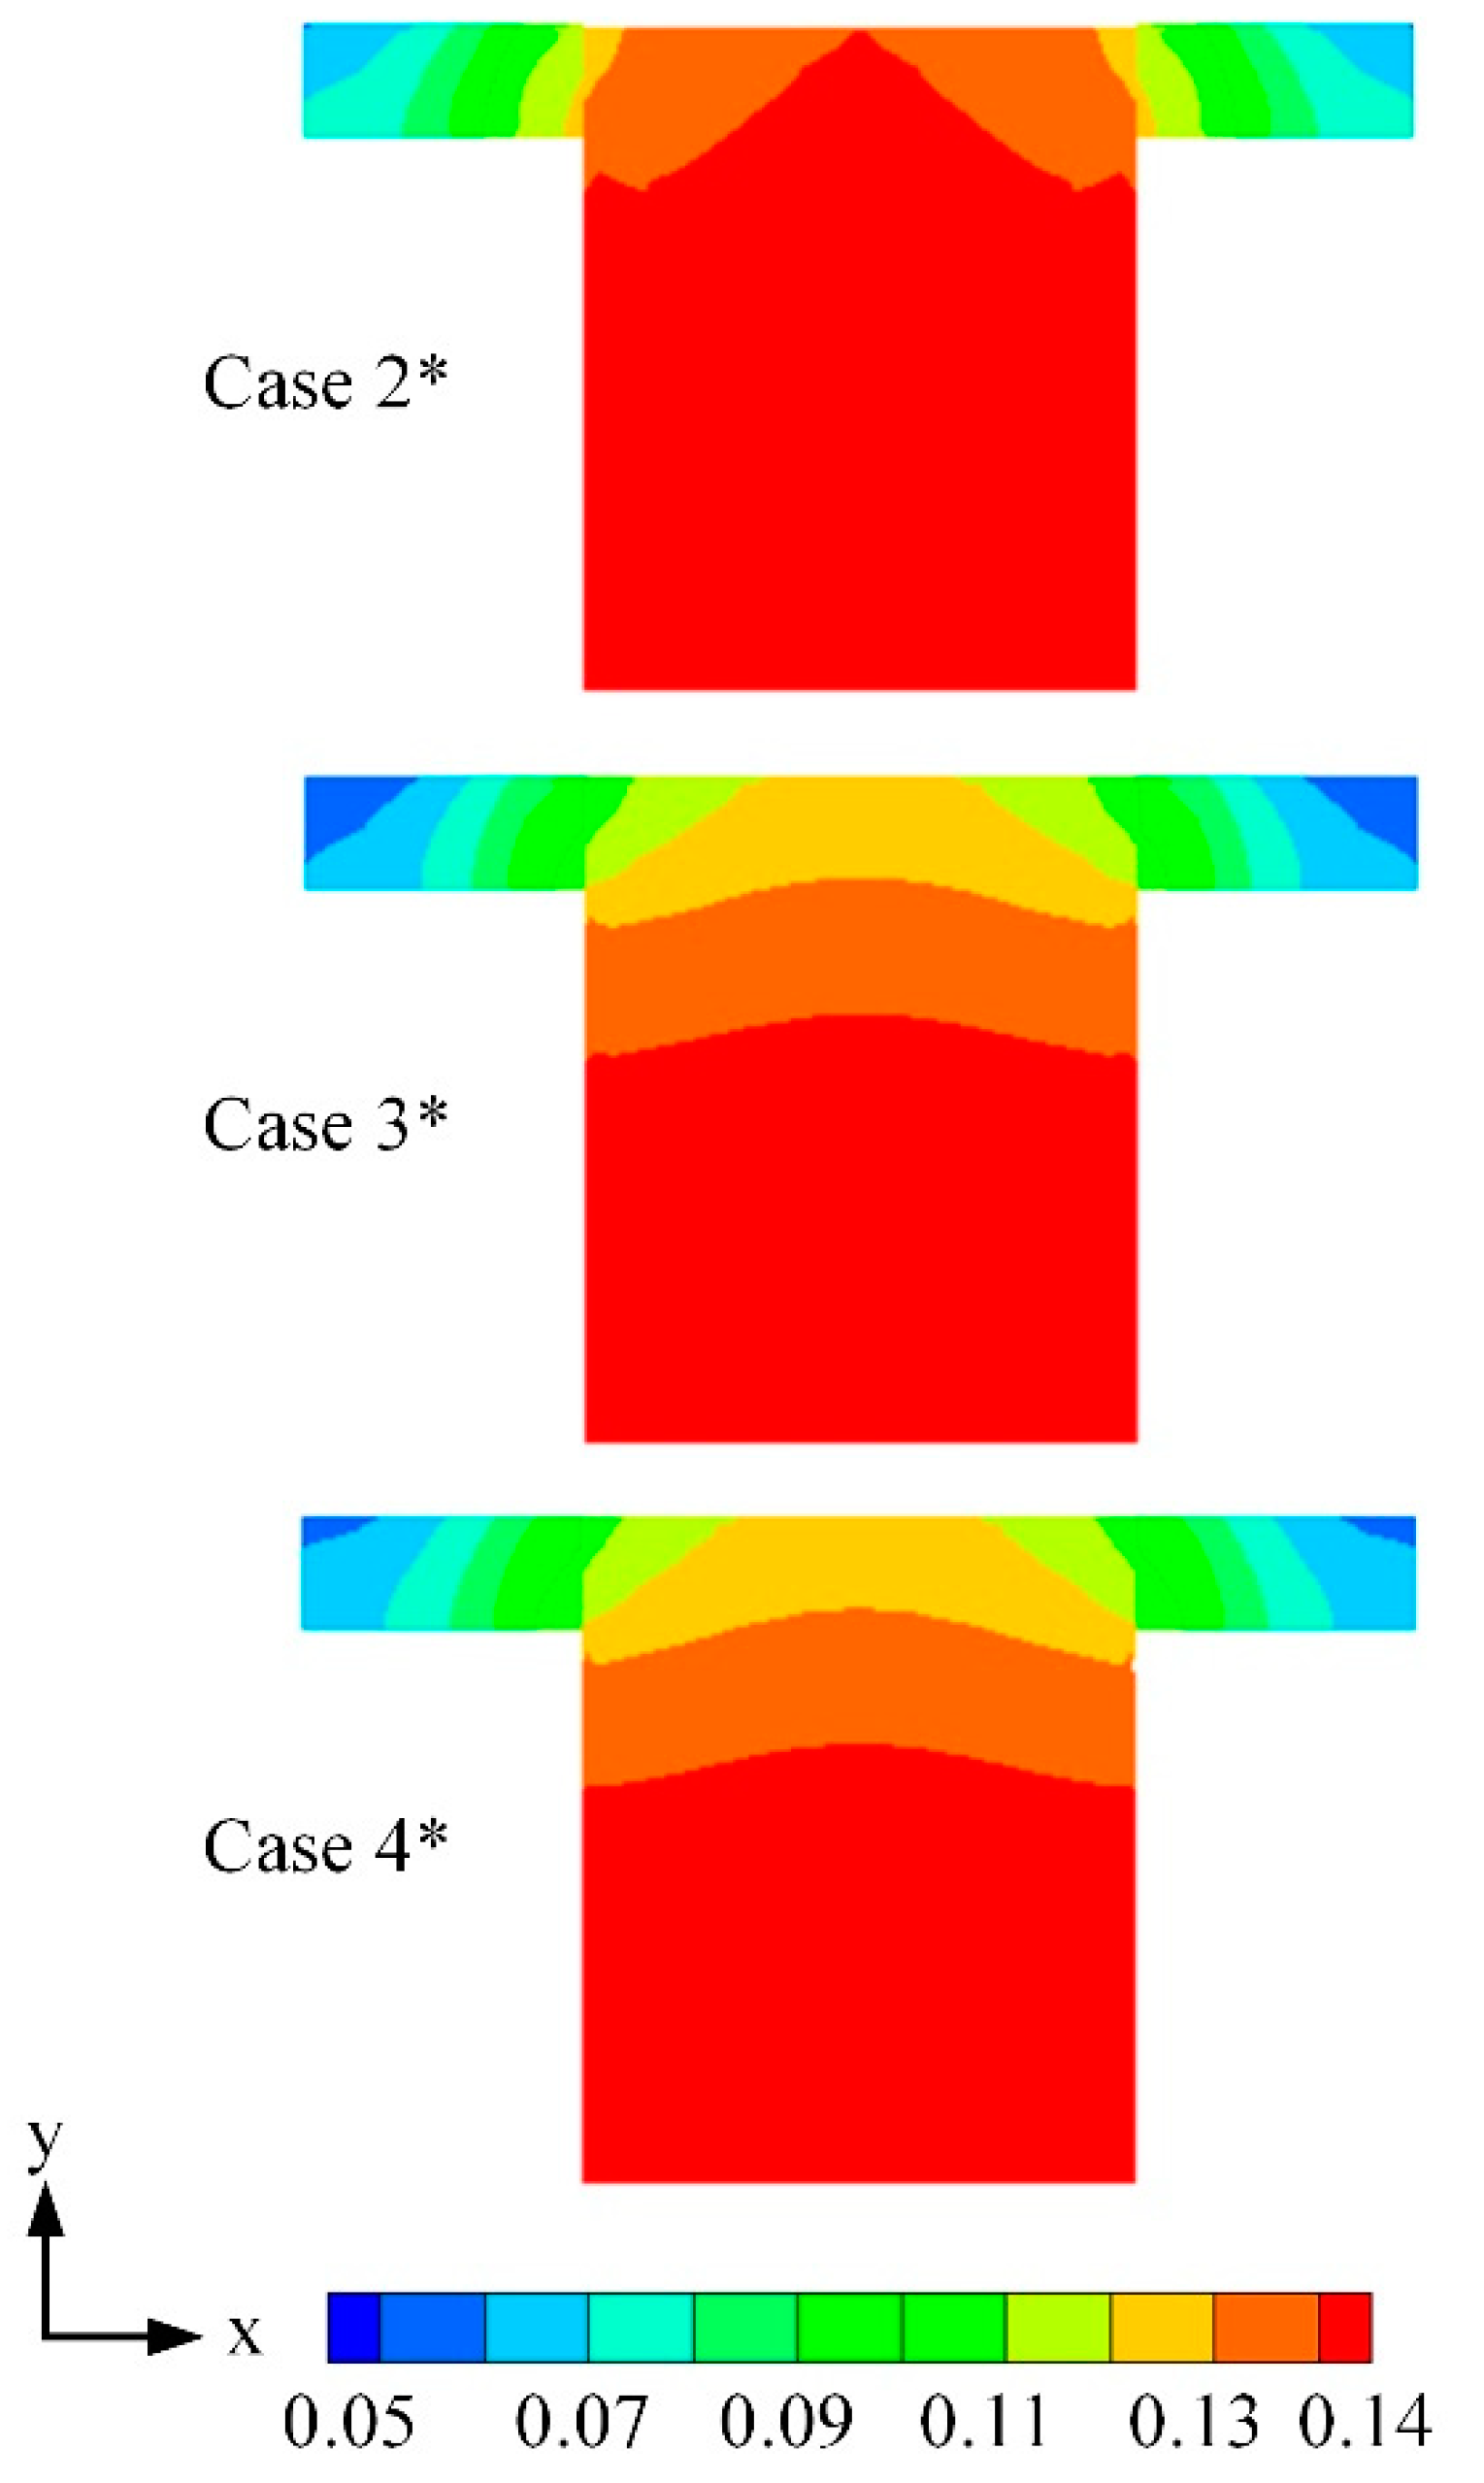
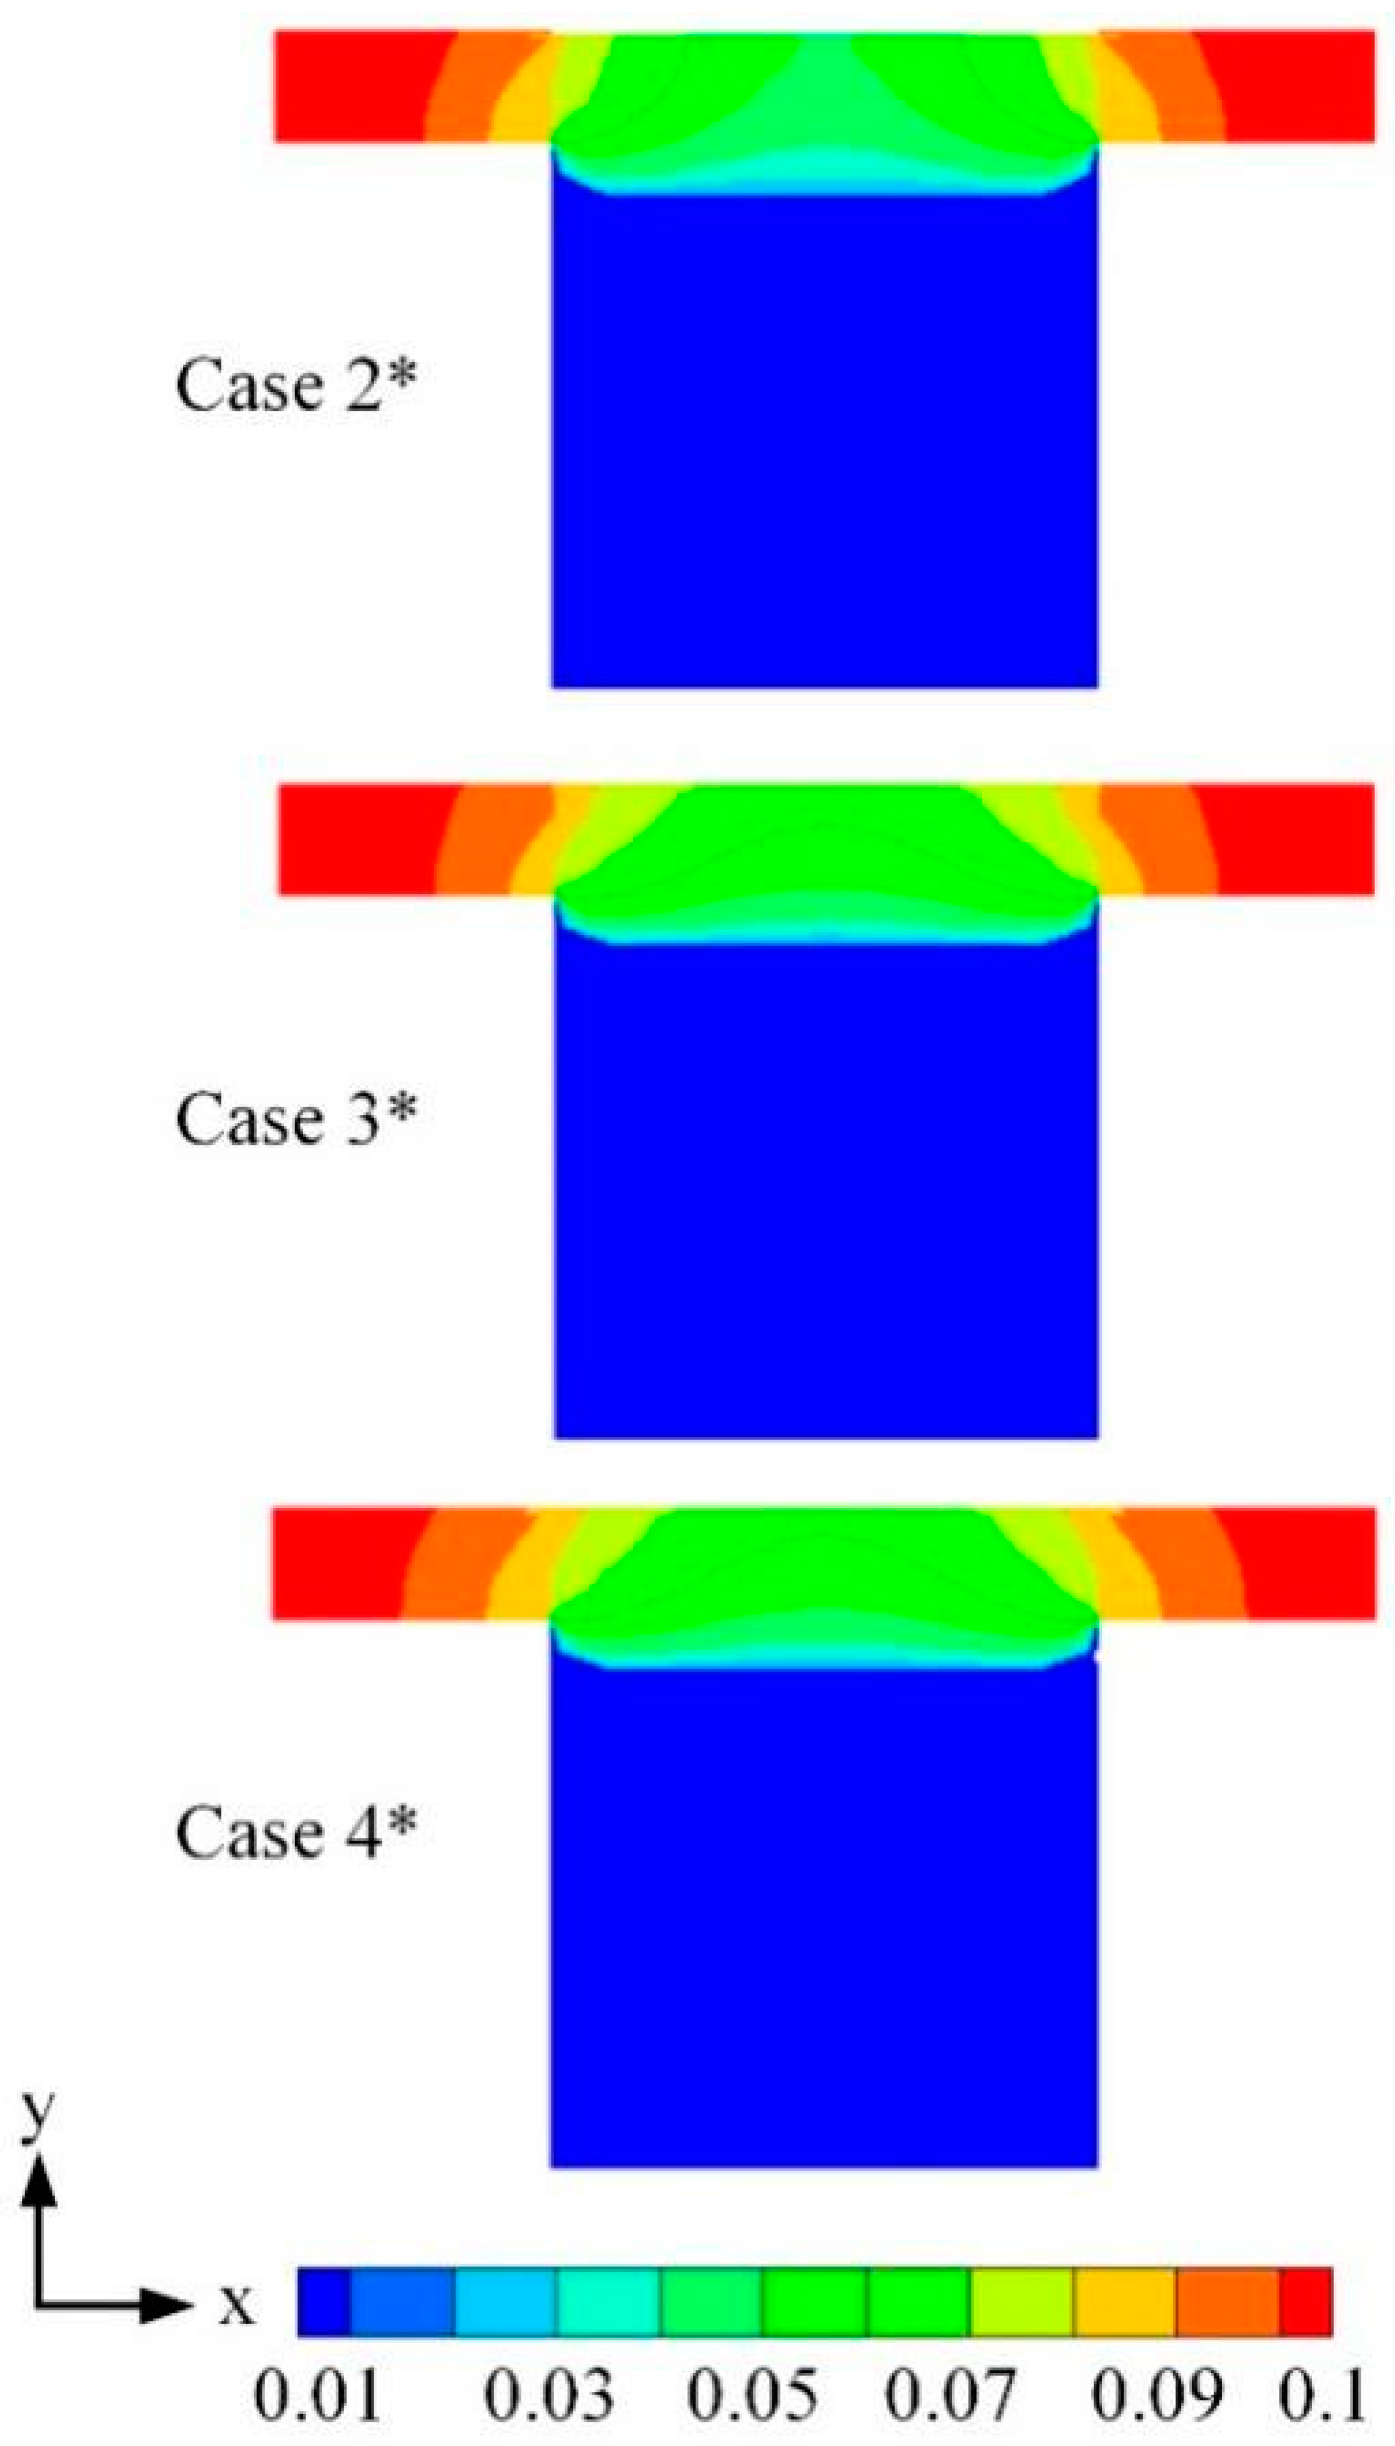
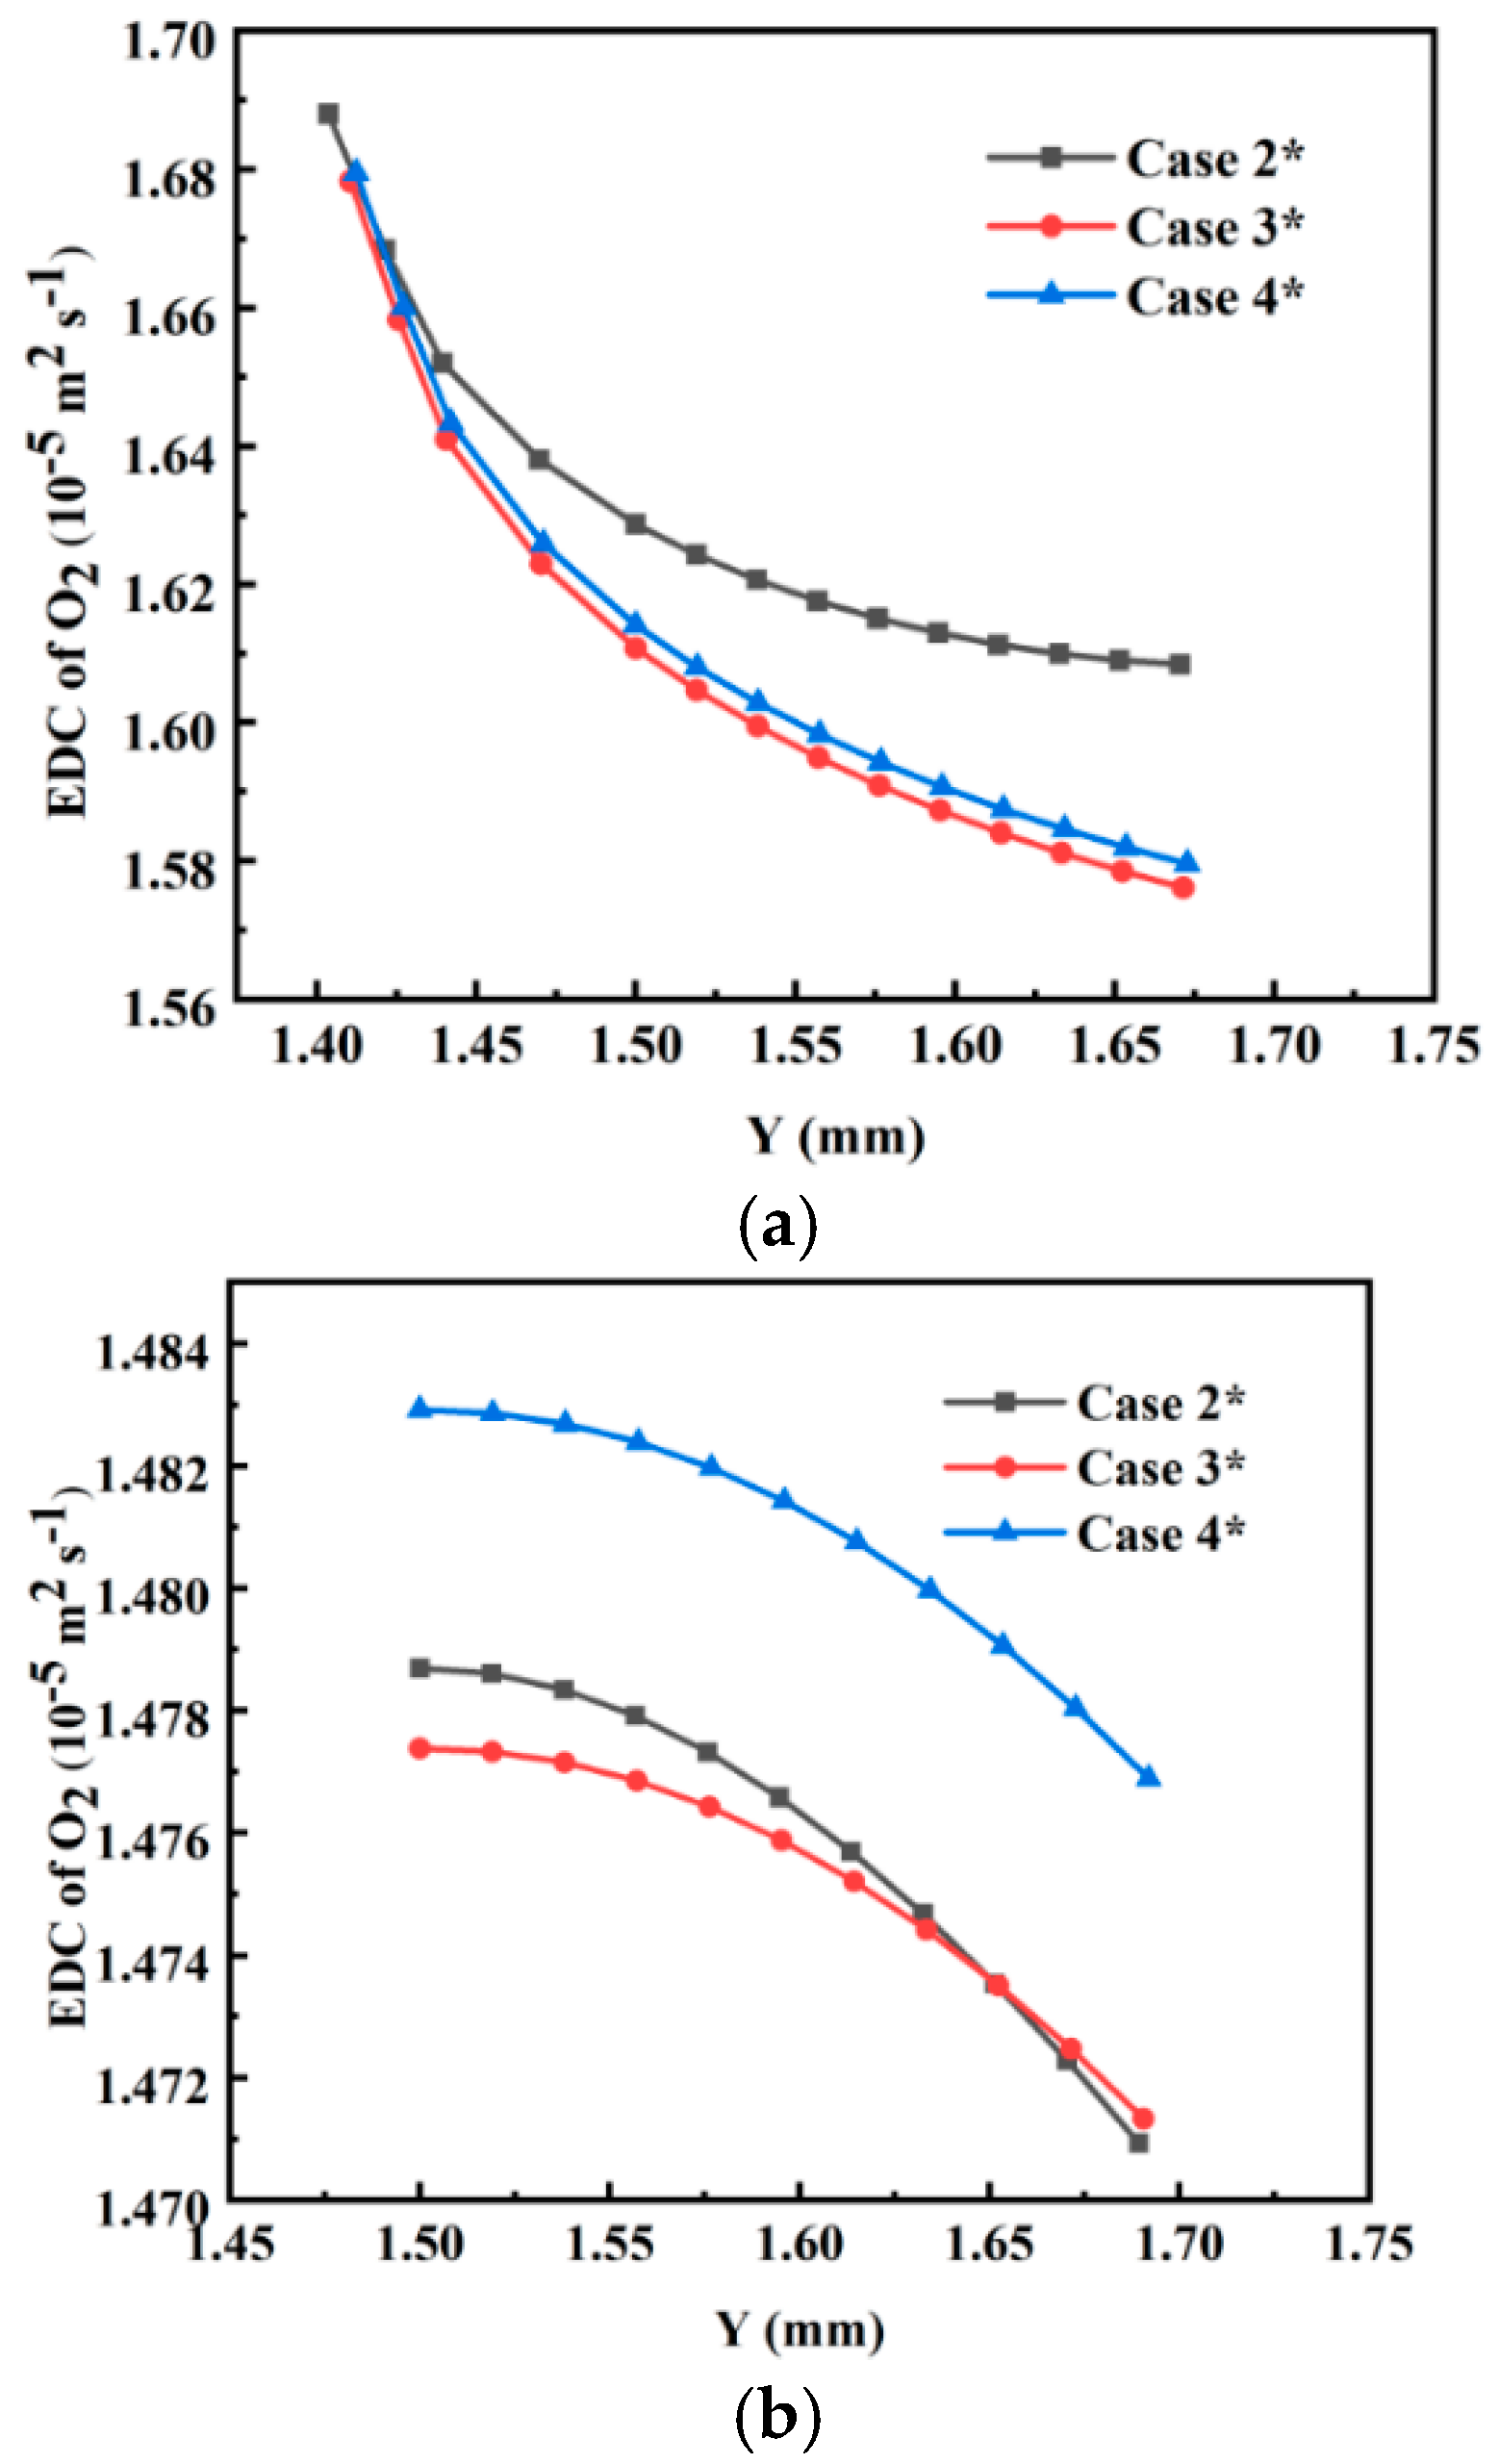
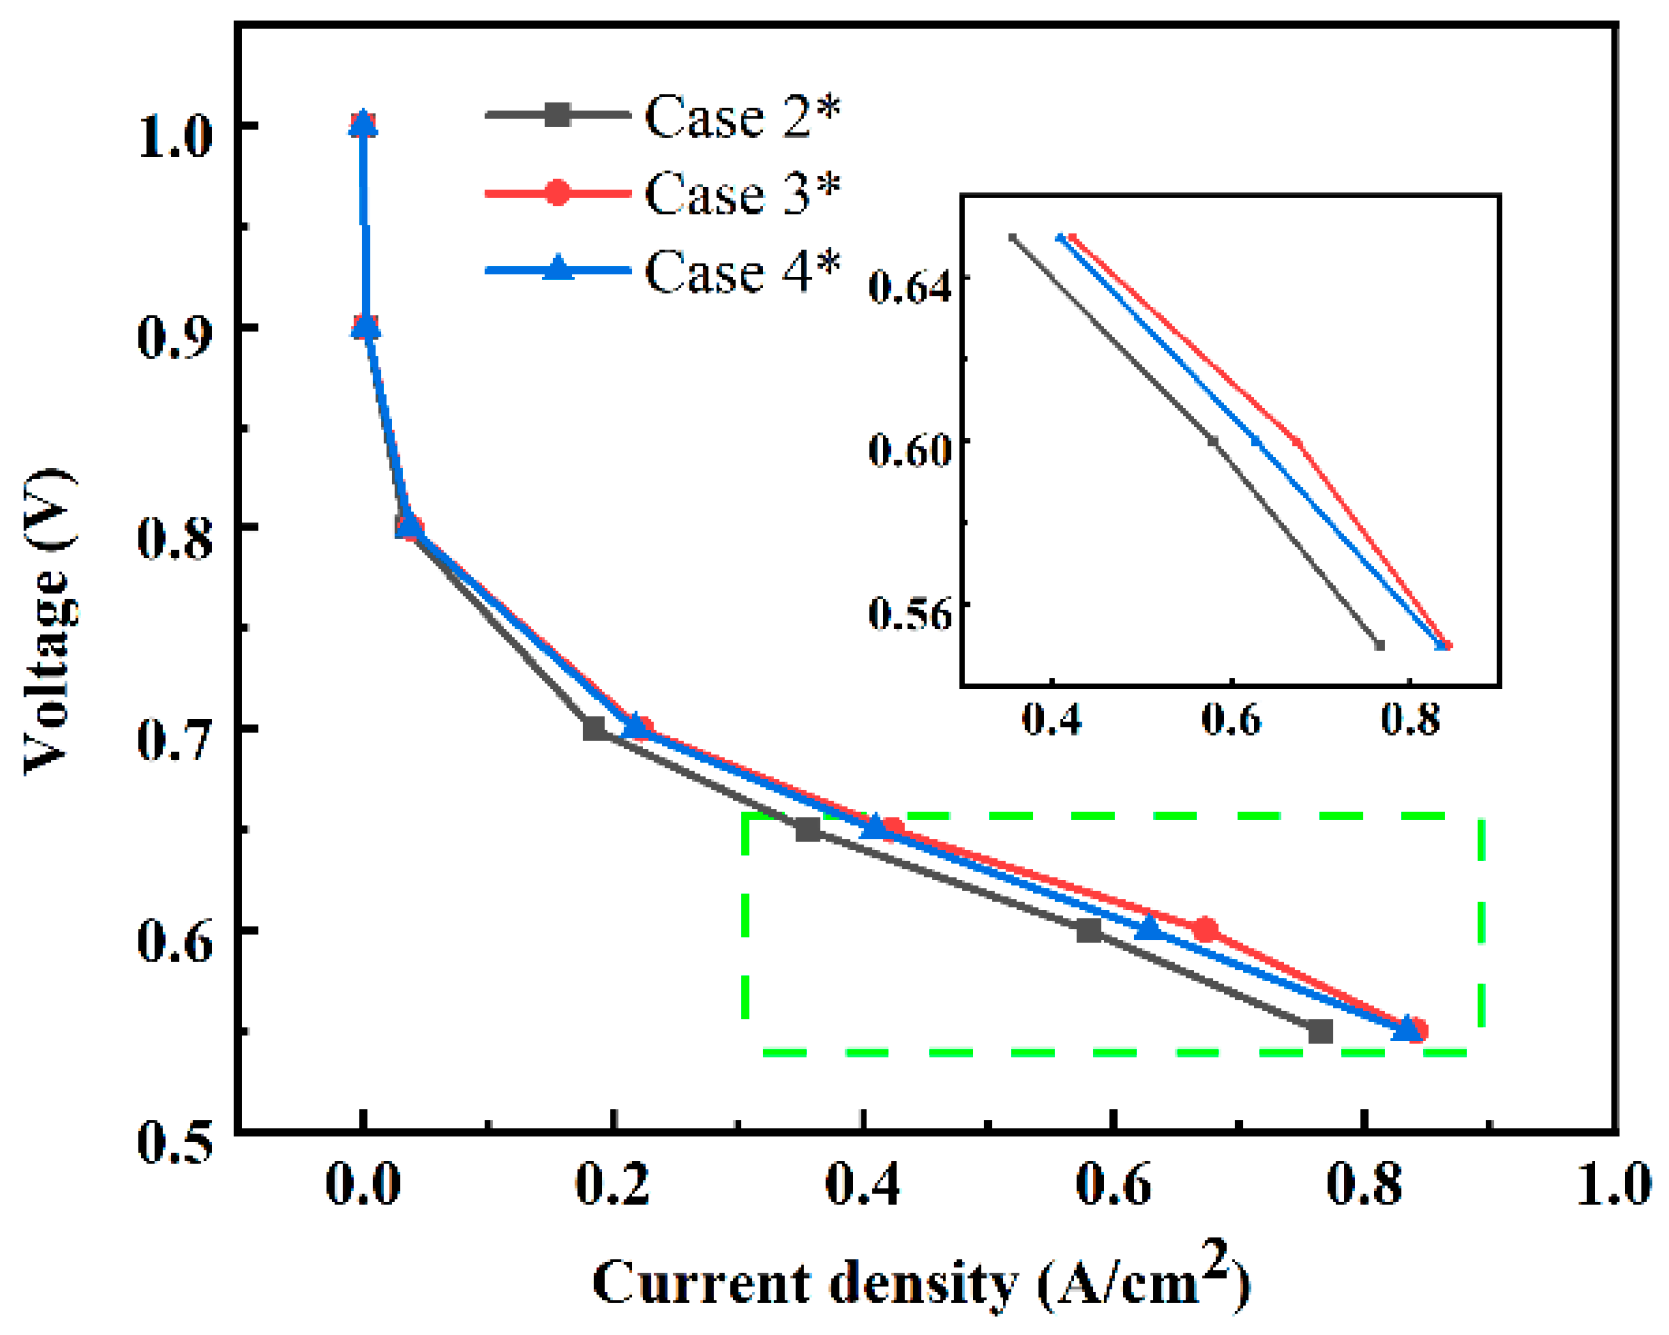
3.2. Effects of Water Content

Figure 10 shows the deformation and equivalent stress distribution of the membrane with λ of 9, 12 and 15, corresponding to Case 4*, Case 3* and Case 2* shown in Table 2, respectively. The results show that the deformation of the membrane increases with the water content. The membrane under the channel produces significantly larger swelling than that under the rib due to the constraint of the bipolar plate. Correspondingly, the equivalent stress distribution of the membrane with λ of 9, 12, and 15 is also given in Figure 10. The membrane below the flow channel undergoes an increasing amount of swelling and deformation as the water content increases, and therefore, the stress is significantly greater than those of the membrane under the rib. The stress under the rib decreases with increasing water content, possibly due to higher stress withstood by the membrane under than channel.
Figure 11 shows the distribution of oxygen mass fraction near the cathode inlet (z = 5 mm) for Case 2*, Case 3* and Case 4* at the operating voltage of 0.6 V. Figure 12 shows the distribution of liquid water volume fraction in the same plane. For these three cases, the magnitude of the oxygen mass fraction in the GDL is: Case 2* > Case 4* > Case 3*; and reversely, the magnitude of the volume fraction of liquid water in the GDL region under the flow channel is: Case 3* > Case 4* > Case 2*. The compression of the GDL reduces the porosity, but it also shortens the gas transport path. These two trade-off functions make the oxygen consumption largest in Case 3* with a water content of 12.
Figure 13 shows the distribution of the effective diffusion coefficient (EDC) of oxygen in the GDL under the channel with different water contents. It can be seen that the EDC of oxygen of the GDL under the channel in Case 2* with the highest λ of 15 is much larger than those in Case 3* and Case 4*, while the EDC of oxygen in the GDL under the rib in Case 4* with the lowest λ of 9 is much larger than those in Case 2* and Case 3*. The membrane expansion causes the GDL to intrude into the flow channel, and the oxygen diffuses more easily to the electrode, while the porosity of the GDL under the rib decreases due to bi-directional compression of the assembly pressure and membrane swelling; thus, the EDC of oxygen of the GDL under the rib in Case 4* is the largest.
Figure 14 shows a comparison of fuel cell polarization curves in Case 2*, Case 3* and Case 4*. It can be seen that in the low-current density range, the structural changes caused by the water content have almost no effect on the cell performance, while in the medium- and high-current density ranges, the cell performance is the best at λ of 12. This is the result of the combined effect of the MEA deformation and property change. Although the proton conductivity of the membrane increases with the increase in water content, the membrane thickness also increases due to membrane expansion. The bilateral compression causes the GDL porosity to decrease further with high water content, which is unfavorable to the gas transport and liquid water discharge under the rib, but the membrane expansion further squeezes the GDL and causes the distance of mass transport to the electrode to decrease, which is favorable to the gas and liquid water transport under the channel. Therefore, λ of 12 balances these effects to achieve the best fuel cell performance.

4. Conclusions

A coupled finite element method (FEM) and computational fluid dynamics (CFD) model is established to investigate mass transport characteristics and the performance of a proton exchange membrane fuel cell (PEMFC) under different membrane deformation conditions influenced by membrane water content. The swelling expansion coefficient of and Young’s modulus of the membrane and catalyst layer (CL) are obtained experimentally. Compared with the model without a membrane swelling effect, it is found that when considering the effect of membrane swelling, the gas diffusion layer (GDL) endures bilateral compression from both the membrane and bipolar plate, resulting in smaller porosity in the GDL. Higher mass transport resistance due to small porosity and ion transport resistance due to increased membrane thickness play a more important role than the decreased mass transport path due to GDL intrusion into the channel, and it reduced the fuel cell performance in all the load ranges. Thus, the consideration of membrane swelling is quite necessary in the PEMFC model to more accurately reflect the fuel cell performance. Through a more detailed investigation of membrane water content on the deformation and performance of PEMFC, it was found that the membrane deformation caused by different membrane water contents only takes effect in the medium- and high-current density ranges, and a medium water content λ of 12 achieves the best fuel cell performance for the cases investigated. Medium membrane water content and deformation balance the trade-off of membrane conductivity and thickness, as well as GDL porosity and mass transport length, achieving the best fuel cell performance. The proposed coupled FEM and CFD model takes into account the membrane deformation and its effects on mass transport and performance of PEMFC, which provide a more accurate and powerful tool for PEMFC simulation. The working conditions of fuel cells are complex, considering various changes such as assembly force, temperature, humidity and mechanical vibration. With the aid of the proposed model, coupled multi-factor working conditions can be considered to study the performance of PEMFC in the future.

Author Contributions

Investigation, Formal analysis and Writing—original draft, Z.D.; Investigation, Methodology and Formal analysis, Y.L.; Writing—review & editing, Supervision and Funding acquisition, Y.Q. All authors have read and agreed to the published version of the manuscript.

Funding

This research work was funded by the National Natural Science Foundation of China (grant no. 51706153).

Institutional Review Board Statement

Not applicable.

Informed Consent Statement

Not applicable.

Data Availability Statement

Data are available on request.

Conflicts of Interest

The authors declare no conflict of interest.

Abbreviations

FEMFinite Element Method
CFDComputational Fluid Dynamics
PEMFCProton Exchange Membrane Fuel Cell
CLCatalyst Layer
GDLGas Diffusion Layer
MEAMembrane Electrode Assembly
RHRelative Humidity
BPBipolar Plate
CCMCatalyst Coated Membrane
UDFsUser Defined Functions
EDCEffective Diffusion Coefficient

References

  1. Pollet, B.G.; Staffell, I.; Shang, J.L. Current status of hybrid, battery and fuel cell electric vehicles: From electrochemistry to market prospects. J. Electrochim. Acta 2012, 84, 235–249. [Google Scholar] [CrossRef]
  2. Pratt, J.W.; Klebanoff, L.E.; Munoz-Ramos, K.; Akhil, A.A.; Curgus, D.B.; Schenkman, B.L. Proton exchange membrane fuel cells for electrical power generation on-board commercial airplanes. Appl. Energy 2013, 101, 776–796. [Google Scholar] [CrossRef] [Green Version]
  3. Ouyang, M.; Xu, L.; Li, J.; Lu, L.; Gao, D.; Xie, Q. Performance comparison of two fuel cell hybrid buses with different powertrain and energy management strategies. J. Power Sources 2006, 163, 467–479. [Google Scholar] [CrossRef]
  4. Wang, Y.; Wang, X.; Fan, Y.; He, W.; Guan, J.; Wang, X. Numerical Investigation of Tapered Flow Field Configurations for Enhanced Polymer Electrolyte Membrane Fuel Cell Performance. Appl. Energy 2022, 306, 118021. [Google Scholar] [CrossRef]
  5. Wang, Y.; Xu, H.; Wang, X.; Qin, Y.; Xing, L. Multi-sub-inlets at cathode flow-field plate for current density homogenization and enhancement of PEM fuel cells in low relative humidity. Energy Convers. Manag. 2022, 252, 115069. [Google Scholar] [CrossRef]
  6. Tian, Y.D.; Zhu, X.J.; Cao, Y.Y. A study of modeling and control of proton exchange membrane fuel cell stack systems. Chin. J. Power Sources 2004, 28, 656–660. [Google Scholar]
  7. Su, A.; Ferng, Y.M.; Shih, J.C. CFD investigating the effects of different operating conditions on the performance the characteristics of a high-temperature, P.E.M.F.C. Energy 2010, 35, 16–27. [Google Scholar] [CrossRef]
  8. Choi, J.E.; Bae, Y.C. Swelling effect of a polymer electrolyte membrane on the development of a semi-empirical cell voltage model. J. Appl. Electrochem. 2009, 39, 1419–1424. [Google Scholar] [CrossRef]
  9. Toghyani, S.; Nafchi, F.M.; Afshari, E.; Hasanpour, K.; Baniasadi, E.; Atyabi, S.A. Thermal and electrochemical performance analysis of a proton exchange membrane fuel cell under assembly pressure on gas diffusion layer. Int. J. Hydrogen Energy 2018, 43, 4534–4545. [Google Scholar] [CrossRef]
  10. Zhang, Z.; He, P.; Dai, Y.J.; Jin, P.H.; Tao, W.Q. Study of the mechanical behavior of paper-type GDL in PEMFC based on microstructure morphology. Int. J. Hydrogen Energy 2020, 45, 29379–29394. [Google Scholar] [CrossRef]
  11. Li, W.Z.; Yang, W.W.; Zhang, W.Y.; Qu, Z.G.; He, Y.L. Three-dimensional modeling of a PEMFC with serpentine flow field incorporating the impacts of electrode inhomogeneous compression deformation. Int. J. Hydrogen Energy 2019, 44, 22194–22209. [Google Scholar] [CrossRef]
  12. Zhang, H.; Shen, P.K. A brief consideration about the structural evolution of perfluorosulfonic-acid ionomer membranes. Int. J. Hydrogen Energy 2012, 37, 4657–4664. [Google Scholar] [CrossRef]
  13. Woo, S.H.; Taguet, A.; Otazaghine, B.; Mosdale, A.; Rigacci, A.; Beauger, C. Physicochemical properties of Aquivion/fluorine grafted sepiolite electrolyte membranes for use in PEMFC. Electrochim. Acta 2019, 319, 933–946. [Google Scholar] [CrossRef]
  14. Zhong, D.; Lin, R.; Jiang, Z.; Zhu, Y.; Liu, D.; Cai, X.; Chen, L. Low temperature durability and consistency analysis of proton exchange membrane fuel cell stack based on comprehensive characterizations. Appl. Energy 2020, 264, 114626. [Google Scholar] [CrossRef]
  15. Yoon, W.; Huang, X. A multiphysics model of PEM fuel cell incorporating the cell compression effects. J. Electrochem. Soc. 2010, 157, B680–B690. [Google Scholar] [CrossRef]
  16. Li, Y.; Dillard, D.A.; Lai, Y.H.; Case, S.W.; Ellis, M.W.; Budinski, M.K.; Gittleman, C.S. Experimental measurement of stress and strain in Nafion membrane during hydration cycles. J. Electrochem. Soc. 2011, 159, B173–B184. [Google Scholar] [CrossRef]
  17. Khattra, N.S.; Karlsson, A.M.; Santare, M.H.; Walsh, P.; Busby, F.C. Effect of time-dependent material properties on the mechanical behavior of PFSA membranes subjected to humidity cycling. J. Power Sources 2012, 214, 365–376. [Google Scholar] [CrossRef] [Green Version]
  18. Khattra, N.S.; Santare, M.H.; Karlsson, A.M.; Schmiedel, T.; Busby, F.C. Effect of water transport on swelling and stresses in PFSA membranes. Fuel Cells 2015, 15, 178–188. [Google Scholar] [CrossRef]
  19. Kusoglu, A.; Karlsson, A.M.; Santare, M.H.; Cleghorn, S.; Johnson, W.B. Mechanical response of fuel cell membranes subjected to a hygro-thermal cycle. J. Power Sources 2006, 161, 987–996. [Google Scholar] [CrossRef] [Green Version]
  20. Taymaz, I.; Benli, M. Numerical study of assembly pressure effect on the performance of proton exchange membrane fuel cell. Energy 2010, 35, 2134–2140. [Google Scholar] [CrossRef]
  21. Jiao, K.; Li, X. A three-dimensional non-isothermal model of high temperature proton exchange membrane fuel cells with phosphoric acid doped polybenzimidazole membranes. Fuel Cells 2010, 10, 351–362. [Google Scholar] [CrossRef]
  22. Lu, Z.; Lugo, M.; Santare, M.H.; Karlsson, A.M.; Busby, F.C.; Walsh, P. An experimental investigation of strain rate, temperature and humidity effects on the mechanical behavior of a perfluorosulfonic acid membrane. J. Power Sources 2012, 214, 130–136. [Google Scholar] [CrossRef] [Green Version]
  23. Zhang, G.B.; Fan, L.H.; Sun, J.; Jiao, K. A 3D model of PEMFC considering detailed multiphase flow and anisotropi transport properties. Int. J. Heat Mass Transf. 2017, 115, 714e24. [Google Scholar] [CrossRef]
  24. Yin, Y.; Wang, J.; Yang, X.; Du, Q.; Fang, J.H.; Jiao, K. Modeling of high temperature proton exchange membrane fuel cells with novel sulfonated polybenzimidazole membranes. Int. J. Hydrogen Energy 2014, 39, 13671e80. [Google Scholar] [CrossRef]
  25. Wang, X.; Qin, Y.; Wu, S.; Shangguan, X.; Zhang, J.; Yin, Y. Numerical and experimental investigation of baffle plate arrangement on proton exchange membrane fuel cell performance. J. Power Sources 2020, 457, 228034. [Google Scholar] [CrossRef]
  26. Yin, Y.; Wang, X.; Shangguan, X.; Zhang, J.; Qin, Y. Numerical investigation on the characteristics of mass transport and performance of PEMFC with baffle plates installed in the flow channel. Int. J. Hydrogen Energy 2018, 43, 8048–8062. [Google Scholar] [CrossRef]
  27. Yin, Y.; Wang, X.; Zhang, J.; Shangguan, X.; Qin, Y. Influence of sloping baffle plates on the mass transport and performance of PEMFC. Int. J. Energy Res. 2019, 43, 2643–2655. [Google Scholar] [CrossRef]
Figure 1. Computational domain of the FEM model.
Energies 15 05319 g001
Figure 2. True stress–true strain curves of CCM and membranes at 5/min tensile rate.
Energies 15 05319 g002
Figure 3. Computational domain of the CFD model.
Energies 15 05319 g003
Figure 4. Deformations of the MEA in the Base case*, Case 1* and Case 2*.
Energies 15 05319 g004
Figure 5. Equivalent stress distribution of the membrane in Case 1* and Case 2*.
Energies 15 05319 g005
Figure 6. Distribution of oxygen mass fraction in the cathode channel cross sectional plane near the cathode inlet (z = 5 mm) when the operating voltage is 0.6 V in the Base case*, Case 1* and Case 2*.
Energies 15 05319 g006
Figure 7. Distribution of oxygen mass fraction at the interface of cathode GDL and CL when the operating voltage is 0.6 V in the Base case*, Case 1* and Case 2*.
Energies 15 05319 g007
Figure 8. Distribution of liquid water volume fraction in the cathode channel cross-sectional plane near when the operating voltage is 0.6 V in the Base case*, Case 1* and Case 2*.
Energies 15 05319 g008
Figure 9. Comparison of the polarization curves for the Base case*, Case 1* and Case 2*.
Energies 15 05319 g009
Figure 10. Deformation and equivalent stress distribution of membrane with water content of 9, 12 and 15, corresponding to Case 4*, Case 3* and Case 2* shown in Table 1, respectively.
Energies 15 05319 g010
Figure 11. Distribution of oxygen mass fraction in the cathode channel cross sectional plane near the cathode inlet (z = 5 mm) when the operating voltage is 0.6 V in Case 2*, Case 3* and Case 4*.
Energies 15 05319 g011
Figure 12. Distribution of the volume fraction distribution of liquid water in the cathode channel cross sectional plane near the cathode inlet (z = 5 mm) when the operating voltage is 0.6 V in Case 2*, Case 3* and Case 4*.
Energies 15 05319 g012
Figure 13. Distribution of effective diffusion coefficient (EDC) of oxygen in the GDL under different water contents in Case 2*, Case3* and Case 4*: (a) under the channel; (b) under the rib.
Energies 15 05319 g013
Figure 14. Comparison of the polarization curves in Case 2*, Case 3* and Case 4*.
Energies 15 05319 g014
Table 1. Water content and linear strain of the membrane tested at 80 °C.
Time (min)05102030
Parameters
Water content λ00.042740.050850.051730.05128
Linear strain00.051280.060500.067740.06838
Table 2. Operating conditions and material or physical properties of PEMFC of the CFD model.
ParametersValuesUnits
Anode inlet temperature353.15K
Cathode inlet temperature353.15K
Anode inlet pressure101,325Pa
Cathode inlet pressure101,325Pa
Working voltage0.6V
Anode inlet relative humidity100%
Cathode inlet relative humidity100%
Anode stoichiometric ratio1.5
Cathode stoichiometric ratio3.0
Faraday’s constant96,487C mol−1
Universal gas constant8.314J mol−1 K−1
Porosity of GDL0.6
Porosity of CL0.3
Equivalent weight of dry membrane1100kg kmol−1
Table 3. Simulation cases.
CasesBase Case*Case 1*Case 2*Case 3*Case 4*
Assembly pressure (MPa)01111
Water content λ15129
Publisher’s Note: MDPI stays neutral with regard to jurisdictional claims in published maps and institutional affiliations.

